
Abstract
Objective
Hemoconcentration may influence peritoneal permeability parameters in anesthetized animals without fluid supplementation. Therefore, the aim of this study was to investigate the effects of fluid supplementation on peritoneal permeability in an acute peritoneal dialysis model in anesthetized rats.
Design
To study the effect of fluid supplementation on peritoneal permeability characteristics, 24 anesthetized male Wistar rats were investigated in 3 groups during a 4-hour standardized peritoneal permeability analysis with a 3.86% glucose dialysis solution (SPARa). The groups included a control group with no fluid supplementation (None, n = 8), a group with continuous subcutaneous infusion of 0.9% NaCl 3 mL/hr (SC, n = 9), and a group with continuous intravenous infusion of 0.9% NaCl 3 mL/hr (IV, n = 7). Inflow, sampling, and outflow of the dialysate during the SPARa occurred via a cannula inserted intraperitoneally in the lower left quadrant of the abdomen. Blood was drawn at the end of the dwell. Baseline blood samples were obtained from six separate untreated rats.
Results
Plasma osmolality was significantly lower in the IV group (334 ± 1.4 mOsm/kg) compared to the None group (348 ± 0.7 mOsm/kg, p < 0.01), and not different from the SC group (335 ± 6.4 mOsm/kg), but higher than baseline (314 ± 5.3 mOsm/kg, p < 0.001). Urine production during the dwell was not different among the groups: None 10.6 ± 5.3 mL; SC 8.0 ± 6.0 mL; and IV 10.5 ± 5.6 mL. Transcapillary ultrafiltration after 4 hours was significantly higher in the IV group (p < 0.05) compared to the other two groups. Net ultrafiltration and effective lymphatic absorption were similar in all groups. Mass transfer area coefficient of urea (MTACurea) was significantly greater in the IV group (155 ± 23.2 μL/minute, p < 0.003), but not different between the None (118 ± 16.2 μL/min) and SC (123 ± 25.9 μL/min) groups. Correcting these for the baseline plasma concentration resulted in higher values, but the IV data remained greater than the SC and None groups (p < 0.01). The glucose absorption, albumin, and IgG clearances and the sieving of sodium were alike in all groups.
Conclusion
It can be concluded that IV fluid supplementation is more effective in preventing dehydration than SC supplementation, and it enhanced some peritoneal permeability characteristics in anesthetized rats during a 4-hour investigation. It is therefore important to standardize fluid supplementation in experiments with anesthetized animals.
Therefore, the aim of this study was to investigate the effects of fluid supplementation on peritoneal permeability in an acute peritoneal dialysis model in anesthetized rats. The peritoneal transport parameters were studied without normal saline supplementation during a 4-hour dwell and with supplementation either subcutaneously or intravenously.
Methods
Animals
Twenty-four male Wistar rats (Harlan CBP, Zeist, The Netherlands) were randomly divided into three groups. The group without fluid supplementation (None group) during the standardized peritoneal permeability analysis adapted for rats (SPARa) contained eight rats. Eight other rats were placed in the group with continuous subcutaneous infusion of 3 mL 0.9% NaCl/hour during the SPARa (SC group). Every 30 minutes, the SC infusion needle was shifted to another location on the flanks or back of the rat. The last eight rats were investigated during continuous intravenous infusion of 3 mL 0.9% NaCl/hour in a tail blood vessel (IV group). One rat was shifted from the IV to the SC supplemented group 30 minutes after the start of the SPARa because of a malfunctioning IV needle. Consequently, the final SC group contained nine rats and the IV group seven. The normal saline solution was preheated to 37°C for both supplemented groups. The fluid supplementation, both IV and SC, was initiated as soon as the rats were anesthetized. All rats were anesthetized by intramuscular administration, in a hind leg, of a mixture of ketamine, xylazine, and atropine (8 mg, 4 mg, 5 mg per 100 g body weight). The animals were placed on a 37°C heating pad during the SPARa.
Standard Peritoneal Permeability Analysis in the Rat (Spara)
The SPARa is a modification of the human standard peritoneal permeability analysis (SPA) described by Pannekeet et al. (7). The SPARa was performed during a 4-hour dwell with 30 mL 3.86% glucose-based dialysis solution preheated to 37°C. Dextran 70, 5 g/L (Hyskon, Medisan Pharmaceuticals AB, Uppsala, Sweden), was added to the test solution as a volume marker for the calculation of fluid kinetics (8). The procedure includes a rinsing step of the peritoneal cavity with 30 mL 3.86% glucose dialysis solution prior to the test to avoid possible effects of a residual volume present before the onset of the analysis. Directly after drainage of the 4-hour effluent, another rinsing step was performed with 20 mL 1.36% glucose-based dialysis solution to calculate the residual volume in the peritoneal cavity. Both rinsing solutions were preheated to 37°C. Dialysate samples were taken before instillation of the test solution and 10, 30, 60, 120, 180, and 240 minutes after completion of inflow. Inflow, sampling, and outflow of the dialysate during the SPARa occurred via an intravenous infusion needle with a polyvinyl chloride (PVC) sheath, which was inserted intraperitoneally, laterally in the left lower quadrant of the abdomen. One milliliter was obtained for each intermediate sample using a 1-mL syringe which was flushed three times to avoid dead space effect. Outflow at the end of the dwell and after both rinsing steps was accomplished through this cannula by gravity. Blood was obtained by heart puncture at the end of the experiment; the rats were then sacrificed. Preweighed gauzes were used to absorb the urine during the dwell and weighed afterward to estimate urine production. The animals were anesthetized during the whole SPARa procedure. Baseline plasma values were obtained separately in six untreated rats by heart puncture under CO2 anesthesia. The protocol was approved by the Committee of Animal Experiments of the University of Amsterdam.
Assays
Total dextran 70 was measured in all dialysate samples by high performance liquid chromatography (9). In both plasma and effluent, urea (Hitachi H747, Boehringer Mannheim, Mannheim, Germany) was measured with an enzymatic method. Glucose concentration was assessed by a glucose oxidase–peroxidase assay (SMA II, Technicon, Terrytown, NJ, U.S.A.). Sodium was measured by an ion-selective electrode (Hitachi H747). Total protein in plasma was determined by spectrophotometry using biurette methodology (Roche, Almere, The Netherlands) using an automated analyzer (Hitachi 747). Plasma osmolality was assessed by a freeze point reduction method using an automated analyzer (EBMC, Kerkdriel, The Netherlands). Albumin concentrations were determined by the bromocresol green method. IgG was measured with a peroxidase sandwich enzyme-linked immunoassay (ELISA). ELISA plates (Maxisorp immunoplate, NUNC, Roskilde, Denmark) were coated with goat antirat IgG (Nordic Immunology, Tilburg, The Netherlands). Horseradish peroxidase-labeled goat antirat IgG (H+L) (Nordic Immunology) was applied as conjugate, and o-phenylenediamine dihydrochloride (Sigma, St Louis, MO, U.S.A.) as substrate. Absorbance was read at 490 nm against a buffer blank, and ion exchange and gel filtration chromatography purified rat IgG (Sigma Aldrich Chemie BV, Zwijndrecht, The Netherlands) was used as a standard.
Calculations
For a detailed description of peritoneal physiology, the reader is referred to two recent reviews (10,11). Peritoneal fluid and solute kinetics were calculated as described previously (7,8). In brief, transcapillary ultrafiltration increases intraperitoneal volume, and fluid loss from the peritoneal cavity is assumed to occur by transcapillary back filtration and uptake into the lymphatic system. The resultant of these is the net ultrafiltration. Transcapillary ultrafiltration was calculated from the dilution of the volume marker, dextran 70. The convective disappearance of the volume marker from the peritoneal cavity can be used as an indirect method to estimate the contribution of the peritoneal lymphatics in the absorption of fluid from the peritoneal cavity (12). These calculations of effective lymphatic absorption include all pathways of uptake into the lymphatic system, both interstitial and subdiaphragmatic. The change in intraperitoneal volume during the dwell can be calculated from the dilution of the volume marker after correction for incomplete recovery. The net ultrafiltration is the difference between transcapillary ultrafiltration and effective lymphatic absorption.
The mass transfer area coefficient (MTAC, which is the maximal theoretical clearance by diffusion at time zero) of urea was calculated according to the model of Waniewski et al. (13). This model corrects for convective transport with the application of a correction factor, F = 0.5. The plasma urea concentration used in this model was expressed per volume of plasma water (14). The following equation was applied:
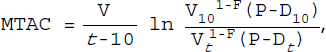
in which V10 (mL) represents the intraperitoneal volume, and D10 (mmol/L) the dialysate concentration of urea at t = 10 minutes, V t and D t represent these parameters at t = 240 minutes; P is the plasma concentration of urea at the end of the dwell; V is the mean intraperitoneal volume calculated as the area-under-the-intraperitoneal-volume-versus-time curve, divided by the dwell time. The area under the curve is determined with the application of the trapezium rule (15). To correct the MTACs for changing plasma concentrations of urea during the dwell, baseline plasma urea concentrations were averaged and applied as P0 in the MTAC equation in which the plasma urea concentration P is (P0+P)/2 in each experimental animal.
Glucose absorption was estimated as the difference between the instilled and the recovered amount of glucose, relative to the instilled quantity of glucose. The peritoneal clearances of albumin and IgG were determined according to the equation Cl(μL/min) = (D*V)/(P*t), in which Cl represents the clearance, D is the dialysate concentration at the end of the dwell, V is the dialysate volume at the end of the dwell, P is the plasma concentration, and t is the duration of the dwell. The size selectivity or intrinsic permeability of the peritoneum was expressed as the IgG/ albumin clearance ratio. Aquaporin-mediated water transport was estimated by the sieving of sodium, expressed as the lowest D/P ratio of sodium during the dwell (16,17).
Clinical Data and Laboratory Investigations
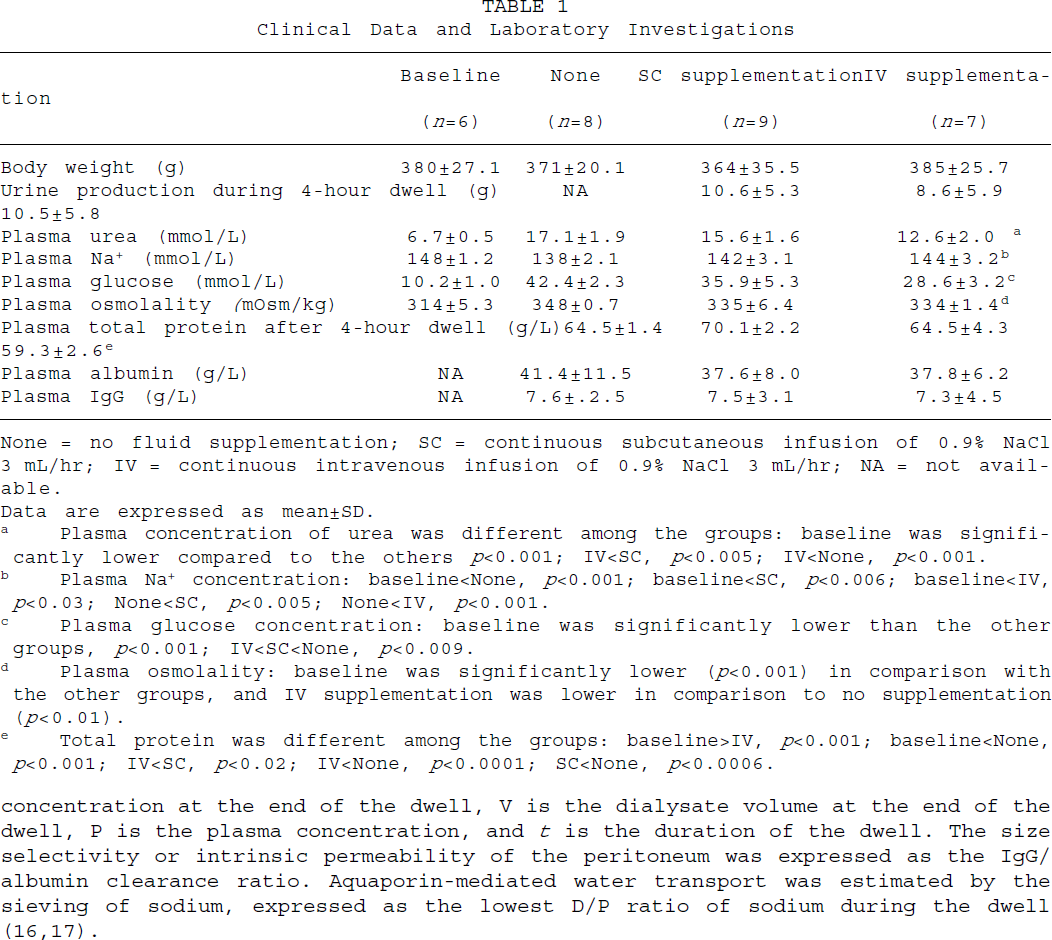
None = no fluid supplementation; SC = continuous subcutaneous infusion of 0.9% NaCl 3 mL/hr; IV = continuous intravenous infusion of 0.9% NaCl 3 mL/hr; NA = not available.
Data are expressed as mean±SD.
Plasma concentration of urea was different among the groups: baseline was significantly lower compared to the others p<0.001; IV<SC, p<0.005; IV<None, p<0.001.
Plasma Na+ concentration: baseline<None, p<0.001; baseline<SC, p<0.006; baseline<IV, p<0.03; None<SC, p<0.005; None<IV, p<0.001.
Plasma glucose concentration: baseline was significantly lower than the other groups, p<0.001; IV<SC<None, p<0.009.
Plasma osmolality: baseline was significantly lower (p<0.001) in comparison with the other groups, and IV supplementation was lower in comparison to no supplementation (p<0.01).
Total protein was different among the groups: baseline>IV, p<0.001; baseline<None, p<0.001; IV<SC, p<0.02; IV<None, p<0.0001; SC<None, p<0.0006.
Statistical Analysis
Means and standard deviations are presented unless stated otherwise. One-way analysis of variance (ANOVA) was performed to compare the results of the three investigated groups. When ANOVA showed a significant difference among the groups, a modified t-test with a Bonferroni correction for multiple comparisons was used to investigate the differences between the groups.
Results
The clinical data and the laboratory investigations are presented in Table 1. Urine production was not affected by the presence or absence of fluid supplementation and/or its route of administration during the SPARa. The concentrations of urea, glucose, and total protein in plasma were significantly lower in the group with IV saline administration compared to the other two groups, but that of Na+ was higher (Table 1). Nevertheless, the plasma osmolality was lowest in the IV group but still significantly higher than at baseline (p < 0.001).
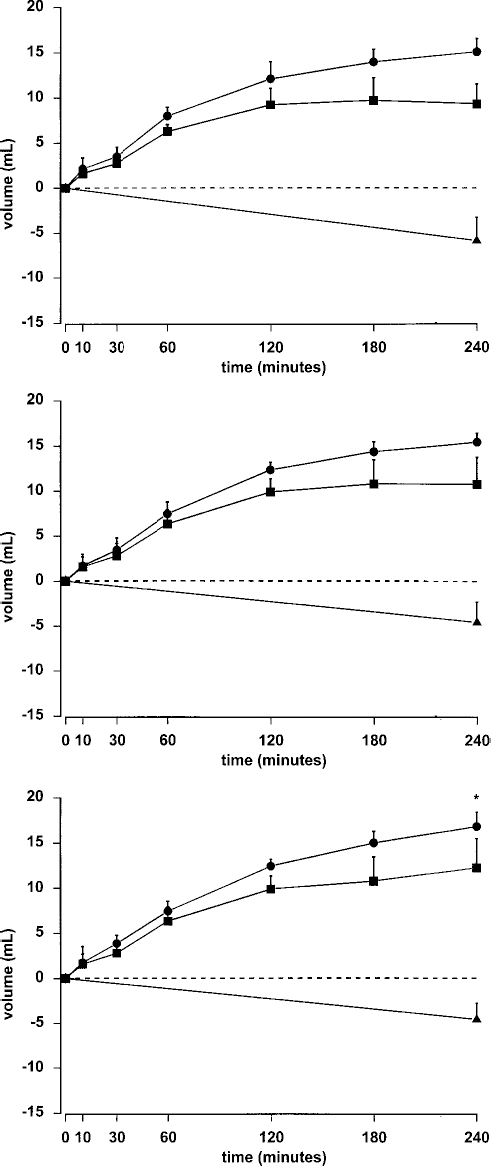
The time courses of transcapillary ultrafiltration (closed circles), effective lymphatic absorption (closed triangles), and the resulting change in intraperitoneal volume (closed squares) in the None group (upper), SC group (middle), and IV group (lower panel). None = no fluid supplementation; SC = continuous subcutaneous infusion of 0.9% NaCl 3 mL/hr; IV = continuous intravenous infusion of 0.9% NaCl 3 mL/hr.
The time courses of the transcapillary ultrafiltration, effective lymphatic absorption, and the resulting change in intraperitoneal volume were determined in each animal. The fluid profiles of each group are shown in Figure 1. The transcapillary ultrafiltration after 4 hours was significantly greater in the IV group (p < 0.05), but was not different between the other two groups. Net ultrafiltration and effective lymphatic absorption were similar in all three groups. The sieving of sodium, used as an estimate of aquaporin-mediated water transport, was not different among the three groups (Table 2).
Parameters of peritoneal solute permeability are summarized in Table 2. A significantly greater MTACurea was found in the IV group (p < 0.003) compared with the other groups. Correcting the MTACurea for the change in plasma concentration during the dwell resulted in significantly higher values in all groups (p < 0.001): IV 155 ± 23.2 μL/min to 324 ± 56.7 μL/min, SC 118 ± 16.2 μL/min to 235 ± 47.5 μL/min, and None 123 ± 25.9 μL/min to 275 ± 85.1 μL/min. After correction, the MTACurea in the IV group remained significantly higher than that obtained in the other groups after correction. Glucose absorption was similar in all groups. Also, the clearances of the macromolecules albumin and IgG were alike. The size selectivity to macromolecules, assessed as the IgG/albumin ratio, was not different.
Discussion
An acute peritoneal dialysis model in the rat with normal kidney function was used to investigate the effect of fluid supplementation, and its modality, on peritoneal permeability characteristics during a 4-hour standardized peritoneal permeability analysis. The magnitude of the continuous supplementation of normal saline used in this study, administered either intravenously or subcutaneously, was based on the volume of net ultrafiltration (9.3 ± 2.0 mL/4 hr) determined during SPARa performed under similar conditions without fluid supplementation (unpublished observations). We found significant differences only in the peritoneal permeability characteristics after IV fluid supplementation in comparison with the nonsupplemented rats and the animals with SC fluid administration. Therefore, the reported 1 – 2 mL normal saline/hr administered subcutaneously (6,18) or intravenously (5) might be insufficient for prevention of hemoconcentration or hypovolemia during a 4-hour dwell in anesthetized rats.
Solute Permeability Parameters
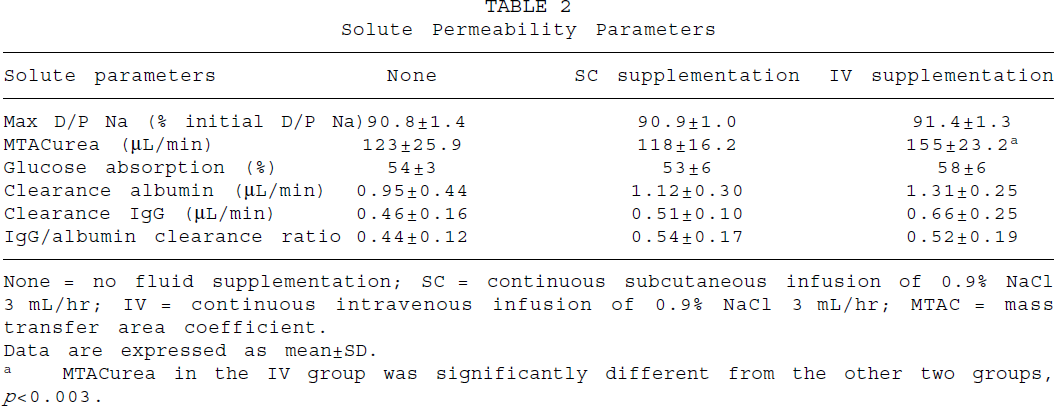
None = no fluid supplementation; SC = continuous subcutaneous infusion of 0.9% NaCl 3 mL/hr; IV = continuous intravenous infusion of 0.9% NaCl 3 mL/hr; MTAC = mass transfer area coefficient.
Data are expressed as mean±SD.
MTACurea in the IV group was significantly different from the other two groups, p<0.003.
We found a significantly higher transcapillary ultrafiltration after 4 hours in the IV group; it was not different between the other two test groups. The greater transcapillary ultrafiltration at the end of the dwell in the IV group can be explained by the effect of a more pronounced hemoconcentration in the other two groups, due possibly to a change in the transcapillary pressure gradient. This pressure gradient is composed of the crystalloid pressure gradient and the hydrostatic pressure gradient, minus the colloid osmotic pressure gradient (19). The hydrostatic pressure gradient is assumed to be stable during a 4-hour dwell in conscious patients (20). It is likely that, in anesthetized rats independent from fluid supplementation, this gradient also remains stable during the dwell because of blood flow regulation by precapillary sphincters in the splanchnic circulation. Comparing the IV group with animals without supplementation showed that the mean difference in plasma osmolality between the two groups was 14 mOsm/kg H2O. The difference was 7 mOsm/L when osmolarity was calculated from the Na+, glucose, and urea concentrations. One milliosmole exerts an osmotic pressure of 19.3 mmHg if the reflection coefficient of a solute to a membrane equals 1.0. Assuming an overall peritoneal reflection coefficient for low molecular weight solutes of 0.03 (21), the difference in the plasma crystalloid osmotic pressure between the two groups would be either 8 or 4 mmHg. This implies that the crystalloid osmotic pressure gradient across the peritoneum is 4 – 8 mmHg higher in the IV group. The colloid osmotic pressure gradient can be estimated from the plasma albumin concentration by applying the equation 0.38(Palbumin) + 7.72 (19). This results in a 1.5 mmHg higher colloid osmotic pressure gradient in the None supplemented rats, promoting more back filtration in these animals compared to the IV group. The total osmotic pressure gradient across the peritoneum is the sum of the crystalloid and the osmotic pressure gradients. The total osmotic pressure gradient, inducing the transcapillary filtration of fluid from the circulation to the peritoneal cavity, was therefore 5 – 10 mmHg higher in the IV group than in the rats without supplementation, resulting in a greater transcapillary ultrafiltration in the IV group. This was not reflected by a difference in the net ultrafiltration because this parameter is also dependent on effective lymphatic absorption (10,22).
The higher plasma concentrations of solutes and the higher osmolality in the group without fluid supplementation in comparison with the other groups suggests that these parameters, obtained at the end of the SPARa dwell, will have been lower in the beginning of the investigation. This was supported by the baseline values obtained separately in untreated rats. This could explain the lower MTACurea found in the nonsupplemented animals compared to the IV rats, in which the end plasma concentration is more likely to represent a steady state. The basis of the MTAC calculation is the (P – D10)/(P – D t ) ratio. The effect of an overestimation of P is especially important in the denominator, because of the small differences between P and D t . An overestimation of P – D t will result in a smaller ratio and therefore in a lower MTAC. This is the most probable explanation for the higher MTACurea in the IV supplemented rats. However, correcting the MTACurea determination by averaging the plasma urea and total protein data with baseline values did not resolve the discrepancy completely. This is most likely caused by the use of pooled baseline values instead of individual plasma determinations before the dwell in each animal. Therefore, the results indicate that, in this kind of experimental peritoneal permeability study, blood samples should be obtained at the beginning and at the end of the experiment because the plasma concentrations are not stable during the dwell.
The animals were hyperglycemic at the end of the SPARa: 28.6 – 42.4 mmol/L in the experimental groups, compared to the baseline plasma glucose value of 10.2 mmol/L). This was most likely caused by the dehydration of the rats during the experiment (23), accompanied by the effect of anesthesia (24). The finding that glucose absorption was not different among the three groups suggests that dehydration or fluid supplementation had no effect on the peritoneal vascular surface area. The similar values for peritoneal size-selectivity also argue against an effect of dehydration on peritoneal permeability.
It can be concluded that the effects of fluid supplementation during peritoneal permeability studies in anesthetized rats are generally minimal. When it is used, 3 mL/ hr normal saline should be administered intravenously. Subcutaneous supplementation of the same quantity is easier to apply, but insufficient. It is, however, most important that the conditions of the experiments are standardized, also with respect to the use and route of the fluid supplementation.
Footnotes
Acknowledgments
The authors thank Dirk R. de Waard, Johan K. Hiralall, and Anton B. van der Wardt for their excellent technical assistance.
This work was supported by a grant from the Dutch Kidney Foundation (Nierstichting Nederland, grant C95.5009).