
Abstract
Background
Fluid and sodium balance is important for the success of long-term peritoneal dialysis. Convective transport is the major determinant for sodium removal during peritoneal dialysis using conventional dialysis solutions. However, recent studies showed that lower sodium concentration in dialysate could significantly increase sodium removal by increasing the diffusion gradient, thereby increasing diffusive transport. In the present study, we investigated the influence of the sodium concentration gradient on the diffusive transport coefficient, KBD for sodium.
Methods
A 4-hour dwell study was done in Sprague–Dawley rats using 25 mL 5% glucose (NS), 5% glucose + 0.3% NaCl (LS), 5% glucose + 0.6% NaCl (MS), or 5% glucose + 0.9% NaCl (HS), with frequent dialysate and blood sampling. Radiolabeled human albumin (RISA) was added to the solution as an intraperitoneal volume marker. The peritoneal fluid and sodium transport characteristics were evaluated.
Results
Significant ultrafiltration (both net ultrafiltration and transcapillary ultrafiltration) was observed in each group despite the osmolality of the 5% glucose solution being slightly lower than the plasma osmolality. There was no difference in peritoneal fluid absorption rate and direct lymphatic absorption among the four groups. With the sieving coefficient for sodium set to 0.55, a significantly higher KBD for sodium was found in the NS compared to the HS group. The KBD for sodium was 0.21 ± 0.01, 0.20 ± 0.01, 0.17 ± 0.01, and 0.09 ± 0.01 mL/min for the NS, LS, MS, and HS groups, respectively. The KBD values for glucose were significantly lower in the NS and LS groups compared to the MS and HS groups.
Conclusions
Our results suggest that (1) sodium concentration may affect peritoneal sodium KBD — as the sodium concentration gradient increased, the KBD decreased; (2) 5% glucose solution could induce significant peritoneal ultrafiltration in normal rats despite its initial hypo-osmotic nature, this was due to the significantly lower glucose transport rate than sodium transport rate; and (3) a lower dialysate sodium concentration may decrease peritoneal glucose absorption.
During PD, sodium is transported by diffusion (due to the concentration gradient between blood and dialysate), by convection (due to ultrafiltration), and by peritoneal absorption (5,6). The impact of these transport components on net sodium removal may differ substantially between different solutions, different dwell times, etc. (6). Ultrafiltration-induced convective transport is believed to be the most important process for sodium removal using conventional glucose dialysis solution. However, recent studies suggest that PD solutions with low sodium concentration may be more effective for the removal of excess sodium than a conventional PD solution (7,8) and may improve the control of blood pressure, especially in patients with high sodium intake (7,9,10). The increased removal of sodium using low sodium solution was supposed to be caused mainly by increased diffusive transport of sodium due to an increased sodium concentration gradient (7,8,10). It is not known whether lowering the sodium concentration in dialysate may also affect the sodium diffusive mass transport coefficient (KBD).
It was recently found that the KBD values for small solutes might vary with dwell time; KBD values are higher in the beginning of the dwell when the solute concentration gradients are high (11). Although several mechanisms have been proposed to account for this phenomenon (12), the impact of the sodium concentration gradient on KBD has not been extensively studied. It is interesting to note that the KBD value for sodium does not vary significantly with the dwell time, due possibly to changes in sodium concentration gradient during the dwell with conventional solution being rather small (13). Furthermore, it is a general finding that the KBD for sodium is significantly lower compared to the KBD values for urea and glucose, despite the low molecular weight of sodium (7,8,14). However, Knochel found that peritoneal transport of sodium in rats might be as fast as the transport of urea if the dialysis solution contained no sodium (15). Therefore, in the present study, we tried to investigate the impact of dialysis sodium concentrations on sodium transport. We also investigated peritoneal fluid and glucose transport with various dialysate sodium concentrations.
Methods
Thirty-two male Sprague–Dawley rats with an average body weight of 300 g were divided into four groups with eight rats in each group. A 4-hour dwell study modified from our previous studies (16) was performed in each rat. Briefly, each rat was anesthetized initially with a single intramuscular injection of 50 mg/kg pentobarbital sodium. After 2 hours, the rat was given 25 mg/kg pure pentobarbital sodium subcutaneously every hour to maintain the intensity of anesthesia during the experiment. The fur over the abdominal wall was closely shaved. The animal was laid in a supine position and kept at 37°C with a heating pad (CMA/Microdialysis, Stockholm, Sweden). Isotonic saline, 2 mL/hour, was injected subcutaneously to prevent hypovolemia. A multiholed Silastic catheter (Venoflon, 0.8-mm internal diameter, Helsingborg, Sweden) was inserted percutaneously in the left lower quadrant of the abdomen for dialysis fluid infusion and sampling. Then, 25 mL of 5% glucose solution (NS group), 5% glucose solution + 0.3% NaCl (LS group, sodium concentration of 51 mmol/L), 5% glucose solution + 0.6% NaCl (MS group, sodium concentration of 103 mmol/L), or 5% glucose solution + 0.9% NaCl (HS group, sodium concentration of 154 mmol/L) was infused to the peritoneal cavity via a three-way valve (Viggo, Connecta, Helsingborg, Sweden) connected to the end of a 0.8-mm catheter. The solutions were prewarmed to 37°C and contained 18.5 KBq 131I-human serum albumin (RISA) (Isopharma AS, Kjeller, Norway). A priming dose of 0.2 g/L human serum albumin was added to the solution to minimize the adhesion of tagged albumin to the surface of the catheter. After infusion, the dialysis solutions were allowed to remain in the peritoneal cavity for 4 hours. Dialysate samples (0.35 mL) were taken at 0, 3, 15, 30, 60, 90, 120, 180, and 240 minutes post infusion. Prior to each sampling, 1 mL of the dialysate was flushed back and forth five times through the catheter. Blood samples were drawn at 0, 120, and 240 minutes from the tail artery. After 240 minutes, the peritoneal cavity was opened and the dialysate was collected using a syringe and preweighed gauze tissues, and the volume was recorded. The experimental study was approved by the Animal Ethical Committee of the Karolinska Institute at Huddinge Hospital.
Dialysate samples (0.1 mL) and blood samples (0.1 mL plasma) were analyzed for RISA activity on a Gamma Counter (Packard Instrument Company, Meriden, CT, U.S.A.) for 10 minutes each. Dialysate and plasma glucose concentrations (hexokinase method) were analyzed using a Monarch 1000 auto analyzer (Instrumentation Laboratory, Lexington, MA, U.S.A.). Dialysate and plasma sodium concentrations were analyzed using a flame photometer (Instrumentation Laboratory). Dialysate (DOS) and blood osmolality were measured by a Vapro vapor pressure osmometer 5520 (Wescor, Logan, UT, U.S.A.).
Intraperitoneal dialysate volume was estimated from the dilution of RISA with corrections made for the elimination of RISA from the peritoneal cavity and the sample volume (17). Note that the intraperitoneal volume at the end of the dwell was directly measured. The peritoneal fluid absorption rate was estimated as the coefficient of RISA elimination from the peritoneal cavity (KE, mL/min), and the transcapillary ultra-filtration rate was calculated as net volume change plus KE. Since only a very small amount of free iodine was found in the RISA solution (18), we did not take the free iodine into account in the KE calculation.
The direct lymphatic absorption of fluid from the peritoneal cavity was assessed as the clearance of RISA from the dialysate to the blood (KEB, mL/min), which was calculated from the rate of increase of RISA in plasma divided by the average intraperitoneal RISA concentration (19). The plasma volume was set at 3.6 mL/100 g body weight (19,20). The KEB values were also corrected for the RISA “spill over” from plasma to the body interstitium during the dwell using the constant 0.0018/minute as described previously (20).
The dialysate-over-plasma sodium concentration ratios (D/P) were calculated by dividing the dialysate sodium concentration at a certain time by the aqueous sodium concentrations in plasma (21). If no blood sample was taken at the same time as a dialysate sample then the blood sodium concentration was linearly interpolated from the blood sample taken before and after this moment (22). The D/D0 for glucose was calculated as the dialysate glucose concentration (D) divided by the glucose concentration in the fresh dialysis solution (D0). The diffusive mass transport coefficients (KBD, mL/min) were estimated using the modified Babb–Randerson–Farrell (BRF) model, as described previously (14,23), using the computer program PERTRAN (Baxter Novum, Karolinska Institute, Stockholm, Sweden). The model describes the net change of the solute amount in peritoneal dialysate over time increments equal to the rate of solute flow between blood and dialysate due to combined diffusion, convective transport, and peritoneal absorption of the solute. In addition, in this study we set the sieving coefficients (S) for glucose and sodium to be 0.55 (11,16). The clearance of sodium was calculated as the total amount of sodium in the dialysate minus the infused amount, and divided by mean blood sodium concentration and dwell time.
Two-way ANOVA with repeated measurements and one-way ANOVA were applied to compare intraperitoneal volume, KE, KEB, D/P ratio, KBD, and clearance. When ANOVA showed a significant difference among the four groups, then Fisher's post hoc test was used to compare the difference between different groups. The results are expressed as mean ± SD. A p value of less than 0.05 was considered significant.
Results
Fluid Transport
The intraperitoneal volume was significantly higher in the high sodium groups compared to the low sodium groups (ANOVA repeated measurement, all p < 0.01, Figure 1). There were no significant differences in the peritoneal fluid absorption rate (as assessed by the RISA elimination rate, KE) and direct peritoneal lymphatic absorption rate (as assessed by the RISA appearance rate in blood, KEB) among the four groups (Table 1). Therefore, the higher intraperitoneal volumes in the high sodium concentration groups were due mainly to a higher transcapillary ultrafiltration rate in these groups (Table 1).
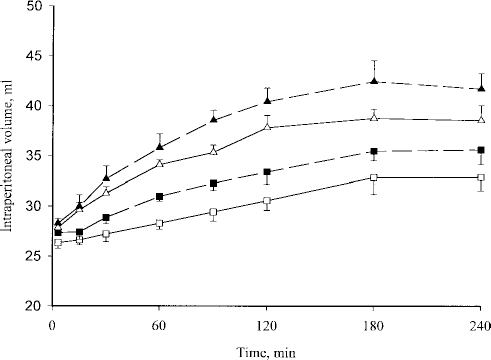
Intraperitoneal volume versus time (mean ± SD). NS = 5% glucose solution group (n=8) (open squares); LS = 5% glucose solution + 0.3% NaCl group (n=8) (closed squares); MS = 5% glucose solution + 0.6% NaCl group (n=8) (open triangles); HS = 5% glucose solution + 0.9% NaCl (n=8) (closed triangles).
Fluid and Solute Transport Characteristics Among Four Groups (Mean±SD)
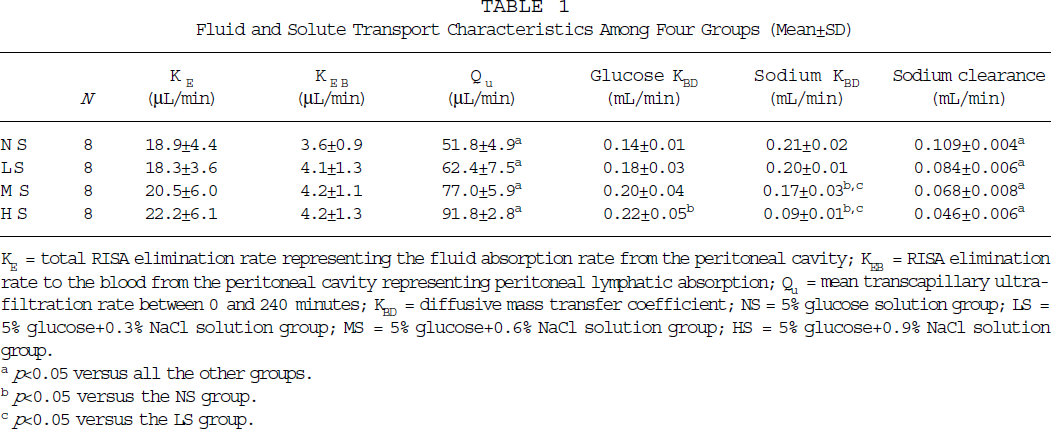
KE = total RISA elimination rate representing the fluid absorption rate from the peritoneal cavity; KEB = RISA elimination rate to the blood from the peritoneal cavity representing peritoneal lymphatic absorption; Qu = mean transcapillary ultra-filtration rate between 0 and 240 minutes; KBD = diffusive mass transfer coefficient; NS = 5% glucose solution group; LS = 5% glucose+0.3% NaCl solution group; MS = 5% glucose+0.6% NaCl solution group; HS = 5% glucose+0.9% NaCl solution group.
p<0.05 versus all the other groups.
p<0.05 versus the NS group.
p<0.05 versus the LS group.
Glucose Transport and Osmolality Changes
The dialysate glucose concentration (and the D/D0 of glucose) was significantly lower in the HS group compared to the NS group (Figure 2, both p < 0.01, ANOVA repeated measurements), whereas no significant difference was found between the other groups. The diffusive mass transport coefficients (KBD) for glucose were significantly higher in the HS group compared to the NS group. KBD did not differ significantly between the other groups, although increasing the dialysate sodium concentration tended to increase the glucose KBD values (Table 1). Dialysate osmolality was significantly higher in the higher dialysate sodium concentration groups compared to the lower dialysate sodium concentration groups (Figure 3, all p < 0.05).
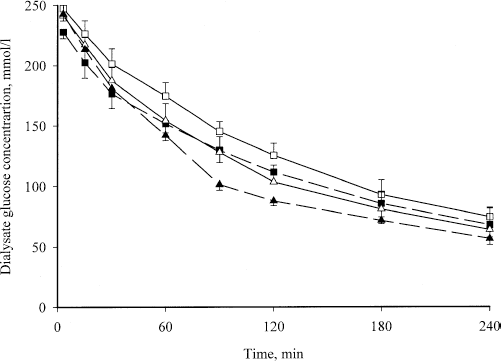
Dialysate glucose concentration versus dwell time (mean ± SD). NS = 5% glucose solution group (n=8) (open squares); LS = 5% glucose solution + 0.3% NaCl group (n=8) (closed squares); MS = 5% glucose solution + 0.6% NaCl group (n=8) (open triangles); HS = 5% glucose solution + 0.9% NaCl (n=8) (closed triangles).
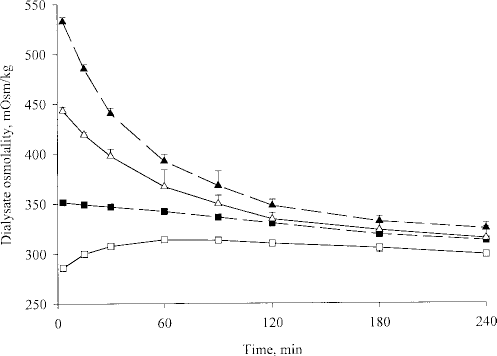
Intraperitoneal dialysate osmolality measured immediately after the samples were taken, versus dwell time (mean ± SD). NS = 5% glucose solution group (n=8) (open squares); LS = 5% glucose solution + 0.3% NaCl group (n=8) (closed squares); MS = 5% glucose solution + 0.6% NaCl group (n=8) (open triangles); HS = 5% glucose solution + 0.9% NaCl (n=8) (closed triangles).
Sodium Transport
The D/P value for sodium was significantly higher in the higher sodium concentration groups, as expected, compared to the low sodium concentration groups (Figure 4, all p < 0.01). The dialysate sodium concentration increased with dwell time in the NS, LS, and MS groups; the lower the sodium concentration, the faster the increase in dialysate sodium concentration. However, the dialysate sodium concentration decreased initially in the HS group, then increased after 90 minutes of dwell.
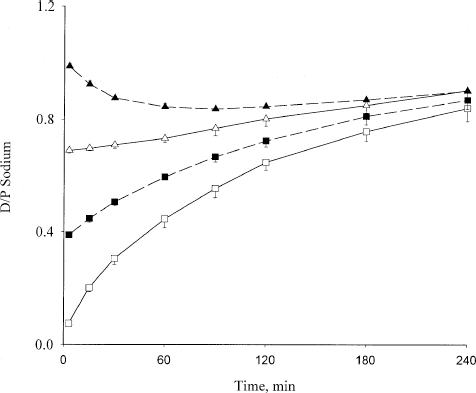
Dialysate-to-plasma concentration ratio (D/P) for sodium versus dwell time (mean ± SD). NS = 5% glucose solution group (n=8) (open squares); LS = 5% glucose solution + 0.3% NaCl group (n=8) (closed squares); MS = 5% glucose solution + 0.6% NaCl group (n=8) (open triangles); HS = 5% glucose solution + 0.9% NaCl (n=8) (closed triangles).
The diffusive mass transport coefficients (KBD) for glucose and sodium are presented in Table 1. The KBD values for glucose were significantly higher in the HS group compared to the NS group (p < 0.01). The difference in KBD for glucose between the other groups did not reach statistical significance, although it tended to be higher in the high sodium concentration groups compared to the low sodium concentration groups. KBD for sodium was significantly lower in the HS and MS groups compared to the LS and NS groups. There was, however, no significant difference in sodium KBD values between the HS and MS groups, or between the LS and NS groups.
Peritoneal clearances for sodium were significantly lower in the high sodium concentration groups compared to the low sodium concentration groups, despite fluid removal being much higher in the high sodium concentration groups (Table 1).
Discussion
The present study shows that dialysate sodium concentration may affect the peritoneal sodium diffusive mass transport coefficients for sodium as well as for glucose.
Peritoneal sodium transport has been the focus of interest in PD during the past two decades not only because peritoneal sodium removal correlates strongly with peritoneal fluid removal, but due also to the unique pattern of peritoneal sodium transport using conventional dialysis solution (6,24). It is now well established that, when conventional dialysis solutions are used, convective transport plays a major role in the peritoneal sodium transport process, whereas the diffusive transport has a less important role (6). However, the present study shows that diffusive transport of sodium is as important as, or even more important than, convective transport in terms of sodium removal using low sodium solutions.
In this study, we estimated the solute diffusive mass transport coefficients by fixing the sieving coefficients at 0.55, as previously reported (11). This is because, in the BRF model, the transport parameters (KBD and S) are assumed to be constant during the dwell. However, recent studies show that KBD may not be constant during a single dwell (11). By fixing the sieving coefficient, the KBD values may be more correctly estimated. The decrease in sodium KBD associated with an increase in dialysate sodium concentration (and therefore decrease in sodium diffusion gradient) suggests that the solute diffusive mass transport coefficient might be affected by the solute concentration gradient. The sodium KBD values in the NS and LS groups were of similar magnitude to the KBD values for glucose in the HS, MS, and LS groups, and also similar to the KBD values for urea in our previous studies (25). One may argue that the estimation of KBD for sodium in the HS group may be less precise than that for the other groups because of the low concentration gradient for sodium in the HS group in the present study. However, if the sodium plasma concentration is expressed as the aqueous plasma sodium concentration (by taking into account the presence of lipids and proteins in plasma), and corrections are done for Donnan equilibrium of small cations between dialysate and plasma (21), as well as for the impact of peritoneal absorption on the mass balance, KBD for sodium could still be accurately estimated (6). In fact, we have previously found that, with conventional glucose dialysis solution (sodium concentration of 132 mmol/L), when fixing the S value to 0.55, the KBD for sodium was in the order of 0.12 mL/min in rats (25). Note that despite the fact that initial sodium concentration in the 0.9% NaCl group was higher than the plasma concentration (around 142 mmol/L), there was still a sodium diffusion gradient throughout the dwell (Figure 4) favoring the transport of sodium from blood to dialysate. This highlights the importance of convection with sodium sieving in peritoneal sodium removal (6).
The reason for the apparent change of sodium KBD with different dialysate sodium concentrations is not clear from the present study. KBD is a lumped parameter that includes tissue hydraulic permeability and peritoneal surface area. It is unlikely that altering the dialysate sodium concentration could have altered the peritoneal surface area. However, further studies are needed in this area. Whether the observed changes in KBD for sodium with different dialysate sodium concentrations may also be found for other small solutes, and whether this may account at least partially for varying KBD values during a single dwell, need further studies for confirmation.
The significant ultrafiltration in the NS group despite the initial osmolality of this solution being slightly hypo-osmotic is in agreement with previous studies (15,26,27). As also shown in a previous study (15), we found that the dialysate osmolality in this solution increased to higher than plasma level after 15 minutes of dwell. This is because the transport of sodium in this group was much faster than the transport of glucose, as shown by the KBD values in Table 1, resulting in significant flux of sodium from blood to dialysate. The change to hyperosmotic solution may have contributed to the significant ultrafiltration in this group.
It was not expected that lowering the dialysate sodium concentration would result in decreased peritoneal glucose transport. One may argue that changing the dialysate sodium concentration may change the sieving coefficients for glucose, and thus it may not be appropriate to fix the sieving coefficient to 0.55. We therefore further evaluated the KBD values for glucose using various sieving coefficients; the data are shown in Table 2.
KBD Values for Glucose, with Various Sieving Coefficients (S)
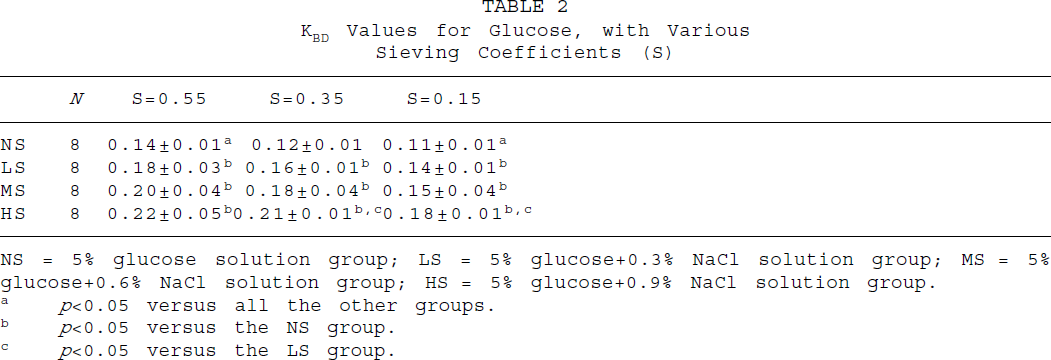
NS = 5% glucose solution group; LS = 5% glucose+0.3% NaCl solution group; MS = 5% glucose+0.6% NaCl solution group; HS = 5% glucose+0.9% NaCl solution group.
p<0.05 versus all the other groups.
p<0.05 versus the NS group.
p<0.05 versus the LS group.
The results further support that lower dialysate sodium concentration decreases peritoneal glucose diffusive transfer coefficients. The mechanism of peritoneal glucose transport during PD is still not well understood. Mathematical modeling cannot fully explain the experimental data, indicating there may be some other mechanisms involved besides simple diffusion, convection, and peritoneal fluid absorption (13).
In a previous study (28), the peritoneal diffusive mass transfer coefficient for glucose was found to be lower when using icodextrin solution than when using glucose solution. In recent years, several studies have suggested that uptake of glucose into peritoneal cells may be involved in peritoneal glucose transport (13,18,29). Glucose transporters, including sodium-dependent glucose transporter (SGluT), are expressed by peritoneal mesothelial cells (30). Inhibiting glucose transporters by adding phlorizin into dialysis solution could decrease peritoneal glucose absorption (31). It has been shown that depletion of sodium in the solution could inhibit cell uptake of glucose (32). Whether the lower KBD for glucose in the NS group is related to a decreased cellular uptake of glucose, still needs to be established.
Sodium clearance increased significantly with the decrease in dialysate sodium concentration, despite the fact that the peritoneal fluid removal was significantly higher in the high dialysate sodium groups compared to the low dialysate sodium groups. This highlights the importance of diffusive transport in peritoneal sodium removal when low sodium dialysis fluids are used.
In summary, our results suggest that (1) dialysate sodium concentration may affect the peritoneal sodium mass transport coefficient KBD — as the the sodium concentration gradient increased, the KBD decreased; (2) 5% glucose solution with no electrolytes could induce significant peritoneal ultrafiltration in normal rats, despite its initial hypo-osmotic nature, due to the influx of sodium from blood to dialysate as well as to a significantly lower glucose transport rate than sodium transport rate; and (3) a lower dialysate sodium concentration may decrease peritoneal glucose absorption.
Footnotes
Acknowledgment
This study was supported by a grant from Baxter Healthcare Corporation, McGaw Park, Illinois, U.S.A.