
Abstract
Objective
Although important enhancements to continuous ambulatory peritoneal dialysis (CAPD) have occurred since its inception, few studies have explicitly evaluated trends over time in CAPD technique failure rates. To assist in quantifying the net benefit of improvements to CAPD for patient outcomes, we examined trends in technique failure rates among Canadian CAPD patients.
Patients
Patients initiating renal replacement therapy on CAPD (n = 7110) between 1981 and 1997.
Main Outcome Measures
Technique failure (i.e., switch to hemodialysis).
Results
Total follow-up was 12 831 patient-years (pt-yr). There were 1976 technique failures, for a crude CAPD failure rate of 154.0/1000 pt-yr. Technique failure rate ratios (RR) estimated using Poisson regression and adjusted for age, gender, race, province, primary renal diagnosis, and follow-up time, were significantly reduced for the 1990–93 [RR = 0.75, 95% confidence interval (CI) = (0.68, 0.83)], 1994–95 [RR = 0.83, CI (0.75, 0.93)], and 1996–97 [RR = 0.78, CI (0.70, 0.87)] calendar periods relative to 1981–89 (RR = 1, reference). Among cause-specific technique failure rates, the greatest improvement was observed for peritonitis-attributable technique failure, with RR = 0.46, CI (0.41, 0.50) for 1990–97 relative to 1981–89. However, rates of technique failure due to inadequate dialysis were significantly elevated for the 1990–97 period [RR = 1.68, CI (1.44, 1.96)].
Conclusions
The collection of more detailed data on practice patterns would enable future studies to elucidate the cause-and-effect relationship between CAPD descriptors and technique failure, and hence assist in clinical decision-making.
Few studies have explicitly evaluated trends over time in technique failure rates. In an attempt to quantify the net benefit of technical and nontechnical modifications to CAPD that have occurred over time, we examined technique failure rates among Canadian CAPD patients between 1981 and 1997, using data obtained from the Canadian Organ Replacement Register (CORR), a population-based, nationwide, organ failure register (7).
Methods
Data were obtained from CORR, of the Canadian Institute for Health Information (7). Information recorded at RRT initiation includes date of birth, gender, province of residence, race, and primary renal diagnosis. Patient-specific therapy data are submitted annually by each center, including dates of dialytic modality assignments and switches, transplantations, graft failures, mortality data (date and cause of death), and, where applicable, reason for discontinuing CAPD. Data were available on all patients initiating RRT between 1 January 1981 and 31 December 1997 (effectively, the start and end dates of the period of observation, respectively).
Patients were included if they initiated RRT on CAPD between 1981 and 1997. Technique failure was considered to occur upon a switch from CAPD to hemodialysis (HD). Follow-up began at CAPD initiation and continued until the date of switch to HD, transplantation, death, loss to follow-up, recovery of native renal function, or the end of the period of observation. That is, patients were followed until the earliest of the afore-listed events, with each, except technique failure, representing censored data.
Technique failure rates were computed as the ratio of the number of CAPD-to-HD transfers to the number of patient-years (pt-yr) receiving CAPD. The patient-time pool was categorized by age, race, gender, province, primary renal diagnosis, follow-up time (single-year intervals), and calendar period (1981-89, 1990–93, 1994–95, 1996–97). Age, calendar period, and, naturally, follow-up time were time-dependent variables in that patients could contribute to more than one cell during their time under observation. For each patient, only the first technique failure was counted, as follow-up ceased at the date of failure. Poisson regression (8,9) was employed to model the natural logarithm of the failure rate as a linear combination of parameters representing each of the above-listed covariates. The CAPD technique failure rate ratio [RR; i.e., failure rate during each period subsequent to 1981–89, divided by the technique failure rate for 1981–89 (arbitrarily chosen reference period)] served as the covariate-adjusted measure of effect. Models were fitted separately by age and diabetes status, as were cause of failure (COF)-specific models. For these analyses, post-1990 calendar periods were combined in order to increase precision. Causes of failure appearing on the CORR patient follow-up form included peritonitis, other abdominal complications, inadequate dialysis (including ultrafiltration failure), other CAPD-related complications, patient unable to cope, patient's request, family's request, transfer to treatment of first choice, other, and unknown.
Results
A profile of the 7110 RRT patients who initiated RRT on CAPD between 1981 and 1997 in Canada is presented in Table 1. As shown in Table 2, there were 1976 CAPD-to-HD transfers during the 12 831 pt-yr of observation, for an overall CAPD technique failure rate of 154.0/1000 pt-yr. Nonadjusted failure rates were highest during the 1981–89 period, and decreased between 1990 and 1997. The covariate-adjusted CAPD failure RR was 0.75 for the 1990–93 calendar period, with 95% confidence interval (CI) (0.68, 0.83), indicating a significant 25% reduction in technique failure rates relative to the 1981–89 period. The corresponding figures for 1994–95 and 1996–97 were of similar magnitude: RR = 0.83, CI (0.75, 0.93) and RR = 0.78, CI (0.70, 0.87), respectively. There was very little difference between the nonadjusted and adjusted RRs.
Baseline Characteristics of Canadian CAPD Patients
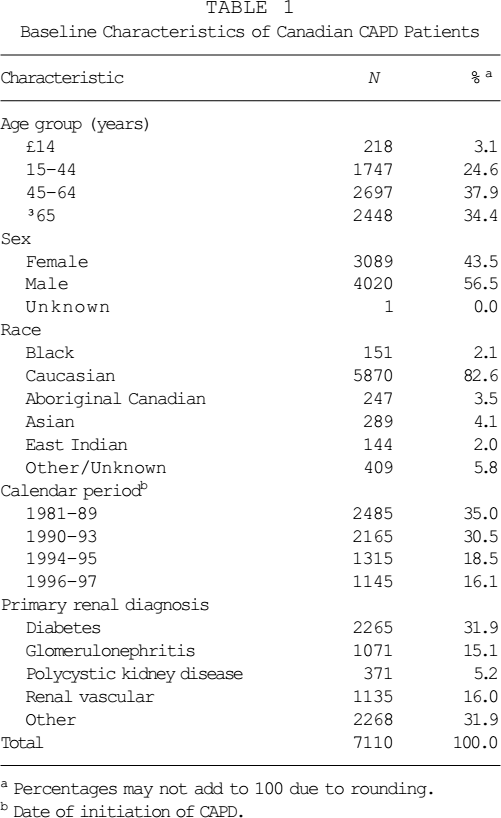
Percentages may not add to 100 due to rounding.
Date of initiation of CAPD.
CAPD Technique Failure (i.e., Transfer from CAPD to Hemodialysis) Rates and Rate Ratios by Calendar Period
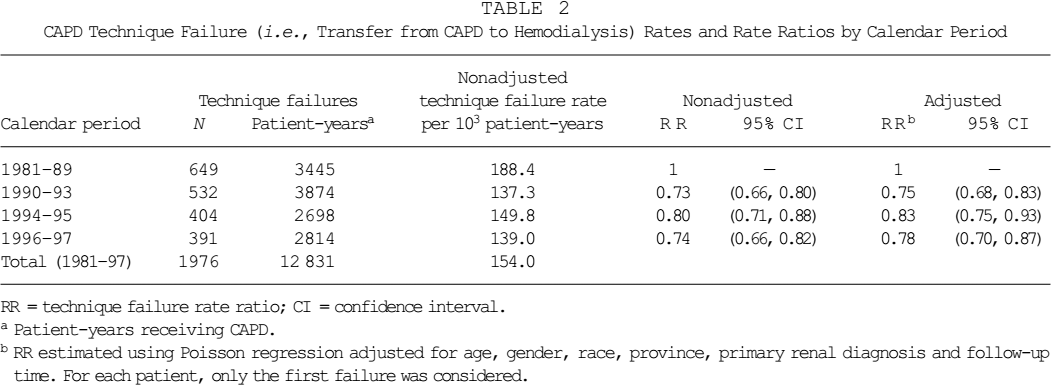
RR = technique failure rate ratio; CI = confidence interval.
Patient-years receiving CAPD.
RR estimated using Poisson regression adjusted for age, gender, race, province, primary renal diagnosis and follow-up time. For each patient, only the first failure was considered.
Fitted CAPD technique failure rates and technique survival curves for 1981–89 and 1990–97 patients are displayed in Figures 1 and 2, respectively. Each curve was derived from the RRs estimated using Poisson regression and pertains to referent patients (i.e., patients in the reference category of each variable: Caucasian, Ontario females, aged 45 – 64, with glomerulonephritis as primary renal diagnosis).
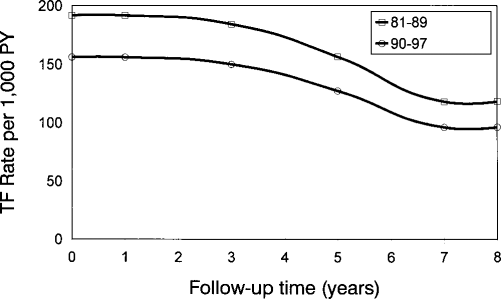
Adjusted CAPD technique failure (TF) rates per 1000 patient-years by cohort, derived from rate ratios estimated via Poisson regression, for referent patients (i.e., patients at the reference category for each covariate: female, aged 45 – 64 years, glomerulonephritis as primary renal disease, Caucasian, from Ontario).
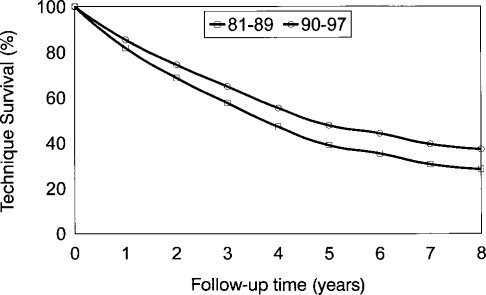
Adjusted CAPD technique survival probability by cohort, derived from rate ratios estimated via Poisson regression, for referent patients (i.e., patients at the reference category for each covariate: female, aged 45 – 64 years, glomerulonephritis as primary renal disease, Caucasian, from Ontario).
Adjusted technique failure rates are at their maximum during the first 3 years of follow-up and decrease steadily thereafter. It is estimated that 8-year CAPD technique survival probability increased from 28% during 1981–89 to 37% during 1990–97. Note that calendar periods beyond 1981–89 were combined due to the similarity of the RRs (Table 2). No significant cohort/follow-up time interactions were observed.
The distribution of causes of CAPD technique failure (COF) is presented in Table 3. Peritonitis was the most common cause, accounting for roughly one third of all failures. Inadequate dialysis was responsible for 11% of CAPD failures, while 12% of technique failures resulted from other abdominal complications. The cause was unknown for 18% of patients experiencing technique failure. The proportion of failures due to peritonitis decreased from 44% during 1981– 89 to 27% during 1990–97, while that due to inadequate dialysis increased from 6% to 14% for the same periods.
Cause of CAPD Failure by Calendar Period
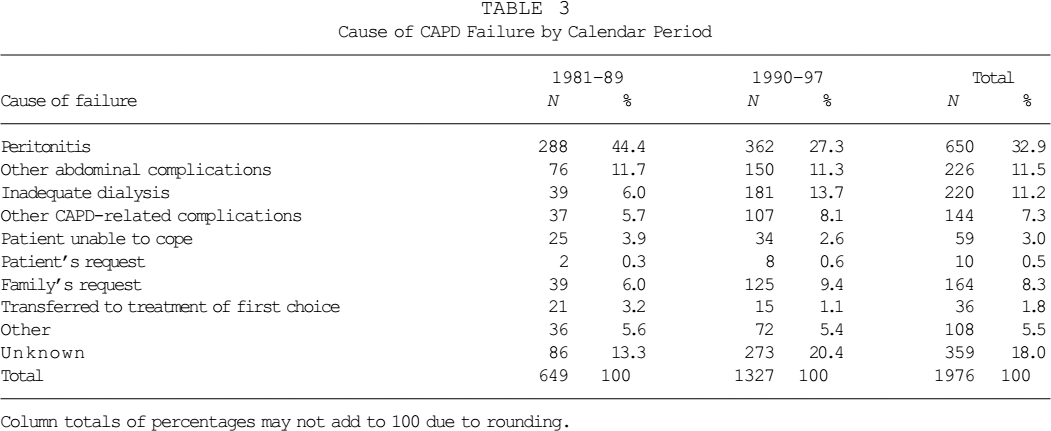
Column totals of percentages may not add to 100 due to rounding.
Cause-specific CAPD failure RRs are listed in Table 4 for COFs for which model convergence could be obtained. Rates of failure due to peritonitis were significantly decreased during 1990–97 relative to 1981–89, with RR = 0.46, CI (0.41, 0.50). Rates of technique failure due to other abdominal complications (RR = 0.78) were also significantly decreased between 1990 and 1997. However, post-1990 rates of CAPD failure were significantly elevated for inadequate dialysis (RR = 1.68), other CAPD-related complications (RR = 1.28), and unknown causes (RR = 1.28).
Cause-Specific CAPD Technique Failure Rate Ratios by Calendar Period
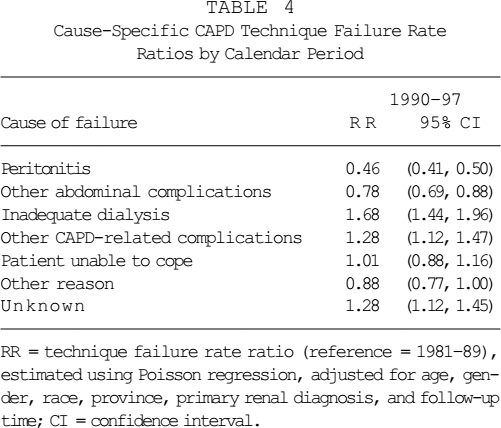
RR = technique failure rate ratio (reference = 1981–89), estimated using Poisson regression, adjusted for age, gender, race, province, primary renal diagnosis, and follow-up time; CI = confidence interval.
Covariate-adjusted CAPD technique failure RRs are listed by age and diabetes status in Table 5. Since no meaningful trends were obscured by doing so, the post-1990 calendar periods were combined. Trends in technique failure rates were similar for nondiabetics aged 64 years or younger (RR = 0.74), nondiabetics aged 65 years or older (RR = 0.83), and diabetics aged 64 years or younger (RR = 0.77). Diabetics aged 65 years and older were the only patient subpopulation for which no decrease in technique failure rates was observed (RR = 1.01).
Adjusted CAPD Technique Failure Rate Ratios by Calendar Period and Patient Subpopulation
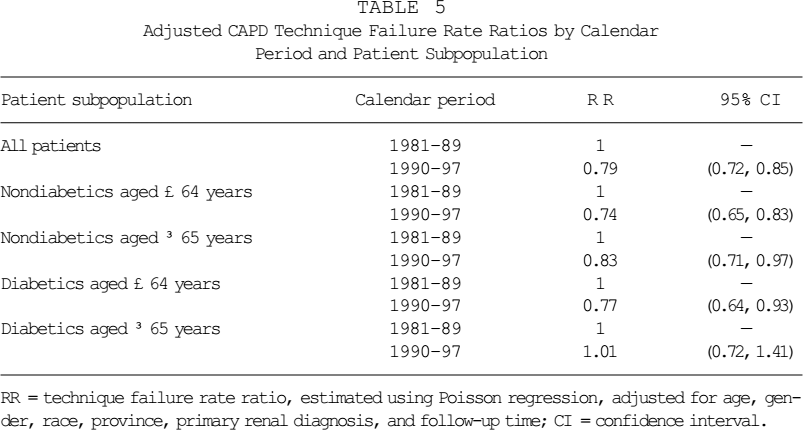
RR = technique failure rate ratio, estimated using Poisson regression, adjusted for age, gender, race, province, primary renal diagnosis, and follow-up time; CI = confidence interval.
Discussion
We observed a significant decrease in technique failure rates among CAPD patients in Canada between 1981 and 1997. After adjusting for age, gender, race, province, primary renal diagnosis, and follow-up time, CAPD failure rates were reduced by 21% during the 1990–97 calendar period relative to 1981– 89 (Table 5). Among cause-specific technique failure rates, the strongest decrease was observed for peritonitis-attributable CAPD failure. A significant increase in failures attributed to inadequate dialysis was identified.
We focused solely on CAPD, excluding the intermittent and continuous cycler (CCPD) forms of PD. From the CORR database, data were available on reason for discontinuance for only CAPD. Previous results indicate that, in Canada, intermittent PD is being phased out as a form of PD (Schaubel et al., unpublished data). Despite recently increased utilization of automated PD, CCPD represents only a small fraction of continuous PD utilization based on the 1981–97 CORR database.
Peritonitis has been reported to be the most frequent cause of PD technique failure in several previous studies (10-13), and is usually attributed to 25% – 50% of all failures. In the current study, peritonitis was responsible for 33% of all CAPD failures, and 40% when failures due to unknown causes are excluded from the total. Among specific causes of CAPD failure, the strongest decrease was observed for peritonitis. This reduction is, likely, largely attributable to widespread adoption of the Y-connector transfer set and twin-bag, which have been shown to reduce rates of peritonitis and technique failure (14-17). Another factor may be improved management of peritonitis according to guidelines published in 1989 (18) and revised in 1996 (19). Indeed, when the peritonitis-attributable technique failure rates were reanalyzed by subdividing the 1990–97 calendar period, technique failure rates decreased consistently across 1990–93 (RR = 0.51), 1994–95 (RR = 0.45), and 1996– 97 (RR = 0.38).
Among causes of CAPD failure, we observed a downward trend in the percentage of technique failure due to peritonitis, and an upward trend in the percentage attributable to inadequate dialysis. These data complement recently reported results from Japan, where Kawaguchi and colleagues report that ultrafiltration loss has displaced peritonitis as the primary cause of PD withdrawal (20). For the most recent calendar period in the current study, peritonitis was still the most frequent COF, accounting for 25% of CAPD failures, followed by inadequate dialysis (which includes ultrafiltration failure) at 22%. Our results indicate significantly elevated rates of CAPD failure due to inadequate dialysis during the 1990–97 period relative to 1981–89. Borrowing terminology from epidemiology (21), this likely reflects a “detection bias” phenomenon that, in the context of the current investigation, would involve changes in the rate of event detection (rather than rate occurrence, per se) over calendar time. As a result of increased research and discussion with respect to PD adequacy in the late 1980s and early 1990s (22-26), nephrologists might have been more likely to identify CAPD patients as being inadequately dialyzed, due to heightened awareness. As emphasized by Teehan et al. (24) and Hakim (26), analyses of the National Cooperative Dialysis Study (27-29) reveal that gross underdialysis of HD patients went unrecognized by the onsite investigators. Thus, given the relative degrees of patient–physician interaction for HD and CAPD patients, the hypothesis of increased detection of CAPD inadequacy over time appears plausible. Another contributing factor could be the U.S. study by Bloembergen et al. (30), which showed significantly increased mortality rates on PD relative to HD. The subsequent investigation by Fenton et al. (31) that demonstrated significantly decreased mortality on CAPD/CCPD relative to HD in Canada was not published until very late in 1997.
Noteworthy are the significantly increased rates of CAPD technique failure due to “unknown” causes (i.e., where COF was not recorded). Missing data, always a concern in statistical analysis, are potentially more troublesome when they exhibit strong patterns across levels of the variable of interest (i.e., in this case, calendar time). To the extent that, within each calendar time period COFs are missing in proportion to their observed relative frequency, COF-specific RRs remain unbiased. Otherwise, there exists the potential that trends in rates of various COFs might be artifacts resulting from trends in data completeness. It is possible, given the greatly increasing numbers of patients receiving RRT in Canada, that coding became progressively less complete over time due to increasing demands placed on nurses and clinicians within nephrology units. Generally, the funding of Canadian renal centers has not kept pace with the demand imposed by increased end-stage renal disease prevalence, as outlined in previous reports (32-34). Since patient-specific data are supplied to CORR on, effectively, a volunteer basis by the renal centers in Canada, data quality may have become less of a priority out of necessity.
Various issues hinder the interpretation of our findings. The collection of data on the reason for CAPD discontinuance permits insight regarding what is driving the overall decrease in CAPD technique failure rates. However, like the remainder of the CORR database, the COF variable has not been validated. Moreover, as stated, there appear to be secular trends with respect to its completeness. Clearly, the most important limitation to our ability to draw inference from our results is the lack of published data regarding RRT practice patterns in Canada, let alone trends therein over time. Recent data indicate that PD prescription patterns are changing substantially in Canada (35), and a re-examination of technique failure rates would be valuable in 4 – 5 years’ time to assess the impact of such changes.
We report a significant decrease in covariate-adjusted technique failure rates among CAPD patients in Canada post 1990 relative to the 1981–89 period. In conjunction with previously reported significant decreases in PD mortality rates (36), these findings may assist in clinical decision-making among nephrologists, particularly in the context of publicly funded health care systems. Further research is required in order to determine the degree to which various improvements in PD are responsible for observed improvements in patient outcomes. In this regard, enhanced data collection with respect to practice patterns is essential.
Footnotes
Acknowledgments
This investigation was funded by Baxter Healthcare Corporation, Renal Division, Deerfield, IL, U.S.A.
The collection of data and the maintenance of the Canadian Organ Replacement Register (CORR) is made possible by the wholehearted collaboration of the 86 individual renal programs across Canada. The contribution of the current and past full-time staff assigned to the Register at the Canadian Institute for Health Information (formerly, Hospital Medical Records Institute) also has been essential to the success of the Register. The Canadian Society of Nephrology, The Canadian Transplant Society, and the Canadian Association of Nephrology Nurses and Technologists and their constituent members also have made an essential contribution to the Register since its inception in 1981. CORR is funded 15% by the Federal Department of Health, and 80% by the provincial and territorial Departments of Health based on population. Together, the Kidney Foundation of Canada and the health care industry provide approximately 5% of the funding.