






Abstract
Historical Overview: Dialysis Adequacy as a Moving Target
Prospective analysis of dialysis outcome as a function of dialysis dose was first carried out in maintenance hemodialysis as part of the National Cooperative Dialysis Study (NCDS) (3,7-12). Not only were those results extrapolated directly to peritoneal dialysis, they also served—perhaps below the level of consciousness—to frame much of the ensuing debate for more than two decades. Any attempt to redefine dialysis adequacy must therefore begin with reappraisal of the results of that study.
The NCDS randomized 160 patients to a time-averaged urea concentration (TAC) of either 50 mg/dL or 100 mg/dL (20 – 40 mmol/L). Within each TAC arm, patients were further randomized to either short (mean: 3.2 hours) or long (mean: 4.5 hours) dialysis, for a total of 4 treatment groups. Those groups were followed for a minimum of 6 months.
The design was to intended to identify the principal uremic toxins, with urea regarded as a surrogate for the small, dialyzable products of protein metabolism. Clearance of the so-called middle molecules (300 – 5000 Da) is far less responsive to increased flow rates, and—for a given dialyzer—can be increased only by lengthening the treatment time. Dialysis duration was therefore used as a surrogate for middle-molecule clearance. As outcome measures, the NCDS considered two complementary definitions of treatment failure: type 1 failure, meaning death or medical withdrawal for serious uremic complications, and type 2 failure, which added hospitalization rates as a measure of morbidity.
Blood urea concentrations were well known to be, by themselves, insufficient for assessing small-solute clearance, because urea is also a measure of dietary protein intake and adequacy of nutrition (7,13). Nevertheless, after controlling for protein intake by multiple (logistic) regression, TAC was the most powerful predictor of outcome, followed closely by protein catabolic rate (PCR)—now more appropriately called the “protein equivalent of nitrogen appearance” (PNA)— a measure of steady-state dietary protein intake (DPI).
The initial statistical analysis emphasized both TAC and PCR as outcomes (7,11,14). But a certain arbitrariness was attached to the choice of outcome variables. For example, midweek pre-dialysis blood urea nitrogen (BUN) may be used in lieu of TAC. The ratio of the urea generation rate (G/TAC) was an alternative outcome predictor, as was the analogous ratio PCR/TAC. Both of those ratios reflect steady-state clearance (production/concentration) (12).
Several more years elapsed before Gotch and Sargent (12) introduced, in their so-called mechanistic analysis, the normalized urea clearance Kt/V, where K = dialyzer urea clearance, t = dialysis time, and V = total body water volume. The results were dramatic: a urea Kt/V below 0.8 was associated with a 57% incidence of treatment failure, which fell to 13% for a Kt/V above 0.9. The Kt/V also provided a unifying hypothesis, suggesting that underdialysis led to poor outcomes even when TAC was low, with worsening anorexia, spontaneous reduction in protein intake, and a paradoxical improvement in serum chemistries. The suggested relationship between Kt/V, appetite, and other uremic symptoms was subsequently confirmed by prospective trials (15-17). Numerous studies have also confirmed the grim prognostic significance of malnutrition in hemodialysis, with albumin levels below 30 g/L conferring a 15 fold to 20-fold increase in mortality risk (13).
The mechanistic analysis may be presented in the form of therapy domain maps (Figure 1)—PCR on the x axis, TAC on the y axis, and contours identifying the corresponding Kt/V—because any two of the variables determine the third (12,18). The therapy target modelling line indicates the minimum target for adequate dialysis.
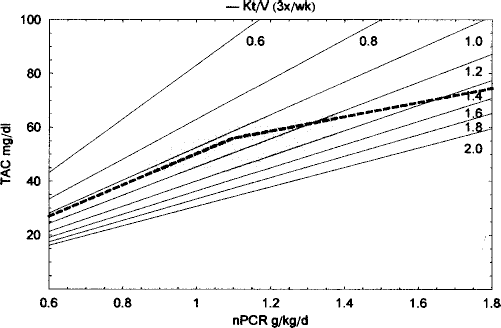
This therapy domain map from the National Cooperative Dialysis Study illustrates the relationship (solid contour) between normalized protein catabolic rate [nPCR (g/kg/day)], time-averaged concentration of blood urea nitrogen [TAC (mg/dL)], and dialysis dose (Kt/V). The shaded region represents favorable outcomes. The minimum target line (dashed contour) shows the dependence of dose on protein intake. Reprinted from (18), with permission.
Figure 1 should make it clear that target Kt/V depends on protein intake, because the target modelling line has an inflection point at a PCR of approximately 1.1 g/kg/day, the standard NCDS diet. Below that value, the minimum target line follows a single Kt/V contour of approximately 1.1. Above that value, the target line begins to cross Kt/V contours, so that a protein intake of 1.5 g/kg/day, for example, requires a Kt/V of at least 1.4. This relationship is an important consideration, given that most pediatric patients are prescribed dietary protein exceeding the standard adult diet.
As Kt/V increased from 0.9 to a maximum of 1.5, further reductions in failure rates did not materialize, and the zone above 1.4 was labelled “possibly excessive” dialysis, although that range was not achieved by the study design. Inferences based on these data must also recognize that patients were randomized on the basis of TAC, and not Kt/V or protein intake. A case has been made for more frequent dialysis with a lower TAC at the same Kt/V (19,20).
Following the NCDS, the tendency has been to prescribe dialysis on the basis of small-solute clearance alone, disregarding the toxicity of the higher-molecular-weight “middle molecules” (300 – 5000 Da). This approach cannot be wholly justified on the basis of the data. While treatment duration was not a predictor of type 1 failure (death), it was an independent and statistically significant predictor of type 2 failure (morbidity).
For a given dose of dialysis and protein intake (PCR/TAC), outcome clearly worsened (Figure 2) as dialysis was shortened (9,11,14). Hospitalization rates—total and dialysis-related admissions alike— revealed a significant time effect (p = 0.002) and a BUN–time interaction (11). In the high-TAC patients, the relative risk of hospitalization with shorter treatment was 3.24 (p = 0.001). That effect was weaker than the one for small-solute clearance, but the 6-month follow-up was probably not sufficient to assess cumulative, long-term toxicity. In the year after the study ended, mortality was more than twice as high in the patients randomized to the lower dialysis doses, and inclusion of deaths occurring beyond the study period would have approached statistical significance, a factor that is particularly relevant considering that the trial was stopped prematurely by the patient-safety committee (20).
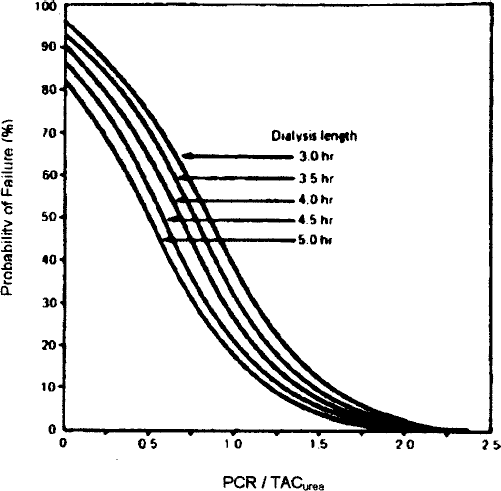
Effect of dialysis duration (equivalent to middle molecule clearance) on type 2 treatment failure owing to hospitalization, death, or medical withdrawal. (PCR/TAC is protein catabolic rate to time-averaged blood urea nitrogen concentration.) Reprinted from (9) with permission.
In Figure 2, the ratio PCR/TAC may be unfamiliar. Its significance became clearer with the mechanistic analysis, which demonstrated that Kt/V and PCR/TAC were mathematically interchangeable in the analysis of outcomes (12). In that context, Figure 2 illustrates that shorter dialysis (which maintains Kt/V with higher flows) should not be considered equivalent. Although the NCDS identified the critical role of the low molecular weight toxins for which urea is a surrogate, it also demonstrated that small-solute clearance should be considered to be only a partial index of dialysis dose.
Despite widespread adoption of NCDS guidelines, later single-center studies have suggested that increasing dialysis into the range 1.2 – 1.5 might further reduce adult mortality and morbidity. Reports from Tassin (21,22) are often cited. There, patients received nocturnal dialysis (8 hours thrice weekly), with a mean Kt/V of 1.67 and a 5-year survival rate of 87%, as compared with 33% in the U.S. and 47% – 54% in Europe or Japan. These differences could not be explained on the basis of comorbid conditions or patient demographics. Curiously, Cox regression identified middle-molecule clearance (dialysis index: vitamin B12) and lower blood pressure, but not Kt/V, as significant survival factors. The HEMO Study (23) by the National Institutes of Health is currently addressing this question in adults.
In the original description of CAPD, Popovich et al (2) understood that the urea clearance in PD fell below that required in HD patients, assuming that CAPD would be equivalent to HD if sufficient clearance were provided to achieve a steady-state BUN of 70 mg/dL (25 mmol/L) in conjunction with a mildly protein-restricted diet. These assumptions imply that the two modalities are equivalent when the steady-state BUN on CAPD equals the mid-week pre-dialysis BUN of an HD patient with the same protein intake and a Kt/V of approximately 1.0.
Eventually, this definition of equivalence would be formalized as the “peak concentration hypothesis.” The hypothesis attributed uremic toxicity on intermittent dialysis to peak small-solute concentrations. That definition remains relevant to attempts by DOQI to formally compare intermittent PD therapies [continuous cycling peritoneal dialysis (CCPD) and nightly intermittent peritoneal dialysis (NIPD)] to CAPD outcome data from CANUSA and other trials.
For a variety of reasons, prospective studies comparable to the NCDS were slower to materialize for PD patients. Eventually, a number of longitudinal cohort studies in adults on CAPD appeared in the early 1990s, including at least four (4,24-26) that applied multivariate techniques to control for confounding factors such as age, comorbid conditions, time on dialysis, and serum albumin concentrations. All but one demonstrated a significant positive association between patient survival and total weekly urea Kt/V (renal plus peritoneal). The CANUSA study, with 680 patients, provided estimates of relative risk of death at various values of urea Kt/V (Figure 3). Over the entire dose range studied (1.5 – 2.3), the risk of death increased by approximately 5% for each 0.1 unit decrease in urea Kt/V. Recognizing that urea Kt/V is a more direct measure of protein metabolism, DOQI recommendations were also formulated on the basis of weekly total creatinine clearance [CCr (dialysate plus renal, the latter corrected for tubular secretion by taking the arithmetic mean of the urea and creatinine clearances)] normalized for body surface area (L/1.73 m2). Using this measure, mortality decreased by 7% for each 5 L/1.73 m2 increase in weekly CCr over the range studied (70 – 95 L/1.73 m2) (4). Table 1 summarizes the recommendations.
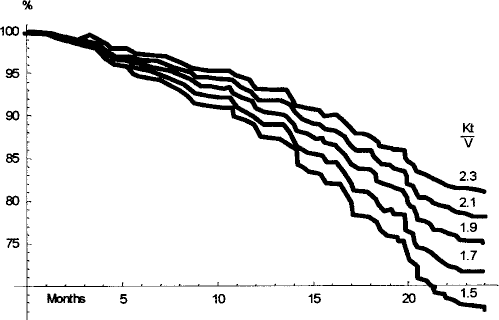
Survival in CANUSA continuous ambulatory peritoneal dialysis (CAPD) patients (n = 680) as a function of normalized weekly urea clearance. Reprinted from (4), with permission.
Urea (Kt/V) and Creatinine Clearance (CCr) Recommendations from the Dialysis Outcomes Quality Initiative

CAPD = continuous ambulatory peritoneal dialysis; NIPD = nightly intermittent peritoneal dialysis; CCPD = continuous cycling peritoneal dialysis.
However, which solute is the preferred marker is far from clear, because CCr predicts technique failure, hospitalization rates, and mortality, and Kt/V urea predicts only mortality. Moreover, the two solutes differ in molecular weight (MW) and clearance properties.
Urea, with a MW of 60 Da, equilibrates more quickly than creatinine (MW 113). Shorter dwell times therefore favor urea over larger solutes. This question is of more than statistical interest, because approximately 20% of patients demonstrate a discordance between the two measures (27). The discrepancy is particularly troubling in children, in whom a greater reliance on CCPD results in a higher urea Kt/V without necessarily improving CCr. The magnitude and impact of the discrepancy in pediatric PD patients is emphasized by reports (28) showing that CAPD patients (n = 85) may be inadequately dialyzed by urea Kt/V criteria (1.96 ± 0.91 vs 2.45 ± 0.84) as compared with their confreres on CCPD with identical creatinine clearances (57 ± 42 vs 57 ± 30).
As dwell time is shortened, the disproportionate increase in urea clearance also makes it difficult to extrapolate the results of the CANUSA study of CAPD outcomes to intermittent PD modalities such as CCPD, NIPD, and tidal PD. The DOQI recommendations for CCPD and NIPD were based on the dose required to remove the same quantity of urea as CAPD, but alternative definitions of equivalence exist, based on maintenance of peak urea concentrations or TAC urea. In the absence of outcome data, the DOQI recommendations must be regarded as ad hoc and unproven.
It should also be noted that most patients in the CANUSA study had significant residual renal function, because all were enrolled during the first 2 years of dialysis therapy. The assumption that renal and dialysate solute clearances are equivalent and interchangeable is a fundamental one, but little corroborative evidence exists to support it. In the CANUSA study, the observed variability in total solute clearance was largely a consequence of differences in renal function, because the dialysis dose was comparable in the various strata. Subsequent re-analysis of the data suggests that the outcomes correlated with residual renal function rather than peritoneal clearance. Because renal creatinine clearance exceeds urea clearance, CCr declines more rapidly than urea Kt/V as renal function declines. That situation further complicates attempts to identify a straightforward relationship between the two indices. For a typical CAPD patient, the target Kt/V of 2.0 requires a weekly CCr of 60 – 70 L/1.73 m2 with residual renal function as compared with 52 L/1.73 m2 for anuric patients (4-6).
The DOQI also recommends initiation of dialysis therapy when residual renal function can no longer provide a urea Kt/V of 2.0 or, alternatively, when spontaneous protein intake falls below 0.8 g/kg/day. In the CANUSA study, the state of nutrition, measured by subjective global assessment, influenced mortality and hospitalization rates alike. As in HD, the modified Borah equation can be used to calculate PCR from the appearance of urea and protein in dialysate and urine (5,6,15). In adult and pediatric cross-sectional studies, the PCR is strongly associated with weekly urea Kt/V (28). Smaller intervention trials have confirmed an increase in PCR and DPI as Kt/V is prospectively increased, particularly if patients are inadequately dialyzed at the outset (29,30). However, serum albumin was unaffected by those trials, which might reflect a relative insensitivity of that measure, a concurrent increase in dialysate protein losses, or net fluid retention.
Misgivings about Applying the Results to Children
Outcome Measures
The reader of this article needs no review of the physiologic peculiarities of children, which include proportionally larger body water volumes, fluid intake, and energy requirements as compared with those seen in adults. Given the critical role of dialysis in the elimination of dietary fluid and protein metabolites, it would be surprising if the dialysis needs of children were not different from those of adults. Furthermore, the outcome measures chosen for adult studies (principally mortality rates) are not appropriate for pediatrics, where the literature has emphasized complications unique to younger patients—namely, impaired growth, puberty, or school performance.
Before the introduction of recombinant human growth hormone (rhGH), prepubertal patients receiving maintenance HD or PD lost between 0.35 and 0.9 standard deviation (SD) units annually from their height standard deviation score (ΔHSDS) (31)—a situation often associated with delayed puberty and absence of the normal pubertal growth spurt. Because normal growth rates, but not catch-up growth, may be expected after transplantation, the deficits are not typically recouped, and most of the children end up more than 2 SD below mean adult height (32,33). The impact on self image and quality of life is significant.
Not uncommonly, textbooks dismiss growth impairment as a dialysis-unresponsive symptom of uremia (18), even though that assumption has not been extensively tested. Our group recently reviewed growth in prepubertal, long-term hemodialysis patients (n = 12) treated in our center before the introduction of rhGH (34,35). Our prescription for diet consisted of a recommended nutritional intake (RNI) for energy based on height–age. Protein intake was that recommended by the American Dietetic Association (ADA) for children on hemodialysis, ranging from 3.3 g/kg/ day for infants to 1.3 g/kg/day for adolescents (36). These recommendations are comparable to the DOQI guidelines for the same population (37). The goals were achieved with oral, gavage, and parenteral supplements as needed. Average weekly treatment time was 14.8 ± 1.8 hours, with a urea reduction ratio of 85% and a combined dialyzer and residual renal Kt/V of approximately 2.0 per treatment.
With a mean follow-up of 26 months, our patients gained, on average, more than 0.3 SD annually without growth hormone, and only 1 of the 12 lost height score during the follow-up period. Normal pubertal growth was also described. The 1 infant, who started HD at 6 months of age, grew along the 50th percentile during more than 3 years of treatment. In general, predicted final heights fell within 2 SD of genetic potential, reflecting the fact that normal post-transplant growth may be expected if patients are delivered to transplantation without the usual deficits (32,33).
The appearance of reports from other centers confirming the benefits of more intensive dialysis therapy is reassuring (38). But, on a cautionary note, Schafer et al (39) have also described an important inverse correlation between growth rates and creatinine clearance in PD, perhaps attributable to dialytic losses of an essential cofactor. This safety issue must be addressed.
Dietary Protein
For our 12 patients, normal serum albumin and transferrin levels attested to the effectiveness of the dietary therapy. By diet history, energy intake was 90% of RNI, and protein intake was 155% of recommended, although PCR calculated with the Borah equation was 1.6 g/kg/day (range: 0.9 – 2.3 g/kg/day) or 98% ± 22% of the prescribed target. As discussed earlier, the standard adult protein allowance is based on prospective studies. Pediatric recommendations have typically been based on the requirements of normal, growing children. Obviously, anabolic growth and dialysate losses of proteins and amino acids are factors to consider, but DOQI and ADA dietary guidelines advocate higher protein intakes for pediatric patients than for adult patients even when those factors are accounted for (36,37). Given the relationship between dietary protein and Kt/V as illustrated in Figure 1 for the NCDS, increased dialysis requirements must be expected on this basis.
Middle-Molecule and Uremic Toxicity
Small-solute clearance is clearly the major determinant of mortality in adult dialysis patients, whether receiving HD or PD. However, equally clearly, middle molecules also contribute important uremic toxicity. The role of middle molecules in the growth impairment of childhood uremia remains an open question, but the renally cleared growth-hormone-binding proteins presumed to mediate growth-hormone resistance are, in fact, middle molecules by MW. As the discrepancy between urea clearance and creatinine clearance with short-cycle dialysis illustrates, prescription changes intended to optimize small-solute clearance may have unexpected effects on the clearance of larger solutes. Middle-molecule clearance in PD is generally superior to that of HD, but specific efforts to correlate outcome with surrogate markers of middle-molecule clearance (for example, vitamin B12) will be required to address the question.
Equivalence of Renal and Dialysis Clearances
The DOQI guidelines assume that renal and dialytic clearance of small solutes are interchangeable. Nonetheless, the ideal method for assessing the contribution of RRF is far from clear. The NCDS actually excluded patients with RRF. Still, based on recognition of blood urea concentration as the principle determinant of outcome (after controlling for protein intake), that study recommended that renal clearance be expressed as the equivalent dialyzer clearance needed to replace RRF and to maintain the same blood urea concentration. Because the variation in total clearance seen in the CANUSA study was mainly the result of declining renal function, the issue is equally ambiguous in the case of PD.
In a re-analysis of the CANUSA data, Bargman et al (40) have shown that RRF is a more important predictor of survival than is peritoneal clearance. The latter lost its prognostic significance when RRF was entered into the multivariate analysis. The predictive power of baseline renal clearance was, in fact, comparable to that of serum albumin. The discrepancy was attributed either to renally cleared middle molecules or to euvolemia with less cardiovascular morbidity.
In children, Chadha et al (41) have presented data showing that growth correlates with renal solute clearance, but not with peritoneal clearance—a finding that “appears to contradict the presumed equivalence” of the two routes. If confirmed by larger multivariate analyses, these findings possibly have tremendous implications for the delivery of dialysis for growing children, because peritoneal clearance may not be able to sustain normal growth once renal function has vanished.
Controlled, Prospective Trials
In the course of this review, I have attempted to highlight the growing evidence that adults and children both require more dialysis than has traditionally been assumed. I have also tried to illustrate the difficulties encountered in applying adult outcome data to growing children without a recognition of their unique physiology, dietary requirements, and uremic complications. It has not been my intention to denigrate the important work of the DOQI task force, but to make clear that only prospective pediatric trials will resolve the critical questions that remain.
To randomize patients to low-dose and high-dose treatment regimens may require CCPD with manual daytime exchanges individually tailored to the results of peritoneal equilibration tests and kinetic modelling. Small-solute and middle-molecule clearances will both need to be evaluated, and the contribution of residual renal function (RRF) will need to be specifically assessed. The simplest study design [2-factor analysis of variance (ANOVA)] will require four groups classified on the basis of solute clearance and the presence or absence of significant RRF. In the prepubertal PD population at our center, the standard deviation in annual ΔHSDS is 0.62 (n = 15; mean follow-up: 14 months). Taking that deviation to be representative, selecting ΔHSDS as the primary outcome variable, and assuming an average observation period of 1 year on dialysis before transplantation, power calculations indicate that roughly 35 patients per group (n = 140 in total) would be required to identify an annual 0.3 SD difference in ΔHSDS (p = 0.05, power = 80%).
Compared to the effects that we observed with intensive hemodialysis, this detection threshold may be more stringent than necessary (42), but it is intended to illustrate the massiveness of the undertaking, which would require several years of data accumulation and involve a great many centers. Such a study is not, however, unthinkable. Past successes of the pediatric nephrology community in comparable multicenter trials should serve as a model for this long overdue examination of dialysis adequacy.