
Abstract
♦ Objective
To study the effect of increasing the daytime dialysis exchange frequency on dialysis adequacy and nutritional status of Chinese anuric patients.
♦ Setting
University teaching hospital.
♦ Patient
100 anuric patients on continuous ambulatory peritoneal dialysis (CAPD).
♦ Design
50 patients had one additional daytime 2-L exchange (intervention group); the dialysis regimen remained unchanged in the other 50 patients (control group).
♦ Outcome
Dialysis adequacy [Kt/V, weekly creatinine clearance (wCCr), and net ultrafiltration (UF)] and nutritional status [serum albumin, dietary protein intake, represented by normalized protein nitrogen appearance (nPNA), and percent lean body mass (%LBM)] were measured at 0 and 6 months.
♦ Results
Baseline dialysis adequacy and nutritional indices were comparable between the two groups. In the control group, all parameters remained stable at month 6. In the intervention group, there were significant increases in UF, Kt/V, wCCr, nPNA, and %LBM from months 0 to 6. The improvement in nPNA was affected by daily exchange volume. In 30 patients, the number of exchanges was increased from 3 to 4 per day; their Kt/V and nPNA rose significantly from month 0 to month 6. In the other 20 patients, the number of exchanges was increased from 4 to 5 per day; there was a significant increase in Kt/V but nPNA remained static. The change in nPNA correlated inversely with Kt/V at month 0 (Pearson's r = –0.352, p = 0.012). Multivariate analysis with a general linear model showed that age, Kt/V at month 0, and 3 dialysis exchanges per day at month 0 (versus 4 exchanges) were independent predictors of the change in nPNA.
♦ Conclusions
Increasing the number of peritoneal dialysis exchanges effectively increased Kt/V in Chinese anuric CAPD patients. However, the improvement in nPNA correlated inversely with baseline Kt/V. Although increasing the number of exchanges from 3 to 4 per day improved nPNA, increasing the number of daily exchanges beyond 4 may not improve nPNA further.
Maintaining dialysis adequacy and nutritional status is challenging when the patient becomes anuric. Several studies found that increasing the cycle volume (7-9) by using additional nocturnal exchanges with a cycler machine (7,8) or by performing an additional daytime exchange (10-12) improved peritoneal clearance. Does clinical outcome improve as well? There was one recent study (12) showing that increasing the daytime exchange frequency from three to four 2-L exchanges per day improved dietary protein intake, as represented by normalized protein nitrogen appearance (nPNA), and possibly reduced hospitalization. However, the observations were confounded by the concomitant decline in residual renal function during the study period. Therefore, in the present study, we confined our study group to anuric patients to eliminate the confounding effect of residual renal function.
Patients and Methods
Patient Selection
From January to July 1999, we examined 100 stable anuric CAPD patients in our center. Anuria was defined as no appreciable urine output. Because intensifying the dialysis regimen would be necessary in such cases, we did not study patients who were clinically underdialyzed or who had obvious uremic symptoms. We also excluded patients who were unlikely to survive for 6 months, the aim of which was to exclude those patients who had obviously life-threatening conditions, such as disseminated malignancy and severe organ disease (e.g., lung or liver), and those who were in so critical a condition that precluded meaningful dialysis adequacy study.
Baseline data, including age, sex, underlying renal disease, duration on dialysis before enrollment, body height, requirement of a helper for dialysis exchanges, hepatitis B status, presence of diabetes mellitus (DM), and history of cardiovascular disease (CVD; defined as angina, class III to IV congestive heart failure, a history of previous myocardial infarction, cerebrovascular accident, including transient cerebral ischemia, or amputation for vascular disease) were obtained.
This was not a randomized study. A peritoneal equilibration test was not performed before we considered intensifying the dialysis regimen. Patients were asked whether they agreed to have their dialysis regimen intensified. On a voluntary basis, 50 patients had one additional daytime 2-L exchange (i.e., from 3 to 4 or from 4 to 5 exchanges per day). They were called the “intervention group.” The dialysis regimen remained unchanged for the other 50 patients (the “control group”). For the intervention group, patients were educated to adjust their timetable of performing dialysis exchanges so that each cycle would be dwelled for at least 2 hours. The choice of intensifying the dialysis regimen was not affected by a patient's financial constraints.
Clearance Study and Nutritional Assessment
Clearance studies were performed using 24-hour dialysate collections at 0 (prior to the alteration of the dialysis regimen) and 6 months. The method of clearance study has been reported (5). Briefly, the daily drained volume of dialysate was mixed, measured volumetrically, and sent for measurement of urea, creatinine, and glucose concentrations. At the end of the 24-hour collection, body weight was measured and blood samples were obtained for measurement of hemoglobin and serum urea, creatinine, and albumin concentrations. If there was an acute medical problem, such as peritonitis, these study data were obtained at least 1 month after resolution of the problem.
Dialysis adequacy indices in this study are represented by weekly Kt/V and weekly creatinine clearance (wCCr). Net ultrafiltration (UF) was also determined. Creatinine concentration in dialysate was corrected for interference by glucose according to a reference formula determined in our laboratory (13). Serum albumin level was measured using the bromcresol purple method. Dietary protein intake was represented by nPNA, which was calculated using the method described by Randerson et al. (14) and normalized to standard body weight (total body water/0.58). Total body water (V) was determined using Watson et al.‘s formula (15). Percentage lean body mass (%LBM) was determined using the creatinine kinetics method, according to Forbes and Bruining (16), that was described in detail in our previous study (17). Serum albumin concentration, %LBM, and nPNA were used as nutritional parameters in this study.
Outcome Measures
The primary outcomes of the study were dialysis adequacy indices and nutritional status, as detailed above. Secondary outcomes included the total number of days of hospitalization during the 12 months of study period. Transplantation, conversion to hemodialysis, and transfer out of the unit were recorded.
Statistical Analysis
Statistical analysis was performed using SYSTAT 7.0 software (SPSS Inc., Chicago, Illinois, USA). Results are expressed as mean ± SD unless otherwise stated. Serial changes in dialysis adequacy and nutritional parameters from 0 to 6 months were compared to baseline values and examined by paired Student's t-test. A general linear model (18) was constructed to identify independent factors that determined changes in nPNA in the intervention group. The dependent variable was the change in nPNA from month 0 to month 6. Independent variables used for model construction were sex, age, body weight, diabetes status, daily exchange volume at month 0, and Kt/V at month 0. Nonsignificant factors were removed using the backward stepwise method. Mann–Whitney U test was used to compare the duration of hospitalization between groups because the data were highly skewed. Although the literature suggests an improved outcome for patients in the intervention group, it was also possible this group might do worse (because of more frequent complications). As a result, all probabilities were two-tailed.
Results
Demographic and Clinical Data
We studied 100 patients in total. Their demographic and baseline clinical data are summarized in Table 1. Sixty patients were on a 3 × 2-L exchanges per day regimen prior to the study, and 40 patients were having 4 × 2-L exchanges per day. After 1 year, only 39 patients in the intervention group and 40 in the control group remained alive and on CAPD. There was no significant difference in any demographic or background clinical data between the intervention group and the control group.
Demographic and Baseline Clinical Data a
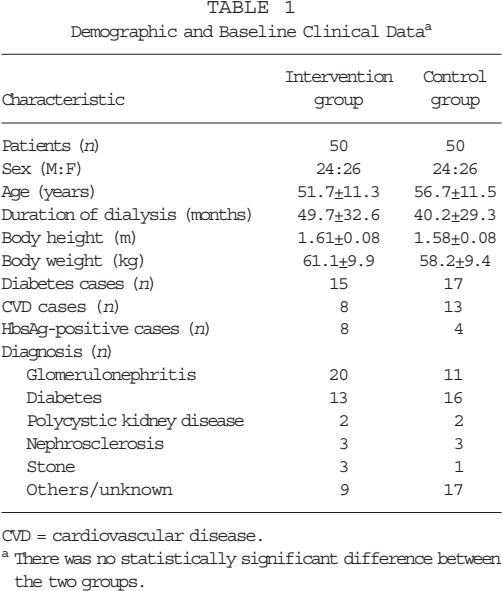
CVD = cardiovascular disease.
There was no statistically significant difference between the two groups.
Dialysis Adequacy and Nutritional Status
Dialysis adequacy indices and nutritional parameters at 0 and 6 months are summarized in Table 2. Baseline dialysis adequacy indices and nutritional parameters at month 0 were comparable between the intervention group and the control group, except for a higher serum creatinine level in the intervention group (1320 ± 246 vs 1150 ± 281 μmol/L, p < 0.05). After 6 months, all adequacy indices and nutritional parameters remained stable in the control group. On the other hand, there were significant increases in net UF, Kt/V, wCCr, nPNA, and %LBM in the intervention group. Serum albumin level, however, remained static.
Dialysis Adequacy Indices and Nutritional Status
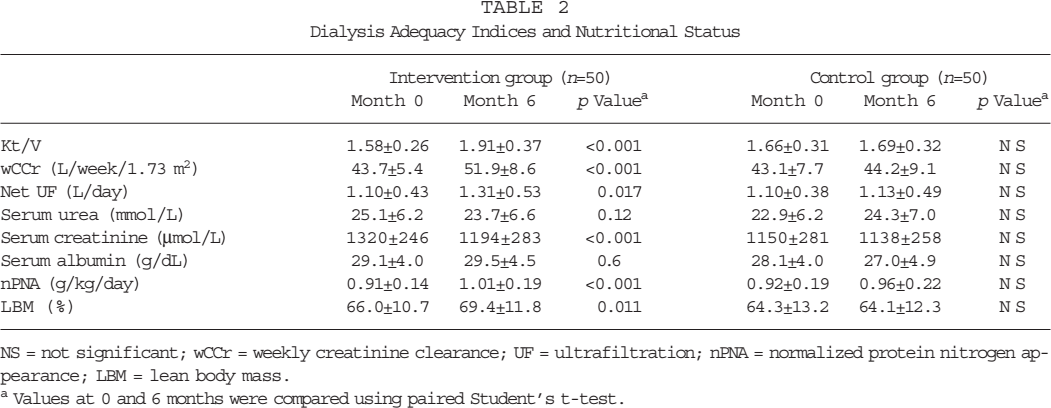
NS = not significant; wCCr = weekly creatinine clearance; UF = ultrafiltration; nPNA = normalized protein nitrogen appearance; LBM = lean body mass.
Values at 0 and 6 months were compared using paired Student's t-test.
Changes in the Intervention Group
The improvement in nPNA in the intervention group was affected by the daily exchange frequency at month 0. In the 30 patients who increased the number of exchanges from 3 to 4 per day, there were significant increases in Kt/V (from 1.61 ± 0.19 to 1.89 ± 0.29, p < 0.001) and nPNA (from 0.87 ± 0.11 to 0.99 ± 0.15 g/kg/day, p < 0.001) at 6 months (Figure 1); serum urea level remained static. Similarly, there were significant increases in wCCr (from 44.2 ± 5.0 to 51.9 ± 8.3 L/week/1.73 m2, p < 0.001) and %LBM (from 62.6% ± 8.5% to 67.3% ± 10.7%, p < 0.001). In the 20 patients who increased the number of exchanges from 4 to 5 per day, there was a significant increase in Kt/V (from 1.74 ± 0.36 to 1.93 ± 0.49, p < 0.001). However, nPNA remained static (from 0.98 ± 0.17 to 1.04 ± 0.26 g/kg/day, p = 0.2) (Figure 2). Similarly, there was a significant increase in wCCr (from 43.0 ± 6.1 to 52.0 ± 9.2 L/week/1.73 m2, p < 0.001); %LBM remained static (from 71.1% ± 10.0% to 72.6% ± 13.0%, p = 0.48).
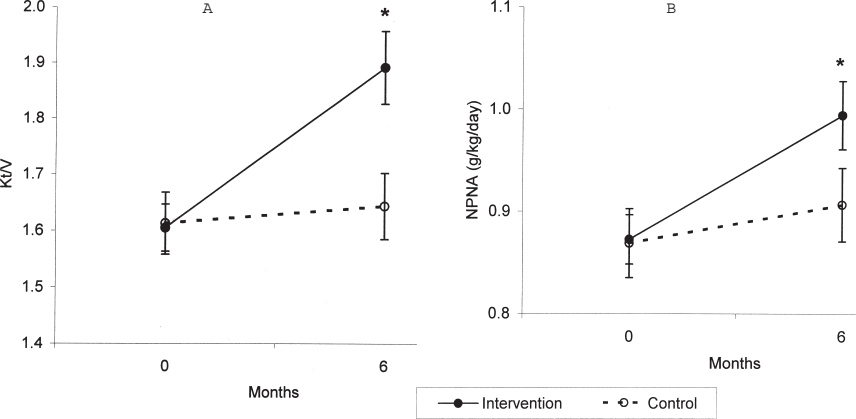
Serial change in Kt/V (A) and normalized protein nitrogen appearance (nPNA) (B) for patients who had 3 × 2-L exchanges at month 0. Error bars denote standard error of mean (SEM).
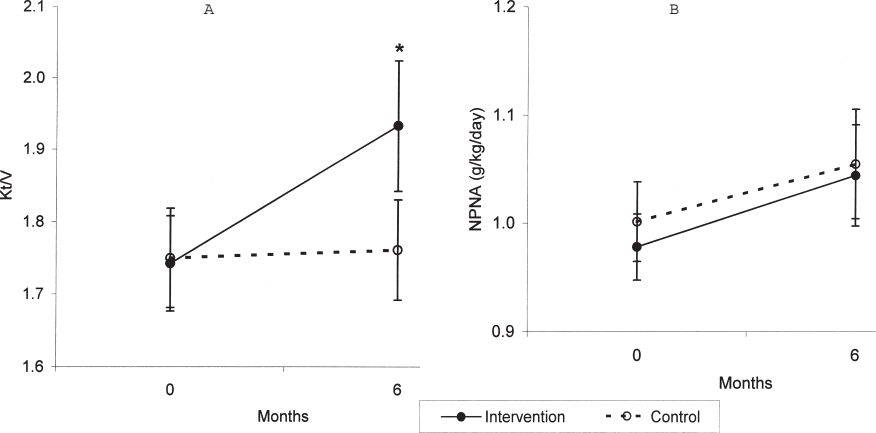
Serial change in Kt/V (A) and normalized protein nitrogen appearance (nPNA) (B) for patients who had 4 × 2-L exchanges at month 0. Error bars denote standard error of mean (SEM).
The change in nPNA from month 0 to month 6 correlated with Kt/V at month 0 (Pearson's r = –0.352, p = 0.012) (Figure 3). Similarly, the change in %LBM had a marginal correlation with Kt/V at month 0 (Pearson's r = –0.282, p = 0.055), although the change did not reach statistical significance. Multivariate analysis using a general linear model showed that age, Kt/V at month 0, and 3 exchanges per day were independent predictors of the change in nPNA.
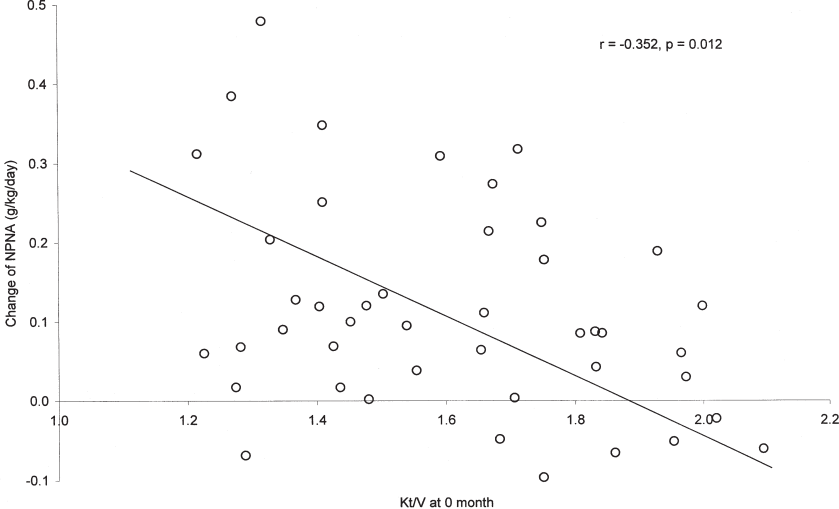
Relationship between change in normalized protein nitrogen appearance (nPNA) (from months 0 to 6) and baseline Kt/V (at month 0) in the intervention group.
Clinical Outcome
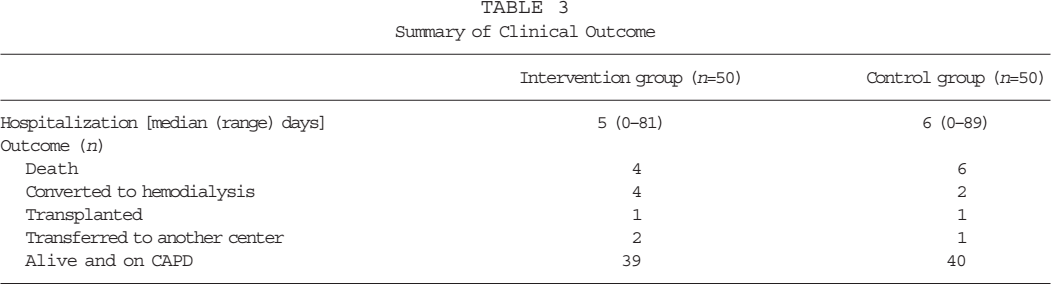
The overall clinical outcome after 12 months of follow-up is summarized in Table 3. There was no difference in duration of hospitalization between the intervention group and the control group (median 5 vs 6 days; Mann–Whitney U test, p = 0.88). In view of the small number of observations, survival analysis was not performed.
Summary of Clinical Outcome
Discussion
In this study, we found that increasing the frequency of dialysis beyond four exchanges per day improved peritoneal clearance but not dietary protein intake. On the other hand, both peritoneal clearance and dietary protein intake increased when the number of dialysis exchanges was increased from three to four per day.
Several studies found that increasing the cycle volume (7-9), using additional nocturnal exchanges with a cycler machine (7,8) or performing an additional daytime exchange (12), improves peritoneal clearance. However, only one study examined the relationship between peritoneal clearance and nutritional status (12). Furthermore, the effect of improving dialysis adequacy indices in previous studies was substantially confounded by the concomitant decline in residual renal function. Our study is, to our knowledge, the first one that examines the relationship between peritoneal clearance and nutritional status in anuric CAPD patients.
As outlined above, there are several methods to increase peritoneal clearance (7-9,12). We prefer performing an additional daytime exchange because increasing infusion volume may increase the chance of mechanical complications, such as hernia (19), and, in Hong Kong, the availability of nocturnal exchanges with a cycler machine is limited by the relatively high cost (20). However, performing an additional daytime exchange relies on patient compliance. Although compliance was not formally assessed in our study, we believe it was satisfactory because we studied mainly motivated patients.
More importantly, the present study was not a randomized study. Patients were allowed to choose whether they accepted an increase in dialysis exchange frequency. On one hand, it is possible that patients who were sick and had more symptoms might have been more likely to agree to the increase in dialysis dosage. However, it is even more likely that healthier, more motivated patients would have agreed to an extra daily exchange. This possibility was suggested by the younger age of the intervention group than the control group, and the smaller body size and higher rate of CVD in the control group. All of these factors would lead to a better clinical outcome in the intervention group than in the control group. Nevertheless, in the present study, the outcome of the intervention group was not significantly better than the control group, especially for patients with higher baseline Kt/V. Our results suggest a genuine lack of benefit from increasing the dialysis dosage.
As nutritional indices, nPNA and %LBM are complicated by mathematical coupling with Kt/V and wCCr, respectively, because all of them were measured and calculated from the same 24-hour urine and dialysate collection (21). The correlations between nPNA and Kt/V in cross-sectional studies may simply reflect the fact that the two parameters are mathematically linked (21,22). Mathematical coupling can also occur in longitudinal studies (23,24), although its importance may not be as great as in cross-sectional studies (22). Our observation that the coupling was only seen with the increase from 3 to 4 exchanges per day and not with the increase from 4 to 5 exchanges suggests a real change in dietary protein intake rather than an effect of coupling. In fact, previous studies in both hemodialysis (25) and peritoneal dialysis (26) found a flattening of the relationship between clearance and protein intake at higher dialysis doses, which is concordant with our findings.
As highlighted in our previous studies, there was a substantial difference in the absolute values of serum albumin in our patient population versus many Western series (3-5,27). Serum albumin in our study was measured using the bromcresol purple method, which gives lower values than the conventional bromcresol green method. However, even when the values were corrected using the formulas suggested by Joseph et al. (28), serum albumin was still low in our patient population. The explanation for this observation remains unclear.
Extrapolation of our data suggests that, when the baseline Kt/V is above 1.9, further increase in peritoneal dialysis dosage would not affect dietary protein intake. Our observation is concordant with other studies of Western populations (26,29) that suggest that the relationship between dietary protein intake and urea clearance is curvilinear, and with that of the National Cooperative Dialysis Study (NCDS) of hemodialysis (25,30). By extrapolating the NCDS data with the peak concentration hypothesis or the equivalent standardized Kt/V model, Gotch predicted that a weekly Kt/V of 1.78 – 2.01 for a continuous therapy would be adequate, and that a weekly Kt/V above this level would not further reduce the relative risk of mortality (31).
Did our study prove that clinical outcome (e.g., mortality and hospitalization) would not be improved by a higher dosage of peritoneal dialysis? Not necessarily. Contrary to the prediction model by Gotch (31), our results show only that dietary protein intake does not increase when the frequency of dialysis goes beyond four exchanges per day. It is possible that a higher peritoneal clearance will reduce mortality or hospitalization without any change in dietary protein intake. Our present study did not have adequate power to detect a difference in mortality or hospitalization between the intervention group and the control group. Based on our results, it is estimated that at least 200 patients are required per group to provide an 80% power for detection of survival benefit (32).
However, our analysis and extrapolation should be interpreted with caution because of the relatively small sample size of our study and the well-reported phenomenon that Chinese dialysis patients have excellent clinical outcome despite a lower dialysis adequacy index (5,33). Therefore, our results cannot be extrapolated to other population groups. The message of our present study is that there may be an upper limit of peritoneal dialysis, above which there is no further improvement in nutritional parameters. This hypothesis requires verification in other population groups.
Footnotes
Acknowledgment
This study was supported in part by the CUHK, research accounts 6901031 and 6901112.