





Abstract
Background
Potential risk factors for 1-year mortality, including the peritoneal component of dialysis dose, residual renal function, demographic data, hematocrit, serum albumin, dialysate-to-plasma creatinine ratio, and blood pressure, were examined in a national cohort of peritoneal dialysis patients randomly selected for the Centers for Medicare and Medicaid Services End-Stage Renal Disease (ESRD) Core Indicators Project.
Methods
The study involved retrospective analysis of a cohort of 1219 patients receiving chronic peritoneal dialysis who were alive on December 31, 1996.
Results
During the 1-year follow-up period, 275 patients were censored and 200 non censored patients died. Among the 763 patients who had at least one calculable adequacy measure, the mean [± standard deviation (SD)] weekly Kt/V urea was 2.16 ± 0.61 and the mean weekly creatinine clearance was 66.1 ± 24.4 L/1.73 m2. Excluding the 365 patients who were anuric, the mean (±SD) urinary weekly Kt/V urea was 0.64 ± 0.52 (median: 0.51) and the mean (±SD) urinary weekly creatinine clearance was 31.0 ± 23.3 L/1.73 m2 (median: 26.3 L/1.73 m2). By Cox proportional hazard modeling, lower quartiles of renal Kt/V urea were predictive of 1-year mortality; lower quartiles of renal creatinine clearance were of borderline significance for predicting 1-year mortality. The dialysate component of neither the weekly creatinine clearance nor the weekly Kt/V urea were predictive of 1-year mortality. Other predictors of 1-year mortality (p < 0.01) included lower serum albumin level, older age, and the presence of diabetes mellitus as the cause of ESRD, and, for the creatinine clearance model only, lower diastolic blood pressure.
Conclusion
Residual renal function is an important predictor of 1-year mortality in chronic peritoneal dialysis patients.
Since the release of the Dialysis Outcomes Quality Initiative (DOQI) guidelines for peritoneal dialysis (PD) in 1997 (1), considerable discussion has occurred regarding the amount of dialysis that should be considered adequate for PD patients (2). At the time the guidelines were written, most of the studies reporting on the relationship between patient survival and delivered PD dose used univariate analyses. They did not analyze the effect of confounding comorbidities on mortality (3-8). An exception to those reports was the CANUSA study, a multicenter prospective study of incident PD patients. In that study, which included patient comorbidities as part of the multivariate analysis, dialysis dose as measured by either urea or creatinine clearance was predictive of mortality (9).
Several studies published after the DOQI guidelines were released have provided additional evidence regarding dialysis dose and risk of mortality. Chatoth et al. (2) demonstrated that PD patients with a weekly Kt/V urea of 1.7 had a higher mortality rate than patients with a weekly Kt/V urea of 2.0. Diaz–Buxo et al. (10) reported on the effect of residual renal function on mortality rates in PD patients. In that study, residual renal function was predictive of mortality; however, neither dialysate Kt/V nor creatinine clearance was predictive of mortality. The observation that urinary clearance, but not dialysate clearance, was predictive of mortality has been replicated in a random sample of PD patients from the southeastern United States (ESRD Network 6, encompassing the states of North Carolina, South Carolina, and Georgia) (11).
We now extend those observations by analyzing a national database—the End-Stage Renal Disease (ESRD) Core Indicators Project (CIP)—from the Centers for Medicare & Medicaid Services [(CMS) formerly known as the Health Care Financing Administration]. In the ESRD CIP, approximately 5% of the adult (≥ 18 years old) PD population are surveyed each year in regard to intermediate outcomes, including dialysis adequacy, anemia management, serum albumin levels. In the present article, we report on the predictors of 1-year mortality for the cohort of PD patients in the 1997 ESRD CIP. Particular attention is given to the effect of residual renal function on 1-year mortality, after correcting for demographics, serum albumin, hematocrit, and blood pressure.
Patients and Methods
A detailed description of the ESRD CIP for PD patients has been previously published (12,13). In brief, a random sample of 1375 adult PD patients alive on December 31, 1996 (approximately 5% of the adult PD population) was identified by CMS for inclusion in the 1997 PD CIP cohort. Analysis was restricted to patients who had not received hemodialysis at any time during the study period, but who had been on PD for part or all of the 6-month reporting interval.
The data abstraction form was used to obtain information on patient demographics, primary diagnosis, and laboratory and clinical parameters for each 2-month interval during the 6-month study period (November – December 1996, January – February 1997, and March – April 1997). Dialysis unit personnel were instructed to obtain the medical charts for each sampled patient and to record all treatment modalities used by the patient [continuous ambulatory peritoneal dialysis (CAPD), cycler, or hemodialysis]. They were also asked to record, for each 2-month period, the first available entry for serum albumin level [including the laboratory method used to determine the results: bromcresol green (BCG) or bromcresol purple (BCP)], hematocrit, systolic and diastolic blood pressure, 24-hour dialysate (volume, urea, and creatinine), 24-hour urine (volume, urea, and creatinine), reported weekly Kt/V urea and creatinine clearance [including the method by which V and body surface area (BSA) were determined], plasma urea and creatinine, and patient weight and height. Completed forms were returned to the respective ESRD Network office for data confirmation and computer entry. The data were then forwarded to CMS for aggregation and analysis.
Measures of dialysis adequacy were obtained from values calculated from raw data. The calculations of weekly Kt/V urea and creatinine clearances were performed by standard methods, using data from 24-hour dialysate and urine collections (1). Creatinine values were not corrected for potential interference by glucose, and no attempt was made to determine the timing of the serum samples used for adequacy measures. For Kt/V urea, residual renal function was calculated using urine urea clearance only. For creatinine clearance, residual renal function was calculated to be the average of the urine urea and creatinine clearances. The V was determined by the method of Watson (14), and body surface area was calculated using the formula by Du Bois and Du Bois (15). Peritoneal equilibration test (PET) data were obtained for cycler patients from the reported dialysate-to-plasma creatinine ratio (D/P Cr). For CAPD patients, if a reported D/P Cr value was not available, it was inferred from the 24-hour D/P Cr (16).
Dates of death and changes in modality (to hemodialysis or transplant) were obtained from standard analytical files from the U.S. Renal Data System (USRDS). During the 1-year follow-up period (May 1, 1997 – April 30, 1998), patients were censored at the time of first change from PD to hemodialysis or to transplant, or upon loss to follow-up. Treatment modality changes were considered under the “60-day rule” that considers only modality changes lasting 60 days or more to be true modality changes.
Data analyses were performed using SPSS for Windows, version 10.0 (17). Analytic methods included the calculation of descriptive parameters, including percentiles for distributions whose mean and median values differed. Comparative testing used the two-tailed Student t-test (assuming equal variances) and chi-square analysis. A two-tailed p value less than 0.05 was considered significant.
Cox proportional hazard analyses were conducted to determine significant predictors for 12-month mortality. Variables entered into the initial model included sex, race (black or white only), age (≥ 65 years vs < 65 years), Hispanic ethnicity, BSA (m2, by quartiles), hematocrit, diabetes mellitus as the cause of ESRD versus all other causes combined, duration of dialysis [categorical value (< 0.5 years, 0.5 – 0.9 years, 1.0 – 1.9 years,≥ 2.0 years) and by quartiles], serum albumin (by quartiles, BCG laboratory method only), systolic and diastolic blood pressure (by quartiles), weekly dialysate and renal Kt/V urea or weekly dialysate and renal creatinine clearance values (as continuous variables and by quartiles), dialysate-to-plasma creatinine ratio, and modality status (CAPD vs cycler). Because of collinearity between values of weekly Kt/V urea and weekly creatinine clearance, separate models were run for each adequacy measure. Forward stepwise and backward stepwise modeling techniques were both employed, using the likelihood ratio statistic. Only predictors with a p value less than 0.01 were retained in the final models. That cut-off point was chosen owing to the multiple comparisons made in the analyses.
Results
Completed data collection forms were returned for 1219 of 1375 (89%) sampled patients. Of these 1219 patients, 1189 (97%) were matched to patients in the USRDS database. Table 1 shows the characteristics of the patients in the linked dataset. A total of 275 patients were censored owing to change in modality [to hemodialysis (n = 167) or to renal transplant (n = 74)] during the first year or loss to follow-up (n = 34). Of the remaining 912 patients, 200 patients (21.9%) expired within 12 months post-study. Among the study patients, 53% (n = 632) were on CAPD, and 34% (n = 401) were on a cycler. The remaining patients were either on both modalities during the 6-month study period, or their modality information was missing.
Demographic Characteristics of the Study Cohort

ESRD = end-stage renal disease.
For patients with data available to calculate weekly Kt/V.
For patients with residual renal function information available.
p < 0.001.
p < 0.05.
Bromcresol green method only.
Patients were more likely to have died during the 1-year follow-up period if they were white rather than black (26% vs 20%, p = 0.06), had diabetes mellitus as the cause of ESRD rather than hypertension or glomerulonephritis (35% vs 23% and 13% respectively, p < 0.001), were 65 years of age or older rather than younger (37% vs 18%, p < 0.001), had a low serum albumin level [< 3.5 g/dL (BCG method) or < 3.2 g/dL (BCP method)] rather than a higher serum albumin value (35% vs 16%, p < 0.001), or were on cycler modality rather than CAPD (29% vs 21%, p < 0.01). No significant difference was noted by sex; approximately 24% of men and of women died during the 12-month follow-up period.
Variables tested for significant association with 12-month mortality in univariate logistic regression analyses included sex, race (black and white only), Hispanic ethnicity, age (in years), primary diagnosis of ESRD, years on dialysis (< 0.5 year, 0.5 – 0.9 year, 1 – 1.9 years, ≥ 2 yrs), BSA (m2) quartile, hematocrit, systolic and diastolic blood pressure, modality (CAPD vs cycler), 24-hour D/P Cr, serum albumin quartile (BCG method only), dialysis prescription information for the CAPD and cycler subsets, calculated weekly dialysate and renal Kt/V urea values, and dialysate and renal creatinine clearance values. Table 2 gives the results of those analyses for non censored patients. Predictors of 12-month mortality included increasing age, diabetes mellitus as cause of ESRD, duration of dialysis (0.5 – 0.9 years), renal Kt/V urea and renal creatinine clearance, low serum albumin level, low diastolic blood pressure, and cycler modality.
Univariate Analysis of Predictors of Death

CI = confidence interval; ESRD = end-stage renal disease; BSA = body surface area; PET = peritoneal equilibration test; BCG = bromcresol green method; BP = blood pressure; CAPD = continuous ambulatory peritoneal dialysis.
All variables significantly associated in the univariate analysis or considered conceptually important were entered simultaneously into two Cox proportional hazard models. Separate models were used for Kt/V urea and for creatinine clearance to prevent problems with collinearity should both variables be entered simultaneously into a single model. Table 3 shows the results of the analyses. Identical final models for Kt/V urea and creatinine clearance were obtained using forward stepwise and backward stepwise modeling techniques. Variables that remained in both final models included age, diabetes mellitus as primary cause of ESRD, and low serum albumin level. For the Kt/V urea model, renal urea clearance, but not dialysate urea clearance, was predictive of 12-month mortality. For the creatinine clearance model, neither the quartile of renal creatinine clearance nor the quartile of dialysate creatinine clearance was predictive of 12-month mortality. However, when the variable for creatinine clearance was forced into the Cox regression model, the lowest quartile of renal creatinine clearance was of borderline significance (p = 0.045) in predicting 1-year mortality. For the renal Kt/V urea model, and for the creatinine clearance model in which creatinine was forced into the model, Figures 1 and 2 show the adjusted hazard ratios for 12-month mortality. Finally, when renal creatinine clearance was entered as a continuous variable into a multivariable model obtained by the backward stepwise modeling technique, the adjusted hazard ratio was also of borderline significance [0.99 (0.98 to 1.00),p = 0.058].
Cox Proportional Hazards Analysis for Predictors of 12-Month Mortality

CI = confidence interval; ESRD = end-stage renal disease; BCG = bromcresol green method; PET = peritoneal equilibration test; BSA = body surface area; BP = blood pressure; CAPD = continuous ambulatory peritoneal dialysis.
Excludes 157 patients who did not have a bromcresol green method measurement of serum albumin.
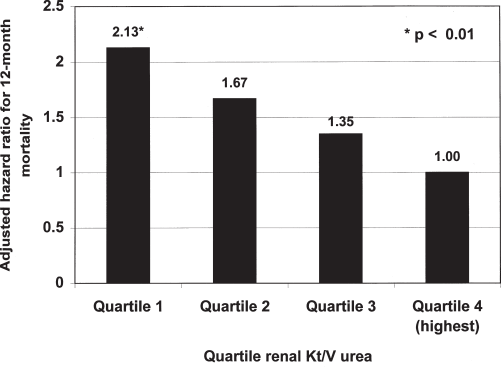
Adjusted hazard ratio for 12-month mortality for renal Kt/V urea.
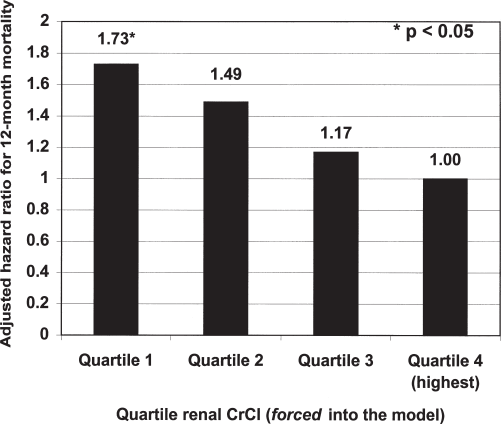
Adjusted hazard ratio for 12-month mortality for renal creatinine clearance.
Discussion
The present study provides additional confirmatory data suggesting that loss of residual renal function is an important risk factor for mortality in chronic peritoneal dialysis patients. Our study is unique in that the patient cohort was derived from a nationwide random sample of chronic peritoneal dialysis patients in the United States. It is similar to other reported studies in its use of multivariate analyses and in the inclusion of patient characteristics and laboratory variables that may affect survival.
The other studies include the CANUSA study, in which risk factors for mortality were analyzed in 680 incident chronic PD patients. The CANUSA investigators found that the risk of death increased by 5% for each 0.1 unit decline in Kt/V urea, and that it increased by 7% for each decrease of 5 L/week/1.73 m2 in creatinine clearance (9). However, the decline in dialysis dose over time that occurred in the CANUSA study was due to a decrease in residual renal function that was not compensated by a concomitant increase in the prescribed peritoneal clearance component (18). A study by Diaz–Buxo et al. (10) followed 2686 chronic PD patients in the United States. They found that residual renal function was strongly associated with survival and that no relationship existed between peritoneal clearances and survival. Each 10-L/week increase in residual renal function was associated with a 12% reduction in the odds ratio for death. In that logistic regression model, other predictors of death included increasing age and the presence of diabetes mellitus.
Finally, ESRD Network 6 investigators reported on a random sample of 1446 chronic PD patients from the states of North Carolina, South Carolina, and Georgia. In that cohort, the investigators found that each 10-L/week/1.73 m2 increase in the urinary component of weekly creatinine clearance was associated with a 40% decreased risk of death, and that each 0.1 unit increase in the urinary component of weekly Kt/V urea was associated with a 12% decreased risk of death. In contrast, neither of the dialysate components (weekly creatinine clearance or weekly Kt/V urea) was predictive of death. Other factors that were associated with an increased risk of death included increasing age, diabetes mellitus as cause of ESRD, and a history of myocardial infarction (11).
Despite the differences in the variables assessed in each of the studies, similar conclusions were reached in all of them. A number of mechanisms have been proposed to explain the findings. First, the PD prescription may not have sufficient variability to demonstrate an effect of dialysis dose on mortality. In our study, as well as in the studies by Diaz–Buxo and Network 6, much more variability was seen in renal clearances than in peritoneal clearances. In the present study, however, the standard deviation for the dialysate Kt/V urea was 0.54, indicating that 23% of the Kt/V values were either greater than 2.37 or less than 1.29. Similarly, the standard deviation for the dialysate creatinine clearance was 15 L/week/1.73 m2, indicating that 23% of the values were either greater than 64 L/week/1.73 m2 or less than 34 L/week/1.73 m2. Thus, the variability in peritoneal clearances in the present study should have been sufficient to determine if those parameters were an important predictor of mortality.
Second, the question of the importance of peritoneal clearance as a predictor of survival has been addressed in several studies. In the ADEMEX study (19), 964 Mexican patients on CAPD were randomized either to a control group receiving four 2-L exchanges daily or to an experimental group where the dialysis prescription was adjusted to achieve a peritoneal creatinine clearance of 60 L/week/1.73 m2. The mean weekly peritoneal creatinine clearances were 46 L/week/1.73 m2 and 57 L/week/1.73 m2, respectively. The 2-year mortality rates in the two groups were 26.9% and 25.4% respectively (p = 0.84). Bhaskaran et al. (20) studied 122 PD patients who had been followed for a median of 16.5 months before and 19.5 months after the development of anuria. Analysis revealed that anuric patients with a weekly Kt/V greater than 1.8 had a significantly lower mortality rate (relative risk: 0.27; 95% confidence interval: 0.09 to 0.79) as compared with anuric patients with a weekly Kt/V of less than 1.8. In addition, a weekly creatinine clearance of more than 50 L/week/1.73 m2 was found to be associated with a 58% reduction in the risk of mortality; however, that decrease was not statistically significant, as the 95% confidence interval was 0.14 to 1.31. A study by Aslam et al. (21) determined that patients who had a Kt/V ≥ 2.0 and a weekly creatinine clearance ≥ 60 L for all measures of adequacy over a 1-year period had patient survival that was different from that of patients who fell below clearance targets at any time point during the 1-year period. The 127 patients who met clearance targets continuously had a higher survival rate than the 132 patients who did not always meet clearance targets (88% vs 68% at 2 years, p = 0.001). In the latter group, patients who met adequacy targets after a prescription change had a better survival rate than did patients who remained below target (86% versus 52% at 2 years, p < 0.001). Comparison of patients who always met adequacy targets versus those who met targets after a change in prescription showed no difference in survival (88% vs 86%, p = NS). Those findings suggest that a decrease in clearance due to a loss of residual renal function can be replaced by an increase in peritoneal clearance without an increase in mortality rate, thus implying that peritoneal and dialysate clearances may be equivalent in terms of risk of mortality. Thus, the findings regarding the effect of the dose of PD on mortality rates are conflicting. Because some of the studies mentioned here have been reported only in abstract form thus far, speculating on the reasons for the disparate results is difficult.
There are several plausible explanations for the importance of residual renal function in predicting mortality. First, patients with residual renal function have a higher urine output and are therefore more likely to maintain euvolemia. Euvolemia reduces volume overload on the cardiovascular system and thereby decreases the potential for adverse effects. In addition, patients with higher urine output are less likely to use hypertonic dialysis solutions to maintain euvolemia. The use of hyperosmotic solutions may be deleterious to the peritoneal mesothelium and to peritoneal macrophages (22). In addition, the production of advanced glycosylation end-products from the glycosylation of submesothelial proteins by glucose may further damage the peritoneum (23). Third, the renal clearance of larger molecular weight molecules is higher compared with peritoneal clearance. This “middle molecule” hypothesis, first proposed in the 1960s for hemodialysis patients (24,25) states that inadequate clearance of larger uremic molecules may result in numerous medical complications, including pericarditis, peripheral neuropathy, and perhaps even increased mortality rates. Little information is available on the middle molecule hypothesis in PD patients, however.
Our study adds to the contradictory literature regarding the effect of peritoneal transport type as a predictor of outcome in chronic PD patients. Cueto–Manzano et al. (26) reported an association between transport type and mortality in patients with diabetes, but no association between peritoneal transport type and mortality in non diabetic patients. In addition, in the diabetic cohort, a strong inverse relationship was also seen between D/P Cr values and serum albumin levels. Those findings are contradictory to the findings noted in the CANUSA study (27). In their multivariate analysis, the CANUSA authors found that the higher transport type was associated with an increased risk of the combined endpoint of technique failure or death. The authors did note, however, that an inverse relationship existed between D/P Cr and serum albumin. The relationship was not linear, but had a cut-off point at a serum albumin level of 3.5 g/dL. Finally, in 100 PD patients followed prospectively in the Netherlands, a high D/P creatinine was seen to be of borderline significance (p = 0.10) for the composite outcome of death, low serum albumin level, low SF-36 physical or mental score, and high hospitalization rate (28).
There are several caveats to the findings from the present study. First, our study is cross-sectional and not longitudinal. A possibility therefore exists that survivorship bias may have affected the study results. Second, the database used for the analysis did not contain other potential risk factors for mortality, including baseline cardiovascular disease, protein and energy intake, and measures of inflammation such as C-reactive protein or serum amyloid A. Third, laboratory data were provided from a number of different sites. To minimize inter-laboratory variability, only serum albumin levels obtained using the bromcresol green method were included in the multivariate analyses. Details on the assays used for serum and dialysate creatinine values were not requested, however. Thus, we were not able to adjust for creatinine values obtained by various laboratory methods.
Conclusion
Residual renal function is a strong predictor of survival in chronic peritoneal dialysis patients. Efforts should be made to preserve residual renal function in those patients by avoiding the administration of nephrotoxins such as contrast dye, non steroidal anti-inflammatory drugs, and aminoglycosides. Additional research is required to more fully understand the protective effects of residual renal function in those patients.
Footnotes
Acknowledgments
This report is dedicated to the 30,000 U.S. PD patients who inspire us to improve our understanding of dialysis. We particularly wish to thank the numerous CMS and regional ESRD Network personnel, as well as the dialysis personnel at more than 600 facilities, whose diligence and conscientious efforts resulted in the success of this project. The data reported here have been supplied by the End Stage Renal Disease Core Indicators Project (ESRD CIP) and the United States Renal Data System (USRDS). The interpretation and reporting of those data are the responsibility of the authors and should not be seen as an official policy or interpretation of the U.S. government. The authors thank Laura Furr for her excellent secretarial assistance.