
Abstract
Objectives
To establish a novel nutritional score based on a series of objective parameters capable of detecting protein-calorie malnutrition in children being treated with chronic peritoneal dialysis (CPD), to test the score in a healthy pediatric population, and to apply it to children on CPD to evaluate their nutritional status.
Study Population
264 healthy school children (mean age 8.69 ± 3.26 years, range 3.05 – 14.98 years) and 29 patients treated with CPD for 1.75 ± 1.02 years (mean age 10.54 ± 6.28 years, range 2.8 – 15.24 years).
Methods
Nutritional status was evaluated by means of three sets of measurements: anthropometric (A1 and A2) and bioimpedance analysis (BIA) measurements. Anthropometry included two sets of measures: set A1 consisted of height (H), weight (W), and body mass index (BMI); set A2 consisted of midarm muscle circumference (MAMC), arm muscle area (AMA), and arm fat area (AFA). The BIA measurements included reactance, phase angle, and distance. All parameters are expressed as standard deviation scores (SDS). Tanner's, Rolland–Cachera's, and Frisancho's data were used as references for H, W, BMI, MAMC, AMA, and AFA; personal data obtained from 551 healthy boys and girls were used for the BIA indices. The nine anthropometry and BIA parameters were given scores of 1 to 5: 5 = > 0 SDS, 4 = ≤ 0 and > –1 SDS, 3 = ≤ –1 and > –2 SDS, 2 = ≤ –2 and > –3 SDS, and 1 = ≤ –3 SDS. Average scores were established for each of A1, A2, and BIA, and then summed to obtain the anthropometry–BIA nutrition (ABN) score. To establish the cutoff value between normal nutritional status and malnutrition, the method was first applied to the 264 healthy children; distribution percentiles were calculated for each area score and the ABN score. The ABN score corresponding to the 3rd percentile was considered the limit of normality and then applied three times to the 29 children on CPD, for a total of 87 nutritional assessments.
Results
The score corresponding to the 3rd percentile in the population of healthy children was 10.33. Among the CPD-treated children, 41.4% of the ABN scores were higher than 10.33 (indicating a state of normal nutrition) and 58.6% were lower (indicating various degrees of malnutrition). Severe malnutrition was found in only 1.1% of the cases. The values of all nine A1, A2, and BIA parameters, as well as serum albumin levels, were significantly higher in patients with an ABN score > 10.33 than in those with a score < 10.33.
Conclusion
The ABN score is a simple and objective method of assessing, in clinical practice, the nutritional status of children on CPD.
Keywords
Protein-energy malnutrition is common in patients on peritoneal dialysis (PD) (1-3), and many studies have indicated that it is a strong predictor of morbidity and mortality (4). As it counteracts growth, malnutrition is even more important in children than in adults (5), but its definition and method of assessment have not been clearly established in patients on chronic peritoneal dialysis (CPD) or on dialysis in general (6,7).
The assessment of nutrition and body composition in children on CPD has been hampered by the insufficient precision, standardization, and even availability of appropriate anthropometric tools. Although a number of recent methodological advances have been made that may facilitate the monitoring of body composition, particularly in pediatric populations (8-10), no single technique is yet considered to be the gold standard (11-13). The parameters derived from anthropometry and bioelectric impedance analysis (BIA) provide a noninvasive and inexpensive way of assessing changes in total body composition (14-18), but there is no consensus as to which technique should be preferred.
In a recent study (19) of objective anthropometric and BIA parameters, we found that differences in measurements obtained using the two techniques made it difficult to draw any definite conclusion about the superiority of either. We suggested that the use of different assessments taking into account different aspects of nutritional status might facilitate the more precise monitoring of body composition (19).
The aim of this study was to seek a novel nutritional score based on a series of objective parameters capable of detecting protein-calorie malnutrition in CPD-treated children. To this end, we designed a score system based on parameters derived from the use of selected objective, reasonably accurate, noninvasive, relatively inexpensive, easily accessible techniques. The score system was first applied to a healthy pediatric population in order to obtain the cutoff value between normal nutritional status and malnutrition, and then the score was used in children on CPD to evaluate their nutritional status.
Patients and Methods
We considered two different pediatric populations: the first consisted of 264 healthy school children, with no intermittent acute or chronic diseases, divided into equal groups by age and sex (mean age 8.69 ± 3.26 years, range 3.05 – 14.98 years); the second consisted of 29 patients (mean age 10.54 ± 6.28 years, range 2.8 – 15.24 years) that had been treated with CPD for 1.75 ± 1.02 years. After being assessed once in the first group, nutritional status was assessed three times in the second group at time intervals of 6 months, for a total of 87 nutritional assessments.
All the patients followed the dietary recommendations for children and adolescents on CPD (20). Dietary protein (DPI) and energy intake (DEI) were calculated by the same dietician, who examined a 3-day diary kept by the children's parents. Mean DPI was 1.54 ± 0.46 g/kg/day [140.36% ± 37.48% of the recommended dietary allowances (RDA) according to height age], and mean DEI was 54.56 ± 21.38 kcal/kg/day (70.58% ± 20.47% RDA), including nutritional calorie supplements whenever required.
Nutritional status was evaluated by means of anthropometric and BIA measurements. Anthropometry included two groups of measures: group 1 (A1) consisted of height (H), weight (W), and body mass index (BMI); group 2 (A2) consisted of midarm muscle circumference (MAMC), arm muscle area (AMA), and arm fat area (AFA), calculated from the measurements of midarm circumference and triceps skinfold thickness according to Frisancho (21). Height was measured to the nearest 1.0 mm by means of a stadiometer, weight to the nearest 0.05 kg with a balance, and triceps skinfold thickness to the nearest 0.2 mm with a Holtain skinfold caliper. Single-frequency BIA was carried out as previously described (19) using a BIA 101S device (Akern, Florence, Italy). To avoid the limitations of equations in calculating total body water and fat-free mass when applied to children on CPD, we used the simple bioelectrical measures of resistance (R) and reactance (Xc), and then calculated phase angle (PA) and distance (D) according to the following formulas: PA = arctan (Xc/R) × 180°/π, and D = (PA × 10 + Xc)/21/2. Resistance itself was not considered a suitable index of nutrition because it only indicates the amount of body fluids.
All parameters were expressed as standard deviation scores (SDS) using the general formula SDS = (x – xi) / Sdi, where x is the individual patient value, xi the median value for the normal population, and Sdi the SD from the normal value. Tanner's data were used as a reference for H and W (22,23), Rolland–Cachera's data for BMI (24), Frisancho's data for MAMC, AMA, and AFA (21), and personal data obtained from measurements made in 551 healthy boys and girls were used for the BIA indices.
The anthropometric and BIA measurements were made by the same observer in both subject groups. In the case of the dialyzed children, they were made in the morning when the patients arrived at the hospital after the end of nightly PD.
The nine anthropometric and BIA parameters (H, W, BMI, MAMC, AMA, AFA, Xc, PA, and D) were given scores of 1 to 5: 5 = > 0 SDS, 4 = ≤ 0 and > –1 SDS, 3 = ≤ –1 and > –2 SDS, 2 = ≤ –2 and > –3 SDS, and 1 = ≤ –3 SDS. An average score was calculated for each of A1, A2, and BIA, and these were summed to obtain the anthropometry–BIA nutrition (ABN) score, which could therefore vary between 3 (worst score) and 15 (best score).
To establish the cutoff value between normal nutritional status and malnutrition, the method was first applied to the 264 healthy children, with the distribution percentiles being calculated for each area score (A1, A2, and BIA) and the ABN score in order to identify the values between the 3rd and 97th percentiles. The ABN score corresponding to the 3rd percentile was considered the limit of normality and was subsequently used to assess the nutritional status of the children on CPD and the distribution of malnutrition.
The data are expressed as mean value ±SD and were statistically analyzed using Student's t-test. A p value of < 0.05 was considered statistically significant.
Results
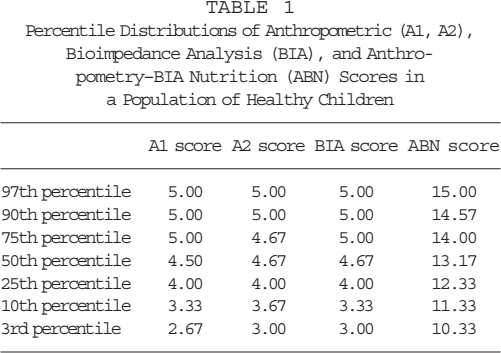
The percentiles of anthropometric, BIA, and ABN scores in the normal population are shown in Table 1. The 3rd percentile was 2.67 for A1, 3.00 for A2, and 3.00 for BIA. The ABN scores corresponding to the 3rd and 97th percentiles were 10.33 and 15.00, which means that all values between them could be considered normal.
Percentile Distributions of Anthropometric (A1, A2), Bioimpedance Analysis (BIA), and Anthropometry–BIA Nutrition (ABN) Scores in a Population of Healthy Children
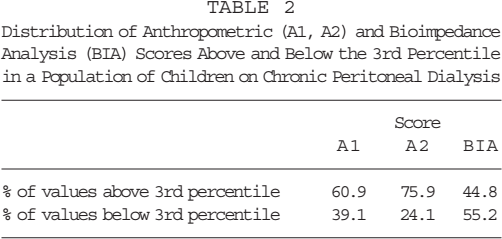
The distribution of the A1, A2, and BIA values above and below the 3rd percentile in the CPD-treated children is shown in Table 2. The percentage of values below the 3rd percentile was higher for the BIA score than for the other partial scores.
Distribution of Anthropometric (A1, A2) and Bioimpedance Analysis (BIA) Scores Above and Below the 3rd Percentile in a Population of Children on Chronic Peritoneal Dialysis
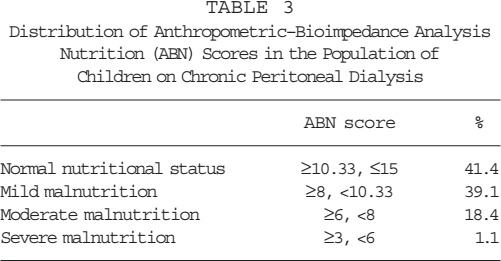
The distribution of the ABN scores is shown in Table 3: 41.4% were higher than 10.33 (thus indicating a normal nutritional status) and 58.6% lower, thus indicating various degrees of malnutrition. Mild malnutrition was defined as a score of 8 – 10.33, since 3% of normal children had ABN scores in this range. Moderate malnutrition was defined as a score of 6 – 8, and severe malnutrition as a score of < 6, since these two classes were significantly different in H, W, and BIA parameters (Table 4).
Distribution of Anthropometric–Bioimpedance Analysis Nutrition (ABN) Scores in the Population of Children on Chronic Peritoneal Dialysis
t-Test for Anthropometric and Bioimpedance Analysis (BIA) Parameters Between ABN Scores of 6–8 and ABN Scores 8–10.33
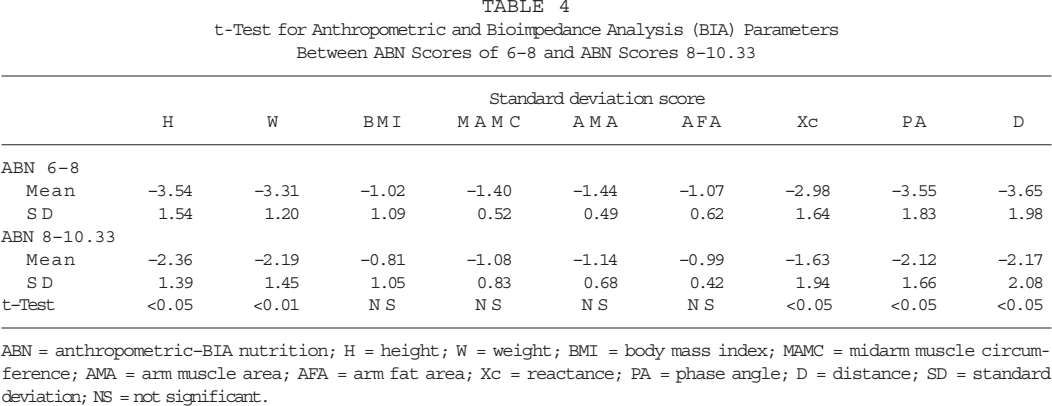
ABN = anthropometric–BIA nutrition; H = height; W = weight; BMI = body mass index; MAMC = midarm muscle circumference; AMA = arm muscle area; AFA = arm fat area; Xc = reactance; PA = phase angle; D = distance; SD = standard deviation; NS = not significant.
The values of all nine A1, A2, and BIA parameters were significantly higher in the patients with an ABN score of ≥ 10.33 than in those with a score of < 10.33 (Table 5). Of the other variables considered in the two groups (age at the start of CPD, duration of dialysis, chronological age, calorie intake, serum albumin levels, and hemoglobin levels), only serum albumin and hemoglobin levels were significantly different (p < 0.05) (Table 6).
t-Test for Anthropometric and Bioimpedance Analysis (BIA) Parameters Between ABN Scores of ≥ 10.33 and ABN Scores < 10.33
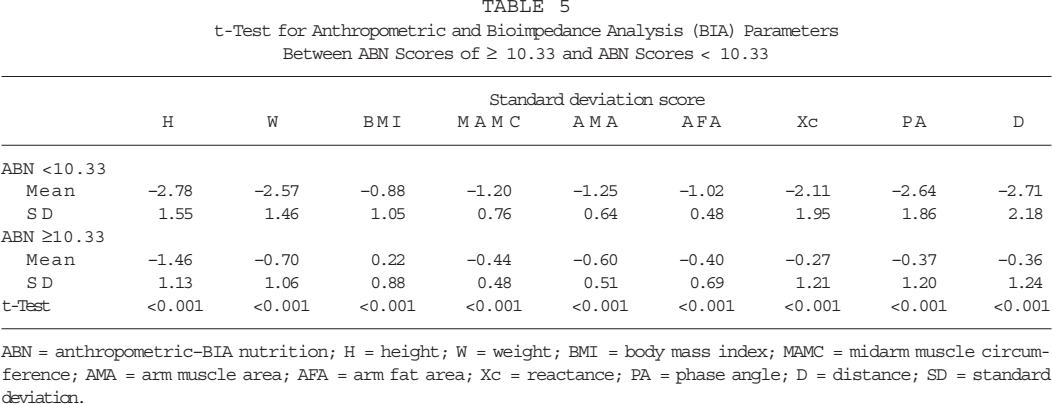
ABN = anthropometric–BIA nutrition; H = height; W = weight; BMI = body mass index; MAMC = midarm muscle circumference; AMA = arm muscle area; AFA = arm fat area; Xc = reactance; PA = phase angle; D = distance; SD = standard deviation.
t-Test for Demographic and Clinical Parameters Between ABN Scores < 10.33 and ABN Scores ≥ 10.33
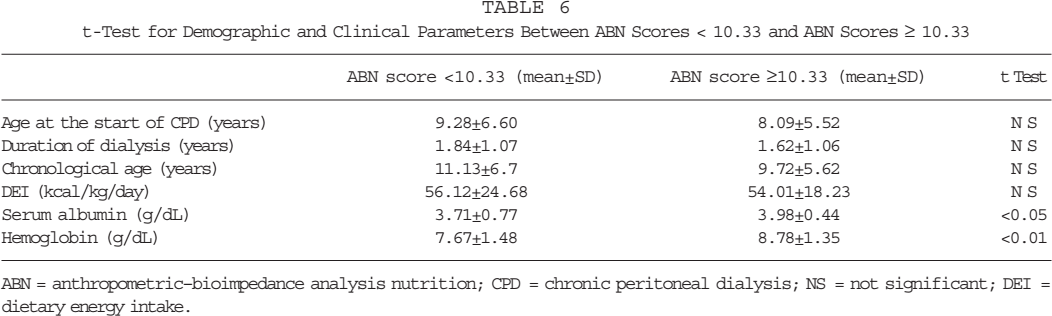
ABN = anthropometric–bioimpedance analysis nutrition; CPD = chronic peritoneal dialysis; NS = not significant; DEI = dietary energy intake.
Discussion
Accurate and sensitive methods of nutritional assessment are essential for the early detection and follow-up of malnutrition. A number of methods have been proposed (6,7), including some based on objective measurements (biochemical and anthropometric methods, and techniques evaluating body composition) and others, such as the Subjective Global Assessment (SGA) score, based on subjective and objective parameters (25,26).
However, although many methods are now available, no single method can clearly identify malnutrition or reliably predict its risk in clinical practice (27). We have recently reported our findings concerning the nutritional status of children at the start of CPD and over the short and long term, as assessed by means of both anthropometry and BIA (19): the percentage of children with malnutrition was significantly higher when assessed by BIA. This confirmed the variability of different nutritional measurement techniques and underlined the need for a more appropriate methodology.
In an attempt to avoid inaccuracies due to reliance on a single diagnostic method, and to take into account the different aspects of malnutrition revealed by the various measurements, we formulated a score system based on both anthropometry and BIA parameters. These methods were selected because they are noninvasive, reliable, inexpensive, and easy to apply to both ill and healthy children (10,18,19). Subjective parameters were not considered because of their intra- and interobserver variability, and the fact that no studies have validated the SGA score in dialyzed children.
In order to establish the cutoff point for defining malnutrition, we first applied the ABN score to a population of healthy children. The reference values obtained (particularly those of the 3rd percentile) allowed us to identify malnutrition and to quantify more objectively the percentage of malnourished children on CPD.
The nutritional status of our children treated with CPD was best expressed by means of the ABN score because the individual area scores (A1, A2, BIA) showed that BIA identifies a larger number of malnourished subjects than anthropometry. These data confirm that the use of the ABN score (which includes nine parameters covering all three areas) leads to a more objective assessment of nutritional status as it takes into account differences between the individual area scores.
As far as the prevalence of malnutrition is concerned, cross-sectional studies have found signs of malnutrition in anywhere from 15% to 56% of adult patients on CPD (1,2). This wide range of variability probably depends more on the definition of malnutrition and the methods used to assess it than on the different compositions of patient populations.
We found that 58.6% of our patients were malnourished based of their ABN scores of less than 10.33. The percentage of patients with scores suggesting severe malnutrition according to our criteria was very low (1.1%), whereas moderate and mild malnutrition were equally distributed. Our data concerning the prevalence of malnutrition are in line with the highest figures reported in the literature for CPD-treated adults and children (1,2,19,28). It must be borne in mind that BIA is also more sensitive than other techniques in revealing mild body composition derangements (18,19), and this may explain the distribution of the ABN values of malnutrition in our series.
Finally, the two subgroups with ABN scores of more or less than 10.33 were clearly different because, not only were all nine anthropometric and BIA parameters significantly different, but also their serum albumin values were significantly different. Among the various nutrition-related indices considered in the statistical analysis, it is also worth noting that serum albumin best predicted the ABN scores.
In conclusion, the ABN score is a simple method based on objective parameters that allows the nutritional status of children undergoing CPD to be assessed in clinical practice. Validation studies in larger pediatric populations are needed to confirm its reliability and accuracy.
Footnotes
Acknowledgment
The authors acknowledge the financial support of the Associazione per il Bambino Nefropatico (ABN), Milan, Italy.