
Abstract
Background
Erythropoietin (EPO) deficiency of chronic renal failure (CRF) may be a functional consequence of decreased glomerular filtration rate and fractional reabsorption of sodium (FRNa). Decreased FRNa reduces renal oxygen consumption and increases tissue oxygen pressure, resulting in less EPO production. We hypothesized that, in CRF patients, there is a positive relationship between EPO production and FRNa and that, in such patients receiving EPO, a negative correlation is expected between FRNa and EPO dose.
Methods
Creatinine clearance, FRNa, serum iron, transferrin, transferrin saturation, ferritin, and intact parathyroid hormone (iPTH) levels were measured in 91 peritoneal dialysis patients. The correlation between EPO dose and FRNa was studied.
Results
Mean EPO dose was 7076 ± 4821 units/week and mean FRNa was 93.40% ± 6.14%. A negative correlation was found between EPO dose and FRNa (r = -0.28, p < 0.01), and a positive correlation was found between both ferritin and iPTH and EPO dose (r = 0.39, p < 0.001 and r = 0.35, p < 0.002 respectively). After adjusting for the effect of creatinine clearance, ferritin, and iPTH, there was still a significant correlation between EPO dose and FRNa (p < 0.05).
Conclusion
In CRF patients there is a negative correlation between FRNa and EPO dose, which supports the hypothesis that EPO deficiency may be related to the decreased renal oxygen-consuming work of sodium reabsorption.
Keywords
Erythropoietin is produced primarily by the peritubular fibroblasts of the renal cortex in response to tissue hypoxia (11-13). Tissue oxygen pressure is of central importance in EPO production and depends on the balance between oxygen supply and demand (4,14,15). In the kidneys, more than 75% of oxygen consumption occurs in a direct relationship with sodium reabsorption (16). Sodium reabsorption itself depends on renal blood flow and GFR, that is, the greater the renal blood flow, the greater the GFR and Na reabsorption (16). In CRF, the fractional reabsorption of sodium (FRNa) is decreased (17) together with the attendant diminished oxygen consumption and increase in renal tissue oxygen pressure (18). It has been hypothesized that, in CRF patients, along with the decrease in GFR and the consequent decline in FRNa, tissue oxygen consumption decreases and tissue oxygen pressure increases to a level above the trigger point for EPO production. This can lead finally to the development of the functional component of EPO deficiency (10).
In the light of this hypothesis, we presumed that, in CRF patients, there should be a positive relationship between endogenous EPO production and FRNa. Further, if patients are receiving exogenous EPO, there should be a negative correlation between FRNa and the EPO dose that indirectly reflects endogenous EPO production. This study evaluates the relationship between EPO dose and FRNa in a cohort of peritoneal dialysis (PD) patients with various levels of residual renal function (Figure 1).
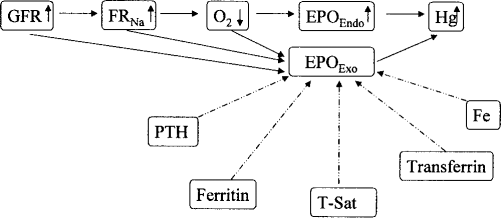
Rationale for the study of the relationship between fractional reabsorption of sodium (FRNa) and erythropoietin dose (EPOExo) as an indirect measure of endogenous erythropoietin level (EPOEndo). GFR = glomerular filtration rate; O2 = tissue oxygen pressure; Hg = hemoglobin; PTH = parathyroid hormone; T-Sat = transferrin saturation rate; Fe = serum iron.
Methods
Patient Selection
Between August and November 2001, all prevalent PD patients of the Home Peritoneal Dialysis Unit of Toronto Western Hospital were studied. As part of their routine care, they collect 24-hour urine samples for estimation of creatinine and urea clearances on a regular basis. Patients were excluded from the study if they had less than 100 mL of urine in 24 hours. Demographic data and the EPO dose at the time of the study were collected from the charts. For this study, Na was also measured in the 24-hour urine and FRNa was calculated. Sodium, creatinine, and hemoglobin levels were measured at the end of urine collection. Serum levels of iron, ferritin, transferrin, transferrin saturation, and intact parathyroid hormone (iPTH) done within 1 month of the urine collection were collected from the charts.
Estimates of Renal Function
Glomerular filtration rate was estimated with two clearance formulas. First, creatinine clearance (CrCl) was calculated using urinary clearance measurements and serum creatinine values. As increased tubular secretion of creatinine in CRF patients decreases the validity of CrCl for estimation of GFR, the mean of urea and creatinine clearances was calculated to determine the GFR, denoted as GFRmean.
FRNa was determined according to the following formula and CrCl was used as GFR:
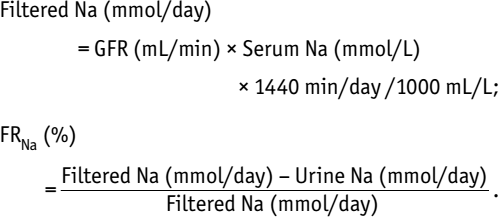
FRNa was also calculated using the GFRmean and was called FRNa-GFRmean.
Hemoglobin Targets
As part of the routine clinical practice, EPO is administered to achieve a hemoglobin concentration of 11 – 12 g/dL. In spite of this, patients had achieved a wide range of Hb levels. To consider the differences in Hb levels, the product of EPO dose and Hb level adjusted to 12 g/dL, that is, the EPO dosexHb/12 interaction term, was also used in univariate and multivariate analyses as the dependent variable.
Laboratory Analysis
Hemoglobin was determined by Cell Dyne 3500 system (Abbott Laboratories, Abbott Park, Illinois, USA). Serum and urine creatinine were measured by ADVIA 1650 Chemistry System (Bayer Diagnostics, Tarrytown, New York, USA), by enzymatic reaction of Tanganeli and Jaffe method, respectively. Sodium was measured by ADVIA 1650, indirect ion-selective electrode method. Blood and urine urea were measured by ADVIA 1650, Roche enzymatic reaction. Serum iron and transferrin levels were determined by ADVIA 1650. Urine and serum ferritin levels were measured by ADVIA Centaur System (Bayer Diagnostics), direct chemiluminometric technology. Serum iPTH level was measured by Immulite analyzer (Diagnostic Products, Los Angeles, California, USA) with Immulite 2000 intact iPTH assay, using two-site chemiluminescent enzyme-labeled immunometric method.
Statistical Analysis
Quantitative data are expressed as mean ± SD. Tests of normality were done for continuous data to ensure the validity of parametric analyses. Pearson correlation was used for evaluation of correlation between continuous values. T-test was used for comparison of mean values between independent groups. Multiple linear regression analysis was used to adjust the effect of possible confounding factors on the correlations. A p value was considered significant if less than 0.05.
Results
Urine collection and laboratory measurements were performed completely and calculation of FRNa was feasible in 91 patients [49 (54%) male, 42 (46%) female; mean age 61 ± 17 years (range 25 – 92 years); mean duration on PD 25 ± 23 months (range 0.7 – 101 months)]. Table 1 shows the demographic data. Fifty-one patients were on continuous ambulatory PD and 40 on continuous cycler PD. The most frequent causes of renal failure were glomerulonephritis, in 27 patients (30%), diabetes mellitus in 18 patients (20%), and hypertension in 12 (13%). Twenty-six patients (29%) were diabetic at the time of the study, although 8 had other causes of end-stage renal disease (ESRD). Eighty-two patients were receiving EPO.
Demographic Characteristics of Ninety-One Peritoneal Dialysis (PD) Patients
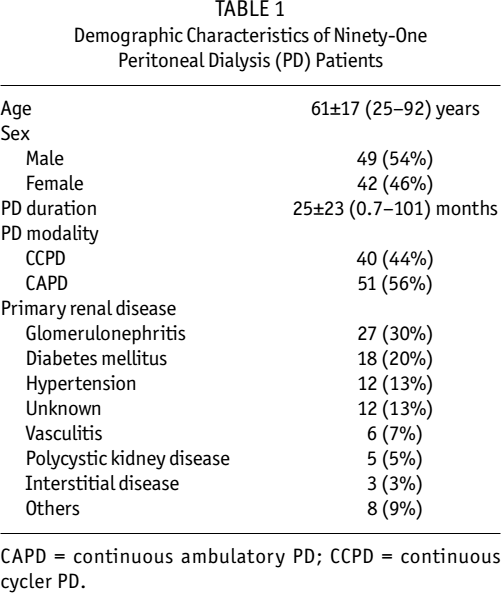
CAPD = continuous ambulatory PD; CCPD = continuous cycler PD.
Table 2 details the hematological and renal parameters of the study patients. In the 82 patients who were receiving EPO, EPO dose was between 2000 and 30000 units/week (mean 7076 ± 4821 U/week). FRNa ranged between 69.96% and 99.75% (mean 93.40% ± 6.14%), CrCl was 0.4 – 18.2 mL/minute (mean 5.4 ± 4.3), GFRmean 0.3 – 16.0 mL/min (mean 4.2 ± 3.3 mL/min), FRNa-GFRmean 69.93% – 99.62% (mean 92.17% ± 6.39%) (Table 2). In spite of the standard clinical salt restriction, there was a wide range of Na excretion (1 – 125 mmol/24 hours). Fifty patients were receiving diuretics (furosemide in all but 1) at the time of urine collection. Mean FRNa did not differ according to the use of diuretics (93.81% ± 5.69% vs 92.91% ± 6.69%, p = 0.49, diuretic vs non-diuretic group, respectively).
Hematological and Renal Parameters in Ninety-One Peritoneal Dialysis Patients
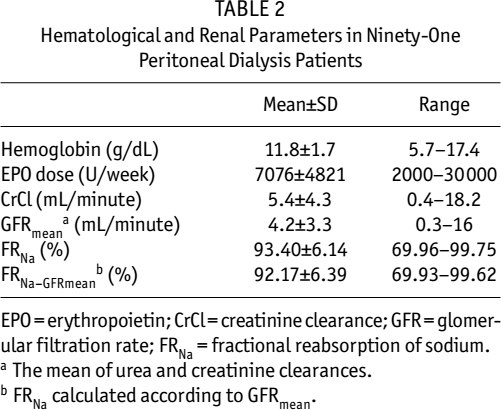
EPO = erythropoietin; CrCl = creatinine clearance; GFR = glomerular filtration rate; FRNa = fractional reabsorption of sodium.
The mean of urea and creatinine clearances.
FRNa calculated according to GFRmean.
Negative correlations were found between EPO dose and FRNa (r = -0.28, p < 0.01), EPO dose and FRNa-GFRmean (r = -0.30, p < 0.005), and EPO dose and CrCl (r = -0.37, p < 0.001) (Table 3 and Figure 2). There was a positive correlation between CrCl and FRNa (r = 0.32, p < 0.005).
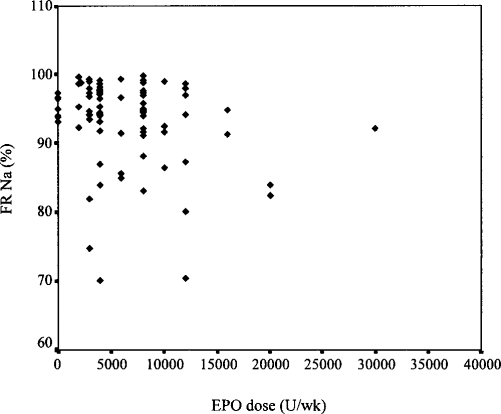
Correlation between fractional reabsorption of sodium (FRNa) and erythropoietin (EPO) dose in 91 peritoneal dialysis patients.
Univariate Analysis of Erythropoietin Dose Versus Variable
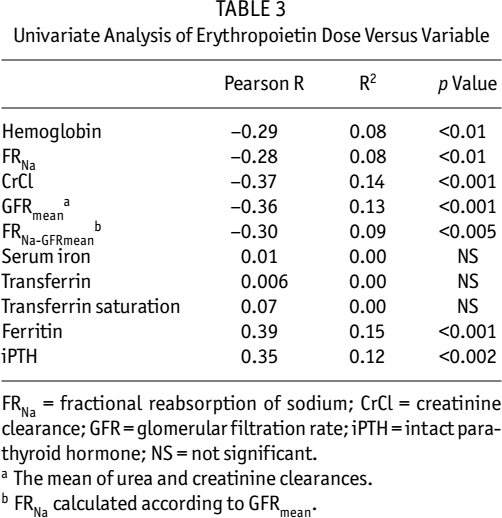
FRNa = fractional reabsorption of sodium; CrCl = creatinine clearance; GFR = glomerular filtration rate; iPTH = intact parathyroid hormone; NS = not significant.
The mean of urea and creatinine clearances.
FRNa calculated according to GFRmean.
No relationship was found between EPO dose and either serum iron, transferrin, or transferrin saturation. However, a significant positive correlation was found for both ferritin and iPTH levels versus EPO dose (r = 0.39, p < 0.001 and r = 0.35, p < 0.002 respectively) (Table 3). The EPO dosexHb/12 interaction term had a significant negative correlation with CrCl (r = -0.33, p < 0.002) and FRNa (r = -0.28, p < 0.01), as well as with FRNa-GFRmean (r = -0.31, p < 0.005) (Table 4).
Univariate Analysis of the Erythropoietin Dose x Hemoglobin/12 Versus Variable
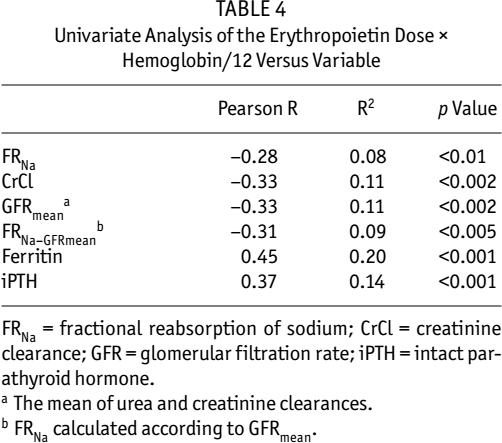
FRNa = fractional reabsorption of sodium; CrCl = creatinine clearance; GFR = glomerular filtration rate; iPTH = intact parathyroid hormone.
The mean of urea and creatinine clearances.
FRNa calculated according to GFRmean.
Multiple regression analysis was performed to assess the effect of the multiple factors that might confound the relationship between FRNa and EPO dose. As FRNa and FRNa-GFRmean were basically the same, only FRNa was used in the multiple regression model. After adjusting for CrCl, ferritin, and iPTH, the inverse relationship between EPO dose and FRNa persisted (p < 0.05) (Table 5). The same relationship was demonstrated for EPO dose and FRNa-GFRmean. Likewise, in multivariate analysis, there was a statistically significant correlation between EPO dosexHb/12 interaction term and FRNa (p < 0.02) (Table 6).
Multiple Regression Analysis of Factors Affecting Erythropoietin (EPO) Dose in Ninety-One Peritoneal Dialysis Patients [Dependent Variable: EPO dose (U/week), R= 0.576, R2=0.332, p for model 0.001]

FRNa = fractional reabsorption of sodium; CrCl = creatinine clearance; iPTH = intact parathyroid hormone.
Multiple Regression Analysis of Factors Affecting Erythropoietin (EPO) Dose x Hemoglobin/12 in Ninety-One Peritoneal Dialysis Patients [Dependent Variable: (EPO dosexHb/12), R=0.603, R2=0.363, p for model <0.001]
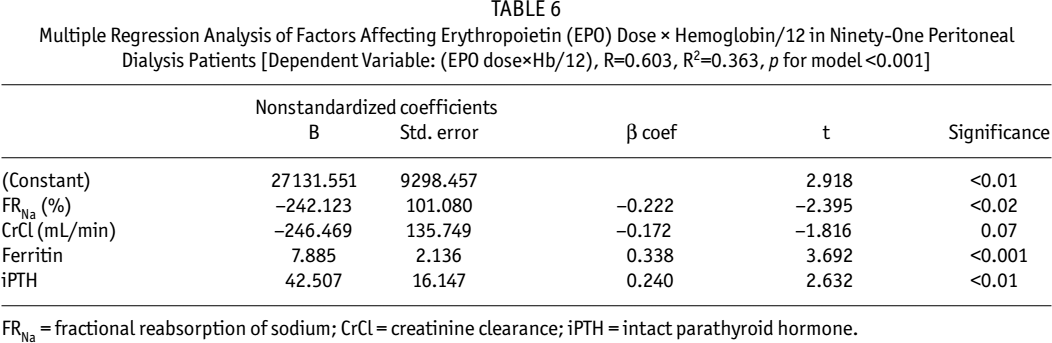
FRNa = fractional reabsorption of sodium; CrCl = creatinine clearance; iPTH = intact parathyroid hormone.
No correlation was found between Hb and FRNa. No difference was found in mean Hb, mean EPO dose, or mean FRNa between diabetic versus nondiabetic patients (data not shown).
Discussion
It is proposed that EPO deficiency of CRF may be a functional consequence of the decrease in GFR and subsequent decline in FRNa and oxygen demand in renal tissue, increasing the tissue oxygen level above the trigger point for EPO production (10). In patients receiving EPO, total serum EPO is the sum of endogenous and exogenous EPO. This is the first study designed to evaluate the relationship of EPO dose as an indirect reflection of endogenous EPO production and FRNa in a group of ESRD patients on PD with variable degrees of residual renal function.
In patients with non-renal anemia, there is an inverse relationship between Hb concentration and serum EPO level (6,19,20). However, in anemia associated with CRF, there is no increase in EPO level (6) and EPO levels generally remain within, slightly above, or even below the normal range of non-anemic individuals (21). There appears to be even a positive correlation between EPO and Hb in ESRD, suggesting that EPO is the limiting factor in the erythropoietic pathway (21). However, other studies have demonstrated no relationship between serum EPO concentration and hematocrit, or with plasma creatinine, in patients with renal failure (22). The severity of anemia was found to be inversely related to the degree of impaired renal function, as indicated by the hematocrit and serum creatinine concentration. In this study, most patients were receiving exogenous EPO titrated to a fixed target Hb of 11 – 12 g/dL. So it was not possible to determine the relationship between EPO level and renal function. On the other hand, on examining the relationship between EPO dose and Hb, no correlation was found. Erythropoietin dose did, however, have a significant negative correlation with both CrCl and GFRmean (Table 3). This finding demonstrates the greater severity of anemia in higher degrees of renal dysfunction, even at low levels of renal function seen in patients with ESRD, and may provide further evidence that EPO production is maintained in patients with ESRD.
A few studies have reported the correlation of serum EPO and FRNa. Decreased FRNa has been previously shown in type I diabetic patients with hyporeninemic hypoaldosteronism and in those who receive angiotensin-converting enzyme inhibitors versus controls (23). These patients had also lower Hb concentrations caused partially by low serum EPO levels. Further, it has been shown that, with decreased proximal Na reabsorption, EPO production is decreased. Examining the possible correlation between EPO production and proximal tubule function, Eckardt and colleagues showed that acetazolamide, a diuretic inhibiting Na reabsorption in proximal tubule, inhibits hypoxia-induced EPO production in mice (24). Furosemide, hydrochlorothiazide, and amiloride, acting on more distal nephron segments, had no effect on EPO production. In a previous study on a group of patients with different degrees of CRF, no correlation was found between CrCl and serum EPO level unadjusted for hematocrit (25). There was, however, a significant positive correlation between CrCl and the ratio of observed-to-expected serum EPO level (r = 0.62, p < 0.00008) and also between FRNa and the same ratio (r = 0.47, p < 0.005).
Creatinine clearance was used as an estimate of GFR and FRNacalculated according to this index. As GFR calculated according to the mean of creatinine and urea clearances (GFRmean) has been suggested to be more accurate in advanced renal failure, FRNa was also examined using the mean of creatinine and urea clearances (GFRmean) as FRNaGFRmean. These estimates also demonstrated the inverse relationship of FRNa and EPO dose as well as with EPO dose adjusted for Hb level (EPO dosexHb/12). It should be noted that both estimates are influenced by limitations of urine collection and the noninvasive methods of estimating GFR used in this study.
The relatively small contribution of FRNa in determining EPO dose in this study speaks to the multiple factors that affect the EPO dose required to generate a target Hb level in chronic renal disease. For example, inflammatory states, iron status, and nutrition status all affect the responsiveness of the erythroid progenitors to EPO. The direct relationship of ferritin and EPO dose in this study would suggest that inflammatory processes are operational in modulating ferritin levels as an acute-phase reactant. Second, as the FRNa only affects the endogenous contribution of EPO, it accounts for only a small proportion of the variance in EPO dose (Table 3). Further, volume expansion in CRF may add to the reduction in GFR in decreasing the FRNa and hence further diminish endogenous EPO.
Conclusion
In CRF, EPO deficiency may be partially functional and related to the decreased renal oxygen-consuming work of the Na reabsorption. The negative correlation of FRNa and EPO dose demonstrated in this study provides evidence that supports this hypothesis. Notwithstanding the need for supplemental renal replacement therapy, the ongoing role of native kidneys in EPO production is emphasized. Efforts to preserve the residual kidney function will facilitate both the clearance and the endocrine functions of the kidneys. This is particularly helpful in places where the availability of therapeutic EPO is limited.