
Abstract

Glucose. Their Treatments, and Their Current State in Our Peritoneal Dialysis Program
Background: Diabetic nephropathy is the most frequent diagnosis in the patients (pts) on peritoneal dialysis (PD) in our hospital (60%). A small percentage of these do not require treatment for the control of its glucose; the rest require treatment either with intermediate insulin, regular intraperitoneal (IP) insulin, oral medication, or mixes of these.
Study Type: It was carried out an observational transverse study to know the level of glucose, the treatment types, and the doses used in pts of the PD program.
Material and Methods: The information was taken from the registration of each pts Kardex, the data of each pt was taken from the last registered control. All those active pts in our program from March 2004 to May of the 2005 were included. Population: 191 Kardexes were revised of pts, its age average was of 54.2 years, 61.7% corresponded to pt with diagnostic of diabetic nephropathy (118) and 38.3% to other pathologies (73). In relation to the technique, 47% were in CAP D an d 5314 in automated PD.
Results: The diabetic pts 20.3% use oral medication (24), 50% inter-mediate insulin (59), and 33% IP quick insulin (39), 1.6% glargine insulin (2). 5% glitazone (6), and 24.5% do not require treatment (self-control). The level of all the diabetic pts’ glucose was 136.8, the average of the values registered in the group of pts in oral treatment was 126.8, and in those with insulin intermediate 150.9 and 155.9 in those that use IP insulin. On the average, the pts use per day 28.8 Units of intermediate insulin. 61.2 Units daily of quick insulin, 2.1 daily pills of tolbutamide, 2.5 daily pills of glibenclamide and in those with glitazone, 1.5 pills per day.
Conclusions: The serum levels of glucose in fast are below the goal settled down in the program (140). The patients with oral medication have a smaller average and the use of IP regular insulin helps in the control of the glucose.
Alcaraz H.S.B., Romero A.E.L., Hospital Regional, Dr. Valentin Gomez Farias del Issste, Zapopan, Mexico.
Diverging Metabolism of Glucose and Lipids in Patients Starting Peritoneal Dialysis and Hemodialysis: A Longitudinal Study
Several studies have shown that peritoneal dialysis (PD) is associated with increased fat mass, presumably due to the glucose content of the dialysate. However, the impact of this energy surplus on glucose intolerance and lipid metabolism remains unknown. In a post hoc analysis of nondiabetic chronic kidney disease patients starting dialysis, we evaluated patients that completed 1 year of therapy. Thus, in 116 patients [on either PD (63 patients) or hemodialysis (HD; 55 patients)], we evaluated markers of glucose and lipid metabolism. At baseline, the proportion of males (58% vs 68%, PD vs HD), age (54±11 vs 53±12 years), presence of malnutrition (Subjective Global Assessment, 32% vs 27%), and clinically overt cardiovascular disease (36% vs 31%) did not differ between both groups. The PD group had lower body mass index (24.4±3.94 vs 26.3±4.8 kg/m2; p<0.05) and higher glomerular filtration rate (6.7±2.3 vs 5.5±1.9 mL/min, p<0.05). During the first year, we measured changes in several blood markers.
We conclude that while HD patients tend to lose body mass, PD patients maintain or gain body mass during the first year of therapy. Furthermore, initiation of HD is associated with increased glucose intolerance and circulating HDL levels, while initiation of PD tends to increase serum triglycerides, presumably due to an increased availability of energy.
Axelsson J., Avesani C., Carrero J.J., Stenvinkel P., Heimbürger O., Lindholm B., Karolinska Institutet, Stockholm, Sweden.
Evaluation of Micronutrient Intake from Diet of Peritoneal Dialysis Patients
Arms: To describe the micro nutrient (iron, potassium, magnesium, calcium, phosphorus, zinc, vitamins A, B1, B2, B6, B12, niacin, folic acid) intake from diet of peritoneal dialysis (PD) patients (pts), as well as to compare nutrient intake according to nutritional status. Methods: Crossover study performed in 73 pts; all of them had clinical, biochemical, and nutritional evaluations. Nutritional evaluation was performed by the Subjective Global Assessment (SGA), 24-hour dietary recall, and biochemical and anthropometric parameters. Pts were classified as well nourished (normal) and with sore degree of malnutrition (malnourished) according to SGA. Results: Main results are shown in the Table. Conclusions: PD pts had a lower intake of macro- and micronutrients than recommended, specially of calcium, zinc, vitamins B2, B6, C, niacin, and folic acid. This lower intake was more evident in those pts with some degree of malnutrition.
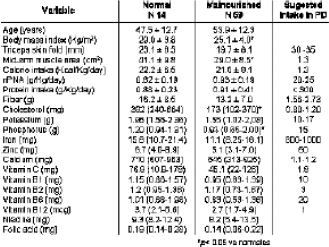
Batis C., Martin-del-Campo F., Nava D., Rojas-Campos E., Angel-Zuniga J.R., Camacho R., Cueto-Manzano A.M., Unidad de Investig Méd en Epidemiol Clin, Hosp de Especialidades, CMNO, IMSS, Guadalajara, Mexico.
Keto-Analogues in CAPD Patients
Objective: Outcome of keto-analogue (KA) supplementation in CAPD patients (pts). Methods: 20 CAPD pts were included in the study. 10 subjects were in the keto-supplemental group (G-KA) and 10 subjects in the dietary intervention group (G-DI). Nutritional health assessment was carried out using 7-day dietary recall, food frequency questionnaire, appetite questionnaire. SF-36 questionnaire, anthropometry, and bioelectrical impedance analysis. Biochemical investigations included lipid profile, blood sugar levels, and renal function tests. Protein intervention: G-KA had 0.4 g/kg/d protein in the form of KA and 0.8 g/kg/ d protein as dietary protein, and G-DI had 1.2 g/kg/day as high BV protein, failure. Baseline values (mean±SD); age 55±10 years, height 1.7±0.1 m, weight 70±12.5 kg, SBW 87±33.5%, and body mass index 25±3.4 kg/m. The outstanding results observed are for serum lipids, fasting blood sugar levels, serum albumin levels, appetite questionnaire, and in anthropometry. In G-KA, serum cholesterol levels improved from 225.5±16.3 (pre) to 113.5±2.1 mg/dL (post), and in GDI, the levels increased from 166±2.8 (pre) to 172.5±16.3 mg/dL (post). Similarly for fasting blood sugar levels. G-KA showed improved levels 225.5±16.3 (pre) to 113.5±2.1 mg/dL (post), and in G-DI the decrease was not significant 279±69.7 (pre) to 252.5±26.2 mg/dL (post). Serum albumin levels in G-KA improved from 2.5±0.1 (pre) to 3.9±0.1 g/dL (post), and in G-DI they were maintained 2.5±0.1 (pre) to 2.55±0.2 g/dL (post). The appetite screening questionnaire showed an improved score, from 20 to 29 in G-KA (above 28 there is no risk), and for G-DI the score improved from 20 to 24. Anthropometry showed improved arm muscle areas from 21±2 to 24±1.2 cm2 in G-KA, and in G-DI the increase was not evident 22±2.2 to 22.8±3.2 cm2. Discussion and Conclusion: Dietary intervention although the simplest and the universally approved method of protein supplementation, failed to improve the chronic disease risk “actor profile and nutritional health markers in the present study. Foods that are good sources of high biological value proteins are also good sources of saturated fats and carbohydrates, which in turn increase the chronic disease risk. These high-density diets induce more satiety and fullness thus decreasing appetite and affecting the overall nutritional well being. Supplementation of amino acids would help in long-term maintenance and ensure optimum nutritional health status
Brundavani V., Nayak K.S., Sinoj A., Mary B., Kanchana D., Subramanyam S.V., Global Hospital, Hyderabad, India.
What Are Key Factors for Malnutrition in Peritoneal Dialysis Patients from a 3-Year Longitudinal Study?
Objective: To investigate the most important factors for malnutrition among continuous ambulatory peritoneal dialysis (CAPD) patients (pts) from a 3-year longitudinal study. Methods: Nutritional status and nutritional related factors were assessed per 6 months among 43 CAPD pts included from June 2002 to June 2003 during 3 years. Nutritional incites included Subjective Global Assessment, serum albumin, and dietary protein and energy intake. Nutritional related factors had dialysis adequacy, inflammatory and volume status, metabolic acidosis, acute and chronic comorbidities. Acute comorbidities refer to acute infection, heart and cerebral stroke, trauma, and operation during 1 month. Chronic comorbidities include cardiovascular disease, diabetes, tumor, and chronic infection. The change type of nutritional status was analyzed. Results: Renal Kt/V, creatinine clearance (Ccr) and total Kt/V significantly decreased among 43 pts during the first 2 years after dialysis (p<0.05), and the prevalence of malnutrition decreased from 67.44% to 25.58%, serum albumin increased from 34.53±4.53 to 37.01±4.39 g/L 14 of 43 pts were continuously well nourished, 18 pts changed from malnourished to well nourished, 3 pts fluctuated malnourished, and 8 pts continuously malnourished. There was no difference in age, predialysis serum albumin levels, the prevalence of chronic comorbidities between pts with well nutrition or ameliorated nutrition and pts with fluctuated or continuous malnutrition (p>0.05). However, pts with fluctuated and continuous malnutrition had higher serum C-reactive protein, extracellular water/total body water, weight-normalized extracelluar water, and prevalence of acute complications (p<0.01-0.05). There were 77 times complications during 3 years among 43 pts, among which 64 times were infection occurred in systemic position (such as upper respiratory tract, peritoneal cavity, urinary tract, and so on). Conclusions.The majority of CAPD pts were ameliorated in nutritional status during 1 year alter dialysis. With the residual renal function decreased 2-3 years alter dialysis, nutritional status was not aggravated. Inflammatory, volume overload, and acute complications may be related to the fluctuated or continuous malnutrition. The most common acute complication of pts was acute infection.
Dong J., Wang T., Wang H.Y., Renal Division, Peking University First Hospital, Peking, China.
Serum Levels of Soluble Adhesion Molecules in Patients on CAPD
Objective: Circulating soluble adhesion molecules, which are markers of endothelial dysfunction, also contribute to chronic inflammation. However their relationships with nutrition status, duration of peritoneal dialysis (PD), and other inflammation markers have not been evaluated in patients with CAPD. Methods: Serum levels of solute vascular cell adhesion molecule-1 (sVCAM-1), soluble intercellular adhesion molecule-1 (slCAM-1), interleukin (IL)-6, tumor necrosis factor alpha (TNF-α), hyaluronan were detected by ELISA in 65 patients on CAPD. The correlation between serum levels of soluble adhesion molecules and systemic inflammation markers, together with clinical parameters including Subjective Global Assessment (SGA), Modified Quantitative SGA (MQSGA), Comprehensive Malnutrition Inflammation Score (CMIS). C-reactive protein, albumin, ultrafiltration, residual urine volume. PD duration, hemoglobin, calcium phosphate products, iPTH, lipid profile, and transferrin were analyzed. Serum levels of sVCAM-1 and slCAM-1 were also tested in 15 healthy controls. Results: Serum sVCAM-1 and slCAM-1 levels were significantly elevated in CAPD patients compared with healthy controls (2478.8±779.5 vs 483.56±107.8 pmol/L, p=0.000; 1331.6±54.5 vs 1277.6±37.1 pmol/L, p=0.001), sVCAM-1 level in CAPD patients was significantly positively correlated with systemic inflammation markets of IL-6 (r=0.34, p=0.006), TNF-α (r=0.369, p=0.002), and hyaluronan (r=0.346, p=0.005), and MQSGA scores (r=0.394, p=0.007), CMIS (r=0.301, p=0.016), and PD duration (r=0.398, p=0.001). There was significantly negative correlation between sVCAM-1 and SGA scores (r=0.341, p=0.007), residual urine volume (r=-0.439, p=0.000), and Hb (r=-0.247, p=0.049), slCAM-1 showed a positive correlation with IL-6 (r=0.24, p=0.045), TNF-α (r=0.346, p=0.005), serum cholesterol (r=0.275, p=0.031), and triglyceride (r=0.255, p=0.046), but no significant correlation with SGA, MQSGA and CMIS. Conclusion: Circulating sVCAM-1 level shows an important link with systemic inflammation markers, nutrition status, and PD duration, slCAM-1 level also shows an close correlation with systemic inflammation markers. These results show that sVCAM-1 may play an important role in inflammation-malnutrition in CAPD patients.
Guo Q.Y., Zhong J.H., Feng M., Peng W.X., Yang X., Zhang Y.F., Liu Q.H., Sun Y.Y., Luo B.X., Lin J., Zhang X. D., Hu L.Q., Jiang Z.P., Mao H.P., Yu X.Q., Dept of Nephrol, The First Affiliated Hosp of Sun Yat-sen Univ, Guangzhou, China.
Baseline Nutritional Status and Effect of Dietary Counseling on End-Stage Renal Disease Patients on CAPD in India
Prevalence of malnutrition in end-stage renal disease (ESRD) patients on CAPD in India has not been studied in much detail. We have studied the various nutritional indices of ESRD patients at the initiation of therapy 154 CAPD patients (109 male, mean age 49±15 years) were assessed for their nutritional status at the initiation of therapy. The nutritional status was assessed by anthropometry, diet Subjective Global Assessment (SGA), and Nutrition Risk Index (NRI), and patients were classified as normal, mild to moderate, and severe malnutrition based on their nutritional indices. Individual dietary counseling was done and individual diet chart was given to every patient and re-counseling was done on every follow-up. Various grades of malnutrition were seen in 74% based on SGA, 61.22% on serum albumin (serum albumin <3.5 g/dL), 34.78% of patients based on body mass index (<20), 67.82% on % ideal body weight (<90), and 87.25% on NRI (NRI<100). Mean intake of calories (1061.07±349.91 kcal) and protein (46.46±15.40 g) was significantly lower than recommended (DOG guidelines) (p<0.001). Protein intake <1.0 g/kg/d was seen in 76.51% patients. Mean daily calorie and protein intake in well-nourished patents were significantly higher (24.07±5.59 vs 17.87±6.31 vs 11.68±3.70 kcals respectively) and (1.01±0.26 vs 0.79±0.55 vs 0.55±0.17 g respectively) than in mild-to-moderate and severe malnourished patients (based on SGA) (p<0.001). Mean serum albumin level (3.16±0.56 g/dL) in vegetarian patients (n=71) was significantly lower than nonvegetarian patients [3.38±0.49 g/dL) (p=0.04). There was significant increase in the nutrient intake of these patients post counseling (p<0.001). Majority of the patients were already malnourished at the initial of of CAPD. We conclude that dietary counseling at the start of therapy helps in significantly increasing the nutrient intake in these patients.
Gupta A., Prasad N., Sinha A., Sharma R.K., Gulati S., Kumar A., Masih S., Kumar R., Sanjay Gandhi Postgraduate Institute of Medical Sciences, Lucknow, India.
Malnutrition and Low Parathyroid Hormone in Peritoneal Dialysis Patients
Objective: Low parathyroid hormone (PTH) is not uncommon in peritoneal dialysis (PD) patients. In this study, we investigated the relationship between low PTH and patients’ nutritional status in PD patients.
Methods: 84 uremia patients were involved in this study, and they received PD with Baxter PD-II dialysate in which calcium concentration was 1.75 mmol/L. Serum iPTH was deflected once every 3 months. Subjective Global Assessment (SGA) was used to evaluate the nutritional status.
Results: Among the 84 patients, 45 (53.6%) had low iPTH (<70 pg/mL). 22 patients (group A) had constantly low iPTH white the other 23 patients (group B) had temporarily low iPTH level (after treatment of calcitriol and normalized in 1-2 months since calcitriol was ceased). In group A, the serum albumin (35.9±4.1 g/L) was significantly lower than that of in group B (37.6±2.2 g/L) (p=0.013). In addition, patients in group A had a higher malnutrition rate (16/22) than those in group B (8/23) (p=0.006).
Conclusion: Our data suggest that patients with consistently low iPTH may be associated with malnutrition.
Han Q.F., Peking University Third Hospital, Beijing, China.
Plasma Ghrelin Levels in Patients Undergoing Hemodialysis and Peritoneal Dialysis
Background: Ghrelin, an endogenous ligand of growth hormone secretagogue receptor (GHSR), has been characterized as a regulator of appetite and body weight in humans. However, the correlations between the fasting plasma ghrelin levels and nutrition, inflammation in dialysis patients have not been adequately studied.
Methods: Fasting plasma ghrelin levels were measured by ELISA in 30 peritoneal dialysis, 30 hemodialysis patients, and 20 normal controls. The correlations between the plasma ghrelin levels and nutrition markers, inflammation markers were explored.
Results: The tasting plasma ghrelin levels in dialysis groups were much higher than that in controls (p<0.0001). However, there was no difference in the plasma ghrelin levels between peritoneal dialysis and hemodialyss groups (p=0.601). In dialysis patients, the plasma ghrelin levels were negatively correlated with body mass index (BMI) (r=-0.316,p=0.004) and with the plasma prealbumin (r=-0.303,p=0.037), positively correlated with the plasma interleukin-6 (r=0.252,p=0.06). There was no difference in the levels of plasma ghrelin among well-nourished, mild-moderate malnourished, and severe malnourished subgroup (p=0.165) and between inflamed and noninflamed patients (p=0.423).
Conclusions: Our data suggested that plasma ghrelin levels in dialysis groups were much higher than that in controls and that in dialysis patients plasma ghrelin levels correlated with BMI. However, dialysis modality did not seem to have effect on the patients’ plasma ghrelin levels.
He L., Zhang A.H., Lata A., Han Q.F., Zhu N., Fan M.H., Department of Nephrology, Peking University 3rd Hospital, Beijing, China.
Nutritional Status of Chronic Peritoneal Dialysis Patients
Background: Protein-energy malnutrition is common (18%-55%) among dialysis, patients, many factors can cause malnutrition in chronic peritoneal dialysis (PD) patients. The study aim was to investigate the status of anthropometry, muscle strength, energy intake (including dialysate glucose absorption), and protein intake in our chronic PD patients.
Methods: This study enrolled 92 PD patients (36 males and 56 females) from the PD unit of National Cheng Kung University Hospital. All nutritional status was assessed by a single dietitian. The gender difference was compared by Student's t-test. The correlation was determined by regression analysis (r) and Spearman's rank (p).
Results: Female patients had higher triceps skinfold thickness (TSF) (p<0.0005), but lower midarm circumference (MAC) (p<0.001) and midarm muscle circumference (MAMC), hand-grip strength (HGS), and pinch strength (PS) (p<0.0001). There were no significant differences in energy intake (28.1±6.8 vs 29.2±5.7 kcal/kg/day) and dietary protein intake (0.96±0.30 vs 0.96±0.21 g/kg/day) between gender. MAC was significantly correlated with TSF (r=0.557,p<0.0001), MAMC was also correlated with HGS and PS (r=0.593,p<0.0001 and r=0.538,p<0.0001), dietary energy, and protein intake (r=0.476,p<0.0001 and r=0.565,p<0.0001). However, HGS had positive correlation with dietary energy and protein intake (r=0.588,p<0.0001 and r=0.584,p<0.0001).
Conclusion: Our PD patients were inadequate in dietary protein and energy intake (compared with DOQI guideline: protein 1.2-1.3 g/kg BW/ day; energy 30-35 kcal/kg BW/day). MAMC can represent the muscle mass and HGS and PS. Therefore we emphasize increasing dietary protein and energy intake to improve the anthropometry and muscle strength.
Huang J.J.1, Tseng C.C.1, Sung J.M.1, Wu A.B.1, Cheng M.R.1, Wu H.L.2, Department of Internal Medicine1 and Department of Nutrition,2 National Cheng Kung University Hospital, Tainan, Taiwan.
A Study of Tailored Nutrition Support for Peritoneal Dialysis Patients
Objective: The primary goal of continuous ambulatory peritoneal dialysis (CARD) is to maintain a uremic patient in the best possible physical condition and to prevent complications dune to uremic toxicity. Residual renal function contributes to the overall clearance of small and middle molecular weight solutes and fluid removal. In some CAPD patients, significant residual renal function may help lessen the number and/or volume exchanges. Also, nutrition is one of the most important parameter of CAPD patients outcome. Our study examined s the impact of guidelines of Japanese Society of Nephrology (JSN) on nutritional status. Furthermore, this study tried to show appropriate nutrition support for CAPD patients using an estimation of nutrition input and output. Method: By inputting various data (about 40 items), such as the markers of nutrition, body mass index, dialysis conditions, daily urine output and volume of the dialysate, and meal contents, created in Excels a spreadsheet which automatically measures the dialysis efficiency and the peritoneal function. Furthermore, energy, protein, electrolyte, and body fluid levels can be calculated, as well as the relationship between the amount of ingested nutrition and ultrafiltration volume analyzed Result: The durations of CAPD and urinary volume are in negative correlation, and urinary volume was set to 100 mL or less per day for up to 5 years of therapy. The total ultrafiltration volume and the amount of removal of protein, Na, K, P had a good correlation, and especially Na had a strong correlation. NaCI 10 g was included in 1500 mL of ultrafiltration volume. The amount of energy required indicating the total amount of ingested energy according to Japanese guidelines showed the correct correlation. The amounts of ingested protein (0.9 g/kg) and nPCR (0.95 g/kg) were less than the guidelines. Conclusion: Although nutritional training was performed based on the dietary guidelines of the JSN, it is thought that, by incorporating the data obtained from daily urine output and volume of the dialysate, nutritional care more suitable for the individual patient can be practiced.
Ichikawa K.1, Ishii Y.1, Takemasa M.1, Sasaki T.2, Horike H.2, Kashihara N.2, Department of Nutrition.1 Kawasaki Medical School Hospital; Division of Nephrology,2 Kawasaki Medical School, Kurashiki, Japan.
Is Hypervitaminosis C More Frequent in Japanese Peritoneal Dialysis (PD) Patients without Prescribing Ascorbic Acid?
The percentage of patients (pts) administered water-soluble vitamins in Japan is 5.6%, very low compared with other countries [Am J Kidney Dis 2004: 44:293-9). We also do not administer water-soluble vitamins, including vitamin C, to dialysis pts considering Ono's report that hyperoxalemia in regular hemodialysis pts is aggravated by routine vitamin C supplementation (Clin Nephrol 1986; 26:239-43). Hirano recently reported that the frequency of vitamin C deficiency in dialysis pts is extremely high (Nippon Jinzo Gakkai Shi 2004; 46:426-33). Ascorbic acid (AA) is essential for optimal health. To determine whether or not AA is deficient we studied 10 clinically stable PD pts who were not using vitamin C (female/male 5/5; age 55±11; PD term 70±59 months). Serum AA (SAA) levels were measured by HPLC, of the studied pts, 1 pt (10%) had a SAA of 0.9 mg/L (scorbutic),6 pts (60%) had a normal range of SAA (1.9-15 mg/L), and 3 pts (30%) had an SAA>24 mg/L (beyond the upper normal level considered as hypervitaminosis C). In a comparison between 6 pts with normal range of SAA and 3 pts with hypervitaminosis C, there was a decrease in serum thiamin (33.7±2.6 vs 25.3±5.4 mg/L,p=0.016), C-reactive protein (0.12±0.05 vs 0.05±0.01 mg/L,p=0.016), serum ferritin level (161.0±89.5 vs 44.5±22.3 ng/mL,p=0.068), and an increase in serum potassium (3.6±0.4 vs 4.2±0.4 mEq/L,p=0.07). There was no difference shown between them regarding age, PD term, serum folic acid level, vitamin 62, white blood cell, hemoglobin, serum albumin, peroxidized lipid levels, serum urea nitrogen levels, serum total cholesterol levels. D/P creatinine ratio, or ultrafiltration volume. Our result suggested that hypervitaminosis C might be more frequently observed in PD pts in today's Western countries. Caution should be used in the administration of vitamin C to PD pts according to current recommendations and the SAA level should be periodically measured to avoid the development of hypervitaminosis C and secondary hyperoxalemia although further survey is warranted.
Itami N.1, Takada J.1, Hamada H.2, Katsuki Y.2, Tsuji Y.2, Ohira S.3, Kidney Center1 and Department of Surgery,2 Nikko Memorial Hospital. Muroran; Sapporo Kita Clinic,3 Sapporo, Japan.
Malnutrition and Encapsulating Peritoneal Sclerosis (EPS)
EPS is a serious complication of peritoneal dialysis (PD), the outcome of which may be improved by careful dietetic management. Infections of the peritoneum increase the loss of amino acids into the dialysis fluid. As the disease progresses, gastrointestinal symptoms and depression, a long side reduced gut absorption area and delayed gut emptying, can all influence nutritional status. Malnutrition is difficult to identify in these patients where weight loss can be masked by ascites. Therefore a number of markers should be measured. It is important to recognize that these patients are at risk of re-feeding syndrome (RS). RS describes a constellation of potentially lethal metabolic disturbances that occur as a result of reinstitution of nutrition to patients who are severely malnourished. This syndrome is well recognized in certain undernourished groups of patients, it may not be so easily recognized in patients receiving renal replacement therapy. Here we describe for the first time, the occurrence of RS in a patient with EPS. A 49-year-old male with APKD was diagnosed with EPS less than 2 months following living-related renal transplantation. He had been on PD for 46 months, with 3 episodes of peritonitis and ultrafiltration problems. For a year prior to transplantation he experienced poor appetite, weight loss, and abdominal pa in requiring nutritional supplementation. Post transplant his appetite deteriorated due to gastrointestinal (Gl) symptoms, nutritional markers reflect this. NG feeding was commenced (day 32) but was not tolerated and subsequently parenteral nutrition (PN) was introduced. A risk of RS was identified but even with caution rapid electrolyte changes were observed. He developed bowel obstruction requiring laparotomy at which point EPS was diagnosed. After 3 weeks PN was stopped and NG feeding was successfully reintroduced. One week later oral diet was started. Five months post EPS the patient's appetite improved markedly and graft function is stable. Here we demonstrate that with appropriate dietetic support pre and post surgery the patients nutritional status was greatly improved, this may have influenced outcome.
Jordaan A., De Freitas D.G., Hurst H., Alderdice J., Brenchley P.E.C., Hutchison A.J., Summers A.M., Manchester Institute of Nephrology and Transplantation, Manchester, United Kingdom.
Effect of Dialysis Type on Serum Lipid Levels in End-Stage Renal Disease
Aim: Dyslipidemia is common among patients with end-stage renal disease, whether treated by hemodialysis (HD) or peritoneal dialysis (PD). However, there is not enough data about the effect of dialysis type on serum lipid levels. The aim of this study was to determine the effect of dialysis type on serum lipid levels.
Materials and Methods: This study enrolled 40 HD patients (20 men, 20 women; age 48.1±17.6 years) and 69 PD patients (35 men, 34 women; age 45.2±16.3 years). Serum levels of lipid profile including total cholesterol (TC), low-density lipoprotein (LDL-C), high-density lipoprotein (HDL-C), triglyceride (TG), lipoprotein(a) Lp(a), and Lp(b) were determined in HD and PD patients. Patients who used statin within 6 months were not included in the study.
Results: No significant difference in TC, LDL-C, HDL-C, TG, Lp(a), and Lp(b) serum levels were found between HD patients and PD patients. Serum levels:
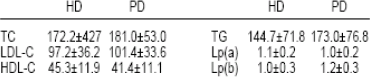
Conclusion: We conclude that type of dialysis has no significant effect on serum lipid, Lp(a) and Lp(b) levels.
Kanbay M., Akcay A., Uz B., Kaya A., Koca C., Duranay M., Yigitoglu R., Fatih University School of Medicine, Ankara, Turkey.
Obesity-Related Factors during First Year of CAPD
Objectives: Obesity (Ob) is a risk factor of cardiovascular disease, which is associated with hypertension, diabetes, hyperlipidemia, and coronary artery disease. Ob occurs more frequently in CAPD rather than in hemodialysis. In this study, we tried to evaluate the change of their body weight during the first year as well as analyzing the possible influential factors on Ob. Methods: 51 new CAPD patients (pts; 32 males, 22 diabetics) were recruited. In the 1st, 6th, and 12th months after the insertion of CAPD catheter, adequacy, PET, nutritional parameters (serum albumin, nPCR,%LBM, SGA, prealbumin), lipid profile, serum transferrin, ferritin. Lp(a), hs-CRP, and the peritoneal glucose (Glu) absorption rate were evaluated in order to examine possible correlations with Ob. Moreover, according to the BMI, 12 months after the commencement of CAPD, pts were divided into a normal group (n=33, BMI<25 kg/m2) and an overweight group (n=18, BMI≥25 kg/m2). Possible independent risk factors affecting their Ob were analyzed. Results: Mean age of all 51 pts was 51.3±14.0 years, mean body weight was 61.8±10.3 kg, and mean BMI was 23.1±3.2 kg/m2. (1) There was no significant difference between both groups in sex and diabetic ratio. (2) The BMI was positively correlated with the plasma Glu concentration (r=0.35), total body water (r=0.34), peritoneal ultrafiltration rate (UFR) (r=0.30), and SGA (r=0.37) in the 6th month, while negatively correlated with %LBM (r=-0.36) and nPCR (r=-0.32) (p<0.05). In the 12th month, BMI was not correlated with plasma Glu concentration, but positively correlated with total body water (r=0.32), peritoneal UFR (r=0.34), SGA (r=0.32), and triglyceride (r=0.33), while negatively correlated with %LBM (r=0.45) and nPCR (r=-0.58,p<0.05). However, at 6 and 12 months after dialysis, the BMI did not correlate with the peritoneal Glu absorption rate, peritoneal characteristics, and adequacy. (3) In multivariate logistic regression analysis, plasma Glu concentration [relative risk (OR) 1.020,95% confidence interval (Cl) 1.004-1.036,p=0.012] and SGA (OR 3.976, 95% Cl 1.081-14.625, p=0.038) at 6 months after CAPD as well as plasma Glu concentration (OR 1.033, 95% Cl 1.009-1.058, p=0.007) and % LBM (OR 0.853, 95% CI 0.756-0.964, p=0.011) at 12 months after CAPD (p<0.05 respectively) were significant risk factors for Ob. (4) In repeated measures ANOVA 10 determine any time-based variation of different indices between both groups, the overweight group showed that both the plasma Glu concentration and UFR kept at a more significantly high level for 12 months after CAPD than the normal group, while showing a low level in %LBM and nPCR on an ongoing basis (p<0.05) Conclusion: Hyperglycemia and high a SGA level were associated with Ob during the first year of CAPD, and the Ob group showed a relatively low %LBM.
Kang H.J., Kim C.D., Seo J.J., Park J.Y., Park S.H., Kim Y.L., Department of Internal Medicine, Kyungpook National University School of Medicine, Daegu, South Korea.
Changes in Body Composition after 12 Months in Dialysis: Differences between Peritoneal Dialysis (PD) and Hemodialysis (HD)
Body composition (BC) parameters have been reported to increase during the 1st year of PD. The changes in BC during the 1st year of dialysis in PD and HD patients have not been fully investigated. In this study we compared the charges in BC between PD and HD patients before and after about 12 months of dialysis. 164 patients (age 52±12 years, males 64%. 90 PD and 74 HD; were included in this study, with BC being evaluated by dual energy x-ray absorptiometry (DEM). Male distribution (59% vs 60%), age (53±11 vs 51±13 years}, and malnutrition evaluated by Subjective Global Assessment (35% vs 31%) did not differ between PD and HD groups at the baseline. The main results are in the Table. This analysis shows that although BC parameters have changed in PD and HD patients, these changes were more pronounced in PD patients. This study suggests that dialysis procedure could be associated with different pattern of changes in BC during the first year of dialysis.
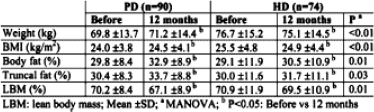
LBM: lean body mean; Mean ±SD;
MANOVA;
P<0.05; Before vs 12 months.
Lindholm B., Avesani C.M., Carrero J.J., Pecoits-Filho R., Qureshi A.R., Axelsson J., Suliman M.E., Heimbürger O., Stenvinkel P., Divisions of Medicine and Baxter Novum, Karolinska Institutel, Stockholm, Sweden.
The Conventional Nutritional Counseling Alone Maintains Nutritional Status of CAPD Patients in Spite of Systemic Inflammation and the Decrease of Residual Renal Function
Aims: To evaluate the effect of nutritional counseling alone on nutritional status of CAPD patients.
Methods: Open-labeled, uncontrolled clinical trial; 29 patients had conventional nutritional counseling during 6 months of follow-up as the only supportive nutritional measure. Patients had monthly clinical and biochemical evaluations, as well as adequacy of dialysis, nutritional, and inflammation assessments every 3 months. Nutritional evaluation performed with 24-hour dietary recall, anthropometry, and Subjective Global Assessment (SGA). Inflammation evaluated with C-reactive protein (CRP), interleukin-6 (IL-6), and turner necrosis factor alpha (TNF-α).
Results: Mean age was 52±15 years and time on dialysis 9 (4-25) months. Patients had 0 (0-1.5) peritonitis, and transport rate was 0.75±0.13.
Conclusions: Conventional nutritional counseling alone did not significantly improve nutritional status of CAPD patients; however it seemed to prevent the nutritional impairment in spite of a decrease in residual renal function and increase of systemic inflammation (IL-6 and TNF-α levels).
Martin-del-Campo F., Gonzolez-Espinoza L., Martinez-Ramirez H.R., Cortes-Sanabria L., Rojas-Campos E., Cueto-Manzano A.M., Unidad de Investig Méd en Epidemiol Clin, Hosp de Especial, CMNO, IMSS, Guadalajara, Mexico.
What is the Optimal Arterial pH for Protein Balance in Automated Peritoneal Dialysis (APD) Patients?
Objective: Acidemia, a common complication of renal failure, leads to many adverse effects. It is for this reason that some experts recommend that the arterial pH be maintained between 7.37 and 7.44 in end-stage renal disease (ESRD) patients. However, the optimal arterial pH within this range has never been investigated. We undertook this study to test the hypothesis that, in APD patients, an arterial pH of 7.44, compared to a pH of 7.37, is associated with more positive N-balances.
Methods: Five stable APD subjects completed a randomized, crossover, inpatient nitrogen balance study of at least 42 days each, with half this time devoted to attaining an arterial pH of 7.35-7.37 and the other half to obtaining a pH of 7.43-7.45. Subjects received a constant nitrogen intake and the APD prescriptions were maintained constant. Arterial pH was varied by changing the dose of sodium citrate/citric acid or NH4CI. N-balances were adjusted for changes in serum urea nitrogen concentrations (SUN) and body weight.
Results: Five patients [3 men, 2 diabetics, age 49±7 (SE) years] completed the study. Subjects attained an average arterial pH of 7.37±0.01 and 7.45±0.02, respectively. The arterial pH of 7.45 was associated with higher net N-balances and lower SUN, serum K and P (N-balances 2.32±0.51 vs 0.96±0.40 g/day, p=0.02; SUN 61±6 vs 73±9 mg/dL, p=0.04; K 3.7±0.3 vs 44±0.3 mEq/L; P 5.4±0.4 vs 5.6±0.6 mg/dL). There were no significant changes in body weight or serum albumin or transferrin levels.
Conclusions: These preliminary data suggest that among stable patients with ESRD undergoing APD, a mean arterial pH of 7.45, compared to 7.37, is associated with more positive N-balances.
Mehrotra R., Brass R., Konishi T., Appell M., Kopple J.D., Los Angeles Biomedical Research Institute at Harbor-UCLA Medical Center, Torrance, CA, U.S.A.
Determination of Dietary Energy Production from the Daily Glucose Load
Objectives: (1) To revalidate a method to predict glucose absorption from dialysis solution in continuous ambulatory peritoneal dialysis patents. (2) To provide a simple calculation of glucose absorption based on 24-hour effluent glucose concentration.
Methods: The predictive method (predicted) of Grodstein et al. (Kidney Int 1981; 19:564) was compared to glucose absorption calculated from dialysate glucose (determined). Data from 1301 dialysis adequacy assessments in 275 patients were studied. The dextrose concentration and volume of each type of dialysis solution were prospectively recorded. The total 24-hour dialysate drainage volume was measured in graduate cylinders, the entire collection mixed, and glucose assayed in a representative sample. The glucose concentration of each type of dialysis solution had been previously determined using our laboratory's clinical chemistry analyzer. The total glucose infused/24 hours was calculated from data provided in the package insert and from the glucose concentrations determined in our laboratory. The total energy from absorbed glucose was determined using the equation: glucose in (Gi) -glucose out (Go) = glucose absorbed times the standard factor of 3.7 kcal/g.
Results: When using Gi based on the product insert, daily glucose absorption was 116.89±2.65 g/day when predicted, and 111.87±5.87 when determined. When using GI from assayed glucose values, daily glucose absorption was 114.75±7.39 g/day when predicted, and 109.71±4.90 when determined. There were no significant differences within or between groups: however, the mean values of the 2 determined groups were 4.3% and 4.4% lower, respectively, than the 2 predicted groups.
Conclusions: These data substantiate the usefulness and accuracy of the Grodstein method. They also demonstrate that the simple Gi - Go calculation of daily glucose absorption is useful for quick, easy, and accurate determination of energy input from the daily glucose load.
Moore H.L., Prowant B.F., Khanna R., University of Missouri, Columbia, MO, U.S.A.
Comparison of Nutritional Changes between Peritoneal Dialysis and Hemodialysis Patients after the Beginning of Dialysis Therapy
Objective: Peritoneal dialysis (PD) has some advantages concerning nutritional stale probably due to little restriction of potassium intake or much glucose absorption from PD fluid. However, protein loss into dialysis fluid, leading to malnutrition, is a crucial problem in PD therapy. There are few data about laboratory and anthropometrical changes of nutritional state in PD and hemodialysis (HD) patients. Therefore, we investigated these data in the prospective study
Method: We studied 8 PD patients and 8 HD patents who started dialysis from November 1999 to May 2001 in our hospital. Albumin (Alb), total cholesterol (T-cho), hematocrit (Hct), anthropometrical data, and bone density were measured at the initiation of both therapy and at 1 year after beginning therapy.
Result: At the beginning of dialysis therapy, arm muscle area (AM A) of FD patients showed significantly larger than that of HD patients (28.7±7.3 vs 21.5±3.8 cm3). However, there was no significant difference in AMA between PD and HD patients after 1 year (27.2±8.0 vs 32.7±11.8 cm5). There was no significant difference in both serum levels of Alb and T-cho between PD and HD patients (3.5±0.2 g/dL & 177±28 mg/dL vs 3.4±0.4 g/ dL & 186±41 mg/dL in Alb & T-cho, respectively) at the beginning. After 1 year of dialysis therapy, both serum levels of Ab and T-cho in PD patients were significantly higher than those in HD patients (4.0±0.3 g/dL & 205±26 mg/dL vs 3.6±0.2 g/dL & 148±18 mg/dL, respectively. There was no significant difference in Hct and bone density between PD and HD patients at the beginning and 1 year after dialysis therapy.
Conclusion: The present study showed that patients with PD were in belter nutritional state than those with HD 1 year after initiation of dialysis therapy.
Moriya H., Ishii T., Oka M., Maesato K., Mano T., Ikee R., Ohtake T., Kobayashi S., Department of Nephrology & Dialysis Center, Shonan Kamakura General Hospital, Kamakura, Japan.
Survey on Education of Salt Intake and Follow-up for Peritoneal Dialysis Patients in North-East Japan by Multiple-Choice Questionnaire
Objective: Adequate salt intake is essential for well-control led fluid status in peritoneal dialysis (PD) patents. To achieve it, education on adequate salt intake and patients’ follow-up are mandatory, however those profiles remain unclear.
Subjects and Method: 139 medical institutions which run PD patients in North-East region (Tohoku) of Japan were recruited, and those who are in charge of dietary counseling for PD patients were studied. Among them, permissions were obtained from 44 institutions to send multiple-choice questionnaire regarding education of salt intake and follow-up system for PD patients. It was sent by mail to each institution in February 2006.
Result: Replies were obtained from 33 institutions in March 2006. It was answered by physicians in 15, dieticians in 9, nurses in 8, and other in 1 case. Physicians were responsible for giving dietary prescription in 28 institutions. In 57.6% cases, it was prescribed in the way that according to control of Wood pressure or fluid state: however there were no standards to quantify it. In the rest, prescribed dose was fixed as follows: 5-6 p/day (21.2%), 6-7 g/day (9.1%), 7-10 g/day (9.1%), and others (3.0%). Compliance was assessed on regular basis in 15.2%, or when needed in 45.5%, whereas it was not done in 39.4%. By self-assessment on the education of salt intake, 14 institutions (42.4%) recognized it works efficiently mainly due to systematic education including family members and consideration of patents’ life style, based on the dietary standards in each institution Whereas 17 institutions (51.5%) recognized it did poorly, mainly due to factors such as patients’ incompliance, inadequate systems on education and follow-up.
Conclusion: Prescription of salt intakes and education in PD patients, in general, remains conventional. Standardization of education and rationalized systematic approach to patients are warranted.
Nakamura M., Terawaki H., Nakayama M., Ito S., Tohoku University Graduate School of Medicine Research Division of Dialysis and Chronic Kidney Disease, Sendai, Japan.
Inflammation in Peritoneal Patients: Influence on Nutritional Status and Dorbepoetin Dose
Malnutrition and inflammation are highly prevalent in dialysis patients and major contributors to morbidity and mortality. Markers of inflammation have been associated with resistance to erythropoietin-stimulating agents. The aim of our study was to compare the inflammatory status between hemodialysis (HD) and peritoneal dialysis (PD) patients. A secondary objective was to analyze the relationship between inflammation, malnutrition, and darbepoetin (Db) requirements. We studied 20 stable patients on PD and we compared with 27 HD patients. We analyzed clinical, hematologic, biochemical, and inflammatory parameters. Nutritional status was assessed using serum albumin and Subjective Global Assessment (SGA) modified for use in PD patients. The PD group consisted of 20 patients (11 male. 9 female) with a mean age of 52.3±12.3 years, whereas the HD group consisted of 27 patients (15 males, 12 female) with a mean age of 64±15.5 years. Patients on HD had a significantly higher mean age (p=0.008). The mean hemoglobin and albumin levels were not different between the groups. The Db doses were higher in PD patients (PD=0.97 vs HD=0.46 μg/week, p=0.002). Serum CRP and IL-6 were significantly higher in PD patients (PD=2.2 vs HD=0.55 mg/dL, p=0.027: PD=11 VS HD=4.8 pg/mL, p=0.012). We also compared the PD group with predialysis patients (n=95, mean age=69.4±14.4 years, male=54, female=41) respecting inflammatory parameters. In PD group the IL-6 levels were significantly higher (PD=11 vs predialysis = 5.4 pg/mL, p=0.0001). We found a positive correlation between IL-6 level and Db dose (r=0.450, p=0.047) and a negative correlation between IL-6 and SGA (r=-0.560, p=0.01). In contrast to previous reports, our study indicates that PD presents a higher degree of inflammation than does HD. We also found a correlation between inflammation, nutritional status, and Db dose in PD patents.
Pinto I.S.1, Carrasqueira H.2, Faisca M.3, Bernardo I.1, Neves P.L.1, Nephrology,1 Dietetics,3 Biochemistry.3 Faro Hospital, Faro, Portugal.
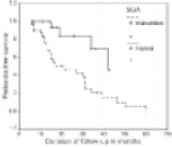
Can Nutritional Indices Predict Peritonitis in CAPD Patients?
56 end-stage renal disease (ESRD) patients (pts) on CAPD were included by randomization on computed random numeric table in this study. These pts were assessed for nutritional status and peritonitis (P) episodes. Nutritional parameters was assessed by anthropometry, diet, body mass index (BMI), Nutrition Risk Index (NRI), serum albumin level, and Subjects Global Assessment (SGA). Based on SGA, pts were categorized into group 1, malnutrition (n=31) and group 2, normal nutritional status (n=25). P was considered as primary outcome and compared between 2 groups. Univariate and multivariate logistic regression analysis was used to see the impact of nutritional parameters on P. The Kaplan-Meier survival analysis was used to compare P-free survival between 2 groups. The demographic profiles, Kt/V, creatinine clearance, and mean follow-up of 2 groups were similar. The episodes of P were significantly higher in pts with malnutrition (25/31) compared to pts with normal nutritional status (4/25), p=0.001. Mean P rate/pt/year was also significantly higher in pts with malnutrition (0.99±1.07) compared to pts with normal nutritional status (0.18±0.42), p=0.007. On univariate analysis, malnutrition based on SGA (p=0.009), NR (p=0.02), serum albumin level (p=0.005), and calorie intake (p=0.006) were significant predictor of P. On multivariate Cox regression analysis, only SGA (p=0.001, odds ratio 0.078, 95% Cl 0.02-0.36) was found to be significant predictors of P. On general linear model, the observed power of prediction of P was 0.96 based on SGA. On Kaplan-Meier survival analysis, the P-free survival with normal nutrition (42 months) was significantly higher compared to pts with malnutrition (21 months) based on SGA (log rank p=0.003) (Figure 1). We conclude that P rate is high in pts with malnutrition, and ma nutrition indices especially SGA can predict the Pin CAPD pts.
Prasad N., Gupta A., Sharma R.K., Sinha A., Gulati S., Kumar A., Kumar R., Masih S., Sanjay Gandhi Postgraduate Institute Of Medical Sciences, Lucknow, India.
Effect of Nature of Diet and Malnutrition on Survival of End-Stage Renal Disease Patients on CAPD
Nutritional indices are strong predictors of patient outcome in peritoneal dialysis patients. Dietary nature of Indian patients is different. We undertook this study to see the impact of dietary nature and malnutrition on survival of CAPD patients. The nutritional status of 167 patients (age 53±14, male=112) was assessed by anthropometry, dietary diary, and Subjective Global Assessment (SGA). Of these 167 patients, 71 patients were vegetarian. 52 non-vegetarian, and 44 ovo-vegetarian. The nutritional status of vegetarians, non-vegetarians, and ovo-vegetarians were not different on SGA (p=0.71). Of these 71 vegetarians, 18 (25.3%) have normal nutritional status, 47 (66.2%) have mild-moderate malnutrition, and 6 (8.45%) have severe malnutrition. Of 52 non-vegetarians, 14 (26.0%) have normal nutritional status, 34 (65.4%) have mild-moderate malnutrition, and 4 (7.69%) have severe malnutrition. Of 44 ovo-vegetarians, 14 (31.8%) have normal nutritional status, 29 (65.9%) have mild-moderate malnutrition, and 1 (2.27%) has severe malnutrition. Based on SGA, 46 (27.5%) patients have normal nutritional status (score 7). 110 (65.8%) patients have mild-moderate malnutrition (score 8-21), and 11 (6.6%) have severe malnutrition (score 22-35. The median survival of vegetarian patients was 37 months, non-vegeterian patients was also 37 months and ovo-vegetarian patients was 43 months (log rank p=0.83). The dietary pattern of the patients does not affect the survival of the patient Only 9 (19.6%) of 46 with normal nutrition died while 41/121 (31.9%) patients with malnutrition on SGA died (p=0.05). The relative risk of mortality with malnutrition was 1.19 (95% CI 1.003-1.43). On Kaplan-Meier survival analysis, the median survival of patients with normal nutritional status was significantly higher (48 months; compared to patients with mild moderate-malnutrition (17 months) and severe malnutrition (19 months; (log rank p=0.0013). To conclude, patients with malnutrition have significantly lower survival compared to patients with normal nutritional status. The nature of diet does not affect nutritional status and survival of the patients provided they are not malnourished.
Prasad N., Gupta A., Sinha A., Sharma R.K., Gulati S., Kumar A., Masih S., Kumar R., Sanjay Gandhi Postgraduate Institute of Medical Sciences. Lucknow, India.
The Effects of Calcium Intake and Bone Assessment Index in Continuous Ambulatory Peritoneal Dialysis (CAPD) Patients
Objective: Calcium-phosphate metabolism disorders, caused by uremia, have major effects on the progression of renal osteodystrophy. Bone mass and Ca intake were studied in CAPD patients (pts). Materials and Methods: examined the relationship of Oster-Sono Assessment Index (OSI) and Ca intake in a group of 10 CAPD pts (mean age 50.4±13.8, duration of 51.4=44.3 months) and a group of 18 control subjects (mean age 51.3±7.8). The OSI values were measured with AOS-100 model analyzer and energy, protein, and Ca intakes were calculated by computer (Health Up 2000). Results: The energy, protein, Ca, and phosphate intakes were 31.3±6.0 kcal/kg, 0.8±0.2 g/kg, 331.9±146.8 mg/day, and 654.4±194.3 mg/day in the CAPD group. Compared with the guidelines in Japanese Society of Nephrology, protein intakes were 74.3% complete and Ca intakes were 52.0% complete in the CAPD group. There were significant positive correlations between protein intakes and phosphate intakes (r=0.9466, p<0.0091), and protein intakes and Ca intakes (r=0.9327, p<0.01; in CAPD group. The legumes (soybeans and soybeans products), milk, and dairy products intakes in the CAPD group were significantly lower (p<0.05) than in the control group. Ca intake was 720.0±473.3 mg/day with diets, and 1031.9±215.4 mg/day with dietary and renal osteodystrophy treatment, including phosphate binders. These Ca intake values were compliant with the Kidney Disease Outcomes Quality Initiative Guide-lines. Serum levels of albumin, blood urea nitrogen, phosphate, Ca, alkaline phosphatase, and iPTH were 3.7±0.4 g/dL, 55.7±12.6 mg/dL, 4.5±0.5 mg/dL, 10.7±0.7 mg/dL, 404.3±363.3 IU/L, 356.9±321.6 pg/mL, respectively in the CAPD group. In the CAPD group, the OSI value was 2.539±0.274, and the young adult mean value was 85.5%±7.2%. The OSI of the same age group was 90.7%±7.9%, significantly lower than in the control group (r=0.357). Conclusions: Although a CAPD pts amount of phosphate ingestion was inside the guidelines at 654.4±194.8 mg, the amount of Ca ingestion was 311.9±146.8 mg, and the rate of sufficiency was only 52.0%. A CAPD pts bone evaluation value matched the low tendency compared with the control. When viewed from the perspective of phosphate control, 400 mg was considered to be the limit and a Ca supplement was deemed to be indispensable to make up the amount of Ca ingested with meals.
Takemasa M.1, Ishii Y.1, Ichikawa K.1, Sasaki T.2, Department of Nutrition1 and Division of Nephrology,2 Kawasaki Medical School, Kurashiki, Japan.
Acute Metabolic Effects of Peritoneal Dialysis with Combined Amino Acid and Glucose Dialysate in CAPD Patients
Background: In addition to various other factors, anorexia plays an important role in the development of protein-energy malnutrition (PEM) in peritoneal dialysis (PD) patients. Previously we showed an improvement of protein anabolism in patients on automated PD (APD) with the use of combined amino acids (AA) and glucose (G) dialysate, serving as a source of both proteins and calories. The dialysis procedure was performed as part of a regular nightly dialysis schedule, in the fasting state. In the present study we investigated the acute metabolic effects of such a dialysis procedure at daytime when the patients were in a fed state.
Methods: Therefore, we performed a random order crossover study in 12 patients on CAPD comparing at 2 days with 1 week interval a mixture of AA (Nutrineal® 1.1%) plus G (Physioneal® 1.36%-3.86%) vs G only containing dialysate as control, using an automated cycler. Whole body protein turnover was studied by primed constant intravenous infusion of 13C-leucine during 9-hours dialysis in the daytime, the patients taking liquid meals hourly Whole body protein synthesis (S), breakdown (B), and oxidation (Ox) were determined by measuring at isotopic steady state plasma stable isotope enrichment (13C-keto isocaproic acid) and 13C02 production.
Results: During AA plus G dialysis compared to G only dialysis, both Ox and S were significantly increased (p=0.001 and p=0.039 respectively) assuming a value of 25% for splanchnic retention of AA absorbed from dialysis fluid. These findings suggest an anabolic effect of the AAG dialysate even when patients are in a fed state.
Conclusion: Dialysis solutions containing AA plus G may acutely improve protein anabolism in fed CAPD patients. The use of such a mixture may contribute to long-term improvement of nutritional status in malnourished CAPD patients with deficient intake of both proteins and calories.
Tjiong H.L.1, van den Berg J.W.1, Wattimena J.L.1, Rietveld T.1, Kahriman D.1, van der Steen J.2, Hop W.C.3, Swart R.1, Fieren M.W.J.1, Depts of Intern Med,1 Dietetics,2 Epidemiol & Biostatist,3 Erasmus MC, Rotterdam, The Netherlands.
Assessment of Nutritional Status in Chronic Peritoneal Dialysis Patients Using Subjective Global Assessment (SGA)
Background: Malnutrition is a major negative prognostic factor in dialysis patients. SGA is a clinical method for evaluation of nutritional status. SGA is a simple and reliable estimation of nutrition and may provide close follow-up. To validate SGA in chronic peritoneal dialysis (PD) patients, we compared SGA with the objective measurements.
Methods: This study enrolled 92 chronic PD patients (M: 36, F: 56) treated at PD unit of National Cheng Kung University Hospital. Their mean age was 42.0±13.7 years and the mean duration of PD was 3.7±3.1 years. SGA was performed by a single renal dietitian using 7-point SGA scale (L. McCann, Dial Transplant 1996; 25:190-202) and also measured the biochemistry parameters, anthropometry, and muscle strength.
Results: SGA was significantly related to serum albumin (r=0.52, p<0.0001), hand grip strength (r=0.47, p<0.0001), and pinch strength (r=0.46, p<0.0001). Started body weight, present body weight, anthropometric parameters, hand-grip strength, pinch strength, and serum albumin were all significantly higher in well-nourished (SGA 6-7 scales) PD patients than those malnourished (SGA 2-5 scales) patients.
Conclusions: 7-point SGA scale is a simple clinical method to assess the nutritional status in chronic PD patients. These malnourished patients had significantly decreased body mass index, muscle mass, and muscle strength.
Wu H.L.1, Huang J.J.2, Sung J.M.2, Wang M.C.2, Huang Y.J.3, Tseng C.C.2, Depts of Nutrition1 & Internal Med,2 National Cheng Kung Univ Hospital, Tainan; Institute of Food & Nutrition,3 Providence Univ, Taichung, Taiwan.
Adiponectin in Maintenance Peritoneal Dialysis and Hemodialysis Patients
Adiponectin (Adpn) is a low molecular peptide secreted by adipose tissue and has been found to he related to cardiovascular disease. In the present study we investigated the plasma levels of Adpn in our peritoneal dialysis (PD) and hemodialysis (HD) patients. 30 PD patients and 30 HD patients as well as 20 age- and gender-matched normal controls were included in the study. Plasma Adpn levels were measured by ELISA methods. The serum IL-6, TNF-α, ultra-C-reactive protein, prealbumin, transferrin, triglyceride, total cholesterol were also measured. Plasma Adpn levels in the PD patients group [2.335±1.673 mg/L) were significantly higher than those of normal control group (1.442±0.632 mg/L) and HD patients (1.256±0.613 mg/L). In PD patients, higher Adpn levels were associated with higher body mass index and better nutritional status whereas such relationship was not found in HD patients. There was no significant correlation between serum inflammatory markers, serum lipid profile, and serum Adpn levels. Our data suggest that plasma Adpn levels were higher in PD patients compared to HD patients and normal controls and that the higher Adpn levels in PD patients was linked to better nutritional status. Inflammation and lipid abnormality did not seem to affect Adpn levels.
Zhang A.H., He L., Zhu N., Han Q.F., Fan M.H., Peking University Third Hospital. Beijing, China.