
Abstract
Background:
Cross-sectional studies showed that fluid overload (FO) measured by bioimpedance spectroscopy (BIS) predicted adverse outcomes in patients on peritoneal dialysis (PD). We aimed to describe the longitudinal change in volume status in Chinese PD patients and determine its relation with clinical outcomes.
Methods:
We performed a single-centre, retrospective analysis of all PD patients who underwent repeated BIS from 2010 to 2015. FO was defined by relative hydration index (RHI; volume of overhydration adjusted by extracellular water >7%). Variability of volume status (VVS) was denoted by the standard deviation of all RHI. The association of time-averaged RHI and VVS on patient and technique survival was explored by a competing risk model.
Results:
A total of 269 patients were followed for a median of 47.1 months. Mean time-averaged RHI was 17.6 ± 10.2%. Multivariable mixed linear regression revealed that RHI was significantly associated with diabetes, time-varying systolic blood pressure, and inversely with time-varying albumin level, lean tissue index and fat tissue index (p <0.0001 for all). Time-averaged RHI independently predicted patient survival (subdistribution hazard ratio (SHR) 1.05, 95% CI 1.03–1.07, p <0.0001) and technique survival (SHR 1.04, 95% CI 1.02–1.06, p <0.0001), whereas VVS did not. The mortality risk for patients with persistent FO was consistently higher than the corresponding risk estimated from baseline FO of the same extent.
Conclusions:
Persistent FO was a strong predictor of patient and technique failure. Repeated bioimpedance measurements to monitor volume status may provide additional prognostic information in PD patients.
This is a visual representation of the abstract.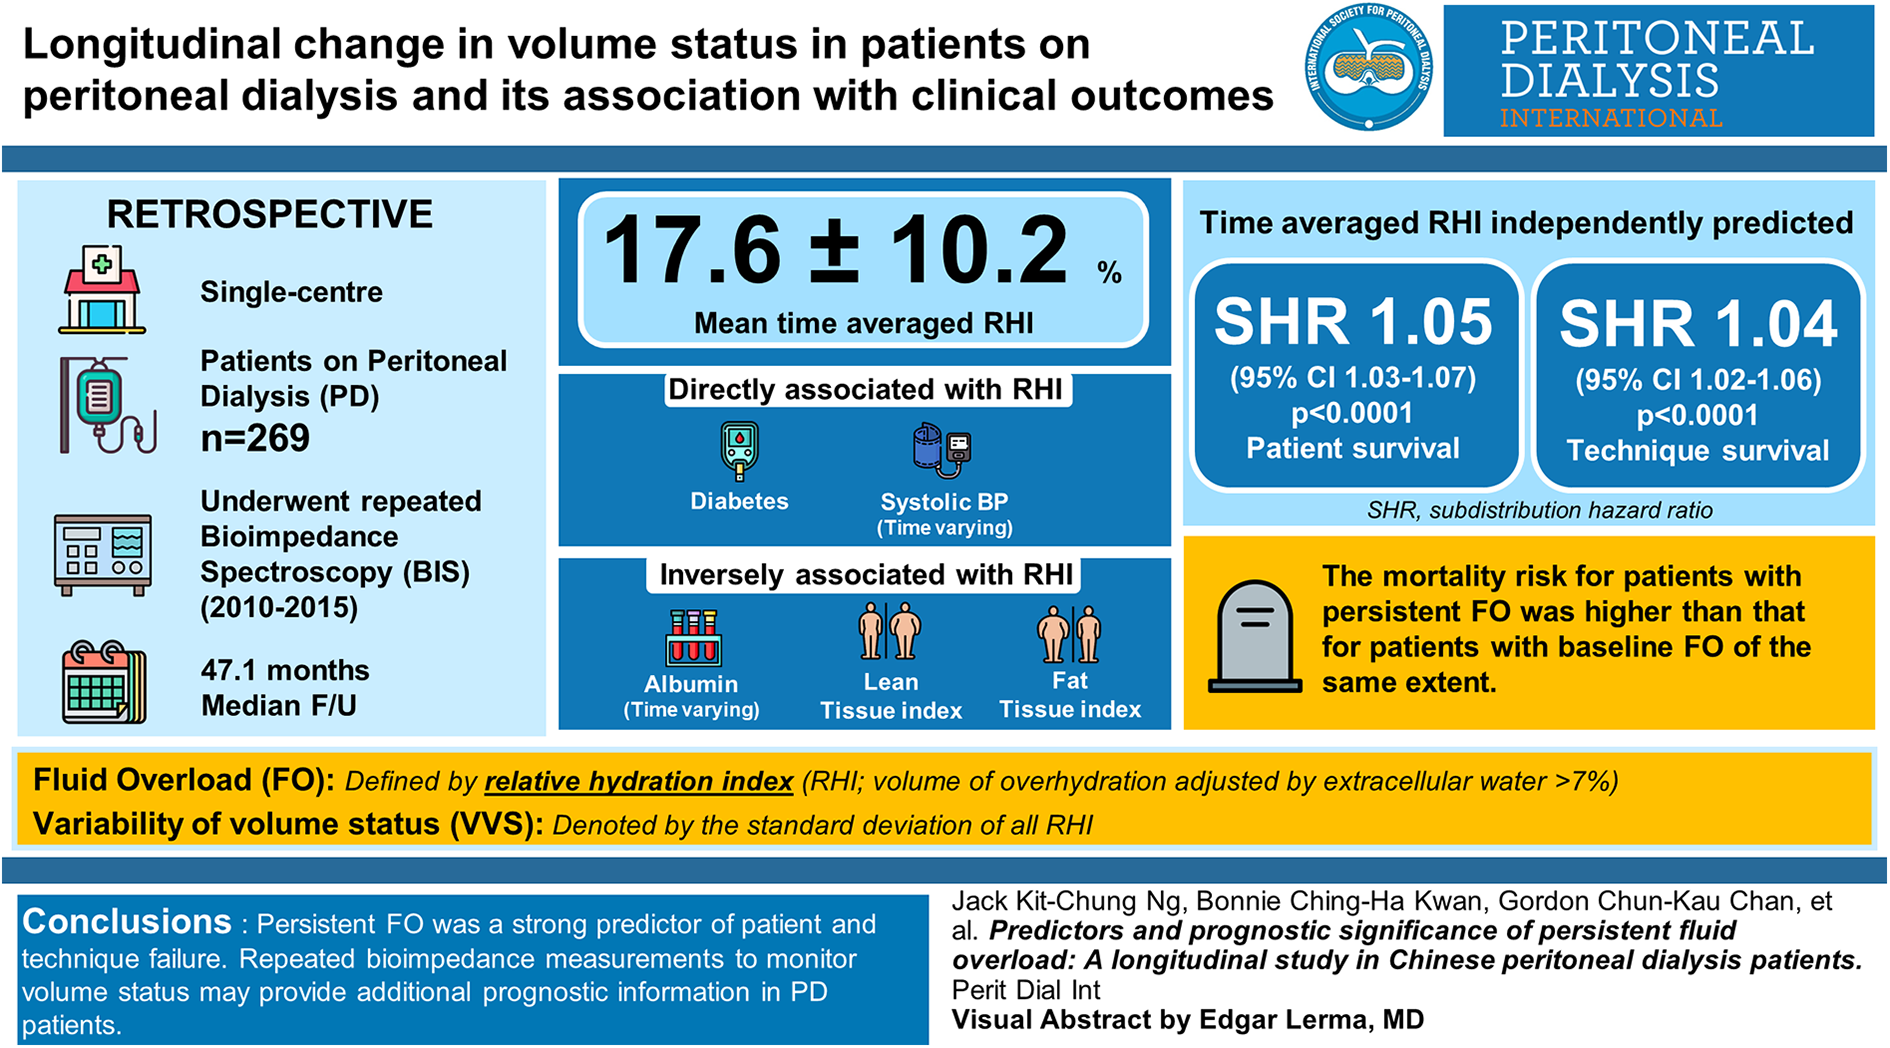
Introduction
Maintaining euvolemia is one of the most important treatment goals for patients on peritoneal dialysis (PD), who have exceedingly high burden of cardiovascular diseases (CVDs). 1,2 However, traditional clinical assessments are often unreliable and subjective, especially in detecting occult fluid overload (FO). In contrast, bioimpedance study enables quantitative measurement of body composition which are non-invasive and highly reproducible. 3,4 Published evidence suggested that FO defined by bioimpedance methods predicted patient survival, technique survival and CVD in PD patients. 5 –9 However, some of these studies only assessed hydration status at baseline, 5 –7 while others with repeated bioimpedance measurement were limited by small sample size or relatively short duration of follow-up. 8,9
On the other hand, the relationship between variation of volume status and clinical outcomes was seldom studied. A retrospective study showed that higher standard deviation (SD) of extracellular water/intracellular water (E/I ratio), which indicated more fluctuation in hydration status, was associated with mortality and technique failure. 10 However, the association became insignificant after adjustment of nutrition and inflammation. Recently, the Initiative for Patient Outcomes in Dialysis-Peritoneal Dialysis (IPOD-PD) study reported that the volume status of incident PD patients tended to stabilize over time; and baseline clinical parameters and PD prescription did not predict change in volume status over first 6 months. 11 Repeated measurements of volume status over a longer period of follow-up may provide additional insight on the variability of volume status (VVS) and potential modifiable factors on the course of hydration status.
In the present study, we aimed at describing the longitudinal changes in volume status of Chinese PD patients and to explore predictive factors of volume status. Second, we evaluated the prognostic value of repeated bioimpedance measurements compared with single baseline measurement. Third, we examined the association between variability in volume status and clinical outcomes.
Patients and methods
Study design
This study was approved by the Joint Chinese University Hong Kong-New Territories East Cluster Clinical Research Ethics Committee (CREC Ref. 2008.276 and 2015.250). All studies procedures are in compliance with the Declaration of Helsinki. A multi-frequency bioimpedance spectroscopy (BIS) device (Body Composition Monitor (BCM), Fresenius Medical Care, Germany) was introduced to our unit in 2010. Since then, we performed bioimpedance study on every incident (≤4 weeks after initiation of PD) and prevalent (>4 weeks after PD) patients for at least one time during outpatient visit. Whether the patients required subsequent BCM measurements were at the discretion of clinicians. In this retrospective study, we reviewed all PD patients who were followed up in a tertiary hospital from January 2010 to December 2015. Patients with a minimum of two body composition measurements were included. Both incident and prevalent patients were eligible. Patients who had history of metallic prosthesis or pacemaker implantation were contraindicated for bioimpedance study and thus were excluded.
Data collection
Baseline demographics and PD prescriptions were retrieved by reviewing medical records of patients. Charlson’s Comorbidity Index (CCI) was calculated to reflect the burden of comorbidities. Systolic blood pressure (SBP), diastolic blood pressure (DBP) and body weight (BW) were measured during baseline and at subsequent bioimpedance studies. Laboratory data within 2 months of bioimpedance study were recorded for analysis.
BIS measurement
The volume status of PD patients was determined by BCM which was validated in both general population and dialysis patients. 12 In essence, BCM measures impedance by passing electric current with 50 different frequencies via two electrodes attached on the patients in a spine position. Based on a three-compartment model which assumes normally hydrated adipose and lean tissues, excessive fluid can be estimated and expressed in absolute litres of volume of overhydration (OH). 13 We also calculated the relative percentage of excessive fluid by dividing OH by extracellular water (ECW), which was known as relative hydration index (RHI). 14 All BCM were performed with PD fluid in-situ by the same research nurse with the same device.
Patients were considered to have no, mild, moderate and severe FO if their RHI was ≤7%, >7.0–15.0%, >15.0–25.0% and >25.0%, respectively. In addition to established cut-offs at >7% 14 and >15%, 8,15 we also included >25% as our previous study showed that PD patients at the highest tertile of OH/ECW (i.e. RHI > 25.1%) had lowest patient survival and cardiovascular event-free survival. 7 Volume status of individual patient was represented by baseline RHI and time-averaged RHI (defined as the weighted mean of all RHI of each patient, with weights representing the time elapsed since the previous measurement). On the other hand, VVS was denoted by SD and of all RHI.
In addition to volume status, nutritional parameters including fat tissue index (FTI) and lean tissue index (LTI) were automatically computed by BCM. Clinicians were allowed to adjust PD prescriptions at their discretion based on BCM data.
Follow-up and outcomes
All patients were followed until 31st July 2017. Outcomes included patient survival and technique survival, which was defined as a composite of death or transfer to hemodialysis (HD) (for at least 90 days).
Statistical analyses
Continuous data were presented as mean ± SD or median (interquartile range (IQR)). Baseline characteristics of patients with different degree of FO were compared by one-way analysis of variance (ANOVA) or Chi-square test where appropriate. Then we constructed a linear mixed model to present the change of RHI from baseline to the fourth year of follow-up (BCM measurements in year 5 were excluded due to limited number of data). Subjects were included as random intercept, while time of BCM measurements (number of years after baseline assessment) were included as fixed effect. All variables in Table 1, together with FTI and LTI, were first included in the model. Variable selection according to Akaike’s information criteria (AIC) 16 was then used to determine the final covariates to be included as fixed effects. The final model was evaluated by maximum likelihood technique. An autoregressive covariance was assumed as in previous published study. 11
Baseline demographics, biochemical data and dialysis characteristics in patients with no fluid overload (OH/ECW ≤ 7%), mild fluid overload (OH/ECW > 7.0–15%) and moderate to severe fluid overload (OH/ECW > 15.0%).a
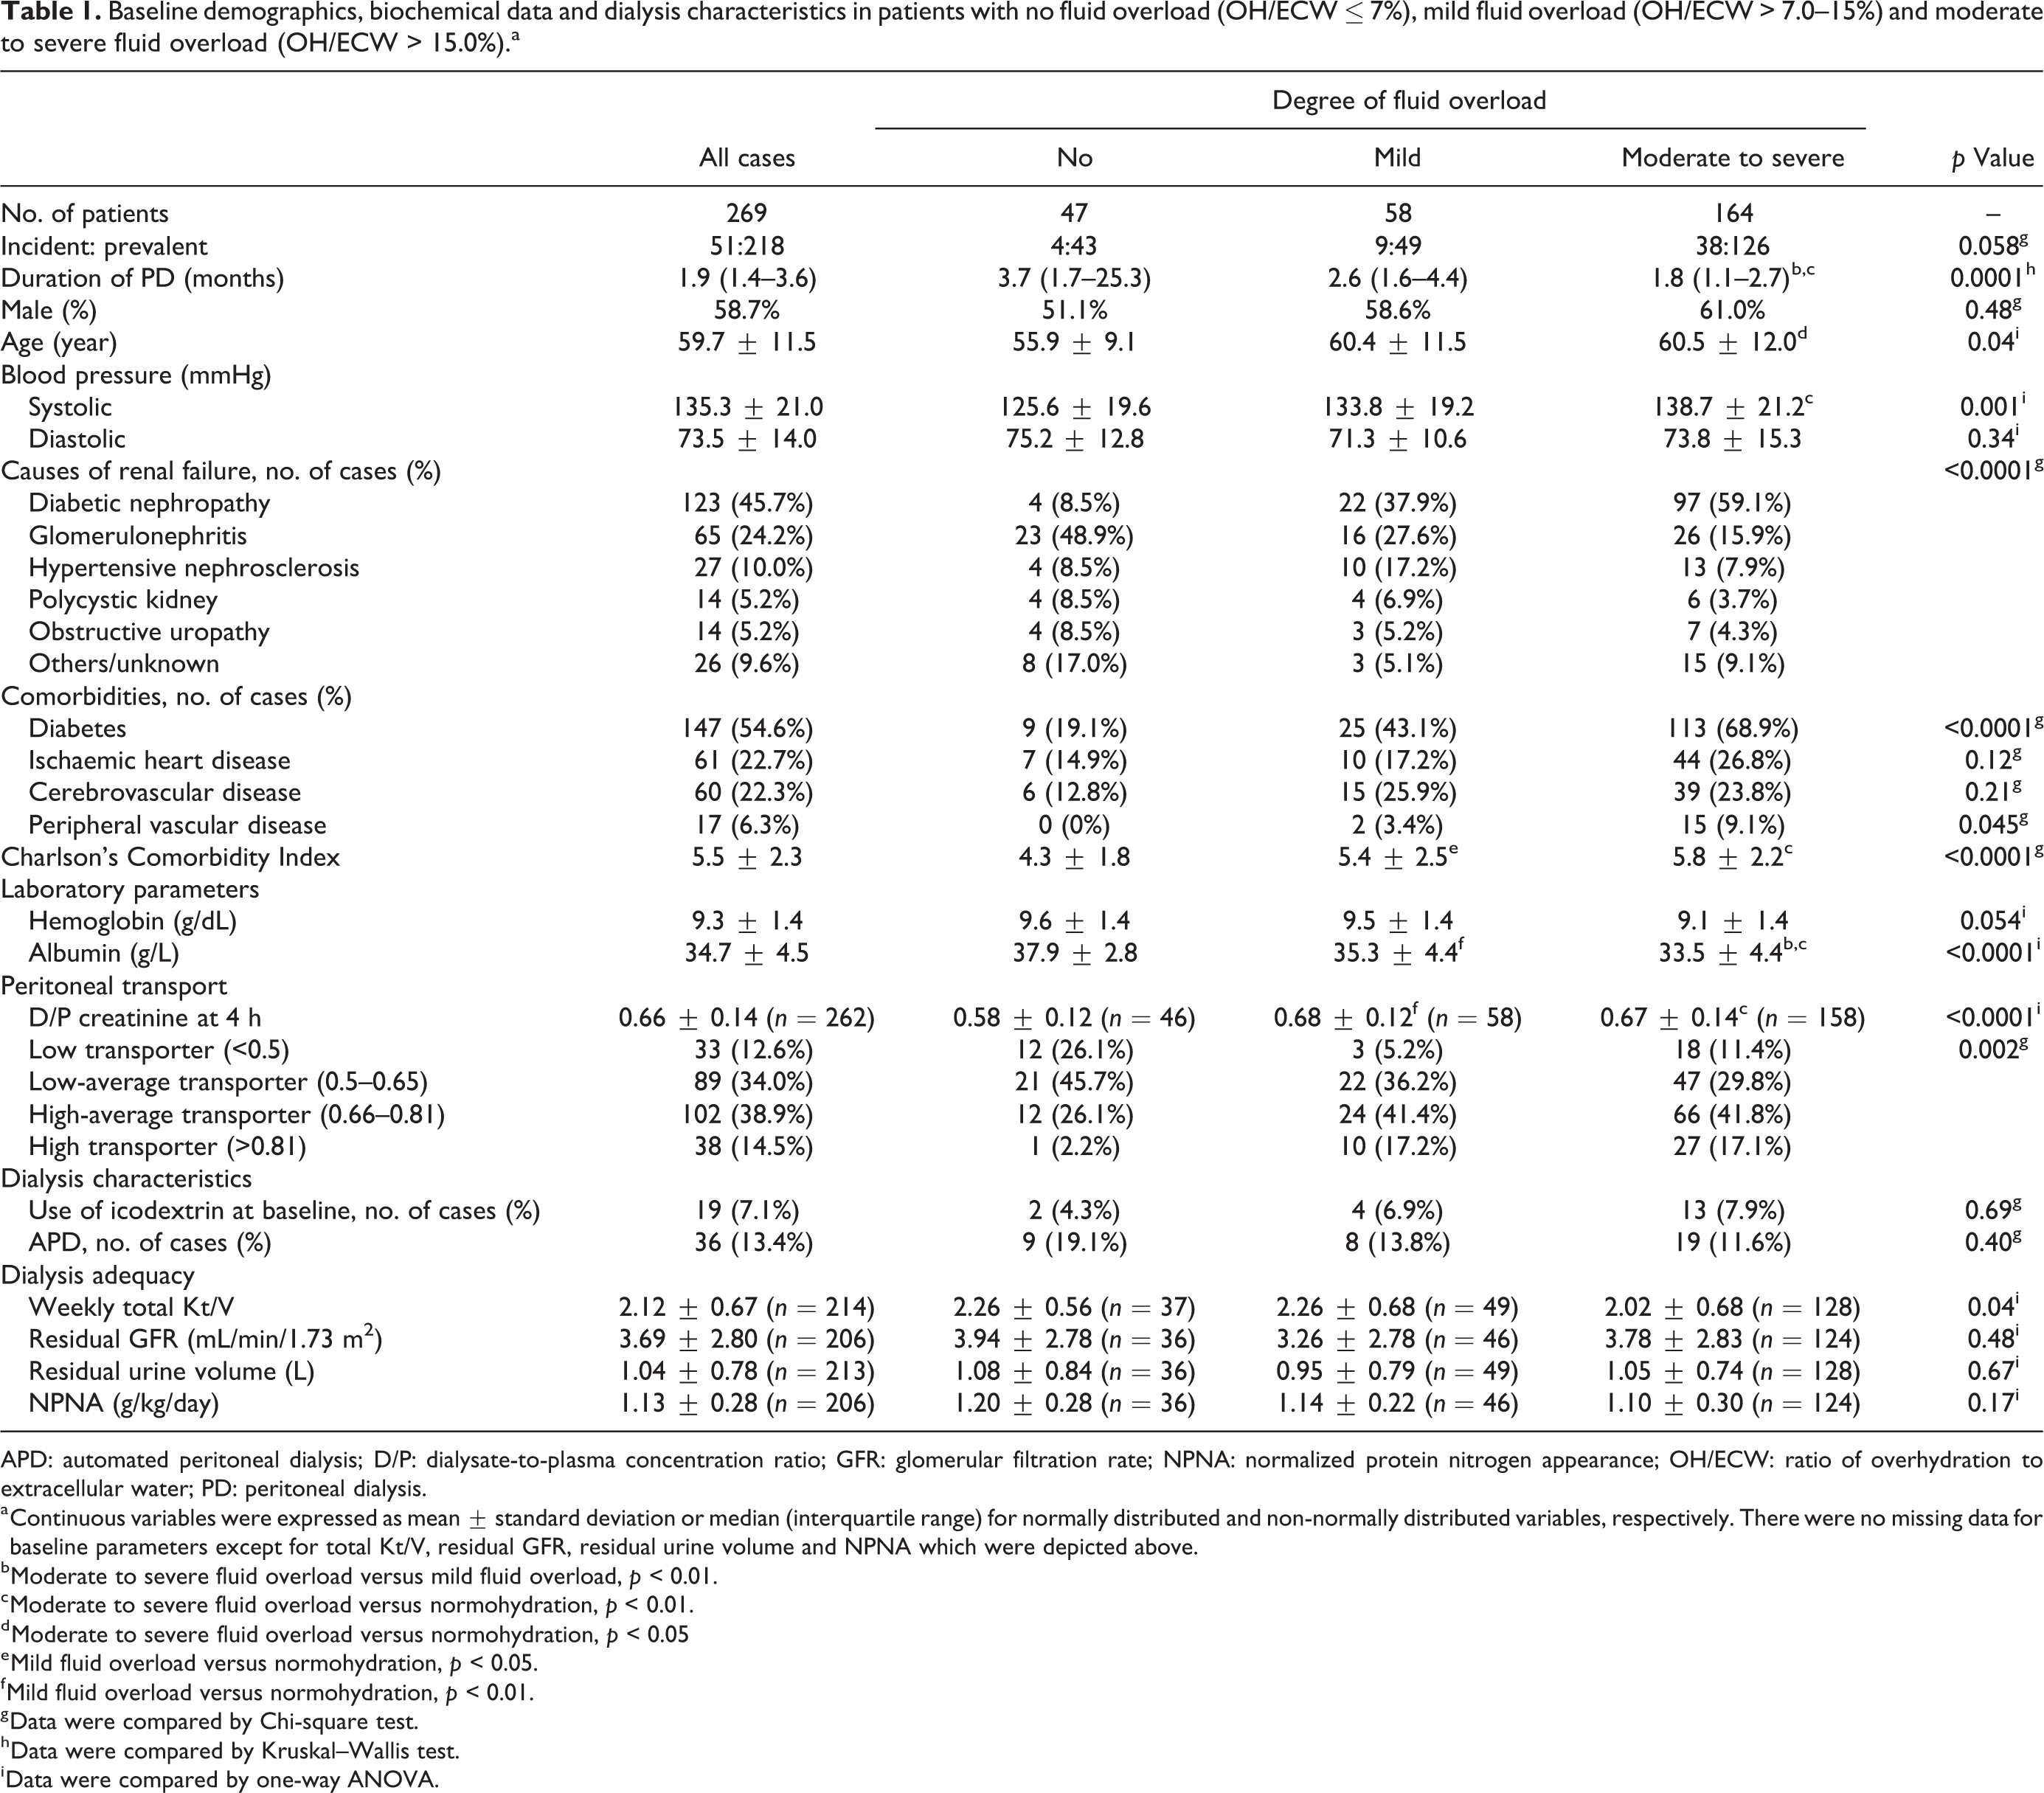
APD: automated peritoneal dialysis; D/P: dialysate-to-plasma concentration ratio; GFR: glomerular filtration rate; NPNA: normalized protein nitrogen appearance; OH/ECW: ratio of overhydration to extracellular water; PD: peritoneal dialysis.
a Continuous variables were expressed as mean ± standard deviation or median (interquartile range) for normally distributed and non-normally distributed variables, respectively. There were no missing data for baseline parameters except for total Kt/V, residual GFR, residual urine volume and NPNA which were depicted above.
b Moderate to severe fluid overload versus mild fluid overload, p < 0.01.
c Moderate to severe fluid overload versus normohydration, p < 0.01.
d Moderate to severe fluid overload versus normohydration, p < 0.05
e Mild fluid overload versus normohydration, p < 0.05.
f Mild fluid overload versus normohydration, p < 0.01.
g Data were compared by Chi-square test.
h Data were compared by Kruskal–Wallis test.
i Data were compared by one-way ANOVA.
The association between RHI and patient and technique survival were examined by Fine and Gray competing risk model. 17 The selection of covariates was again based on AIC which balanced the explanatory power and complexity of model. 16 Candidate variables included age, gender, duration of PD, CCI, body mass index, SBP, serum albumin, APD at baseline, transporter status, weekly Kt/V and residual urine output. Results were presented as subdistribution hazard ratio (SHR) given the aim to determine the prognostic effect of persistent FO on clinical outcomes. Transfer to HD for at least 90 days and transplantation were considered as competing risks of patient survival; and transplantation was considered as competing risk of technique survival. Transfer to other centres and recovery of renal function were considered as censoring events in both survival models. SD of OH/ECW (the surrogate of VVS) were natural log-transformed due to skewed distribution. Baseline RHI together with potential confounders measured at baseline (as stated above), and time-averaged RHI with the same time-averaged parameters were analysed in two separate multivariable competing risk model, where VVS was forced into one of them. Fit of model was assessed and compared by AIC. In addition, we tested the proportionality assumption of model by including interaction term of each predictor with time. Finally, cumulative incidence curves were generated to compare between categories of volume status.
For sensitivity analyses, we repeated our survival analyses with patients with ≥3 RHI measurements, and mixed linear model with exclusion of LTI and FTI due to potential intrinsic linkage with RHI. Moreover, in a post-hoc decision, we constructed a mixed linear model which only included BCM measurements from baseline to year 2 due to potential informative censoring related to increasing dropout rate after year 2.
All statistical analyses were performed by SPSS for Windows software (version 24.0. IBM Corporation, Armonk, NY) and Stata version 15 (StataCorp LP, College Station, TX). A p value of less than 0.05 was considered significant. All probabilities were two-tailed.
Results
Bioimpedance studies were performed in 337 patients during the study period, in which 272 patients had at least two repeated measurements. Two hundred sixty-nine patients with complete body composition data were included in the final cohort. At baseline, 158 (58.6%) were male and the mean age was 59.7 ± 11.5 years; 13.4% of them were on automated peritoneal dialysis (APD) (Table 1). The overall prevalence of diabetes was 54.6%. First BCM study showed that 58 (21.6%) patients had mild FO, while 164 (61.0%) had moderate to severe FO. Patients with FO were older yet with a shorter dialysis vintage. They had higher SBP, higher prevalence of diabetes and heavier burden of comorbidities. Besides, FO was accompanied by a significantly lower albumin level, and a trend towards anaemia. Nevertheless, there was no significant difference between weekly Kt/V, residual glomerular filtration rate (GFR) or urine output (Table 1 and S1).
Change in volume status over time
A total of 695 bioimpedance studies were performed during the study period. The number of bioimpedance studies that a patient underwent ranged from 2 to 5. The median number of measurements were 2 (IQR 2–3); 40.5% of patients were studied three times or more. The median interval between consecutive BCM measurements was 12.1 (IQR 10.5–13.3) months.
At year 0, the median RHI was 18.3% (IQR 10.5–26.1%). It decreased to 16.2% (IQR 8.1–24.6%) after the first year, which was followed by a numerical increase from second to fifth year (Figure 1 and Table S2). The proportion of patients with FO was 82.5%, 79.1% and 86.2% in year 0, 1 and 2, respectively (Table S2). Unadjusted mixed linear model, however, did not reveal an overall change in RHI with time (p = 0.21). Mean time-averaged RHI and median VVS was 17.6 ± 10.2% and 6.3% (IQR 3.2–9.1%), respectively.
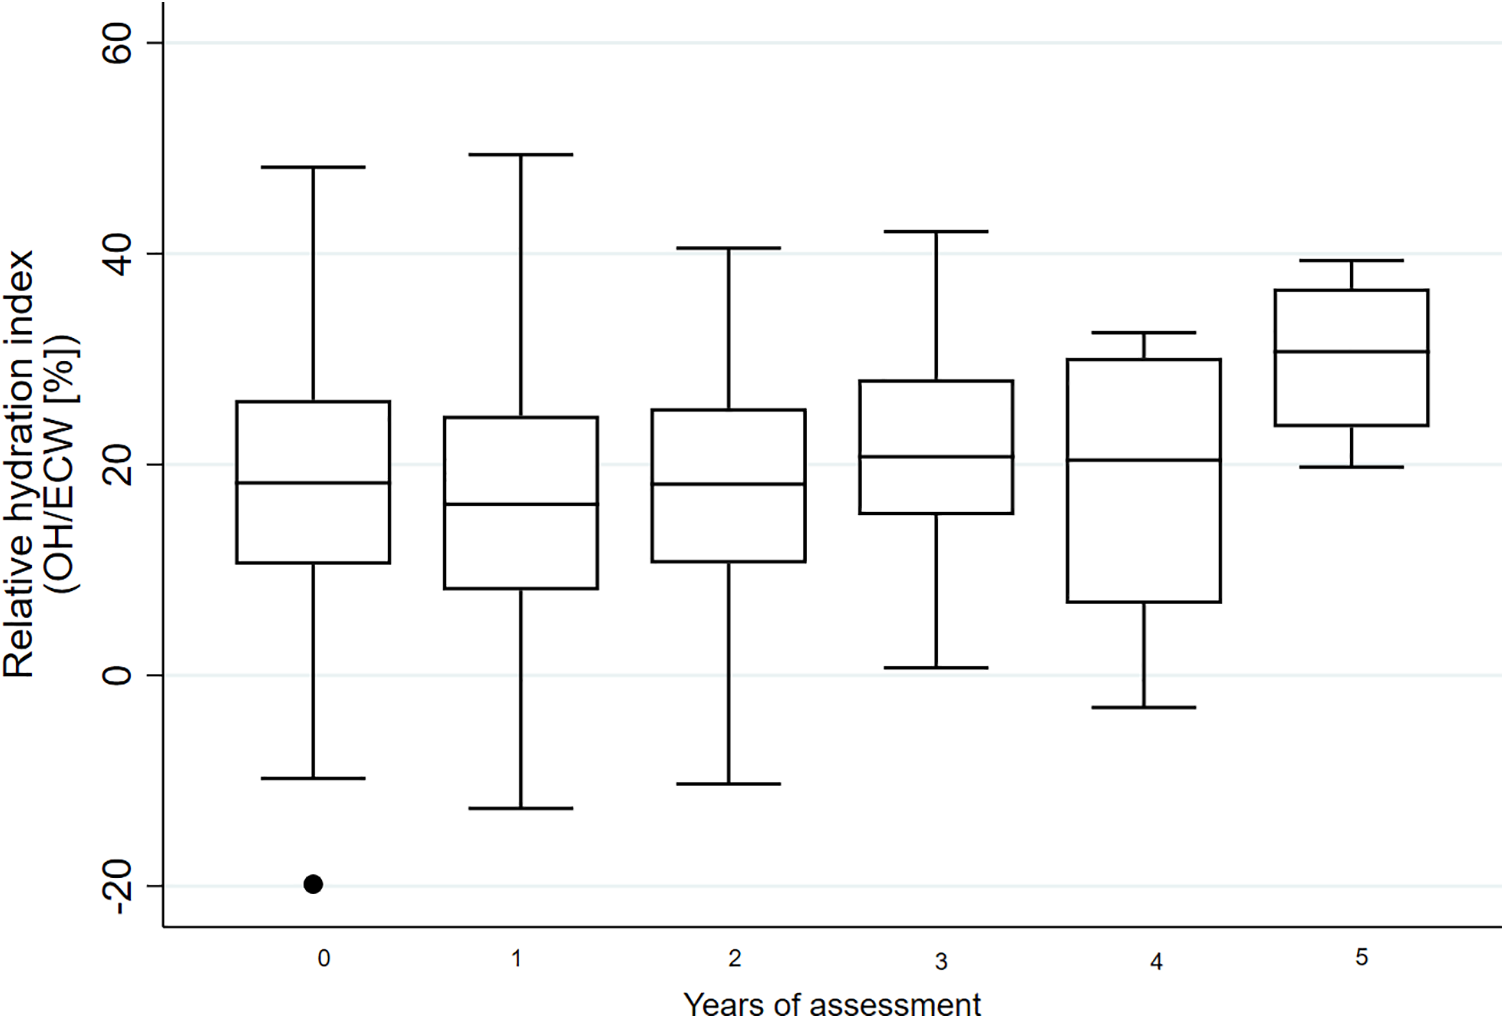
Change in relative hydration index (RHI) over time. The upper border, central line and lower border of the boxplot depicted 75th percentile, median and 25th percentile, respectively. The whiskers indicated 1.5 times of interquartile range from 25th or 75th percentile.
Table 2 showed the results of multivariable mixed linear regression after variable selection according to AIC. RHI was significantly associated with baseline diabetes, time-varying SBP, and inversely with time-varying albumin level, weekly Kt/V, LTI and FTI. In contrast, baseline peritoneal transport status (p = 0.12) and residual urine output (excluded in the final model) were not associated with change in volume status. Sensitivity analyses, which either limited BCM measurements from baseline to year 2 or exclusion of LTI and FTI, showed similar associations with RHI and aforementioned covariates (Table S3 and S4).
Predictors of volume status (relative hydration index) by multivariable mixed linear model.a
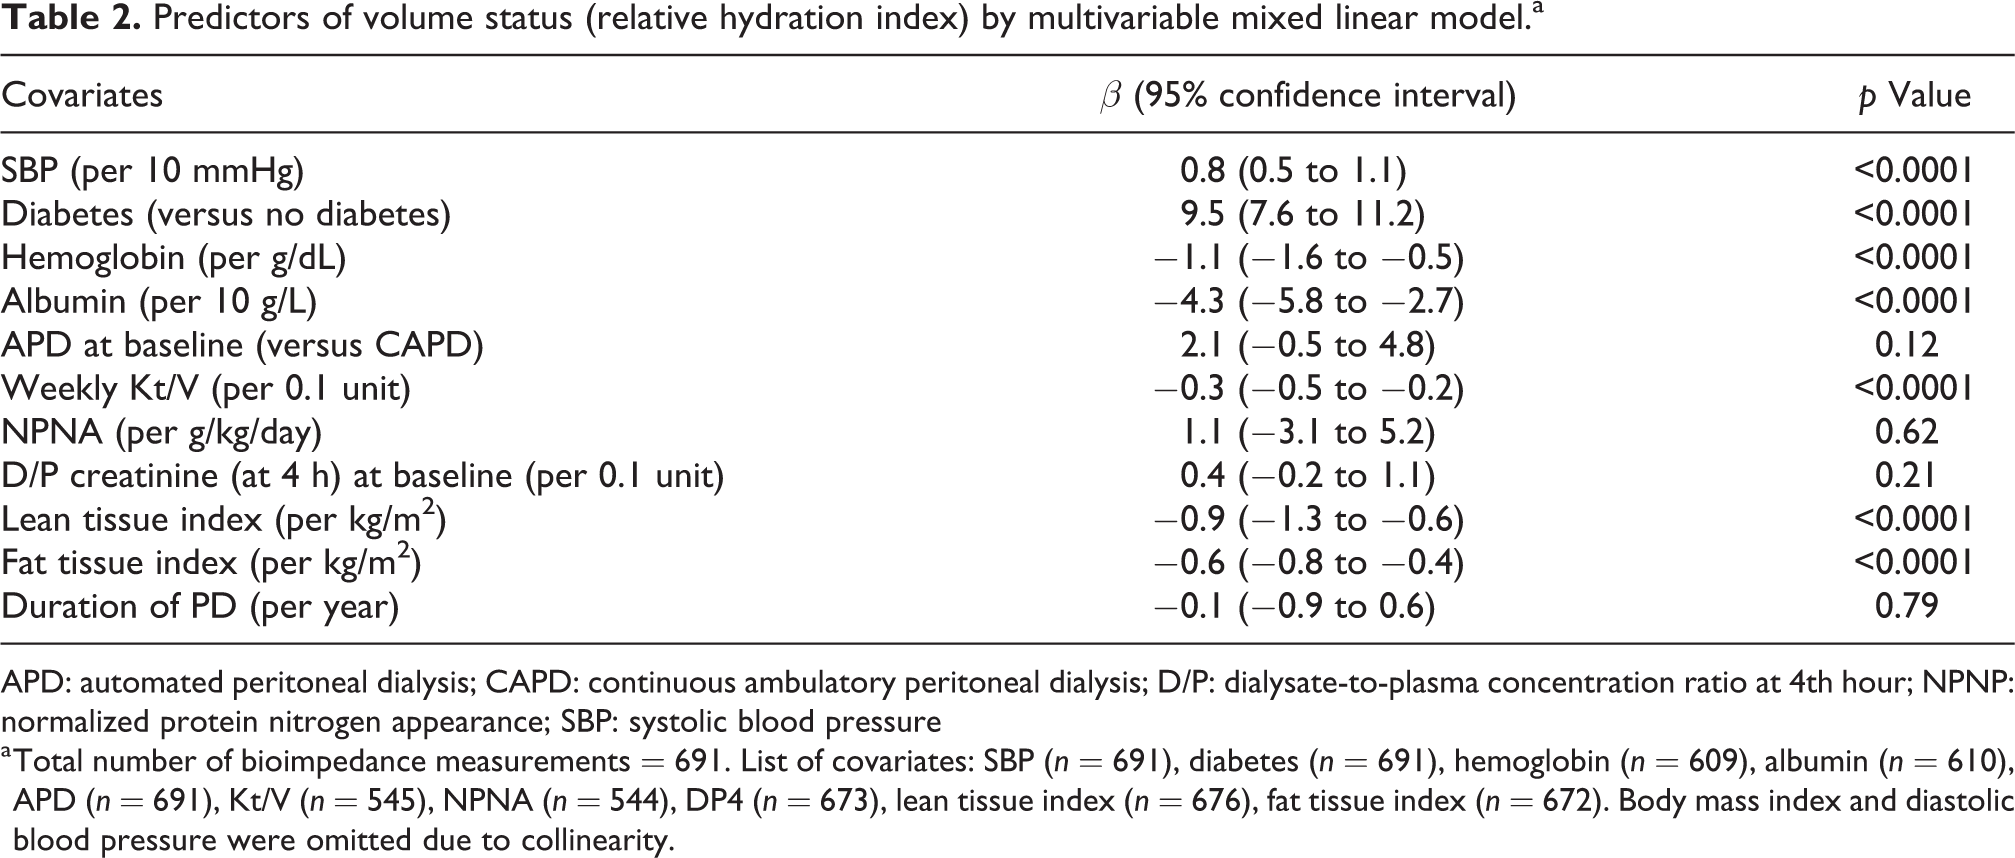
APD: automated peritoneal dialysis; CAPD: continuous ambulatory peritoneal dialysis; D/P: dialysate-to-plasma concentration ratio at 4th hour; NPNP: normalized protein nitrogen appearance; SBP: systolic blood pressure
a Total number of bioimpedance measurements = 691. List of covariates: SBP (n = 691), diabetes (n = 691), hemoglobin (n = 609), albumin (n = 610), APD (n = 691), Kt/V (n = 545), NPNA (n = 544), DP4 (n = 673), lean tissue index (n = 676), fat tissue index (n = 672). Body mass index and diastolic blood pressure were omitted due to collinearity.
Patient and technique survival
All patients were followed for a median of 47.1 (IQR 32.0–60.3) months. During this period, 121 patients died. Their causes of death were non-peritonitis infections (47 cases), CVDs (27 cases), cerebrovascular diseases (16 cases), peritonitis (9 cases) and malignancy (7 cases). In addition, 25 patients were transferred to long-term HD, 16 received kidney transplant, and 4 were transferred to another centre.
In a multivariable competing risk model, patients with persistent moderate or severe FO had significant increased risk of death (SHR 2.67, 95% CI 1.15–6.20, p = 0.02; SHR 3.90, 95% CI 1.62–9.42, p = 0.002, respectively), compared with those with persistent euvolemia (time-averaged RHI ≤ 7%), after adjustment for age, dialysis vintage, comorbidities and nutrition status (Figure 2). The mortality risk for patients with persistent FO was consistently higher than those with baseline FO of the same extent (baseline moderate FO: SHR 2.03, 95% CI 1.07–3.86, p = 0.03; baseline severe FO: SHR 2.41, 95% CI 1.23–4.73, p = 0.01) (Table S5).
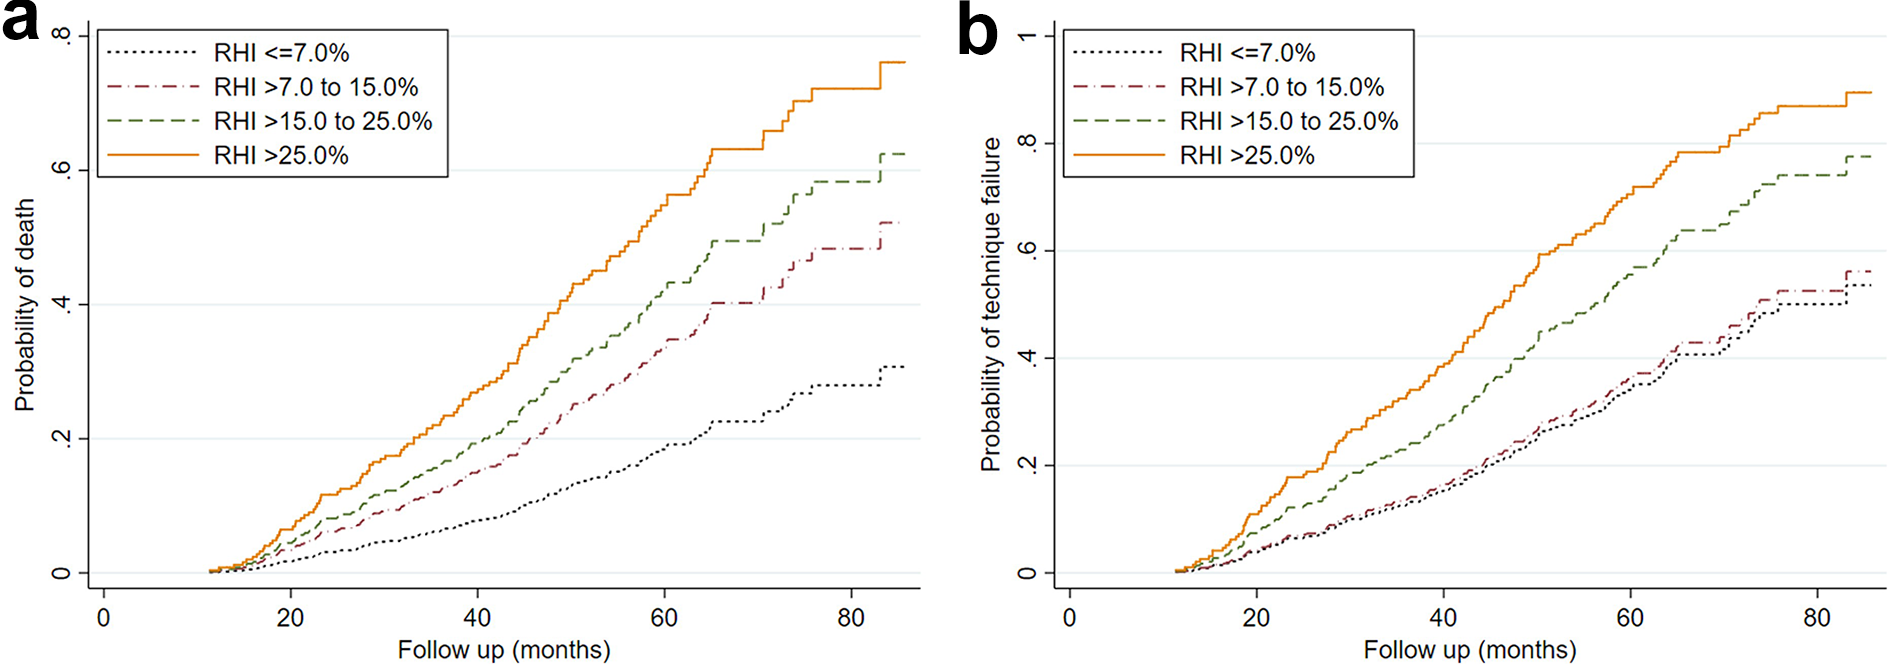
Cumulative incidence curves showing the effect of time-averaged volume status on (a) patient survival and (b) technique survival. Patients were grouped according to degree of fluid overload (FO) (nil: RHI ≤ 7%, mild: >7–15%; moderate: >15–25%; severe FO: >25%).
To evaluate the prognostic value of VVS and repeated BCM measurement, three competing risk models were constructed for patient and technique survival, respectively (Table 3). In essence, both baseline RHI and time-averaged RHI were independent predictor of patient and technique survival, whereas VVS were not. Each 1% increase in time-averaged RHI was associated with 5% increase in subdistribution hazard of patient mortality (SHR 1.05, 95% CI 1.03–1.07) and 4% increase in subdistribution hazard of technique failure (SHR 1.04, 95% CI 1.02–1.06), respectively. Specifically, this should be interpreted as evidence that a 1% increase in time-averaged RHI was associated with a 5% increase in the rate of death in subjects who were either event-free (e.g. who were still alive) or who had experienced a competing event. 18 The same held true for the analysis of technique failure. In addition, time-averaged RHI provided additional prognostic value compared with baseline RHI, which was reflected by a lower AIC in both models (Table 3: patient survival: 1157.1 (model 2) vs. 1183.0 (model 1); technique survival: 1417.2 (model 2) vs. 1442.6 (model 1)), and the fit of model was not improved by inclusion of VVS. In a sensitivity analysis which only included ≥3 BCM measurements (n = 106), VVS was not associated with mortality (p = 0.32) nor technique failure (p = 0.47).
Prognostic value of baseline volume status, variability of volume status and time-averaged volume status in different models considering patient survival and technique survival.
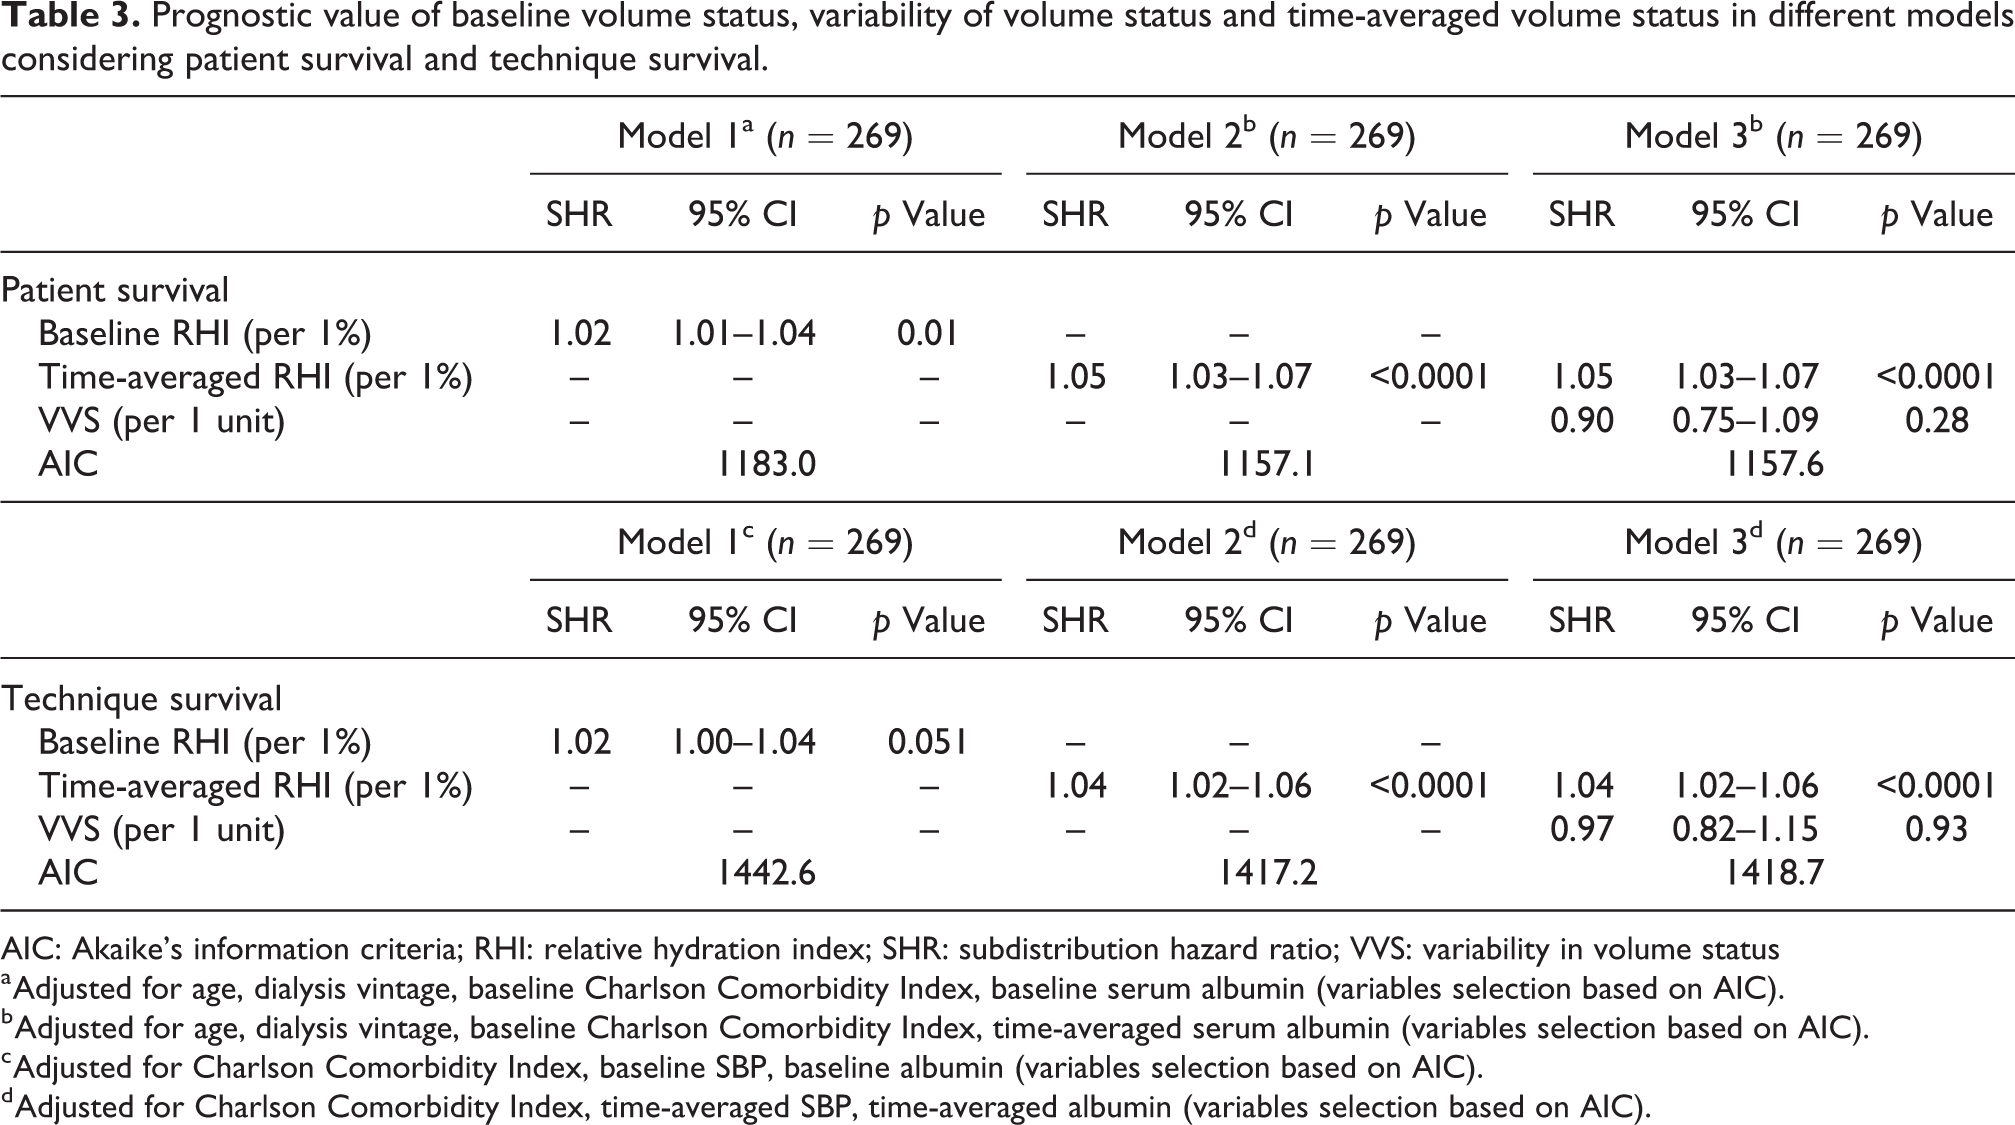
AIC: Akaike’s information criteria; RHI: relative hydration index; SHR: subdistribution hazard ratio; VVS: variability in volume status
a Adjusted for age, dialysis vintage, baseline Charlson Comorbidity Index, baseline serum albumin (variables selection based on AIC).
b Adjusted for age, dialysis vintage, baseline Charlson Comorbidity Index, time-averaged serum albumin (variables selection based on AIC).
c Adjusted for Charlson Comorbidity Index, baseline SBP, baseline albumin (variables selection based on AIC).
d Adjusted for Charlson Comorbidity Index, time-averaged SBP, time-averaged albumin (variables selection based on AIC).
Discussion
In this longitudinal cohort of Chinese PD patients, FO measured by BCM was present in a substantial proportion of patients at baseline which persisted over time. Hypervolemia was strongly associated with diabetes, malnutrition, inadequate dialysis, and diminished lean and fat body mass. Moreover, persistent FO, instead of VVS, independently predicted patient and technique survival. Compared with FO measured at a single time-point, persistent FO was associated with a significantly greater risk of mortality and technique failure.
Previous studies suggested that volume status of PD patients hardly changed after 12 months of follow-up. 8 In our study, RHI decreased from 18.3% to 16.2% after the first year; and similar decline was also observed in the IPOD-PD study (baseline RHI: 9.7%; year 1: RHI 6.6%). 11 This discrepancy could be attributed to the difference in baseline volume status: the average RHI in the cohort by Kim et al. (7.6% (IQR −0.1 to 15.6%)) 8 was remarkably lower than that in our study (18.3% (IQR 10.5–26.1%)) and IPOD-PD study (9.7 ± 11.1%). 11 Therefore it may not be surprising that initial improvement of volume status was largely observed in the latter two studies, in which the BCM findings may prompt the clinicians for optimization of fluid status. However, while volume status tended to stabilize with roughly 50% of patients rendered euvolemic in IPOD-PD study, our results indicated that over 70% of PD patients remained hypervolemic in subsequent follow-up (Table S2). Hence, we also explored possible predictors of volume overload in this longitudinal study.
Similar to the findings of previous cross-sectional studies 7,14 and a recent 12-month longitudinal study, 19 our study (Table 2) showed that diabetes, hypoalbuminaemia and lower weekly Kt/V (all p values <0.0001) were independent predictors of hypervolemia. Of note was that our study encompassed repeated BCM measurements over a longer duration of follow-up and may provide more robust evidence to affirm their associations. On the other hand, residual urine volume and baseline peritoneal transporter status were not associated with volume status. This suggested that dietary compliance and appropriate adaption of dwell length to transporter status may play a greater role in maintaining normohydration. Interestingly, we found that time-varying FTI (p < 0.0001) and LTI (p < 0.0001) were inversely associated with volume status. Although one may expect that FTI, LTI and RHI were intrinsically linked as they were derived from the same three-compartment model, 20 our data did not reveal any correlation between RHI and FTI (r = −0.002, p = 0.98) or LTI (r = −0.05, p = 0.38) at baseline. On the other hand, the combination of low fat and lean body mass, and hypoalbuminaemia constituted the phenotype of protein-energy wasting, which was reported to be associated with OH. 21 Systemic inflammation, which is prevalent among dialysis patients, may result in unnoticed reduction in FTI or LTI and inaccurate estimation of dry weight, 22 culminating in fluid retention. Reciprocally, FO may indirectly cause muscle wasting by aggravating inflammation via increased bacterial translocation through bowel wall. 23,24 Moreover, there was growing evidence from animal models to suggest cardiac natriuretic peptides, which are frequently elevated in volume overload, may play a key role in the development of PEW by activation of inducible brown adipocytes. 25 Unfortunately, inflammatory markers (e.g. C-reactive protein) were not routinely measured in our centre and were not available for analyses.
Previous studies suggested that visit-to-visit blood pressure variability was associated with increase in mortality and cardiovascular events in HD patients. 26,27 This variability was, at least partially, attributed by the drastic and non-physiological change in extracellular volume during HD, which was followed by interdialytic fluid accumulation. Likewise, aggressive fluid control in overhydrated PD patients might lead to rapid fluctuation of fluid status, which causes depletion in intravascular volume and organ hypoperfusion. It had been reported that PD patients with greater fluid variation had faster decline in GFR and urine output. 28 Another single-centre Chinese study examined the association of SD of E/I ratio (as the proxy of magnitude of changes in volume status over time) and clinical outcomes. 10 However, the prognostic value of E/I ratio was confounded by nutritional state and C-reactive protein. 10 The predictive power of RHI (in the present study) was known to be independent of nutrition and inflammation. 5 Nevertheless, we were still unable to demonstrate any significant association between VVS and patient or technique survival. One of the possible reasons may be that relative long interval between BCM masked the underlying variability. The fact that approximately half of patients only underwent BCM twice may also fail to unravel VVS. However, sensitivity analysis which included ≥3 BCM measurements produced similar results.
In a multivariable competing risk model adjusted for age, dialysis vintage, comorbidities, and nutrition (Table 3), time-averaged RHI was significantly associated with increase in mortality (SHR 1.05, 95% CI 1.03–1.07) and technique failure (SHR 1.04, 95% CI 1.02–1.06), respectively. When volume status was analysed as a categorical variable, persistent moderate and persistent severe FO independently predicted an increase in subdistribution hazard of death by 2.7 and 3.9 times, respectively. A recent meta-analysis which examined bioimpedance-defined FO in end stage renal disease patient revealed a similarly increase in mortality by 2.28 times (HR 2.28, 95% CI 1.56–3.34) in patients with RHI >15%. 29 However, it should be noted that among the eight cohorts included in this subgroup meta-analysis, only one study specifically included PD patients; and most of the remaining studies, irrespective to the modality of dialysis, investigated the impact of baseline RHI.
On the other hand, we observed that the risk of persistent FO was considerably higher than that of baseline FO within the same category (Table S5). This suggested that persistent FO was a stronger risk factor than FO based on cross-sectional measurement, which was a consistent finding from previous observational studies in both PD and HD patients. 8,30 This was particularly relevant because initial improvement in volume status was not uncommon (as in our cohort) when clinicians attempted to correct FO after knowing the first BCM data, and that may attenuate the predictive power of baseline FO. While cumulative exposure to FO was proved to increase the risk of HD conversion in short to medium term, 8,31 our study expanded the existing evidence that persistent FO remained a significant and potentially modifiable predictor for technique failure after a median follow-up of 47 months. Although it remained controversial to include death as a component of technique failure (as in current study), 32 we believed this was relevant in our locality where a PD-first policy has been adopted and clinicians may have a high threshold for HD conversion. Death on PD may thus imply failure of this modality to provide life-sustaining therapy to patients with end stage renal disease. 31
Our study had a number of limitations. First, the inherent limitation of a retrospective observational study did not allow us to establish causality. Nevertheless, the longitudinal design with repeated, objective assessment by BCM provided more robust estimate between volume status and associated factors compared with cross-sectional studies. Second, survival bias may be present because only survivors would undergo repeated BCM measurements. Similarly, we could not exclude possible selection bias because the decision to perform subsequent bioimpedance study was at the discretion of clinicians. In addition, significant number of BCM measurement was missing from year 2 onwards. This may introduce informative censoring in analysing the trajectory of volume status. Hence, our findings may be speculative. Third, data on ultrafiltration volume and salt intake were missing in many patients and thus not included for analyses. Nevertheless, ultrafiltration volume had not been shown to predict hypervolemia in both incident and prevalent patients 7,14 ; and there was no simple surrogate for dietary sodium intake in clinical practice. Besides, we did not evaluate the impact of change in PD modality nor prescription because the use of APD and icodextrin were, to some extent, governed by availability. The generalizability of our study may be hampered by the single-centre design and the fact that CAPD was the major PD modality in Hong Kong. Nevertheless, the IPOD-PD study had demonstrated that despite a lower usage of APD and icodextrin in Asia Pacific, subjects were able to maintain a stable volume status after 3 years. 11 This highlighted the complex interaction between patient factors and centre practices in maintaining euvolemia. Finally, we could not exclude type II error concerning the effect of VVS on clinical outcomes, given the limited number of BCM measurements.
In conclusion, persistent FO was associated with increase in mortality and technique failure. Despite the additional prognostic value brought about by repeated bioimpedance measurements, there is unfortunately insufficient evidence that supports the use of routine bioimpedance-guided fluid management to improve clinical outcomes. 33,34 Future studies are warranted to identify the subgroup that will benefit most for bioimpedance-guided fluid management.
Supplemental material
Supplemental Material, sj-docx-1-ptd-10.1177_08968608221110491 - Predictors and prognostic significance of persistent fluid overload: A longitudinal study in Chinese peritoneal dialysis patients
Supplemental Material, sj-docx-1-ptd-10.1177_08968608221110491 for Predictors and prognostic significance of persistent fluid overload: A longitudinal study in Chinese peritoneal dialysis patients by Jack Kit-Chung Ng, Bonnie Ching-Ha Kwan, Gordon Chun-Kau Chan, Kai Ming Chow, Wing Fai Pang, Phyllis Mei-Shan Cheng, Chi Bon Leung, Philip Kam-Tao Li and Cheuk Chun Szeto in Peritoneal Dialysis International
Footnotes
Acknowledgements
None.
Author contributions
JKCN and BCHK conceived the idea of this study. JKCN and CCS devised the method of analysis. PMSC performed all bioimpedance studies. BCHK, GCKC, WFP and KMC collected data, and JKCN and CCS carried out the statistical analyses. JKCN prepared the manuscript. CBL, PKTL and CCS supervised the whole project and provided mentorship. All authors provided intellectual input and endorsed to the final manuscript.
Data availability statement
The data underlying this article will be shared on reasonable request to the corresponding author.
Declaration of conflicting interests
The author(s) declared the following potential conflicts of interest with respect to the research, authorship, and/or publication of this article: Prof. Philip Li received speaker honoraria from FibroGen, AstraZeneca and Baxter Healthcare. All other authors declare no conflicts of interest.
Ethical approval
This study was approved by the Joint Chinese University Hong Kong-New Territories East Cluster Clinical Research Ethics Committee (CREC Ref. 2008.276 and 2015.250).
Funding
The author(s) disclosed receipt of the following financial support for the research, authorship, and/or publication of this article: This study was supported by the Chinese University of Hong Kong (CUHK) research accounts 6901031 and 7101215. The funders had no role in study design, data collection and analysis, decision to publish, or preparation of the manuscript.
Informed consent to participate
Written informed consent was obtained from all subjects before the study.
Informed consent to publish
Written informed consent was obtained from the patient(s) for their anonymized information to be published in this article.
Trial registration
Not applicable.
Supplemental material
Supplemental material for this article is available online.
References
Supplementary Material
Please find the following supplemental material available below.
For Open Access articles published under a Creative Commons License, all supplemental material carries the same license as the article it is associated with.
For non-Open Access articles published, all supplemental material carries a non-exclusive license, and permission requests for re-use of supplemental material or any part of supplemental material shall be sent directly to the copyright owner as specified in the copyright notice associated with the article.