
Abstract
Public transit systems are crucial to mobility and access in cities throughout the world. This article addresses the importance of these transit systems in San Antonio, Texas. We show how transit systems exacerbate race and class inequality and the accessibility of city spaces with a focus on San Antonio’s buses. Using mixed methods (surveys, interviews, ethnography, and document analysis) we illustrate that poor and working-class Latinx communities experience reduced access to resource rich areas of the city when they are dependent upon the city’s public transportation. To better describe this experience we use the concepts, enclaves of exclusion and enclaves of inaccessibility. Our findings show that mobility through San Antonio for poor and working class Latinxs is limited especially for people in these communities who rely on public transit. This experience with these public transit systems often renders them as individuals who do not belong in certain neighborhoods, and ultimately reinforces the longstanding histories of race and class segregation in San Antonio.
Introduction
The famous and often quoted public statement attributed to Enrique Peñalosa, former mayor of Bogotá, notes that ‘An advanced city is not one where the poor can get around by car, but one where even the rich use public transportation’. His argument is crucial for many scholars researching the importance of public transit in large cities. Our research is centered on issues noted by Peñalosa, regarding access to city spaces and how public transit is interpreted as largely for those unable to afford cars. Focusing on San Antonio, Texas, we examine how this city is segregated by social class and race, and how the city is accessed through the public transit system. We collected survey data and in-depth semi-structured qualitative interviews, we did content analysis of documents and websites from the city’s public transit agencies to show that San Antonio continues to be inaccessible as a city space for poor communities, working-class communities, and Latinx communities due to, in part, deficiencies in the public transit system.
As the article title notes San Antonio possesses what we term, enclaves of inaccessibility, which refers to urban systems that are not accessible or are difficult to access for those that are part of marginalized communities (also see premium network spaces by Graham and Marvin [2001] and elite spaces by Kahn [2014] and Sheller [2014]). We argue that these systems function as transportation enclaves predominantly for White and wealthy populations or more broadly for those with credentialed access (Kahn, 2014). Examples of these systems that we discuss in this project are both the transit spaces, for example, certain bus lines discussed later and car infrastructure that requires wealth and income to engage. Drawing on Karner et al.’s (2020: 440) understanding of transportation justice we examine the means by which these systems become exclusionary and how this exclusion is a violation of the potential opportunities for many in the city space to lead ‘a meaningful and dignified life’. We also draw on Sheller’s (2018a, 2018b) arguments on mobility justice, and specifically her understanding of ‘the politics of mobility’ and ‘uneven mobilities’. Importantly Sheller’s arguments allow for a recognition that in San Antonio there are poor, working class, and Latinx community members that have difficulty accessing these systems and ultimately experience limited access to city space; access that is crucial for the creation of thriving cities and communities.
Specifically, we use our concept of enclaves of exclusion as an understanding of how racial segregation and class segregation was historically woven into the built environment and conceptualize San Antonio’s physical space as it is currently organized as a continuation of these inequalities (Lipsitz, 2007; Martinez, 2020; Pattillo, 2007; Shapiro, 2004). Public transit systems, just as highways have historically, been used to actively maintain segregation, control the presence of Black and Latinx people, and are used to segregate poor and working-class communities from wealthier middle and upper middleclass communities (Avila, 2004, 2014; Bullard, 2004). Examples in this research of these enclaves of exclusion are neighborhoods and cities that exist within the San Antonio city limits, representing a form of ‘elite succession’ or ‘cocooning’ from the rest of the city space (Birtchnell and Caletrío, 2014; Shellers, 2018a). It is this space making rooted in race and class that we investigate in this project, with a focus on how spatial inequities are maintained by public transit across the urban environment. Specifically in the case of San Antonio, we focus on how these enclaves come to represent the presence of systemic inequalities in a majority-minority city space.
To accomplish this we examine three bodies of data. We look at two city documents where we show how the city ignores the transportation needs of San Antonio’s citizens and centers car infrastructures over public transit infrastructures. We also examine US Census data maps showing the relationship between race and class segregation and the bus lines throughout the city. As a supplement throughout the article we use data collected from 52 survey respondents and four semi-structured phone interviews with bus users to show how the citizens of San Antonio experience public transit. Utilizing these data provides a multilayered context for arguing that the public transit system in San Antonio maintains enclaves of exclusion and inaccessibility rather than facilitating mobility for the residents. We build our focus throughout the article on the concepts of enclaves of exclusion and enclaves of inaccessibility. Arguing that these concepts ultimately capture not only race and class segregation but also the manner in which transit systems play a role in this segregation.
Theory and Literature Review
The social scientific focus on these inequalities is largely centered on the maintenance of racial inequality through various forms of policy congealing around segregation (Farley, 2005; Ware, 2021). This informs our own project as we recognize that policies such as those that defund or direct funds away from infrastructures benefitting the most underserved communities are shaping San Antonio’s public transit. In cities, such as those in the US, that are rife with race and class inequality, mobility can function to make a city more equal for all its inhabitants (Logan and Molotch, 1987 [2007]; Massey, 1990; Purifoye, 2015; Quillian, 2012; Wellman, 2015; Yago, 1983). Gaining access to resources, leisure, work, and daily needs such as healthcare or food facilitates equitable dwelling experiences (Farhang and Bhatia, 2005). Transit infrastructures enable this access (Quamie, 2011). We ask how do physical infrastructures, such as public transit, function to reproduce and maintain race and class segregation? This research question aligns our project more directly with Rodgers and O’Neill’s (2012) work focused on what they term ‘infrastructures of violence’.
Infrastructure is a key factor shaping people’s direct relationships both with each other and with their environment in cities. It demarcates both literally and figuratively which points in urban contexts can and should be connected, and which should not, the kinds of people and goods that can and should circulate easily, and which should stay put, and who can and should be integrated within the city, and who should be left outside of it, for example (p. 402).
In San Antonio, there are clear divisions along both race and class lines, there are those who are included in the city space and those who are left out, there are points of access and points of exclusion throughout the city. Further drawing on Rodgers and O’Neill’s arguments on that infrastructure can be violent, we see that in San Antonio the residents have historically experienced infrastructural violence through segregation, with predominantly poor and working class Latinx communities living in the western and southern portions of the city and a predominantly middle and upper class white community living in the northern portions of the city. It is in these northern portions of the city there is a concentration of shopping districts, more desirable restaurants, wealthier neighborhoods, and even greater access to healthcare. This concentration of housing and other resources, while not ideal, should also be understood as inaccessible due to limited mobility and access in these areas via public transit. We argue this limitation has a significant impact on the poor and working classes as well as the Latinx population.
This means these spaces are disproportionately difficult to access with public transit and more importantly require one to have a car or access to a car to easily enter them. The costs associated with each is significantly different, with bus transit in San Antonio being among the lowest in the nation at $1.30 for a full fare or annually of $365.00 as of 2025. Average cost of car ownership in 2023 calculated by the US Department of Transportation is $8,318.00 fixed costs annually (Bureau of Transportation Statistics, 2025). A difference of almost $8000.00 is a significant amount for poor and working class communities resulting in public transportation being the most viable and reasonable option. In a city with 17% of its population living in poverty San Antonio ranks among the highest for this measure and given this high rate of poverty one would assume there is significant use of the city’s only public transit system, VIA Bus. However, it has a low usage rate of approximately 24 million riders (American Public Transportation Association, 2024). We argue this is due to the city’s transit system insufficiently providing mobility to its poor, working class, and Latinx communities.
To be clear these enclaves of exclusion are not impossible to access through public transit, but access is limited and is curtailed by the infrastructure, ensuring those using the public transit system limited entrance and those able to afford cars exclusive entrance. These spaces become what Graham and Marvin (2001) refer to as ‘premium networked spaces’ or spaces where access and resources are limited to few who possess the appropriate credential, class or racial status (p. 301). Graham and Marvin (2001) write,
For those enrolled in premium networked spaces of the splintering metropolis, unbounded bounties seem to await. Seductive spaces of domesticity, leisure, consumption, travel and work jostle for attention. These are partitioned off from spaces of (perceived) danger, difference, and poverty whilst being ever more seamlessly linked into the customized transport, energy, water, and communications that allow users to extend the action spaces to distant elsewhere [sic]. Beyond the reach of these networks, however, in the places abandoned by the modern infrastructural ideal, there are worlds of intense localisation [sic] and largely invisible confinement and exclusion, where participation in the benefits of modern networked urbanism is ever more problematic (p. 301).
This begs the question then, that in spite of being in a minority-majority city, how does San Antonio’s public transit system (re)produce segregation and exclusion through the maintenance of these enclaves of inaccessibility? Using Graham and Marvin we look at the transit system as a network infrastructure that produces and maintains systemic ‘confinement and exclusion’, through its policies, practices, and routes (also see Bullard, 2004; Sanchez, 2018). Scholars, such as Thomas Sanchez, argue that these public transit systems significantly shape upward mobility among those who are within the lower classes and because of this, transit infrastructure represents a right that should be equitably afforded to all (Sanchez, 2018 also see Karner et al., 2020). This leads us to also ask what is the relationship between public transit mobility and equity for cities such as San Antonio? Meaning that the continued dependence and creation of car-based infrastructure is fundamentally a physical infrastructure of classism as it functions to exclude those who are poor and working class. Similarly, we see this car dependent approach to cities lead to infrastructures of racism as highways and other infrastructure is built through communities of color with devastating effects (Avila, 2014; Bullard, 2004; also see Massey and Denton, 2019; Tourse et al., 2018). We build on this and argue that public transit structures maintain race and class inequality in San Antonio specifically. It is this maintenance of race and class inequality in San Antonio, a minority-majority city with a Latinx population of 65%, that is a crucial element to understanding the role of public transit’s safeguarding of segregation.
We draw on research focused on systemic and structural forms of inequality (Bonilla-Silva, 1997; Feagin, 2006; Gottdiener and Feagin, 1988) with particular focus on the role played by transit systems. We also focus on the literature on race and class segregation in U.S. urban spaces such as Purifoye’s (2015, 2017) research on micro-interactional components of racism and mobility. Using her approach we understand that these micro-interactions shape the ability for people of color to access transit systems and to access different parts of the cities in which they live. Her work also addresses the infrastructures that create barriers to access for Black and Latinx communities in Chicago (Purifoye, 2020). She notes,
Public transportation is often not a space of equity. Its inequities keep some publics trapped in place (physically and symbolically) while allowing others to freely and easily access and experience the wealth and delights of the urban core . . . Differentials in public transportation designs expose spatial inequalities that literally move through the city. Through these disparities, public transportation serves as spaces where the legacies of inequalities are perpetuated (Purifoye, 2017: 367).
Using Purifoye’s arguments regarding the ‘trapping of publics in place’ we recognize that there are significant systemic and structural forms of inequality that cordon off certain parts of San Antonio. Transit systems could be used to facilitate equity for these trapped publics yet, decades of race and class segregation are cemented by limited routes and minimal access. We show how public transportation design, in particular bus transit routes not only follow the race and class organization of the city but also work to maintain the segregation along these lines (also see Tyndall, 2017 for a discussion of its role in unemployment).
Focusing on access to abundantly resourced, predominantly white, and upper-middle class enclaves throughout the city we show how race and class integration is impaired by this limited mobility (Anderson, 2012; Purifoye, 2020). In particular, we focus on two enclaves of exclusion in San Antonio, Alamo Heights and Terrell Hills. There are several other examples within the city noted in the article, but these other examples are less centrally located and have smaller populations. As a point of clarification, these are cities that exist within the city of San Antonio. They benefit from the creation of their own tax structures that fund their own schools and their own civil services such as police and fire departments. Yet, to access certain amenities or just to simply travel to another side of town one will likely need to travel through these cities. It is our contention that these enclaves of exclusion exist, so that the white upper middle-class does not have to contribute to the larger tax-base of the predominantly Latinx and working-class city of San Antonio. White upper-class enclaves are not uncommon and stem from Jim Crow era segregation in many cities with San Antonio having similar origins for its own enclaves (Lipsitz, 2007; Martinez, 2020).
These enclaves of exclusion function similar to that of gated communities, where the residents have ultimate control over the comings and goings of individuals from outside their communities, thus assuaging their fears of the supposed dangerous city and its potential criminality (Blakely and Snyder, 1998; Low, 2001). All the while these enclaves enable their residents to exist within the city without existing within the city (Gottdiener et al., 2019; Romig, 2005). These cities within cities differ significantly in their power and contribution to San Antonio in which they reside. For example, while caveats exist, gated communities often contribute to city taxes and use the same amenities as those that live around them whereas cities in cities are insular providing its residents a true separation from San Antonio’s regulation and oversight. To the point of this article, they also provide a class and race buffer, that functions to exclude not only working class and people of color’s residence in these cities within cities, but through the minimization of public transit routes, stops, and general mobility through these spaces there is a significant increase in the degree to which these cities can control the presence of poor, working class, and Latinx San Antonio residents moving through them (Vesselinov, 2008).
Lastly, research focused on how there are differentials in access to public transit also undergird this project such that we see poor Latinxs having increased difficulty when attempting to access to these cities within cities leading to enclaves of inaccessibility. Mckenzie’s research underscores this and illustrates that depending upon one’s neighborhood of origin there may be difficulty in gaining access not just to another side of town but also to the public transit system itself (McKenzie and Rapino, 2011 also see Swyngedouw, 2013). This is important because in the end if San Antonians cannot access public transit they cannot access their jobs, doctors, or get groceries for their families.
Methods and Data Analysis
We implemented a 51-item survey to assess rider experiences across four areas: bus transit system use, smartphone use, experiences in San Antonio, and demographic data. These surveys were collected in-person at bus stops, indirectly through flyers and through a researcher created webpage. We deployed several means for data collection: face to face recruitment, strategically placed flyers (near bus stops and businesses near bus stops throughout the city), a webpage (mysmartsa.com) and direct advertising on 20 different VIA buses for 3 months. Participation was voluntary and was a convenience sample. Follow up semi-structured phone interviews with survey respondents that chose to share their contact information for more discussion of the topics were also conducted. These interviews lasted less than 30 minutes. The results of the survey were 100 responses with 52 fully completed surveys. We also completed four follow-up semi-structured phone interviews.
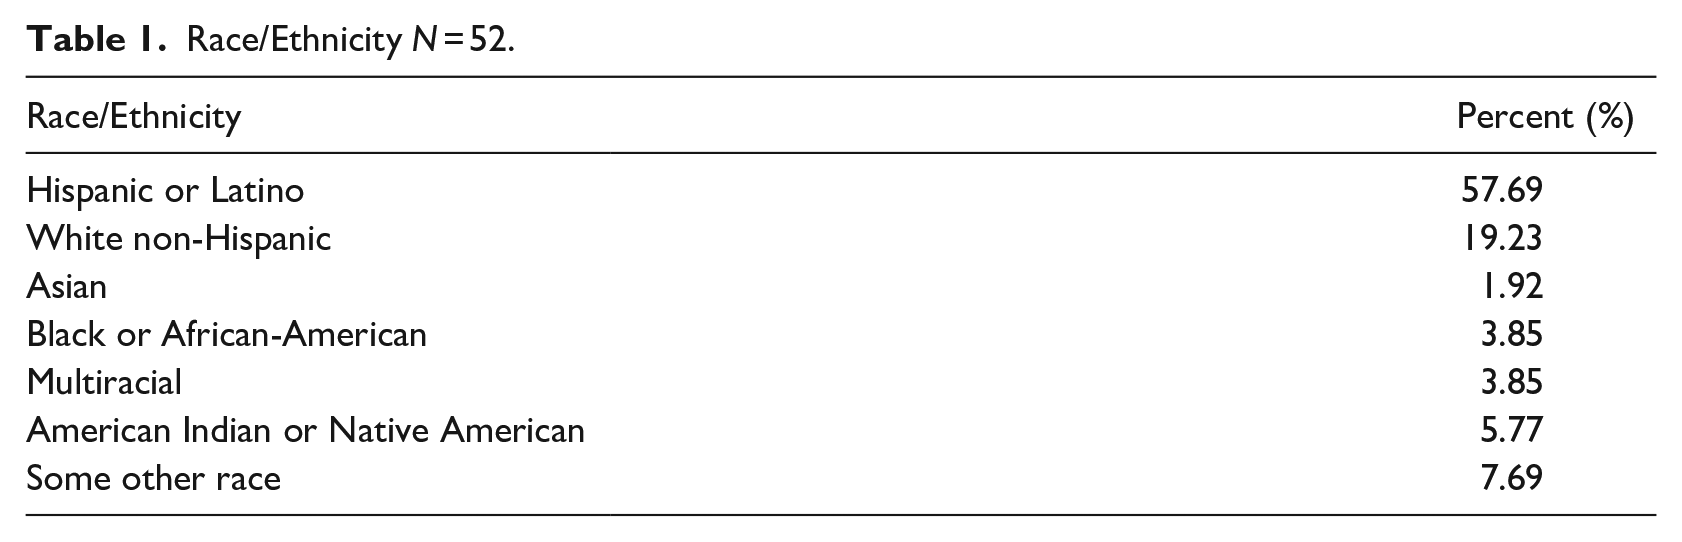
Our survey reflects similar demographics to that of the city of San Antonio, with a predominantly Hispanic/Latinx sample (Table 1). While less than that of the overall city itself it does reflect closely to almost 65% reported in the census data for San Antonio (US Census, 2024). Additionally we are underrepresented in the White non-Hispanic category, Black/African American category, Asian category and significantly underrepresented in the multiracial category. Our survey overrepresents the American Indian/Native American category.
Race/Ethnicity N = 52.
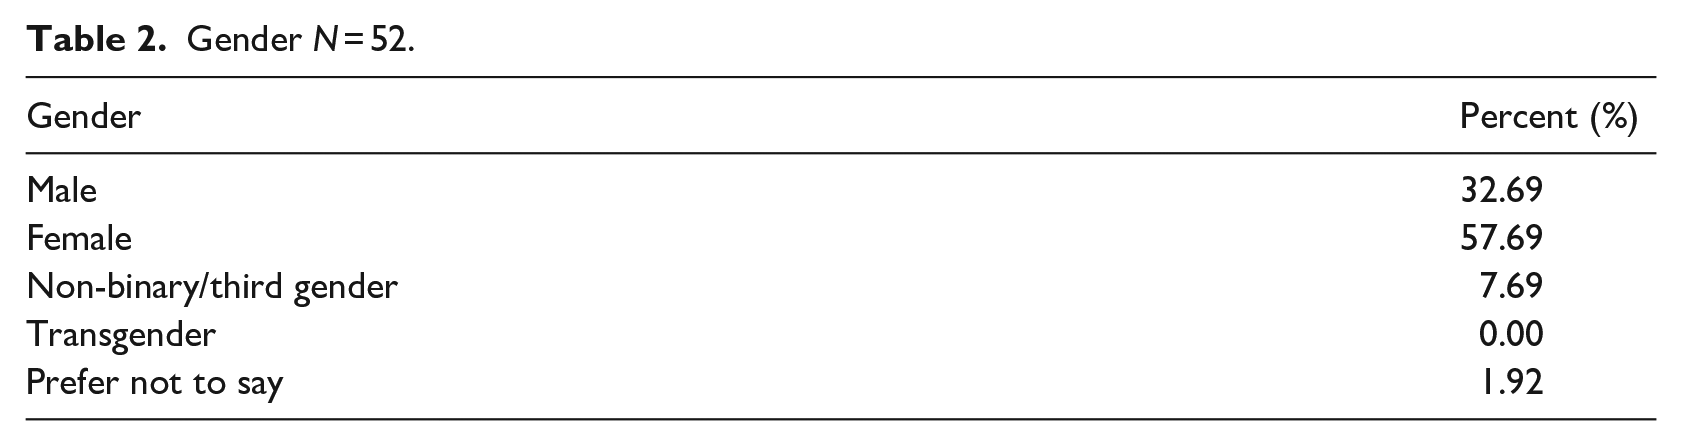
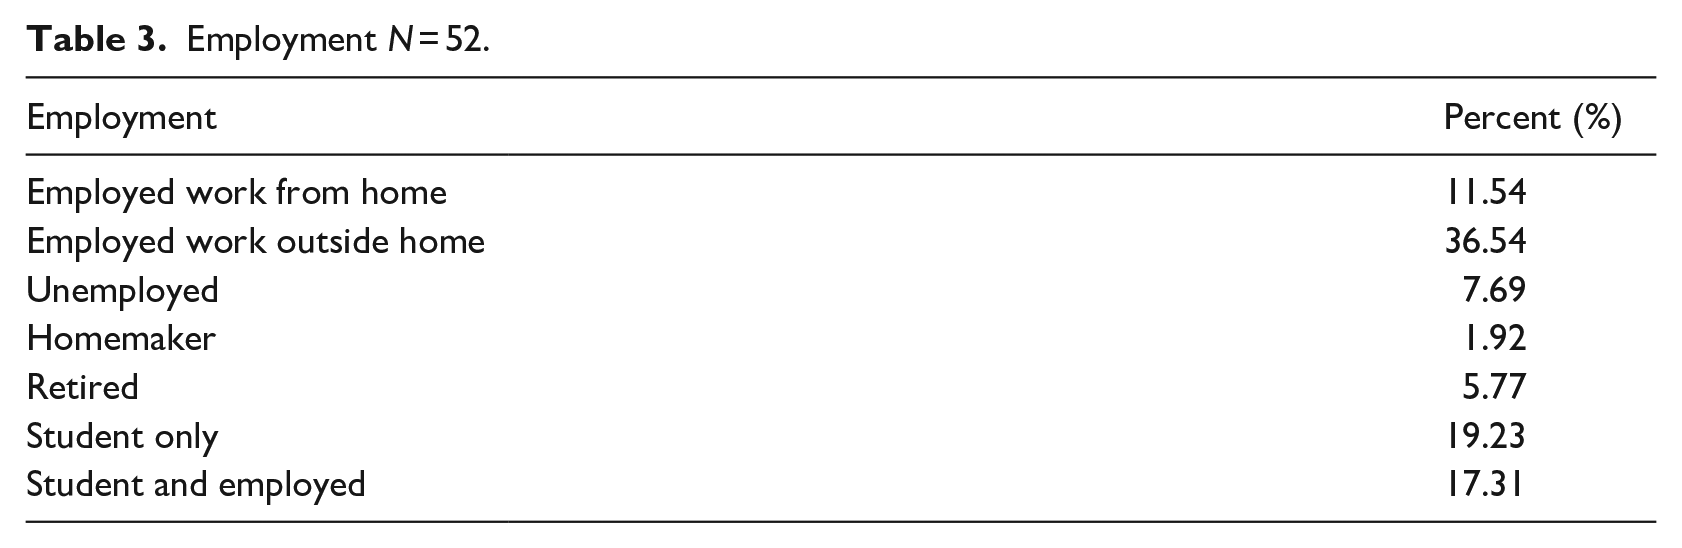
Other demographic data illustrates similar over/under representation, with an overwhelming majority of women at 57.69% and 32.69% men (Tables 2 and 3). This presence of women is significantly higher than the census which is at 50.5% women (US Census, 2024). With regard to employment status our sample unemployment rate is higher than the national rate of 4.1% and for San Antonio of 3.4% (Bureau of Labor Statistics, 2024).
Gender N = 52.
Employment N = 52.
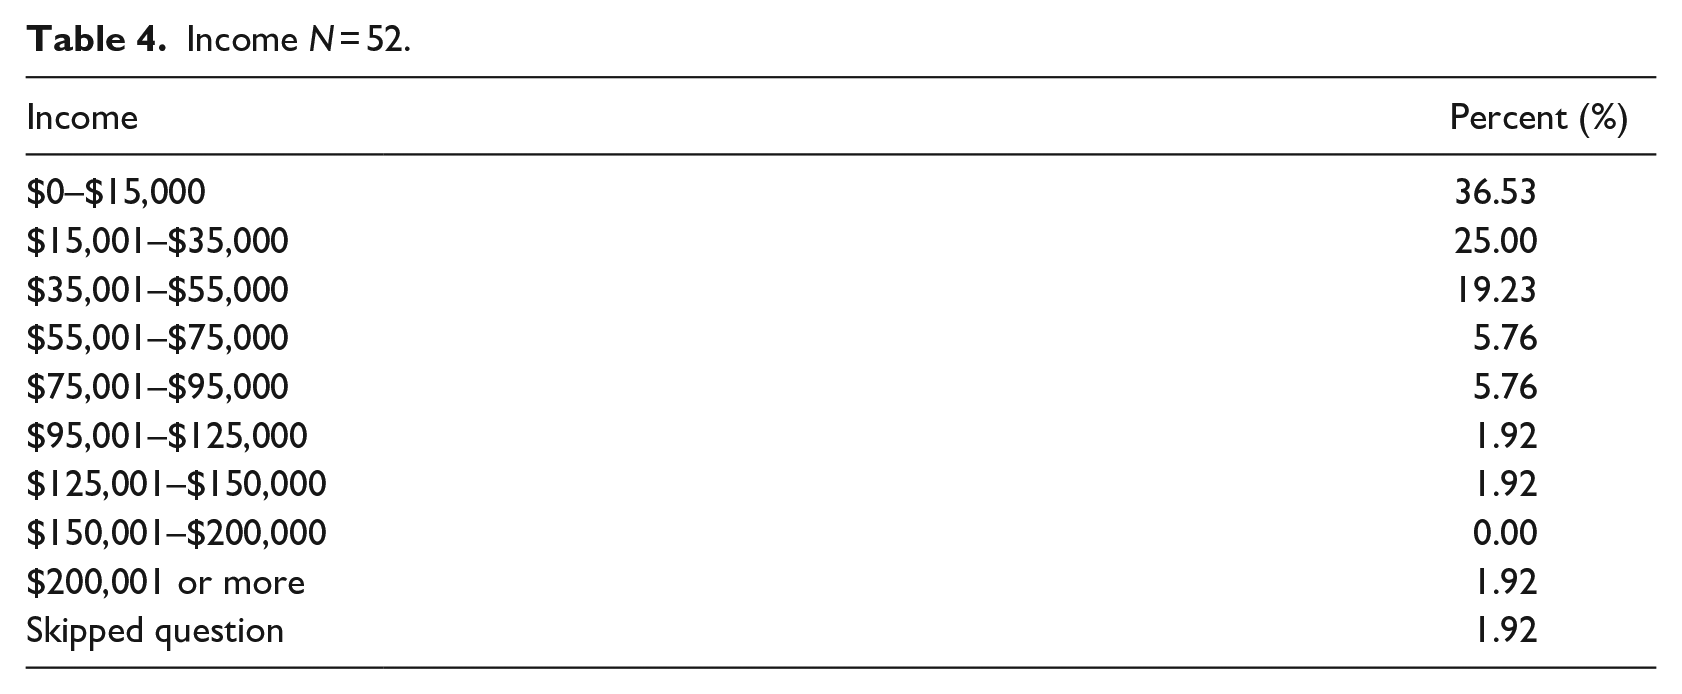
Lastly, the income variable (Table 4) for our sample shows that the majority of our respondents are well below the median income for the US ($78, 538.00) and for San Antonio ($62,917). With the majority of the respondents making less than $55,000 annual for their household income. This means over 80% of our sample is working class or impoverished. In Table 5 we show that the majority of the Latinx respondents make below $55,000 as does the majority of VIA ridership we surveyed.
Income N = 52.
Crosstabulation: percent race and income N = 52.
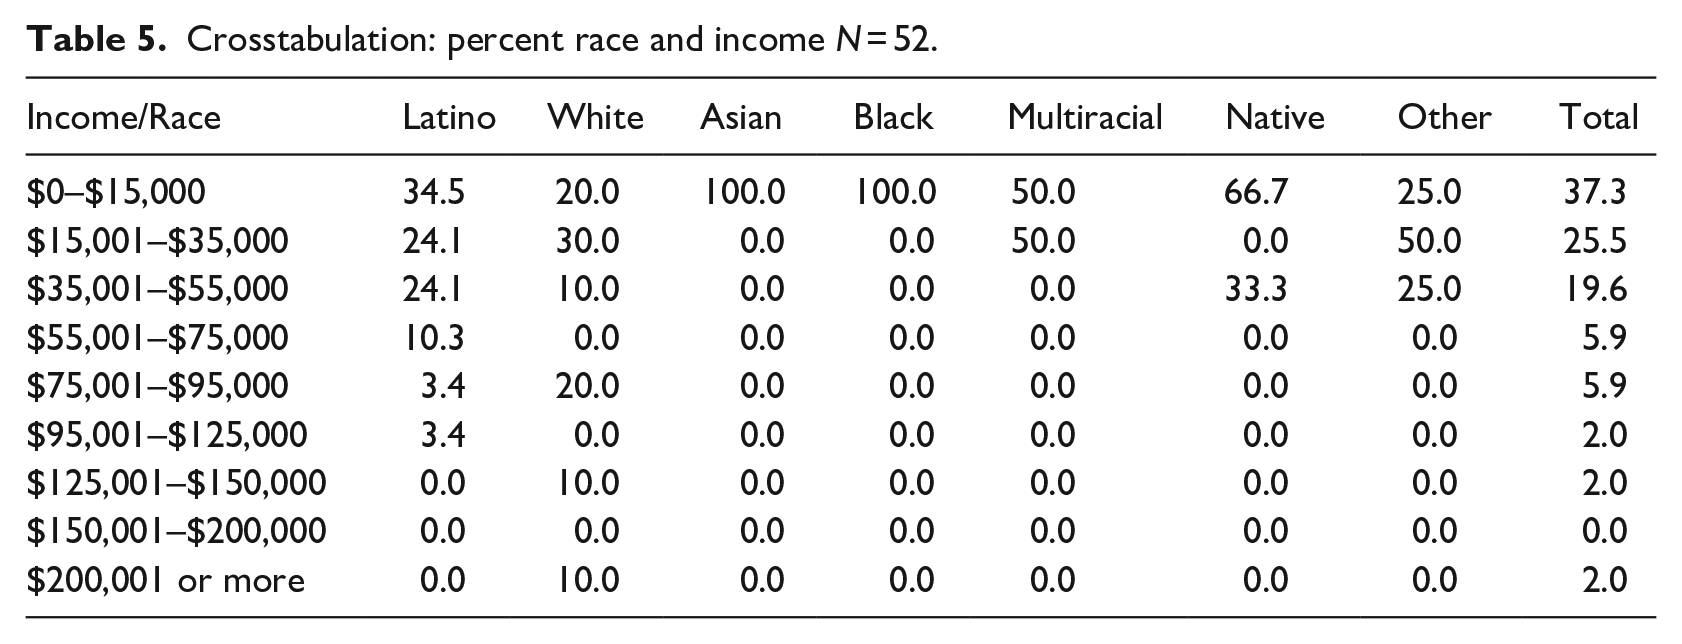
Some of the discrepancy relative to the census and other national measures should be attributed to the non-representative nature of the sample collection. However, there is a portion that should be understood to represent those that use the VIA bus system itself. As noted throughout this article, via reports that 64% of its ridership is impoverished and in need of their service to move through the city space.
The four respondents in the follow-up phone interviews were drawn from the survey sample. They are all Hispanic/Latinx, had income below $55,000, two were male and two were female, and were they were all between 18 and 65 (19, 26, 46, and 50). These interviews were electronically transcribed and coded with NVIVO data analysis software.
In the analysis using Census maps we use the PolicyMap (n.d.) data mapping web program. This program allows for the creation of census maps down to the block level and census tract level in some cases. In the analysis of these maps we discuss neighborhoods throughout the city that are predominantly Latinx or are Latinx clusters, these are city spaces where we see greater than 50% or more Latinx and a large portion of these clusters being greater than 70% Latinx. We consider these neighborhoods to be overwhelmingly Latinx and therefore illustrative of how access is impacting Latinxs in San Antonio. Moreover this is similar to our data collected which falls within this 50% Latinx or greater designation with almost 58% (Table 1) of our respondents being Hispanic/Latinx and all our interviewees identifying the same as well. Because the mapping data was taken from the www.policymap.com website it represents information supporting our own findings rather than data that was analyzed. Additionally two documents were collected from the city website (www.SA.gov) The San Antonio Status of Poverty Report 2019 and 2022 which function as data points. Lastly we collected data from the VIA Transit System website www.viainfo.net.
The data analysis consists of descriptive statistics for the survey with a focus on the variables of race/ethnicity, income, education, bus usage, and bus access. This collection of variables aided in the understanding of how bus users experienced the bus system and how they were able to use the buses. The data was collected with Qualtrics and Excel was used to organize the variables into descriptive data. Due to the low response and survey completion rate we limit our analysis of these surveys to descriptive statistics and supplement the findings in this article with the phone interview data, website data and other documents. Though there is a small number of respondents, the semi-structured interview data was coded focusing on thematic statements regarding bus usage and comments about bus access. Additionally, any statements made by respondents that focus on feeling unable to reach/access different areas of the city took focus. Examination of the VIA website and San Antonio Poverty Report (San Antonio Department of Human Services, 2019, 2022) consisted of content analysis centered on issues related to improving the lives of Latinx and impoverished communities and issues focused on general improvement of the VIA transit bus system. All data found to center on issues of race or class status were coded and organized as such.
Lastly, drawing on Desmond’s concept of relational ethnography, the ethnographic data consisted of 40 hours of observation and 27 pages of digital field notes at four bus stops and one transit center each representing the field rather than a specific bounded neighborhood or area (Desmond, 2014 also see Purifoye and Brooms, 2020). No photos or video of these locations were recorded. The bus stop becomes the point of relationality for bus riders or more specifically it becomes the ‘ethnographic object’ as it represents both space and the point of relations and connection for people (Desmond, 2014). These stops were located broadly on the southside, northside, eastside, and west sides of the city. The transit center was located on the northeast side of the city. Each of these stops was chosen as a convenience sample and was not randomly selected. The data was coded similarly to the interview data with a focus on usage and access issues as well as an overall focus on ease of mobility. For all the qualitative data analysis grounded theory’s axial coding process was used to identify themes that coincided with the themes from the survey data (Charmaz, 2014; Strauss and Corbin, 1990). Drawing out these themes enabled the creation of conceptual frameworks and argumentation consistent with research illustrating inequality in city spaces (Charmaz and Thornberg, 2021). All the data used in this article was collected and analyzed by the lead author and no feedback regarding the interpretation or collection methods was solicited from the bus ridership or any VIA transit employees.
San Antonio Status of Poverty Report: An Example of Class Status and Car Centric Ideology
According to the 2021 census estimates San Antonio’s population to be 1.4 million people (US Census, 2024). It has one of the largest proportionate Latinx populations in the United States (US Census, 2024). It also has a large portion of its population living at or below poverty, 17% (US Census, 2024). The city experiences significant race and class segregation despite the statistical diversity and some seemingly class integrated neighborhoods. In a report titled The Status of Poverty in San Antonio, $127 million of city funds was dedicated to transportation, with a $110 million focused on ‘street maintenance’ or other car-centered transportation improvements (San Antonio Department of Human Services, 2019: 25). It should be noted that there is a more recent 2022 poverty report, but it does not address issues of transportation and poverty directly. Focusing on the 2019 report we argue that city transportation spending focused primarily on ‘street maintenance’ rather than any other public transit infrastructure. This focus on ‘street maintenance’ further entrenches San Antonio as a car-based city with limited access to public transit. While $10 million was spent on bus transit, it represents a mere fraction of the possible funds San Antonio could be spending to improve equitable mobility and increased class and racial integration throughout the city (San Antonio Status of Poverty Report; San Antonio Department of Human Services, 2019: 25). Lower spending for public transit fundamentally amounts to decreased efforts to integrate the city.
At the conclusion of the 2019 Status of Poverty report there is no mention of improvement of San Antonio’s public transportation infrastructure beyond the 10 million dollars in spending. In fact, much of the report is focused on addressing issues of joblessness and financial stability for those who live in poverty. While these of course are extremely important aspects for addressing poverty, it is clear that little consideration for problems surrounding poverty are tied to improving public transportation. In fact, the report explicitly notes as a key problem, that ‘close to 17% of African American households in San Antonio lack access to a car, compared to only 6% of White households’ (San Antonio Status of Poverty Report; San Antonio Department of Human Services, 2019). The city’s solution to providing better transportation for those who are most in need, in this case African American households, is focused on improving their access to cars. Because this car centric ideology pervades not only the infrastructure but also the solutions to inequality implemented by the city, we see that public transit systems take a back seat to car centered solutions to poverty. While it can be argued that improved streets also benefit bus infrastructure in poorer communities, this is only the case if the bus infrastructure is a site of equity in mobility. As Purifoye (2017) has noted this is not always the case, and as we will show in the sections that follow, this is not the case for bus access in San Antonio.
Such decreased spending on public transit infrastructure can impact Latinx communities, poor communities, and working-class communities. The bulk of our survey respondents are Latinxs and come from households that are earning at most 125% the US poverty rate for a family of four. With 63.75% of our respondents using public transit five times or more per week and 73.91% using public transit (bus) as their primary mode of transportation there is little option for them to switch to using a car if the bus system does not provide appropriate access or reach to a particular area of town. According to VIA transit’s website (viainfo.net) they claim 98% coverage of Bexar County which encompasses the city of San Antonio and some surrounding areas. While their methodologies for measuring this coverage are unclear the gaps and difficulty in accessing these spaces becomes clear as we look at our respondent’s experiences.
With 79.99% of the respondents, having a commute that takes longer than 45 minutes and nearly a quarter of the respondents walking 15 minutes to the bus stop nearest to their homes, trips around the city using the bus system can take twice or in some instances three times as long as a car trip. This illustrates how many of our respondents, who are largely dependent upon bus service for their transportation, will have significantly decreased mobility in general throughout the city when compared with those who are able to afford to purchase and own a car.
Issues of poverty in San Antonio, as discussed by the city’s 2019 Poverty Report, neglect the role that public transit plays in the lives of the poor and working classes. Understanding that many of those that ride the bus are impoverished, according to VIA this constitutes more than 60% of its ridership, initiatives centered on improving poverty in the city should include a greater focus on public transit infrastructure (viainfo.net). Instead, there is a centering of how those who are poor should be given greater access to cars, should have street improvement initiatives in their neighborhoods, and should receive minimal funding for a public transit system that would significantly improve their mobility throughout the city.
Advanced Rapid Transit (ART): An Example of Race and Car Centric Ideology
Despite a largely car centric focus and minimal spending on public transit in San Antonio there are active attempts to improve the VIA bus system. One of these improvements is the federally and city funded Advanced Rapid Transit line. This ‘green line’ will run from the southside of the city to the northside of the city (11.7 miles total) with 28 stops throughout and is slated for completion in 2027. According to the Federal Transit Administration’s report the green line has the following purpose,
The project connects several key destinations along the corridor including San Antonio International Airport, North Star Mall, Park North Shopping Center, San Pedro Springs Park, San Antonio College, VIA Metro Center, Baptist Medical Center, Downtown San Antonio, Roosevelt Park, Missions National Historic Park, and numerous high density commercial and residential areas. The project is intended to provide highly reliable, frequent, direct transit service with enhanced amenities, linking neighborhoods to key regional activity centers. It also is expected to reduce congestion, improve air quality, and support the region’s land use vision and growth plans (Federal Transit Administration, 2023: 1).
There is a second line proposed, the sliver line, that will run from east to west to complement the north to south green line. The VIA website does not give a date for completion of the silver line. These buses will have dedicated signals and lanes to give them priority over car traffic and speed up movement through the city. To be clear there are existing bus lines that cover these locations, but this would function much like a dedicated train or light rail line with a single route with priority over other traffic. According to the VIA transit website, ‘An effective ART system is an important component to improving frequency and reliability, offering passenger comfort and more equitable access to affordable public transportation options’ (viainfo.net). Crucial is the statement regarding ‘equitable access’, as we show that this current proposal does not provide equity to one of the most common users of the VIA transit system, poor and working class Latinxs. Reflecting what Graham and Marvin (2001), refer to as the ‘sociotechnical geometries of power’ that move people through or contain people in space (p. 11). They argue that these processes often occur through many forms even through ‘repression’ which Latinxs in San Antonio experience these forms of repression through the inaccessibility of specific resource-connected communities and enclaves.
Based on the map provided by VIA transit (see Map 1 below), this green line will run primarily through the downtown, ‘The Advanced Rapid Transit North/South Corridor Project connects the San Antonio International Airport area, along San Pedro Avenue, through Downtown, and south to the Missions area’ (viainfo.net). This connects the downtown space to the airport yet does little to reach a predominantly working class and poor Latinx population living on the South and West sides of San Antonio and while not creating a barrier directly, they do not serve to enable mobility to those who need it most. In what follows we address several Maps 1–4 to examine how ART, like the existing bus infrastructure, is limited. Map 1, taken from VIA’s website, illustrates the reach of the transit line, Map 2, taken from google maps, illustrates the approximate same distance covered relative to the majority of the city space, Map 3, taken from policymap.com, shows the ART bus coverage relative to the poor and working class Latinx clusters in the city and Map 4, also from policymap.com, shows the line relative to the majority of the city space and poor and working class Latinx clusters.
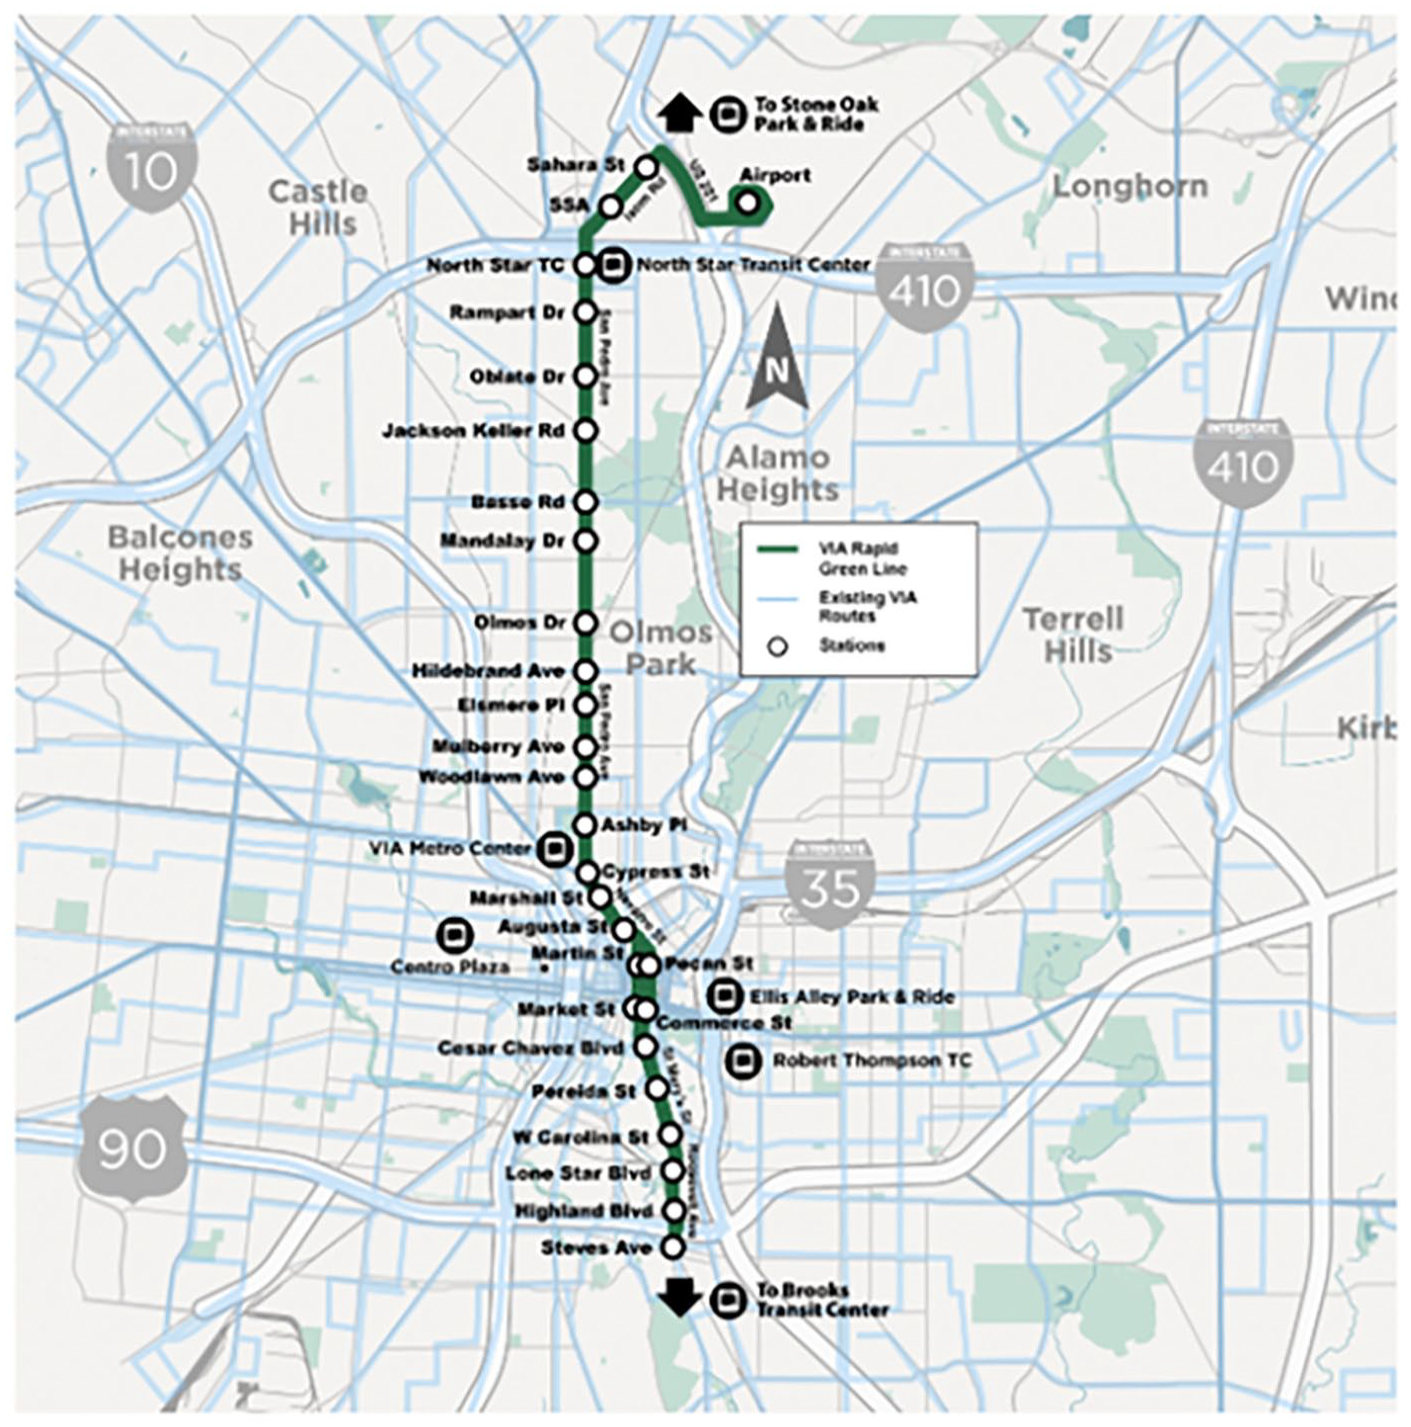
Via advanced rapid transit green line.
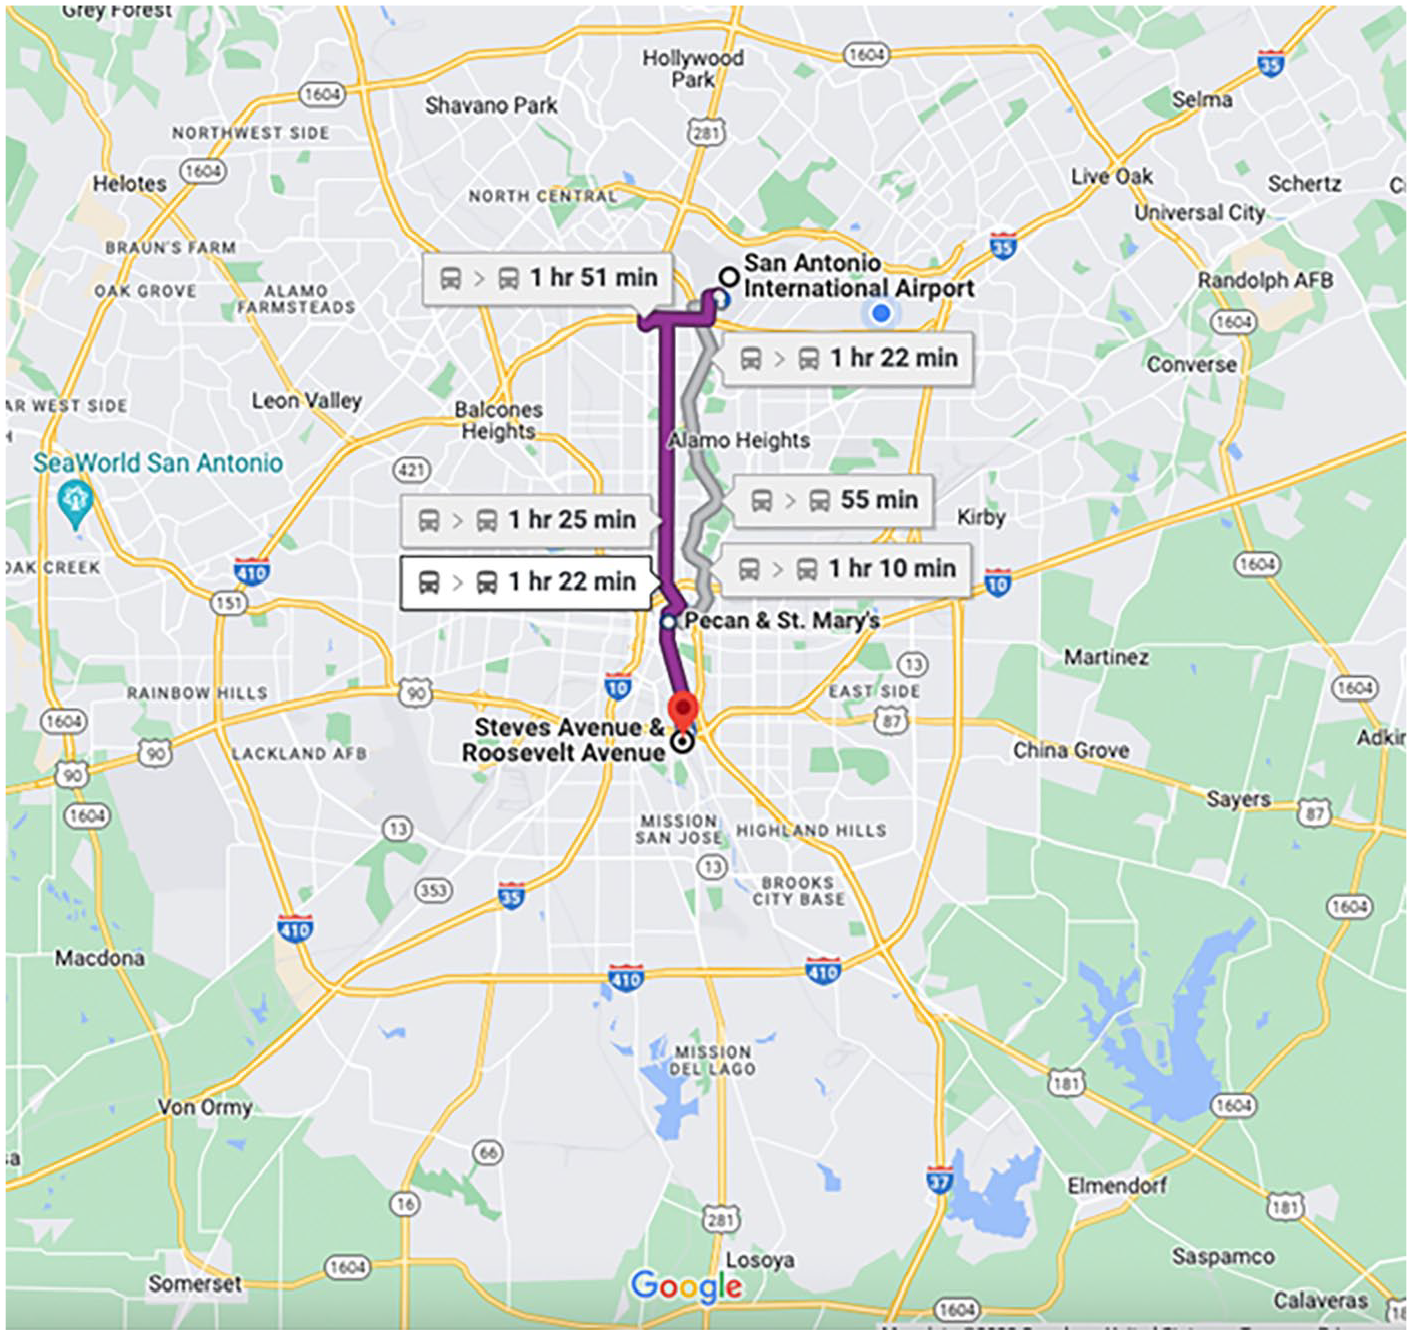
Google Map using current available bus lines.
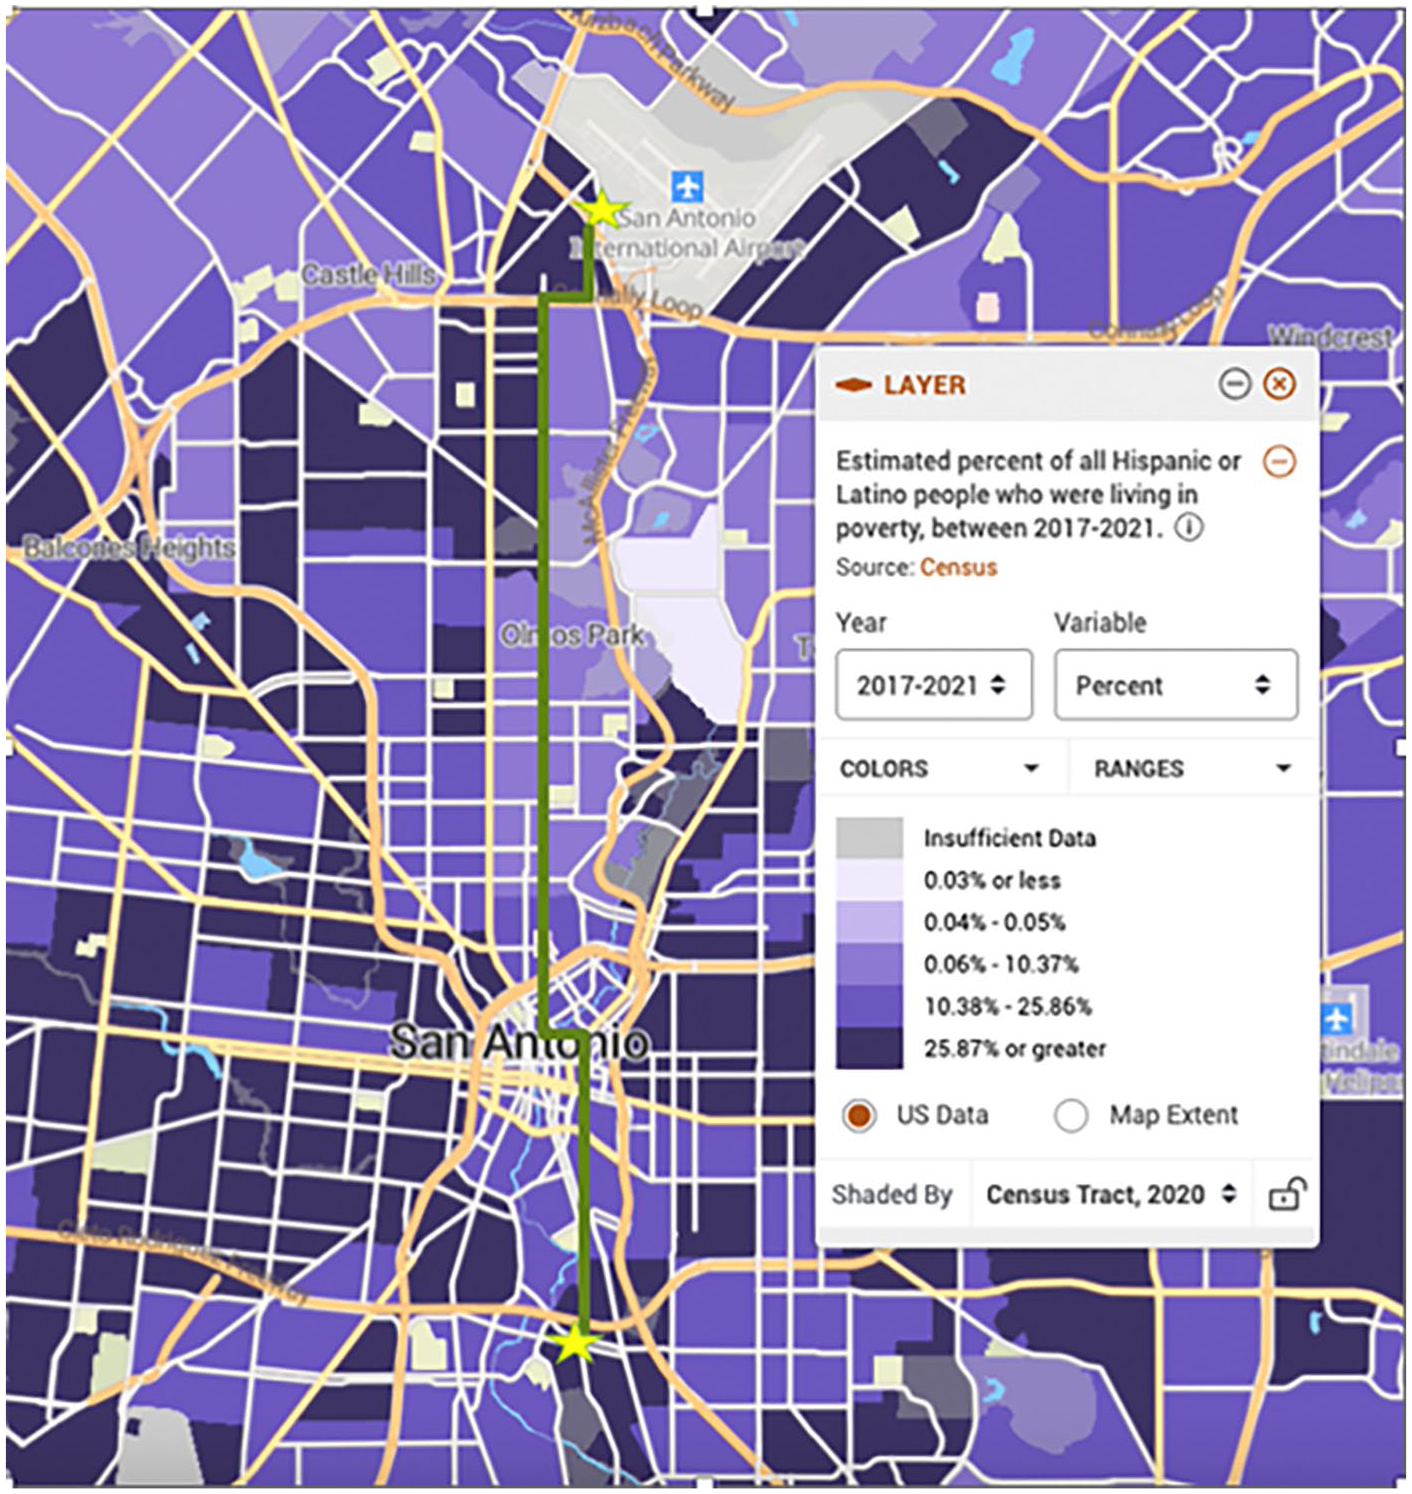
Percent Latinx in poverty with ART green line.
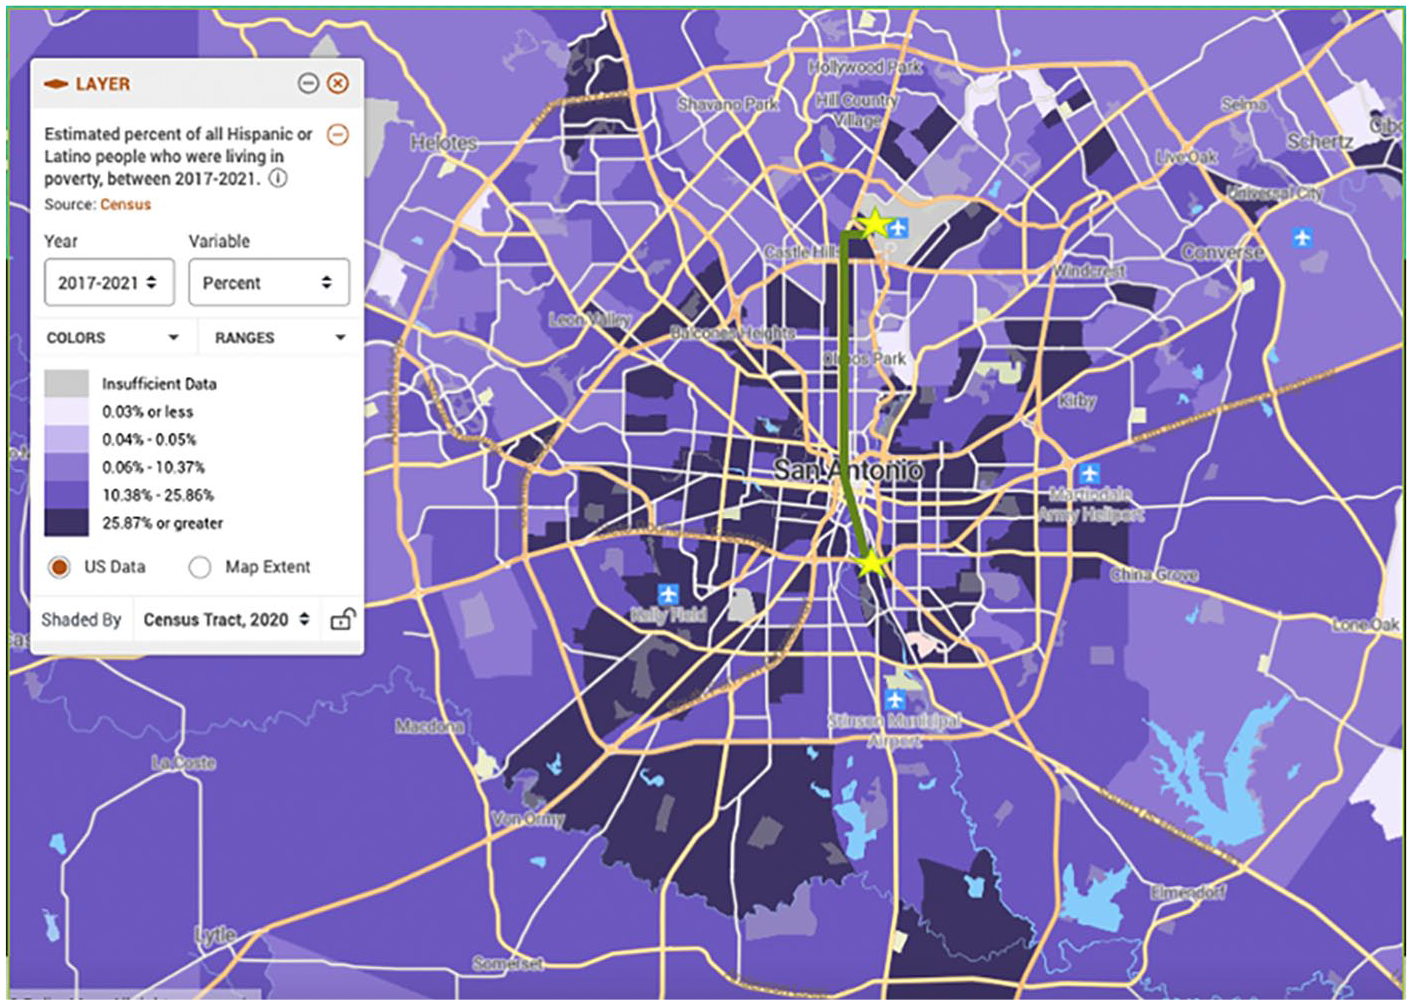
Percent Latinx in poverty with ART green line (full city).
In Map 1 we see the proposed green line stretching across the city seemingly covering a large area of the city space. Yet, if we compare Maps 1 with 2 we see that the city space covered is a small fraction of the actual city, only 11.7 miles. Map 2 shows that the majority of the city’s boundaries outlined by Anderson loop or ‘Loop 1604’, a distance across of approximately 27 miles. This means that the proportion of the city residents served by the green line shown in Map 1 is a very limited portion of those who would need this rapid transit service and would cover less than half the distance across the city itself. This is because the green line does not stretch across the entire city space it, specifically, does not reach from one end of the city’s inner core (currently bounded/defined by Anderson Loop). While it can be argued that the southern part of the city near Anderson Loop has less population density, it does, as Map 4 shows have a larger proportion of poor Latinxs living near it.
The density of poor Latinxs in Maps 3 and 4, show that there is a significant concentration of these individuals living in the south, southwest and west sides of the city represented by the darkest shade on the legend and specifically representing greater than 25.87% Latinxs living in poverty. The green line bypasses the highest percent in poverty census tracks overall but does touch those with much smaller proportions living in poverty (0.06%–10.37%) on its route up the San Pedro Avenue corridor (see Maps 3 and 4). With such a high proportion of the city’s population living in poverty and many of those individuals representing the Latinx community the green line does not directly engage with these communities.
As noted by VIA, the green line will serve ‘54,000’ residents in the city, a small fraction of the 1.4 million residents residing in San Antonio. It should be noted that the green line does touch six census tracks (see Map 3) that contain more than 30% Latinxs in poverty but it will largely ignore a significantly greater proportion of the impoverished Latinx community living in the South and West sides of the city. These parts of the city are longstanding Latinx Barrios, known to have high rates of poverty and high concentrations of Latinxs living in them, with many exceeding 90% Latinx (policymap.com). As mentioned previously, these are the individuals that we found to be most prevalent users of VIA transit in our study. Moreover, the San Pedro Ave. corridor on which the ART will be running is a wide seven lane road, that lends itself to easy conversion to one with dedicated bus lanes. Whereas, attempting to weave these dedicated lanes through the south, southwest, and west sides of the city would likely take considerably more effort and funding. This means that the prioritization of need for poor Latinx communities takes a back seat to mechanisms of inequality focused on ease of implementation and car culture rather than facilitating equity (see Van Wee and Geurs, 2011).
The green line corridor also centers those who already have access to transportation through car ownership, especially in its north termination point at the Airport and creation of a park and ride stop in the wealthy neighborhood of Stone Oak. Both termination points would reward and/or require cars to access them with ease. Of course, the airport would provide transit for those flying into the city and would privilege those riders as there is not a significant amount of housing density around the airport. This is consistent with research that finds that public transit is often used as means to ‘enhance global capital’ and give the affluent and tourists access and rights to the city (Farmer, 2011 also see Graham and Marvin, 2001). Though, VIA transit represents a public/private entity, the ART project is funded by Federal Transit Administration Capital Investment Grant Funds and a loan from this same agency to be paid back through San Antonio’s Advanced Transportation District tax revenue (viainfo.net). Despite this public funding, the ART project is largely one that is not addressing the needs of the city as a whole, but rather has a largely middleclass and business focus.
These maps suggest that those living and commuting in predominantly Latinxs neighborhoods and who have households with annual incomes less than $35,000 per year are more likely to experience a continued reduction in their mobility due to public infrastructures that do not take into consideration their needs and ultimately restrict their access to public transit. Moreover, because of this differential in mobility throughout the city, race and class segregation are reinforced and maintained. These infrastructures of inequality, such as the creation of transit lines that do not directly address issues of poverty and racial segregation, ultimately create enclaves of inaccessibility for poor, working class, and Latinx communities, reserving full access to the city space for predominantly white and/or upper middleclass people who represent a minority of San Antonio’s overall population.
Transit Access and Enclaves of Inaccessibility
Identifying Enclaves of Inaccessibility
Building off our findings of the proposed ART green line, we argue that existing public transit routes, despite VIA’s claimed 98% coverage, do not facilitate equity in access to city space. In particular, we focus on how certain city spaces are less accessible than other spaces and to be clear, we recognize that technically riders of VIA transit can walk to access spaces once they are dropped off at a bus stop. We are looking at the likelihood that bus riders would be able to walk to many spaces throughout the city with ease after they arrive at a nearby bus stop. More importantly, however, we are focused on the accessibility of predominantly white and predominantly upper-middleclass enclaves of exclusion. Of course, these enclaves do not have exclusive rights over all the resources in the city, and often do not have some of the more crucial resources located in them, such as the larger hospitals, multifamily housing, or varied food access. But these are spaces that typically have more desirable, greater quality, and/or greater value services relative to other spaces throughout the city again reflecting Graham and Marvin’s ‘premium networked spaces’.
Much of this difference in quality of life of these enclaves is due to class and racial inequality that dominates the city of San Antonio as a whole. The enclaves of exclusion are unique as many of them are separate independent cities with their own taxes, municipal services and even school districts. These cities often benefit from higher home values, higher taxes, and higher incomes of the residents living in them. As noted earlier in the article, they resemble gated communities in that the residents pay into the maintenance of the space except instead of a homeowner’s association, they pay through their tax dollars. These enclaves continue to benefit from San Antonio Municipal services such as the public transit system and have bus stops and direct access to the bus lines. A key aspect of the public transit service provided in these enclaves is that there are fewer or less lines of access provided by VIA transit service in general, thus reducing public transit users’ ability to move throughout these spaces. There are 10 of these cities within the San Antonio (within the 1604 Loop): Alamo Heights (1), Terrell Hills (2), Olmos Park (3), Leon Valley (4), Hollywood Park (5), Shavano Park (6), Windcrest (7), Castle Hills (8), Balcones Heights (9), and Kirby (10) (see numeric indicators on Map 5). All these cities within San Antonio contain predominantly white populations except Balcones Heights which is predominantly Latinx though they represent less than 50% of the predominant race and all of these cities are located on the north side of San Antonio (policymap.com).
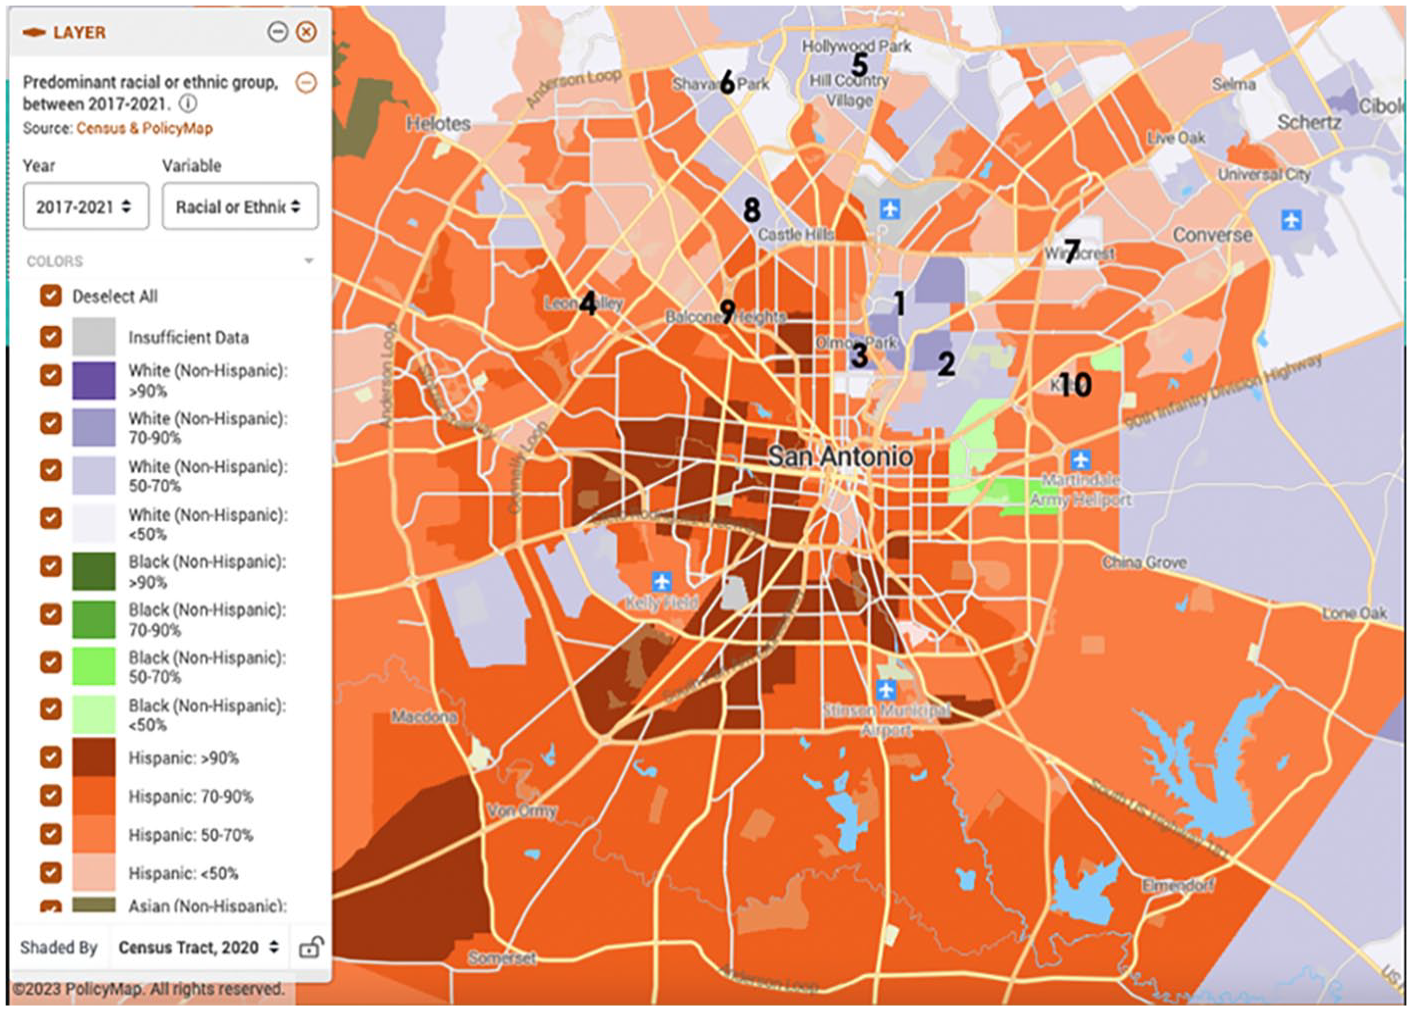
San Antonio predominant race/ethnicity.
Looking back at Map 4, we see that there is a concentration of densely packed Latinx impoverished areas in the central, south and west portions of the city. With many neighborhoods in these areas holding the darkest shading illustrating greater than 25.87% poverty among the Latinx population in these areas. Map 5 shows that many of these same areas are the most densely populated by Latinxs at greater than 90%. However, we also see portions of the city where there are neighborhoods that are densely populated by Whites, two of which we will be focusing on for this article, Alamo Heights and Terrell Hills. We chose these two as they have among the largest populations of the 10 cities and would represent the most likely cases of race and class diversity. Additionally, these two are among those closest to the city center making them more likely to have greater or increased bus access relative to the other cities that are further outside the city center.
In Map 5 we see that these cities have the lightest shading meaning they are overwhelmingly represented by neighborhoods that are white at 50%–70% according to policymap.com. These neighborhoods are also represented by less poverty than the predominantly Latinx neighborhoods with Alamo Heights having 3.9% poverty and Terrell Hills having 8.1% poverty both of which are significantly lower than San Antonio’s poverty rate of 17.6% (US Census, 2024). Also, according to 2021 census data, Alamo Heights and Terrell Hills white non-Hispanic population both hovered around 70% whereas San Antonio’s white non-Hispanic population was just under 24%. The race and class segregation these cities contain illustrate that they are clearly enclaves for those who are predominantly upper middleclass and white given the context of the surrounding city. This becomes abundantly clear as we look closer at Map 6 to see that surrounding the cities of both Terrell Hills and Alamo Heights there are neighborhoods that are densely populated by predominantly Blacks and Latinxs but are not included in boundaries of either city.
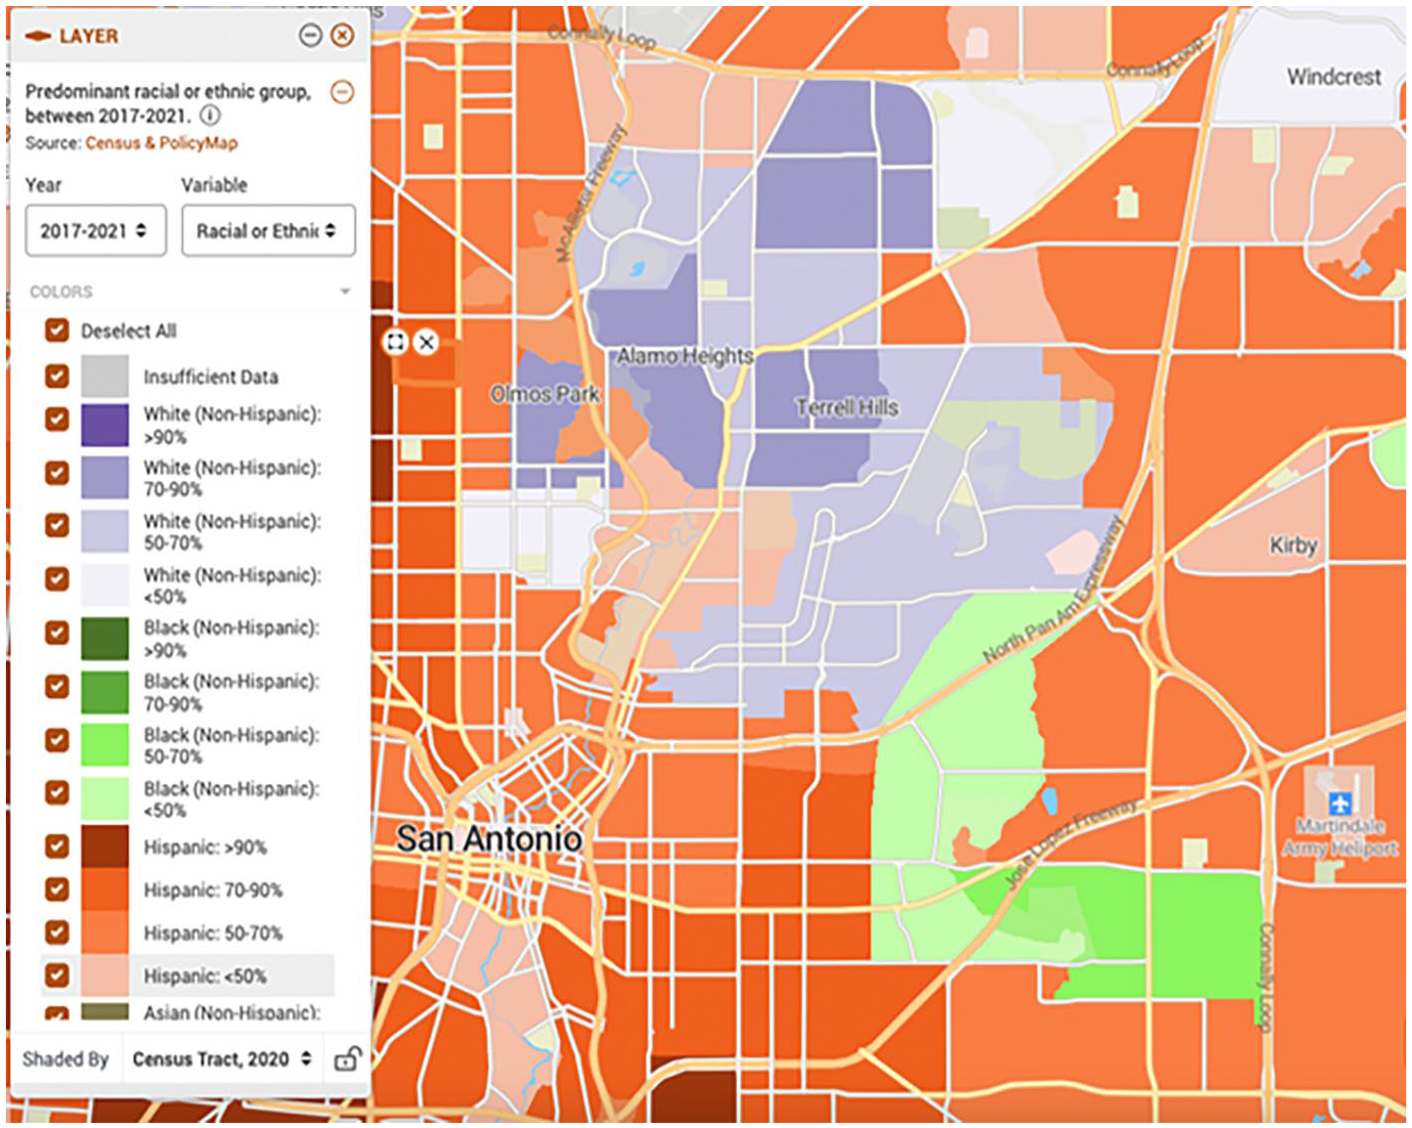
San Antonio predominant race: identifying enclaves of inaccessibility.
These maps provide a clear illustration of the degree to which these communities are racially segregated. They represent white middleclass enclaves where Black, Latinx, poor and working-class people have been excluded. The manifestations of racism and classism in these spaces are such that they have been successful in excluding communities of color and those who are poor. One of the easiest means to accomplish this is through controlling how people enter and leave the city space. Having less bus access or limited bus access will reduce the proportion of community members who rely on the bus living in these neighborhoods and make them less likely to consider moving into housing within these communities, especially if there are options that have better access to public transit.
Rider Experiences with Race and Class Stigma and Bus Access
Though we do not have direct data on respondent experiences using the buses in these two enclaves, we did ask respondents how they felt about bus service on each side of town (north, south, east and west) and overwhelmingly many of the respondents felt as though there was a degree to which the bus service was ‘better’ on the North side where these two enclaves are located. Our data shows that 67.7% of our respondents felt the bus users on the north side received better service. While only 26.19% of respondent commute to the North side, they overwhelmingly felt that it was the only side of town that received better service and unequivocally felt neither the east (84.62%), west (83.33%), or south (88.00%) sides of town received better service. Ostensibly this seems to reflect that the north side, Alamo Heights, and Terrell Hills included, would receive better bus services but it more likely reflects the respondent’s understandings of race and class inequality. Meaning they feel that the north side of town receives better treatment based on their class and race privilege, not that the transit service is in reality better. This is because 73.81% of our respondents commuted regularly to either the south, west or east sides with almost 56% living on these three sides of town. This means that our respondents represent those who were the most likely to feel excluded and unable to access these sides of the city. This is clarified by one of our interviewees, Leonard age 50, who when asked ‘what he felt the biggest problem with the bus system in San Antonio is?’ he stated,
I live on the South Side, out by 1604 and it seems to me that there is more bus service further out going north than there is going further south. This is somewhat due to population density; however, I still feel if it was out here [on the south side] people will use it . . . some of this is due to the mindset that people believe bus riders have which is that bus riders are broke, they can’t afford this or that, but instead it should be were gonna help by having more convenient routes or more frequent buses on those routes, more express services . . . (8/31/22).
Like the survey respondents, Leonard also believes there is better service specifically ‘greater reach’ in the bus services on the north side of the city. Yet later his statements reveal that he feels that the southside is largely neglected and subject to stereotypes about their class status and their ability to pay for the city public transit system. He too feels riders such as himself are excluded from accessing city space with ease, that they should receive ‘help by having more convenient routes’ for example. In another interview with a respondent named Richard, age 46, notes that there is a stigma associated with Hispanics using the bus system that he feels needs to be overcome,
[People in San Antonio] look down on anybody riding the bus but in particular they look down on Hispanics. Instead of thinking yeah he’s taking the bus he’s doing his thing, he’s going to work, they think no he’s taking the bus there must be something wrong with him (7/15/22).
For Richard there is a stigma attached to bus use and that Latinxs (Hispanics) are especially subject to this stigma around bus use. He feels that because a person is Latinx and using the bus they are stereotyped as being deficient. Bus usage comes to be racially coded with stereotypes of Latinxs as poor or generally problematic. This is crucial as it shapes how the majority of people who use the bus are seen in San Antonio and ultimately how the cities, such as Alamo Heights and Terrell Hills, will interpret bus users. Understanding bus users as having race and class stigmas might add further layers to how these enclaves of exclusion interpret those coming into their community from the rest of the city. These stereotypes seemingly extend to the system itself as we see that in these communities there are fewer bus lines and significantly decreased routes moving through them. These decreased routes make commuting into these city spaces difficult and illustrate how these cities represent enclaves of inaccessibility.
Looking at the experiences of commuting from predominantly Latinx neighborhoods of the South and West sides of San Antonio into Alamo Heights first, we find that the length of the commute is consistently over an hour on any given Monday through Friday. Respondent’s living in these neighborhoods would have to change buses a minimum of one time for all commutes into these city spaces. For example, using google maps, we see that from St. Mary’s University located in the heart of the San Antonio’s West side Barrio, it consistently takes riders well over an hour for travel, with the shortest times being only slightly over an hour in the evenings. If we were to take the bus from Texas A&M University- San Antonio on the southern edge of the Southside Latinx Barrio, we see similar result with many of the times well over an hour and requiring ‘mixed modes of transportation’ meaning riders would need to take a car to a close bus stop. Recall that Alamo Heights and Terrell Hills are the most centrally located of all the enclaves and if respondents took these buses to the more distant Hollywood Park, Kirby, or Leon Valley they would encounter bus rides of over 2 hours with two or more bus transfers. Accessing these enclaves may even require bus users to have access to a car or to use a car share app/taxi service to simply get to the first stop in the bus service.
Another interviewee, Leticia age 26, notes that she rides the bus 7 days a week for her job, has multiple connections just to get to work, travels for at least 2 hours one-way, and often her buses are delayed. When asked about these delays she explains how it impacts her life, she states,
. . . there’s 6 total transfers daily [round trip], so it’s just delays it [her commute time]. You know, you’re held up another hour to get home because of that incident with the first bus. And so it throws your schedule off, you know? Then later in the day the buses run less frequently. So you’re concerned about ‘well when am I getting home?’ because after 5 o’clock the buses don’t run as often as earlier in the day. So my concern is always being finished up before 5 p.m . . . Because you know it’s gonna be another 2 hours before you get home after that (08/23/22).
For riders such as Leticia, their commutes are long and wrought with consistent delays and multiple transfers, making their ability to move through the city difficult when compared with people who own or have access to cars. Long commutes and difficulty accessing consistent on time transportation represents significant violence for communities of color and poorer communities generally and specifically poor and Latinx communities in San Antonio (Attoh, 2019; Bullard, 2004). Additionally, these communities are paying a greater cost overall for their use of these transit systems, not only economically but also as Leticia notes in terms of their time. This cost in time illustrates how transit systems are structured such that they benefit those who can afford to use them whether that be economically or in terms of time; people with more flexibility and time can afford to use San Antonio’s public transit systems (Sanchez, 2018). All these interviewee’s experiences with race and class stigma, limited routes and inconsistent bus service should be understood as violence against these communities and represents the infrastructures that obstruct equitable mobility throughout San Antonio.
Routes of Inequality
Drawing on our participant observation data and on Map 7 provided by viainfo.net, we can turn our attention to the bus lines themselves in Alamo Heights and Terrell Hills. In Alamo Heights we directly observed all three available bus lines and in Terrell Hills we directly observed both available bus lines. In Alamo Heights, lines 9, 14, and 505, bisect the city but there are technically only two bus lines as 9 and 14 are the same line through most of the city but diverge just before leaving the city limits. Similarly, the three lines that follow the edge of Terrell Hills, lines 509, 647, and 8 are the same line on the edge of the city but diverge upon leaving the boundary. It is vital to note that out of all the 10 enclaves of exclusion, few had bus access that allowed riders into the central and most populated areas of the city spaces. Instead, many of the buses skirted these cities’ edges following wide heavily travelled thoroughfares designed around car traffic and car-centric travel. Olmos Park and Hollywood Park had zero bus access into their city space and only allowed bus riders to walk into the city spaces from a busy thoroughfare or in the case of Hollywood Park from an extremely busy and dangerous highway access road.
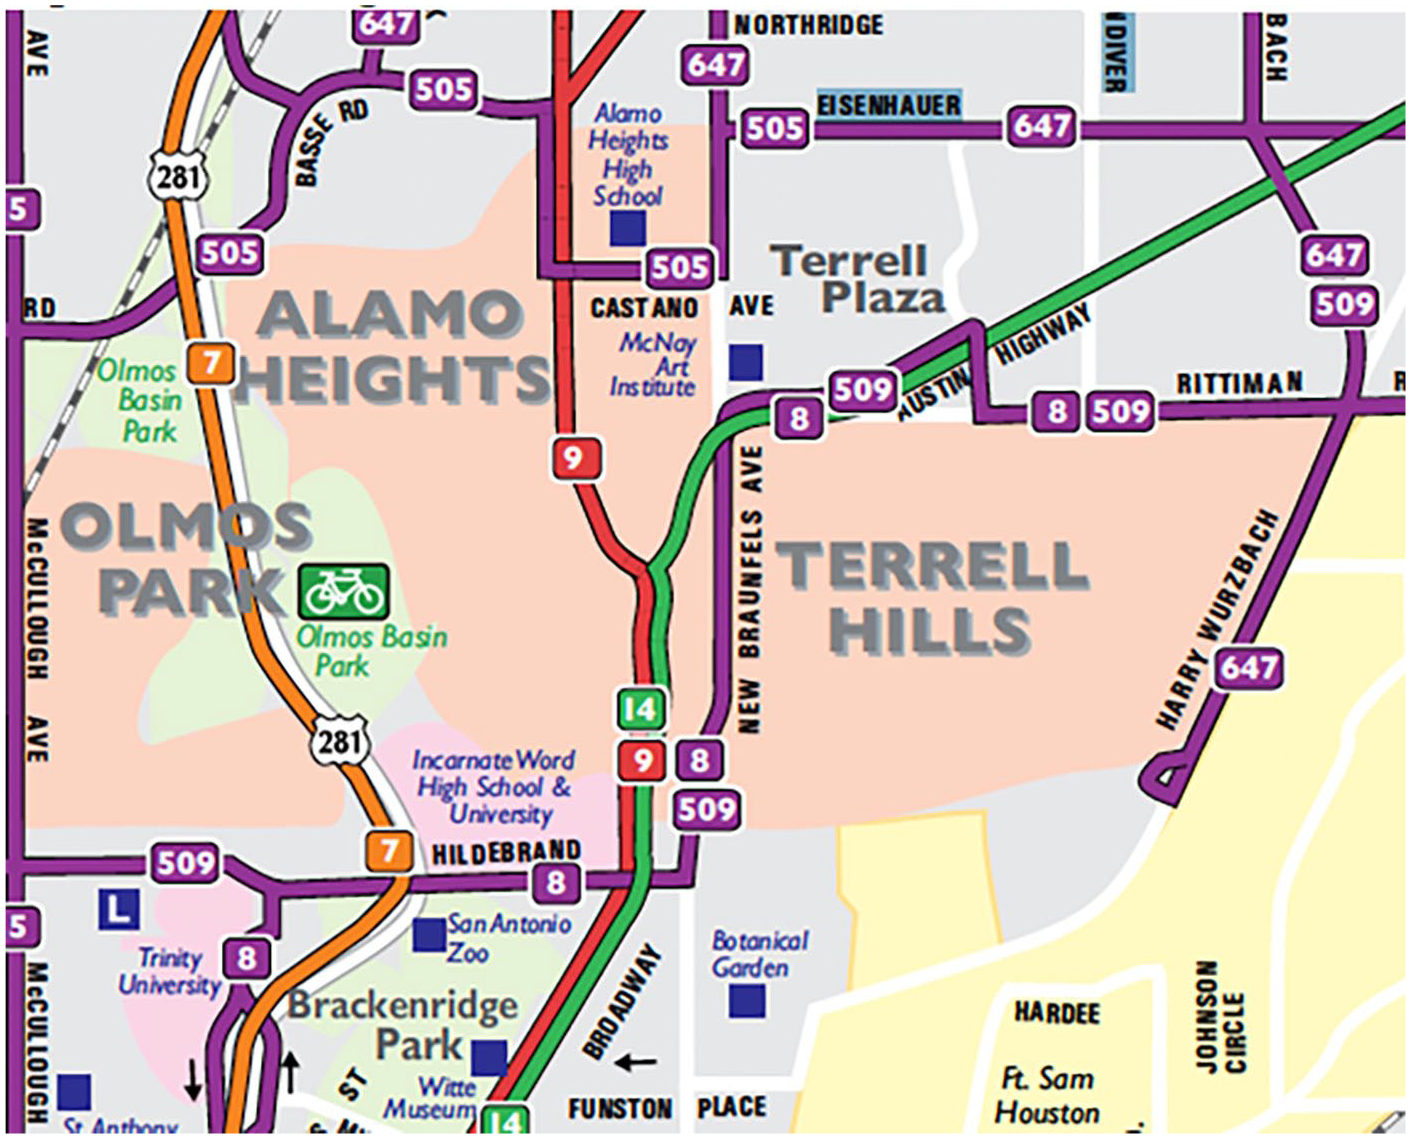
VIA bus map Alamo Heights and Terrell Hills.
Looking at Map 7 we see that the lines serving these two cities (shaded space represents the city boundaries) do not provide significant access to the entire city space. While Alamo Heights does have bus access running north/south it has very little access throughout the city and provides no access if one wanted to enter one of the neighborhoods on the western side of the city. Additionally, there is no bus service that would allow bus riders to travel across the city east/west. While it may seem that the number 7 line on the western edge of the city might provide some access it is bounded by a very busy and elevated highway (HWY 281) on which the bus line 7 travels. This means that while technically one could cross the highway, there are areas that have limited or difficult mobility to travel under by walking. It should be noted that this western portion of Alamo Heights is where the bulk of the residential infrastructure is located and with this limited transit access it ultimately discourages bus users from accessing these neighborhoods. This represents what has been termed an ‘arsenal of exclusion’ by urban planners and architects wherein neighborhoods, cities and buildings are purpose built to exclude certain types of engagement from the public (Armborst et al., 2021; Schindler, 2015). Most notably, is the creation of the cul-de-sac in neighborhoods, wherein if a person goes down that particular road and has to turn around it signals their non-belonging. Attempts at using public transit to access residential space in Alamo Heights signals non-belonging, as the space’s residents are required to own a car based on its infrastructure.
Similarly, Terrell Hills completely excludes any ability for bus riders to take the bus into the city space. With the bus line 509/8 and 647 wrapping themselves on three sides of the four-sided city space (see Map 7). Also, like Alamo Heights much of the space that is excluded from bus access is residential, denying bus users direct access to neighborhood spaces. Once again these cities represent enclaves of exclusion where there is a denial of a predominantly poor and Latinx bus ridership access to the space. What is more, is that using the buses in these cities illustrates a enclave of inaccessibility as riders have few stops in these cities further cementing their non-belonging relative to the citizenry of these cities. Construction of this non-belonging is crucial to maintaining class and race segregation as car ownership and use is a sign of appropriate belonging and by proxy class and racial status. According to the Census, this is supported by the car ownership data where Terrell Hills and Alamo Heights are among those with the highest car ownership per household in the county of 2.8 and 2.0 cars per household (policymap.com).
Experiencing these enclaves of inaccessibility illustrates the importance of a bus system that is comprehensive but also requires a public that interprets bus transit as an important factor in city and community development. The construction or addition of bus access through what are currently enclaves of inaccessibility would increase riders’ ability to engage with the city space and increase the degree to which the predominantly white upper-class spaces have ‘exposure’ to poor working class Latinxs (Massey and Denton, 1988). The importance of mobility in the facilitation of integration throughout cities is clear, as it enables individuals who may live in separate or distant neighborhoods to be neighbors without physically living near each other. These limited bus lines maintain these physical distances and create social distance when individuals attempt to enter these enclaves by rendering bus users as non-belonging. These factors ultimately keep communities distinct and maintain separation rather than integration.
Lastly, while it may seem as though we are problematizing both a lack of routes and the creation of routes (see above discussion of ART), an approach that may seem antithetical to our transportation justice focus, these critiques work hand in hand. Primarily because new routes do not equate to improvement if they do not fundamentally help those in need and old routes could benefit from the resources dumped into new routes such as those used in the aforementioned multimillion dollar ART. The argument is that the bus transit system is a site where we see the reproduction of inequality, where the problem lies not with simply creating more lines but rather purposefully building new or building out existing lines for the communities that need them the most.
Conclusion
Standing as the seventh largest city in the United States, San Antonio should have a public transit system rivaling cities of similar population size. While some argue that the lack of this infrastructure regarding cities in the Southwest is largely due to their newness relative to East coast or even Midwest cities, the fact remains that it does not have such a public transit system. Even compared with the other large cities in Texas such as Austin, Houston, or Dallas, San Antonio lags behind as each has its own light rail system to complement the growing bus systems already in place (Barker, 2019). The reality of why San Antonio is behind is not fully clear but as this article shows there is a clear issue regarding the ability for the city to continue to support its most vulnerable citizens.
As we illustrate this vulnerability, we add to the aforementioned transportation justice literature by showing how race and class inequalities are reproduced in a city that is majority-minority. Our focus is on the creation of ‘elite spaces’ and ‘elite mobilities’ where wealthy white elites continue to hoard resources and limit mobility and access for some of the residents in the city space, an approach that is consistent with the transportation justice arguments (Kahn, 2014; Sheller, 2014). Our creation of the concepts of enclaves of inaccessibility and enclaves of exclusion highlight the multi-faceted aspects of race and class asymmetries within city spaces while accounting for the role of transportation in San Antonio’s social topography. Using Sheller’s ‘scales of justice’ (bodily, street, extended urban, national, and planetary scales) we provide insight into San Antonio’s limited equitable mobility at three levels: the ‘bodily’ (race and class discrimination in access to city space), the ‘street’ (public transit failings and lack of supports for poor, working class and Latinx communities, e.g., enclaves of inaccessibility), and the ‘extended urban scale’ (creation of enclaves of exclusion such as the cities within San Antonio) (Sheller, 2018a, 2018b). All this underscores Sheller’s mobility justice that calls for greater attention paid to these issues facing mobility of citizens and people in city spaces (Sheller, 2018a).
This project further builds on the concepts from transportation justice by showing how neighborhoods and transit systems are functioning together to maintain these forms of segregation and exclusion within city spaces. Through the repurposing of traditional urban enclave studies that commonly centered investigations of immigrant communities and their experiences in the United States (Portes and Bach, 1985; Portes and Manning, 1986), we describe the enclave as a locus of power for those who are predominantly white and wealthy (Marcuse, 1997). Finding that the enclave can be conceptualized with regard to both the push and the pull of access to transit systems and neighborhoods. We add complexity to the use of enclaves by showing the differing role they play in the reproduction of both neighborhood inequality and city access through transit systems.
What is most unique in our findings is that we see these disparities arise for Latinxs in a city that is majority Latinxs. In San Antonio the public transit system does not provide a means for social equity and mobility instead we show that the public transit system reinforces racial boundaries with enclaves of inaccessibility and limits Latinxs access to the city space through enclaves of exclusion. Many urban studies scholars focus on cities such as Philadelphia (Anderson, 2000), Los Angeles (Davis, 2006), New York (Duneier, 1992), or similar large and racially diverse cities, we center our research on a city with a numerically smaller population overall and one that is proportionately less racially diverse. Illustrating that race and class inequality do not require numeric majorities to be in favor of those who are wealthy and White. Moreover, by building on arguments made by Bullard (2004) and Tomer (2011), our research shows that reduced access to public transportation coupled with a dominance of car infrastructures and car dependency ideologies reproduce race and class inequalities in San Antonio. As San Antonio grows, continuing to rely on these ideologies about and practices for city planning and infrastructure development will widen the gaps in mobility and access that are already immense.
With the Latinx population continuing to grow rapidly in the US, according to Pew Research Center (2022) Hispanics account for half of the overall population growth from 2010 to 2020. San Antonio too has seen similar growth. This population will need a more efficient and effective means to travel across the very large metropolitan area of San Antonio. This will require the city to prioritize poor and working class Latinxs in its city planning and its public transit will be the lynchpin for this planning in the years to come.
Lastly, further research on this project will focus on how individual’s living in and engaged with these enclaves view their community’s exclusionary practices with plans to collect data from residents planners and politicians involved in maintaining these enclaves. The perspectives of planners, politicians and residents will enable more depth regarding the decision making processes that guide the exclusionary practices and would help to gain more insight into how much equitable access is considered in planning of these bus routes and city spaces. Additionally on-going research into the histories of these enclaves are already providing significant insight into the presence of old race and class covenants that were written to exclude Black, Latinx, and poor/working class people from Alamo Heights. Coupling these data together will further paint the picture of how San Antonio’s histories are shaping race, class, and transportation in the present.
Footnotes
Acknowledgements
We would like to thank the anonymous reviewers for their significant insight and support during the review process.
Funding
The author(s) disclosed receipt of the following financial support for the research, authorship, and/or publication of this article: This material is based upon work supported by the National Science Foundation’s Grant No. 2131193. Any opinions, findings, conclusions, or recommendations expressed in this material are those of the author(s) and do not necessarily reflect the views of the National Science Foundation.