
Abstract
The objective was to determine the impact of simulated pharmacist interventions on out-of-pocket cost, time to coverage gap, and cost per patient to the Medicare Part D program using actual patient cases from an adult general medicine clinic. Medication profiles of 100 randomly selected Medicare-eligible patients from a university-affiliated general internal medicine clinic were reviewed by a pharmacist to identify opportunities to cost-maximize the patients’ therapies based on the plan. An online Part-D calculator, Aetna Medicare Rx Essentials, was used as the standard plan to determine medication cost and time to gap. The primary analysis was comparison of the patients’ pre-review and post-review out-of-pocket cost, time to coverage gap, and cost to Medicare. A total of 65 patients had at least 1 simulated pharmacist cost intervention. The most common intervention was substituting for a less costly generic, followed by substituting a generic for a brand name. Projected patient cost savings was $476 per year. The average time to coverage gap was increased by 0.7 ±1.2 months. This study illustrates that the pharmacists may be able to reduce cost to some patients as well as to the Medicare Part D program.
People who have Medicare have the option to enroll in the federally subsidized prescription drug program Medicare Part D. This program, available to Medicare-eligible individuals, was implemented in 2006 to improve access to prescription medications. Private insurance companies offer part D plans, rather than a universal plan managed by the Medicare. Each plan varies in the formulary (list of covered drugs), copayment, yearly deductibles, and annual enrollment fees. A unique aspect of the plan is a coverage gap, commonly referred to as the doughnut hole. The coverage gap was included in an effort to keep the program’s cost within the congressional budget. 1
In 2009, the standard Medicare Part D plan was structured with an initial deductible, where the patient would pay the full cost of prescriptions until $295 was spent. Prescriptions obtained after this point would be covered up to 75% of the cost for approved medications, with the patient paying 25% of the cost out of pocket. This arrangement continues until the patient’s medication regimen costs reached $2700. At that point, the patient reaches the initial coverage limit and becomes responsible for 100% of the cost of the medication. This point is known as the coverage gap or doughnut hole in the plan. If, during the rest of the year the patient continues to obtain prescription medication, the total amount of money spent on the prescriptions reached $4350, the plan reverts back to covering a significant portion of the cost of medication. This is referred to as the catastrophic coverage portion of the benefit. The patient is then responsible for paying a lower copay for each prescription that varied based on the generic product availability and the tier placement on plan formularies.
There has been debate on the impact the Medicare Part D program has on the patient’s medication adherence. Several large survey-based studies have shown that seniors have experienced cost-related nonadherence behaviors, such as skipping doses, reducing doses, and not filling needed prescriptions. 2 It has been shown that those beneficiaries who have capped coverage filled fewer prescription medications for chronic conditions, but experienced higher rates of nonelective hospitalizations, visits to the emergency department, and mortality when compared to those with noncapped coverage. 3 Others argue that the program has been beneficial to those seniors who did not have any prescription coverage before the initiation of Medicare Part D. Also, there is evidence that Medicare Part D has increased medication adherence while decreasing out-of-pocket costs. 4
Although there is controversy about the overall effectiveness of the program, there is potential to reduce the cost-related nonadherence through reduced copays and costs associated with paying full price once in the coverage gap. 5 It has been shown that pharmacists have an important role in helping patients to reduce out-of-pocket spending on prescription medication by suggesting switching to generic prescriptions. 6 With the extensive knowledge of prescription cost and generic alternatives, pharmacists are in a position to assist Medicare Part D-eligible people to decrease the prescription cost by switching to generic medications. Other actions that pharmacists can do to limit the out-of-pocket cost to patients is through recommending to prescribers changes in therapy that combine 2 drugs into a combination dosage form as well as to prescribe medication alternatives within therapeutic classes that are covered on the least expensive copay tier. Reducing overall medication cost through various interventions may lead to a prolongation until the patients reach the Medicare Part D coverage gap, where they are expected to pay full price for medications.
The objective of this study was to determine the impact of simulated pharmacist interventions on the patient’s cost savings, the patient’s time to coverage gap, and the cost savings per patient to the Medicare Part D program using actual patient cases from an adult general medicine clinic.
Methods
Study Design
This was a cross-sectional study of the potential cost savings to patients and Medicare determined using simulated pharmacist interventions derived from the actual Medicare-eligible patients’ prescription profiles from a general internal medicine clinic.
Subjects
Study subject cases were identified from an adult general internal medicine clinic of a large university-affiliated health system. All patients between the age of 65 and 85 years who had at least 1 visit to the clinic in November and December 2009 were identified. They were further filtered to identify those with 3 or more unique prescription medications used for the treatment of chronic illness listed in their electronic medication profile. From this computer-generated list, 100 people were randomly selected using the SPSS random selection function (SPSS, Inc, PASW Statistics 18, Chicago, Illinios). A spreadsheet with patient identifiers was then provided to the researchers for use in data collection. The project was approved by the affiliated university human subjects institutional review board committee.
Data and Simulated Interventions
The researchers initially accessed each patient’s electronic medical record to obtain their medication list. The medications were used to calculate individual baseline annual medication expenses, out-of-pocket cost, cost to Medicare, and time to gap coverage. Baseline costs were derived. These calculations were used as patient’s pre-pharmacist cost intervention data and expenses.
The Q1 Medicare online doughnut hole calculator was used to determine cost and time to gap data. 7 This program was chosen because of the user-friendly software and the ability to calculate data based on the specific Part D plan parameters. Aetna Medicare Rx Essentials was chosen as the standard Part D plan for the geographical location of the clinic. This plan was chosen based on Q1 Medicare’s comparison of the number of members, total “Rx cost information” rating, and number of drugs on formulary among all available plans.
After the baseline medication costs were obtained, medication lists were reviewed by a pharmacist to identify opportunities to maximize the therapy. Opportunities included brand to generic, generic to alternative generic, and brand name to alternative brand name substitutions. Other potential interventions included changing medication from a more costly sustained release product to an immediate release product; dividing expensive combo products into 2 agents; and discontinuing unnecessary medications and therapeutic duplications.
Outcome Measures
The primary outcome variable was average out-of-pocket savings to Medicare Part D members. Secondary outcomes include average cost savings per patient to Medicare Part D, percentage change in patients reaching gap coverage, and percentage change in time to reach doughnut hole. Additional analyses included determining the number and percentage of patients who, with simulated intervention, would have reached the catastrophic coverage, and the number and percentage of those who would have reached the coverage gap sooner with simulated intervention than without.
The Q1 Medicare doughnut hole calculator utilizes the data from planprescriber.com to calculate these out-of-pocket savings to Part D members and savings per patient to Medicare Part D. The web site estimated drug costs based on an estimated nationwide average drug price. 8 Estimated costs reflect the use of each Medicare plan’s approved pharmacy network. 8
Data Analyses
Descriptive statistics were conducted to determine the overall characteristics of the patients. Data for the total patient out-of-pocket cost, time to coverage gap, and cost to Medicare per patient were aggregated initially for all patients based on the drug regimens as if no changes were implemented. Data for total patient out-of-pocket cost, time to coverage gap, and cost to Medicare per patient was then recalculated for each patient based on potential interventions by the pharmacist and carried forward for the rest of the year. A Student t test for paired data was performed to determine whether the mean values for total patient out-of-pocket cost, time to coverage gap, and cost to Medicare per patient, between the unchanged drug regimen values versus the same aggregated values for the regimen costs that would have been changed based on the simulated pharmacist interventions. Frequencies were calculated to describe the effect of the pharmacists interventions on the number of people who reached the coverage gap as well as the number who would have reached catastrophic coverage. SPSS software (SPSS, Inc, PASW Statistics 18,) was used for data storage and analyses.
Results
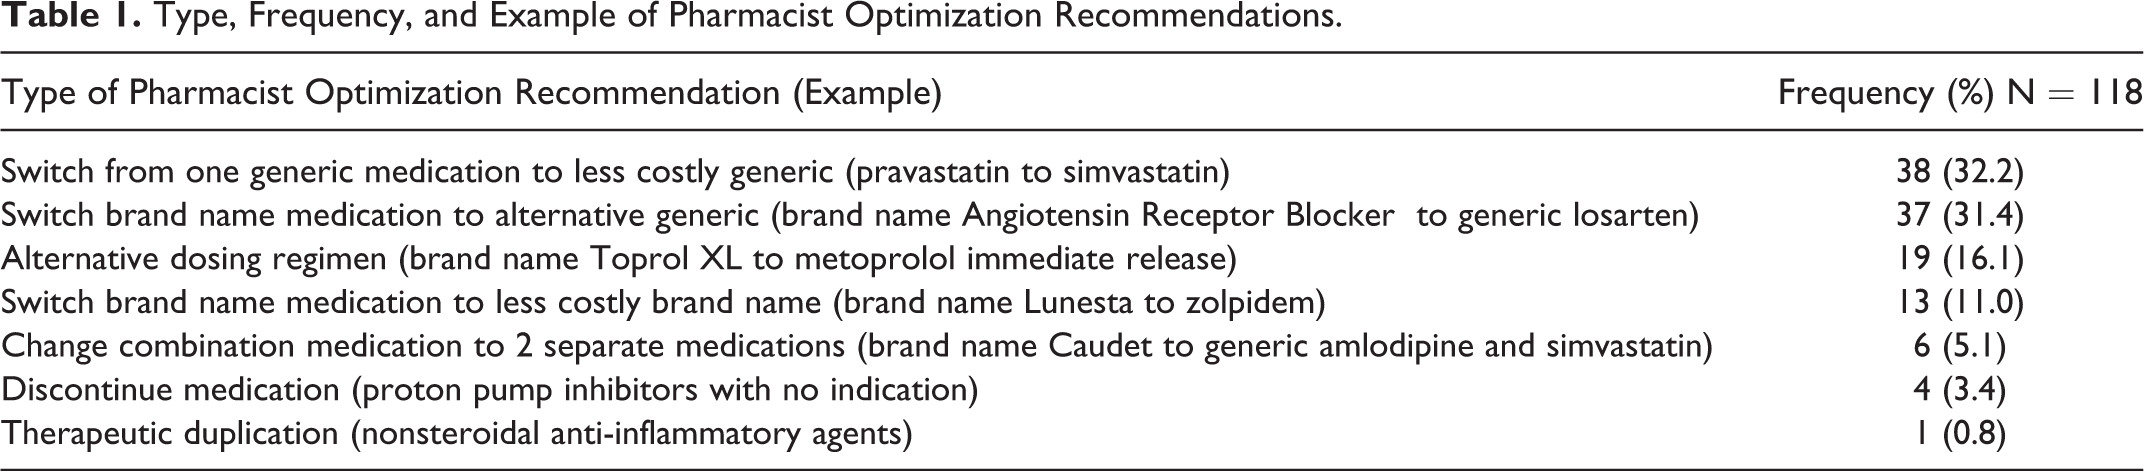
The average age of subjects was 72.9 ± 6.1 years. The majority was female (57%), and subjects were on an average of 9.9 ± 3.9 prescription medications. Of the 100 patient profiles reviewed, 64 had at least 1 simulated pharmacist cost intervention recommendation. Table 1 shows the distribution of the 118 cost-related recommended interventions. The most common pharmacy optimization was substituting a generic medication for a less-costly generic (n = 38, 32.2%), followed by substituting a generic medication for a prescribed brand named drug (n = 37, 31.4%).
Type, Frequency, and Example of Pharmacist Optimization Recommendations
The average baseline medication cost was $3405.58 ± $423.87; and the average postintervention medication regimen cost was $2929.35 ± $407.09.The average reduction in cost of medication regimens was $476.23 ± $776.77 per year (P < .001). On average, the simulated-pharmacist cost interventions would delay patients reaching the coverage gap by 0.7 ± 1.2 months, P < .001. The mean number of months to reaching the coverage gap was 6.3 ± 2.9 months without pharmacist intervention versus 7.0 ± 3.3 months for the simulated intervention. Of the 100 patients studied, 67 would have entered the coverage gap during the year without interventions, while 58 would have entered the gap if all recommendations were implemented. There were 3 patients who would have fallen into the coverage gap sooner by 1 month, had the recommendations been accepted. In all 3 cases, they occurred late in the year, where there was no chance of emerging on the other side of the doughnut hole to arrive at the catastrophic coverage.
Average baseline medication costs to Medicare Part D (per patient per year) were $3251.34 ± $1247.29. The average cost to Medicare Part D would have been $2925.92 ± $1236.83 per patient per year if all simulated-pharmacist cost interventions were accepted. The average reduction to Medicare Part D would be $325.41 + $747.73 per patient per year (P < .05).
Discussion
We found that pharmacist-led interventions could potentially decrease the total medication costs for patients enrolled in Medicare Part D as well as potentially reduce the government’s total expenditures for Medicare Part D. Although the time to gap coverage did increase statistically, the clinical significance of this increase (0.7 months) is small. The primary point is the overall cost savings to the majority of individuals.
Alston and Hanrahan completed a study which is similar to the present study. 9 The researchers reviewed the medical records of 50 Medicare Part D enrollees to determine whether there was a better Part D plan for the person, whether there were therapeutic substitutions that would lower the cost, and whether either set of interventions would lead to changes in time to entering the coverage gap. The researchers were able to demonstrate that, through their potential interventions, patients would have saved considerable money in out-of-pocket medication-related expenses. The savings were generated through switching the patient’s Part D Plan to a lower cost alternative ($456.67 per year) as well as the therapeutic substitutions which averaged $1303.45 savings per person for whom interventions were possible. This is considerably greater than the projected $476.23 average in our study. The third objective of their study was to determine the potential effect of interventions on delaying entry into the coverage gap. They found a delay of 3 months, greater than the average of 0.7 months in our study.
Another study conducted by Winston and Lin used a retrospective analysis of over 1 01 846 medication therapy management (MTM)-eligible Part D patients over an 8-month period. 10 They compared 3 groups those who received face-to-face and telephonic MTM services from a community pharmacist; those who received MTM services from a call center pharmacist; and those who received an educational mailing only. Patients who received MTM services from the community pharmacist had a decline in mean monthly drug costs of $35 ($29 for face-to-face MTM and $40 from pharmacy-based telephone services); MTM from a call center pharmacist led to a mean reduction in monthly drug costs of $15, and there was no change in drug costs for the patients receiving educational material only. Our study had a similar magnitude of reduction in the drug cost to the face-to-face option, with an average reduction of $39.66 per month. Moczygemba et al measured the impact of telephone-administered MTM services on multiple outcomes, including documentation of medication and health-related problems; medication adherence; and Part D drug costs. 11 The telephone MTM services led to a significantly greater number of problems identified and solved but no significant changes in adherence or total drug costs. Cost-related problems were the most common issues addressed by the MTM pharmacists. In our study, cost-related interventions were the only interventions considered. The MTM intervention group had a mean reduction in drug cost of $158 at the 6-month follow-up time compared to a mean increase of $118 for the control group. The reduction of $158 at 6 months is less but comparable to $476 at 1 year that we found in our study. Both studies by Moczygemba et al and Winston and Lin utilized a more comprehensive intervention strategy, which incorporated therapeutic and generic substitution, along with other strategies, to improve the medication utilization. Our study focused strictly on the medication substitutions to reduce out-of-pocket costs to the patient.
An important implication of the findings of this study is that through pharmacist review of drug regimens, there may be reduction in medication-related out-of-pocket cost burden to the patient. Although Medicare Part D was implemented to increase access to prescription drugs primarily for seniors without prescription drug insurance, the out-of-pocket cost burden experienced by the patient once they reach the coverage gap may lead to cost-related medication nonadherence (CRN). The CRN, which includes not filling prescriptions and/or skipping doses, occurred in 11.5% and 20% of patients reaching the coverage gap in 2006 and 2007, respectively. 2,12 The CRN also varies by disease state. In all, 10% of diabetic patients who reached the coverage gap in 2007 stopped taking their diabetic medications, and 5% reduced their medication use. In comparison, 18% of the patients who take osteoporosis medications stopped taking their osteoporosis drugs after reaching the coverage gap, and 1% reduced their medication use. 13
Although the exact health impact resulting from CRN in Medicare Part D recipients is unknown, increased CRN in other patient populations has been associated with negative health outcomes. A study by Heisler et al found that middle-aged and elderly Americans with restricted medication costs showed greater rates of self-reported decline in health status. In addition, higher rates of angina and nonfatal heart attacks or stroke were reported in those with restricted medication cost. 14 A separate study by Hsu et al found a similar correlation; prescription caps led to worse control in lipid levels, glucose, and blood pressure in patients with chronic diseases. 3
There are several limitations in this study. First, it was assumed that the patient’s medications did not change over the course of a year. The therapy would likely change for many patients over time, which would provide the pharmacist with added opportunity to assess regimens and provide helpful recommendations. In addition, we assumed all patients were on a common Part D plan. Plans that are chosen by patients based on their unique medication regimens and financial needs may lead to variations in out-of-pocket costs. Another limitation is the assumption that all recommendations for change in therapy would be accepted by the prescriber and the patient. It is feasible that many recommendations would be accepted by the prescriber, but even the patient may not want to experience a change in medication. A third limitation is that the recommendations were not reviewed by the physician prescribers for appropriateness or acceptability. Recommendations for change would primarily be interchange from brand to generic or change within drug categories (ie, with angiotensin-converting enzyme [ACE] inhibitor group). But again, some physicians as well as patients may be reluctant to change therapy. A fourth limitation of the study is related to the generalizability of the intervention. We used a general medicine clinic as the source of patients for the study. We had time and access to patient medical information when formulating the recommendations. We also limited our use of Medicare Part D plans to one plan, simplifying our work in calculating alternative drug therapies for recommended interventions. The reality is, in the busy community pharmacy environment, the pharmacist may not have the time to look up plan options for the patient. As well, there are many different Part D plans used by the patients in a pharmacy’s patient population. We envision the need for a dedicated person as a part of the pharmacy staff to be able to review the drug options for all the various plans that patients present with. The time and effort may not be feasible in the current community pharmacy environment. This may change if the community pharmacists were reimbursed for their efforts by Part D plans. Alternatively, Part D plans may employ pharmacists to review drug profiles for their patients, looking for ways to optimize therapy to the least expensive, therapeutically sound regimens.
As of 2011, once the patients reach the coverage gap, they were eligible for a one-time, tax-free $250 rebate check and 50% off in brand-named medications. 15 This cost incentive was not included in our analysis. After this study began, the Centers for Medicare and Medicaid Services announced it would eliminate the coverage gap by the year 2020. 16 Although the coverage gap will eventually be eliminated, these data still emphasize the potential effectiveness of the pharmacist-led interventions.
Conclusion
This study, using simulated pharmacist interventions on an actual set of patients eligible for Medicare Part D, illustrates that pharmacists may be able to reduce out-of-pocket prescription cost to some patients as well as to the Medicare Part D program.
Footnotes
Declaration of Conflicting Interests
The author(s) declared no potential conflicts of interest with respect to the research, authorship, and/or publication of this article.
Funding
The author(s) received no financial support for the research, authorship, and/or publication of this article.