
Abstract
Objectives:
The purpose of this study was to survey new enrollees in a community pharmacy, employer-based diabetes and hypertension coaching program to describe the characteristics, health beliefs, and cues to action of newly enrolled participants.
Methods:
A 70-question, 5-point Likert-type survey was developed using constructs from the Health Belief Model (HBM), Theory of Planned Behavior (TPB), and Theory of Reasoned Action (TRA). New enrollees in the coaching programs completed the survey. Survey responses between controlled and uncontrolled patients and patient demographics were compared.
Results:
Between November 2011 and November 2012, 154 patients completed the survey. Patients were fairly well controlled with a mean hemoglobin A1C of 7.3% and a mean blood pressure of 134/82 mm Hg. The strongest cue to action for enrollment was the financial incentives offered by the employer (mean: 3.33, median: 4). White patients were significantly more motivated by financial incentives. More patients indicated they had not enrolled previously in the program because they were unaware it was available (mean: 2.89, median 3.0) and these patients were more likely to have an uncontrolled condition (P ≤ 0.050).
Conclusion:
A top factor motivating patients to enroll in a disease management coaching program was the receipt of financial incentives. Significant differences in HBM, TPB, and TRA responses were seen for patients with different demographics.
Introduction
Diabetes and hypertension are among the most common diseases in the United States, affecting 25.6 and 68 million adults, respectively, and are the major causes of heart disease, stroke, and kidney failure. 1,2 Extensive therapeutic and lifestyle modifications can prevent comorbidities, yet these modifications can be overwhelming, challenging, and exhausting for patients. 3
Employer-based disease management programs promote lifestyle modifications and focus on the prevention of medical problems to improve employee health and reduce health care costs. 4 –6 Specifically, community pharmacy employer-based programs effectively manage diabetes and hypertension and improve clinical outcomes such as hemoglobin AIC (HbA1C), blood pressure (BP), and dyslipidemia. 3,7 –14 Despite the availability and effectiveness of disease management programs, these programs are underutilized. In 2008, only 56.8% of adults with diabetes reported ever receiving formal diabetes education which was lower than the Healthy People 2020 goal of 62.5%. 1,15 A previous publication of an employer-based coaching program demonstrated that only 16.2% of the eligible participants were enrolled in the program. 16
Importantly, disease management programs may be underutilized by patients with uncontrolled conditions. Lack of patient engagement in self-management behaviors is a significant predictor for poor clinical outcomes. 17 Therefore, patients with poorly controlled disease states may lack the engagement to participate in voluntary self-management programs. Determining ways to engage patients with poorly controlled conditions is vital for such programs to significantly impact public health.
The Health Belief Model (HBM), Theory of Planned Behavior (TPB), and Theory of Reasoned Action (TRA) are effective models for explaining behavior and predicting patient preventative actions such as receiving mammograms, performing testicular self-exams, and receiving immunizations. 18 –24 These models successfully predict adherence to medication regimens and other health care recommendations. 25,26 Additionally, the HBM predicts factors affecting patient retention in diabetes pharmaceutical care services. 27 One component of the HBM is referred to as “cues to action” or factors that motivate patients to implement behavior changes. Personal experiences or external influences such as marketing or public service announcements may act as a cue to action to motivate patients to change behavior. 28
However, no studies were found which describe the patient behaviors and health beliefs that predict enrollment into disease management programs in a community pharmacy. Therefore, we used the HBM, TPB, and TRA to understand the characteristics and motivating factors of patients who enrolled into diabetes and hypertension coaching programs. This study is significant because it provides an understanding of patients’ motivation to enroll in disease management programs and in the future could allow pharmacists and employers to increase enrollment in programs by developing marketing strategies to target specific patient populations who may benefit.
Objectives
The purpose of this study was to survey new enrollees in a community pharmacy, employer-based diabetes and hypertension coaching program to describe the characteristics, health beliefs, and cues to action of newly enrolled participants.
Methods
Practice Setting
Kroger pharmacy is a large national grocery store pharmacy chain. The Cincinnati-Dayton Kroger division contains 103 pharmacies located throughout Cincinnati, Dayton, Northern Kentucky, and Western Indiana. A variety of clinical services are offered in Kroger pharmacies, including immunizations, health care screenings, medication therapy management, smoking cessation, and fitness, nutrition, and weight loss programs. 29 Since 2008, Kroger has successfully sustained an employer-based diabetes and hypertension coaching program, modeled after the Asheville Project. 3,7 –9,16 Patients enrolled in these coaching programs are required to maintain regular visits with specially trained pharmacists in certain pharmacies. Visit frequency occurs at the discretion of the pharmacist and typically ranges from every month for uncontrolled patients to yearly for controlled patients enrolled in the program for greater than 1 year. At the appointments, the pharmacist and patient discuss medications and lifestyle modifications, and patients must maintain regular physician visits, receive appropriate laboratory monitoring, and set and achieve health-care–related goals. Patients who meet these requirements receive waived or reduced co-payments on medications and supplies for diabetes, hypertension, and hyperlipidemia. Kroger currently contracts with multiple employer groups that provide reimbursement for pharmacist coaching program services, the largest of which is the City of Cincinnati. All members and dependents with City of Cincinnati insurance are eligible for participation in the program if they are on at least one medication for diabetes and/or hypertension.
Patient Selection
A convenience sample of all newly enrolled patients in the diabetes and hypertension coaching programs from November 2011 through November 2012 was eligible for participation in this study. Patients who were previously enrolled in the program and were either voluntarily or nonvoluntarily disenrolled from the program could be reenrolled after a 6-month period. Patients who reenrolled in the program were included in the study. Patients maintaining active participation in the program prior to study initiation were excluded from the analysis. This study was waived by the University of Cincinnati Institutional Review Board.
Survey Development
Two 70-question Likert-Type surveys were developed using constructs from the HBM, TPB, and TRA and structured after existing, validated surveys. 21 The survey analyzed 12 constructs of these models, including perceived importance, perceived confidence, behavioral intent, social norms, perceived benefits of the program, perceived benefits of managing their condition, perceived barriers to enrolling in the program, perceived barriers to managing their condition, perceived susceptibility, current health, current habits, and cues to action. A score of 1 represented strongly disagree and a score of 5 represented strongly agree.
One survey was for patients enrolling into the diabetes coaching program and the other survey was for patients enrolling into the hypertension coaching program. The surveys were identical with the exception of questions addressing complications that were tailored to the appropriate disease state. The surveys contained a section for demographics such as sex, age, height, weight, marital status, and level of education. The final section of the survey consisted of a summary of baseline laboratory measures such as BP, A1C, lipid panel, and knowledge assessment scores. The hypertension knowledge assessment was an 18-question survey administered to assess the patient’s baseline knowledge of hypertension. A score of 70% (less than 13 correct) was categorized as a “low” score. The diabetes knowledge assessment (Patient Self-Management [PSM]) was a 36-question, validated survey from the American Pharmacist Association. Patients can score as a beginner, proficient, or advanced for this knowledge assessment. 30
Face and content validities for the survey were established by distributing the survey to a panel of experts in diabetes and hypertension management, pharmacy, health education, and survey research. All suggested comments and revisions were incorporated into the final instrument. To test the stability validity of the instrument, the survey was administered to previously enrolled patients in the diabetes coaching program. Within 1 week, patients were asked to return to the pharmacy to complete the survey for a second time. A gift card incentive was provided to patients for returning. To test the internal consistency of the survey, Pearson correlations were computed for each of the 12 parametric subscales and the overall Pearson correlation coefficient was calculated for all subscales. The overall Pearson correlation coefficient for all subscales combined was 0.80, thus demonstrating that the survey was reliable and stable over time.
Survey Administration
Upon enrollment at the initial diabetes or hypertension coaching program appointment with the pharmacist, patients were informed of the study and were asked to complete either the hypertension or the diabetes survey during the appointment time. Patients with diabetes and hypertension completed the diabetes survey only. The pharmacist completed the baseline laboratory information from laboratory test results received from the doctor or taken during appointments, BP taken by the pharmacist, and scores from the knowledge assessment that were administered at the initial visit. Completed surveys were delivered to the principal investigator electronically through a secured fax line and the paper survey was filed in the patient’s chart in the pharmacy.
Statistical Analysis
Descriptive statistics were used to evaluate patient responses on the diabetes and hypertension surveys. Patients were categorized based on disease state control for A1C and BP. Patients with diabetes and a hemoglobin A1C of greater than 7.0% were classified as uncontrolled. Patients completing the hypertension survey with a systolic blood pressure greater than or equal to 140 mm Hg or a diastolic BP greater than or equal to 90 mm Hg were defined as uncontrolled. Independent t tests, 1-way analysis of variance, and chi-square tests were utilized to compare survey responses between patient demographics such as race, sex, marital status, and education level. Independent t tests were utilized to determine whether differences existed between survey responses for controlled and uncontrolled characteristics. SPSS version 18.0 was used for survey analysis.
Results
During the study period, 154 patients enrolled in the program and completed the survey. No patients enrolled in the program and refused to complete the survey. A total of 39.6% enrolled in the diabetes coaching program and 60.4% enrolled in the hypertension coaching program. The mean age for all patients was 61 years (standard deviation [SD]: 12.3). Overall, patients who enrolled in the diabetes coaching programs were fairly well controlled with an average A1C of 7.3% (SD: 1.44). Of the patients with an uncontrolled A1C, the average A1C was 8.43% (SD: 1.31). Similarly, patients who enrolled in the hypertension coaching program were well controlled with an average BP of 134/82 mm Hg. The average blood pressure among uncontrolled patients was 147/90 mm Hg. There were no significant differences in baseline demographics between patients with uncontrolled and controlled conditions (Table 1).
Patient Demographics.
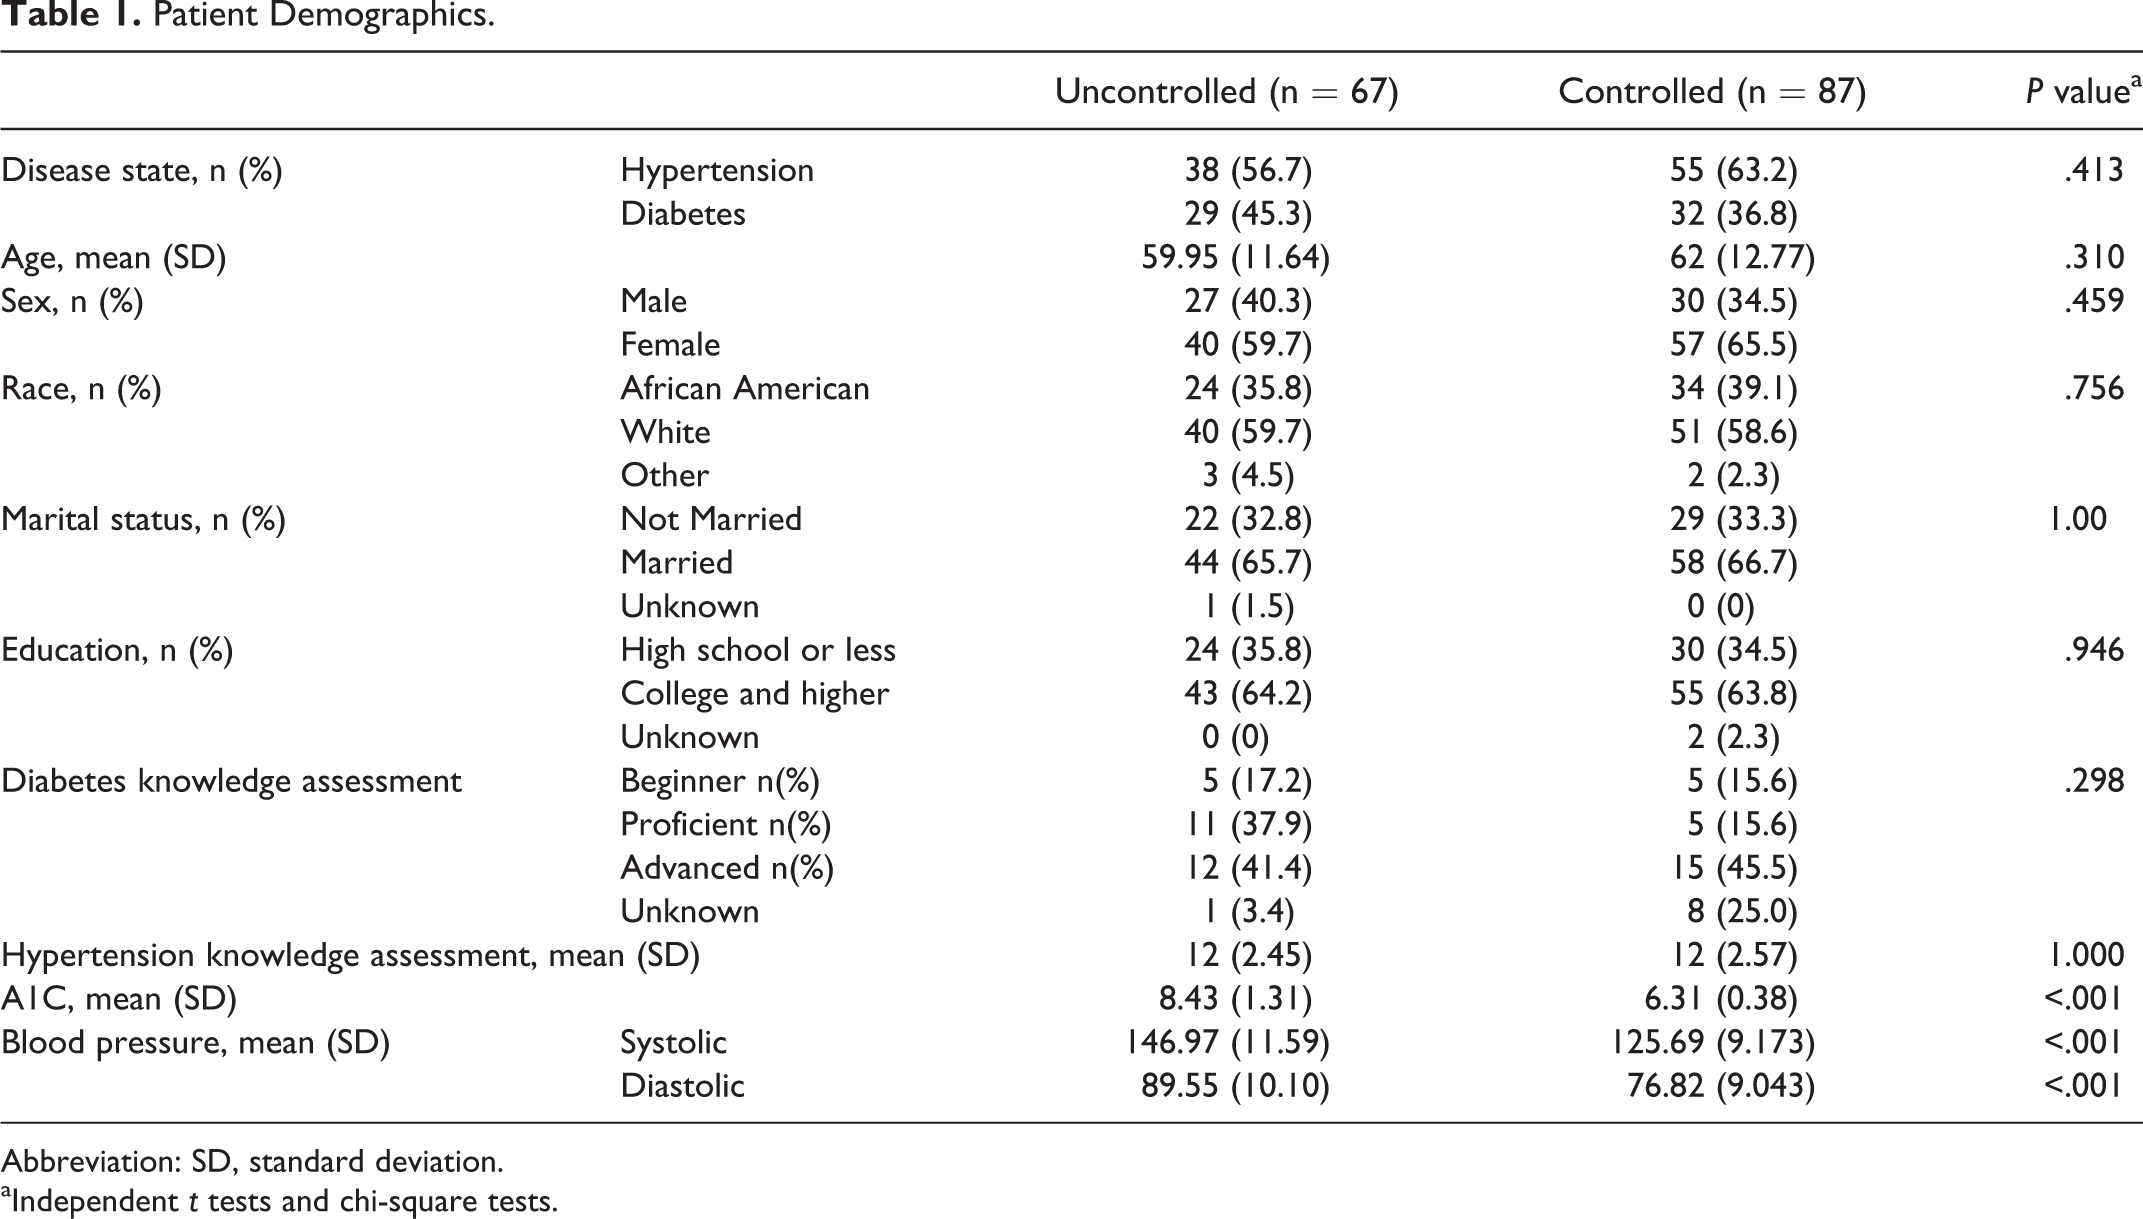
Abbreviation: SD, standard deviation.
aIndependent t tests and chi-square tests.
Overall for both programs, the most compelling cue to action associated with enrollment in the coaching programs was the financial incentives offered for enrollment (mean: 3.33, SD 1.31, median 4.0). Of the mailed newsletters advertising the program, the newsletter from the employer was the stronger cue to action compared to newsletters from the pharmacy and from the insurance company (mean: 3.02 versus 2.16 and 2.55, respectively). Despite the various recruitment strategies, patients indicated they had not enrolled previously because they were unaware the program was available (mean: 2.89, median 3.0). Some patients indicated they had not enrolled previously in the program because they did not have time (mean: 2.21). Other barriers such as concern the program would not be beneficial, a lack of transportation, and embarrassment were less important (mean: 1.97, 1.73, and 1.67, respectively).
Patients with controlled conditions exhibited significantly greater perceived confidence than uncontrolled patients. Uncontrolled patients reported significantly greater barriers to management of their health care conditions. Specifically, uncontrolled patients were more likely to agree they had not enrolled in the program previously because they were not aware the program existed (Table 2).
Mean Survey Responses.
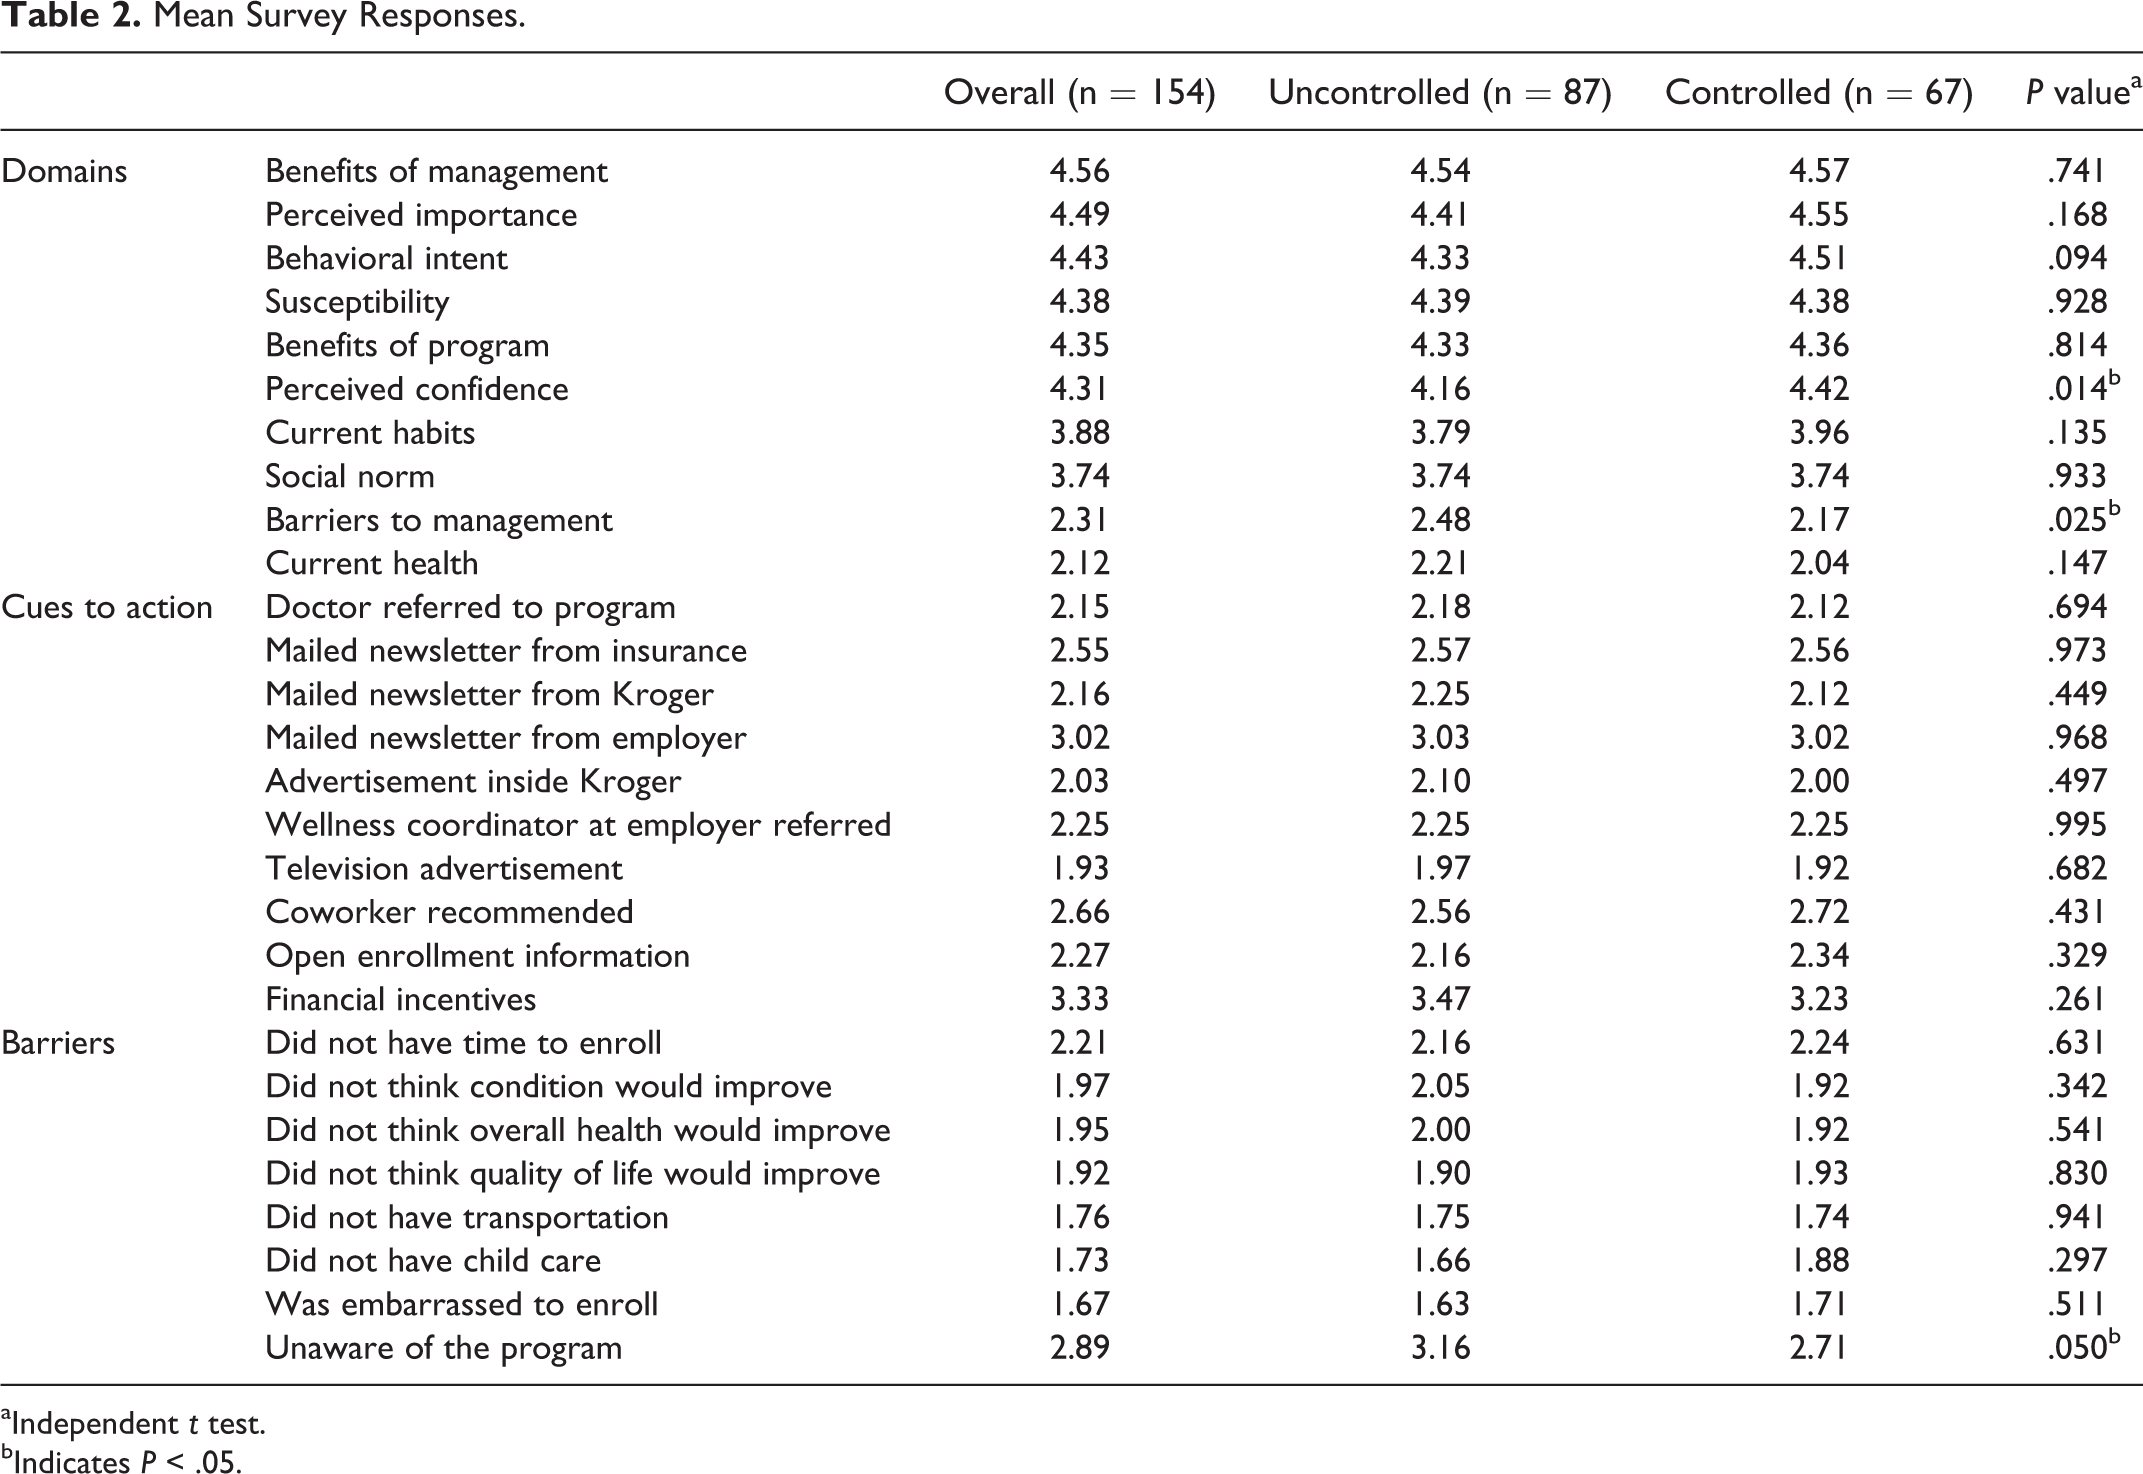
aIndependent t test.
bIndicates P < .05.
Significant differences were seen between the constructs and the patient demographics. African American patients reported significantly higher confidence in performing healthy behaviors than white patients (4.44 vs 4.21, P = 0.028). White patients were significantly more likely to enroll in the program due to financial incentives (3.56 vs 2.95, P = 0.006). African American patients indicated they were more likely than white patients to enroll because they perceived the program would be beneficial in managing their health (4.52 vs 4.23, P = 0.003) and had a higher perceived importance for maintaining a healthy lifestyle (4.62 vs 4.4, P ≤ .050). White patients reported more barriers to enrollment such as time and uncertainty that the program would provide benefits to their health compared to African American patients (Table 3).
Significant Survey Responses Based on Patient Demographics.
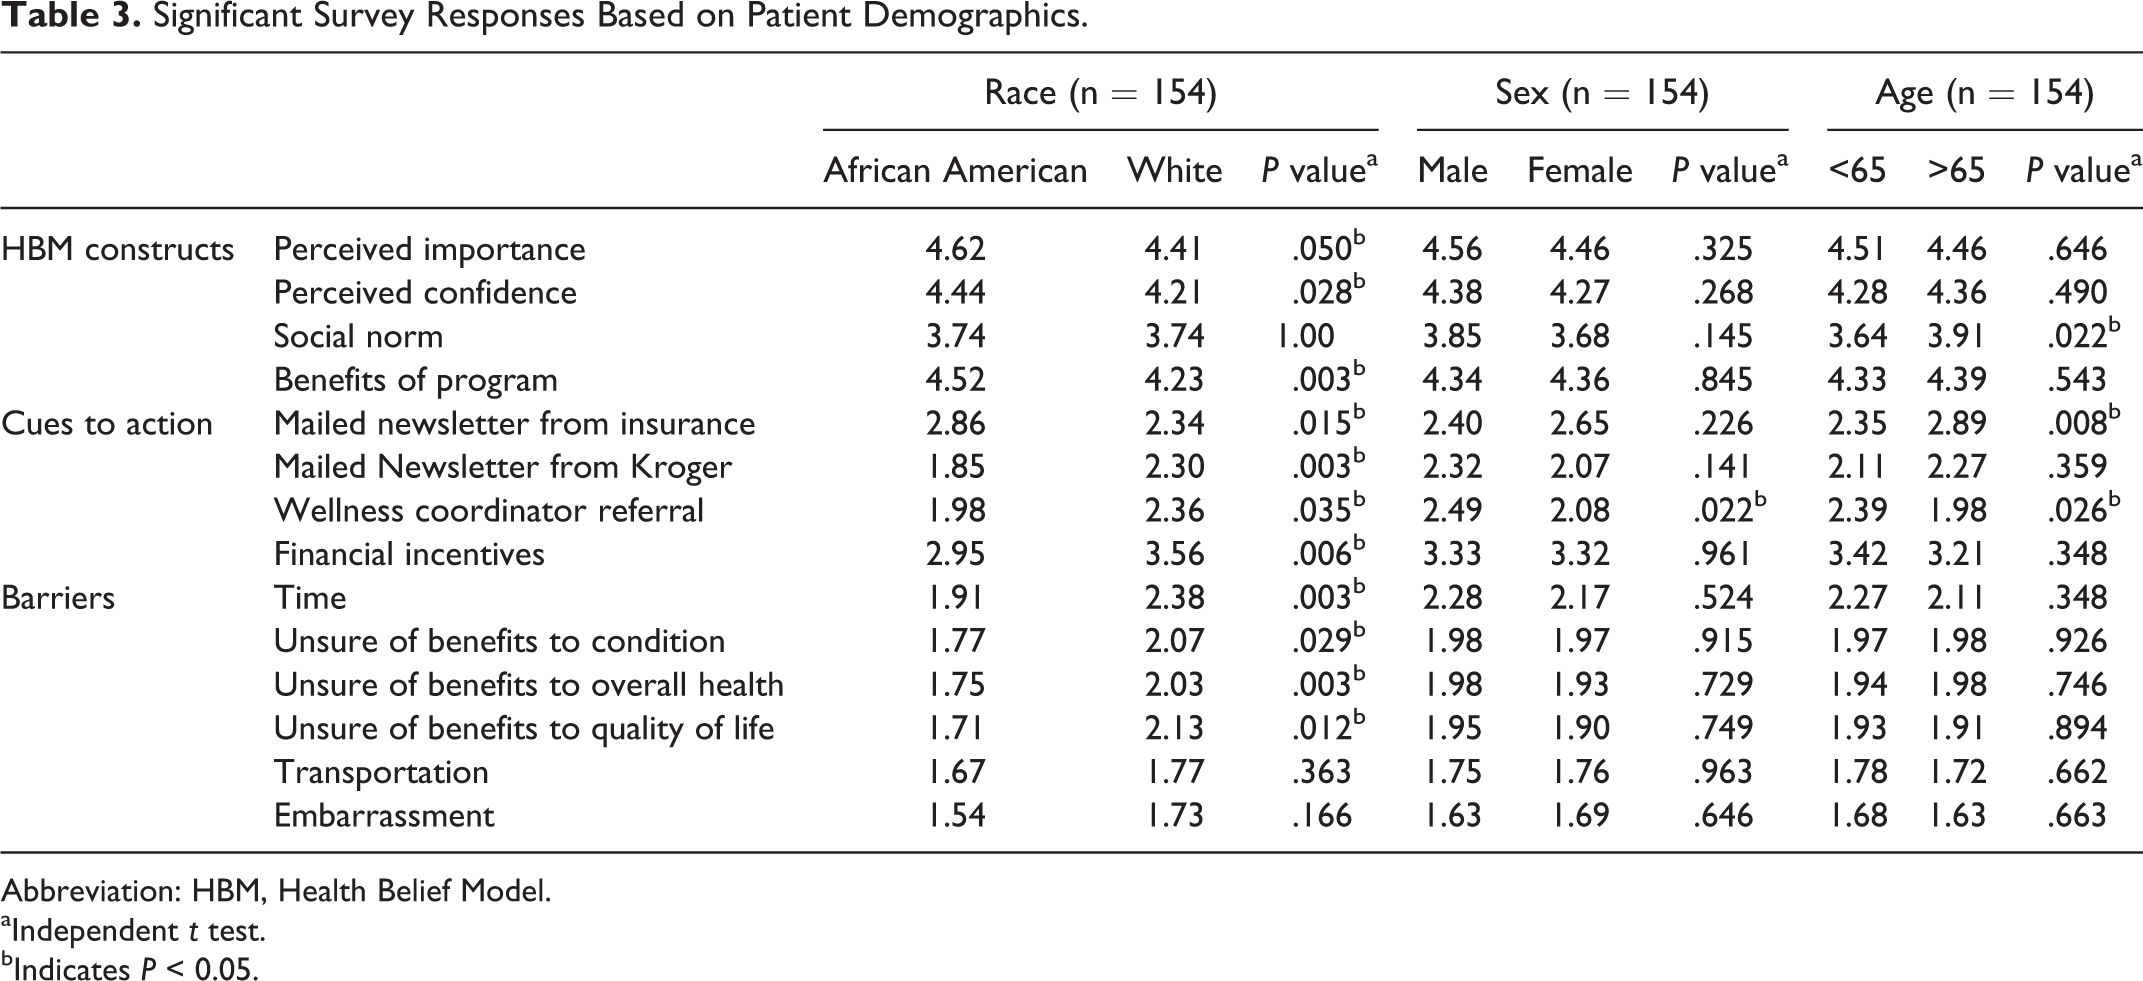
Abbreviation: HBM, Health Belief Model.
aIndependent t test.
bIndicates P < 0.05.
Patients greater than 65 years of age agreed more frequently that those around them engage in healthy behaviors (social norm 3.91 vs 3.64, P = 0.022). Additionally, they were more likely to respond to mailed newsletters from their insurance company promoting the program (2.89 vs 2.35, P = 0.008) and less likely to respond to recommendations from the employer’s wellness coordinator (1.98 vs 2.39, P = 0.026).
Survey responses for males and females were similar for most of the parameters with the exception that males were referred to the program by the wellness coordinator more than females (2.49 vs 2.08, P = 0.022). Similarly, survey responses were similar with respect to marital status, although single patients were less likely to agree that those around them engage in healthy behaviors than married patients (3.54 vs 3.83, P = 0.014). Additionally, single patients were less confident in their ability to partake in lifestyle modifications than married patients (4.12 vs 4.40 P = 0.011).
Patients with less than a high school education reported less susceptibility to complications (4.26 vs 4.48 P = 0.037) and better current health (2.30 vs 2.02, P = 0.017) than patients with higher than a high school education. Patients with higher baseline knowledge of diabetes understand the benefits of managing diabetes and believe they are more susceptible to complications. However, patients who scored lower on the diabetes knowledge assessment were more likely to respond to advertisements of the program sent from their insurance company. Patients with a low score on the hypertension knowledge assessment reported better health but worse habits than patients with higher scores (Table 4).
Significant Survey Responses Based on Education and Knowledge.
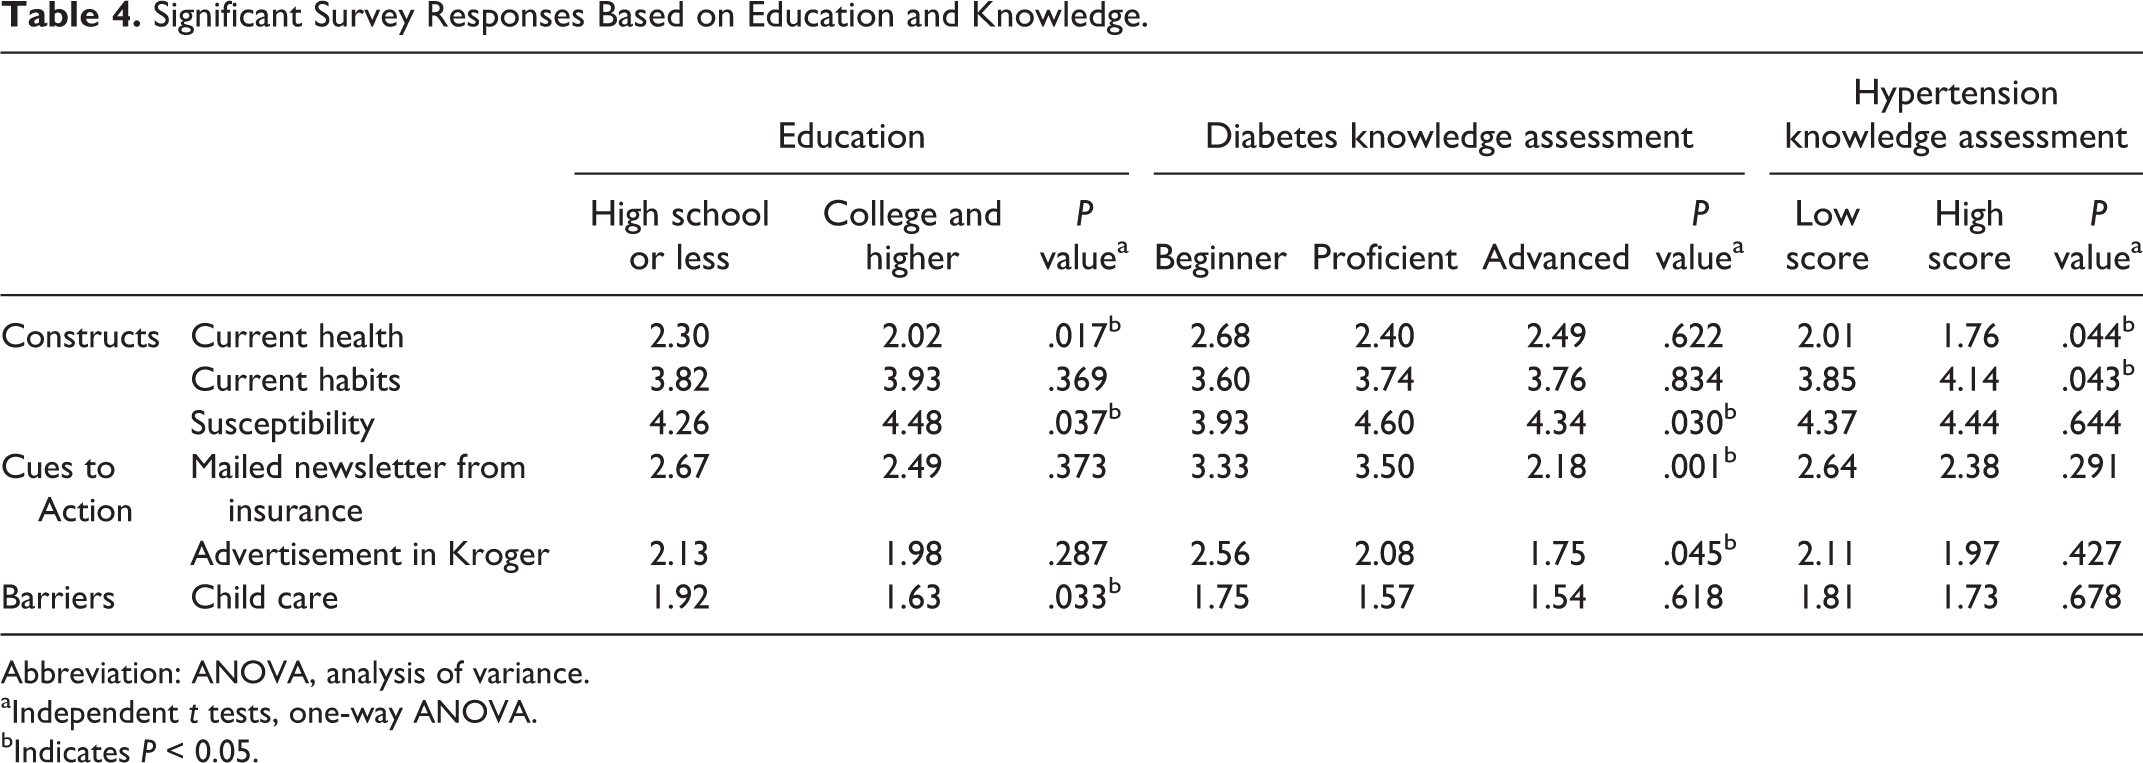
Abbreviation: ANOVA, analysis of variance.
aIndependent t tests, one-way ANOVA.
bIndicates P < 0.05.
Discussion
Engaging patients, especially those with uncontrolled conditions, to participate in disease management programs is a challenge. In this study, the strongest cue to action motivating patients to enroll in the diabetes and hypertension coaching program was the financial benefit of waived or reduced co-payments on diabetes, hypertension, and hyperlipidemia medications. A recent review of the literature supports the concept of using financial incentives as a method for influencing various health-related behaviors such as seeking preventative care and treating certain diseases. 31 For example, patients who received monetary payments for enrolling in a smoking cessation program exhibited higher short-term quit rates. 32 Co-payment reductions as an incentive for enrollment into disease management programs was described in the Asheville Project that significantly improved patient’s clinical and economic outcomes. 7 –9
While financial incentives were important overall, when patients were stratified by race, significant differences were observed in the responses. White patients were more likely to enroll due to the financial incentives than African American patients. Alternatively, African American patients enrolled in this study because they perceived the program would benefit their condition. While this study demonstrated that African American patients understand and value preventative health care, previous studies showed that African American patients were less likely to engage in preventative behaviors such as receiving yearly hemoglobin A1C and cholesterol monitoring and participating in physical activity. 33
In addition to race, differences were observed for other demographic characteristics. For example, to recruit patients with a lower education level, it may be important to portray the complications of untreated conditions, as these patients were less likely to believe they were susceptible to complications. Additionally, in order to recruit younger patients, information received from the patient’s employer could encourage recruitment, whereas older patients may respond more strongly to information provided by the insurance company as they are likely not employed. Since several demographic differences were observed in this study, additional research is needed to determine if demographics predict a patient’s response to cues to action and if different marketing strategies can be employed to specifically target certain patient populations.
One barrier to successful disease management programs is patient's awareness of the programs. It is crucial to increase awareness of available programs, especially for patients with uncontrolled conditions. In this study, patients with uncontrolled conditions indicated they had not enrolled previously because they were not aware the program existed. The reason why uncontrolled patients were unaware of existing programs was inconclusive in this study. Since this study only evaluated current marketing strategies, one possible explanation could be that current marketing tactics were not effectively reaching uncontrolled patients and additional effective cues to action need to be explored. Uncontrolled and controlled patients responded similarly to many of the HBM, TBP, and TRA model constructs; therefore, more research is necessary to determine how to motivate uncontrolled patients to improve their health and participate in disease management programs.
Due to financial constraints, providing financial incentives to patients may not be a viable option for some disease management programs. Therefore, additional methods for recruitment of patients into disease management programs are necessary. Marketing and promoting available services are necessary for recruitment of patients into disease management programs. Marketing strategies are important cues to action that promote change by informing patients of available programs and making them consciously aware of the feelings that will promote change. 28,34 Strategies for marketing services in a community pharmacy setting typically include mass media productions such as television commercials, newspaper and radio advertisements, and fliers. Studies showing the value of mass media advertising have been inconclusive. 35 Patient factors such as feeling better mentally and physically were more important cues to action than marketing strategies such as mass media advertising 35 ; however, in another study, newspaper advertisements were effective cues to action. 34 Using personal selling skills, in which the pharmacist uses their pharmacist–patient relationship to promote services based upon the patient’s specific medical need, is another effective method because it personalizes the marketing for the patient. 36,37
In this study, compared to financial incentives, the other cues to action scored relatively low. The next highest scoring cues to action were promotional newsletters sent by the employer, the insurance company, and recommendations from coworkers or other enrollees in the program. The recommendations to attend the program from outside the pharmacy, such as the employer and insurance were stronger cues to action compared to marketing materials sent from the pharmacy. Since only patients with certain employers were eligible, the coaching programs were not highly marketed at the pharmacy counter. Additionally, some patients who enrolled in the program do not fill prescriptions at Kroger Pharmacy and could not be targeted at the pharmacy. It is possible that the additional support from individuals outside the pharmacy validated the benefits of the program and enhanced patients’ perception of those benefits. Sending patients promotional material from multiple sources outside the pharmacy should be employed to enhance enrollment into pharmacy programs.
Limitations
This study has several limitations. This study is subject to potential self-reporting bias. Because patients completed the survey at their initial coaching appointment and the survey results were not completely anonymous, patients may have responded more favorably to the survey questions in order to please the pharmacist. However, clinical measures were obtained from point of care testing during the appointment or from faxed requests faxed from the physicians; therefore, potential bias was reduced from self-reported clinical measures. Additionally, while the survey was validated by the authors of the study, the length of the survey may have caused survey fatigue.
The survey responses were not compared to a control group in this study; therefore, confounding variables may have been a factor in the differences when the results were stratified. A reasonable control group could have been patients who were eligible for the program but had not yet enrolled. While these patients could be identified, it was not feasible to survey these individuals.
Conclusion
A top factor motivating patients to enroll in a disease management coaching program was the receipt of financial incentives. Significant differences in HBM, TPB, and TRA responses were seen for patients with different demographics. This study exemplifies the importance of considering the patient demographics of the target population prior to developing recruitment strategies.
Footnotes
Authors’ Note
The research was conducted at Kroger Pharmacy.
Declaration of Conflicting Interests
The author(s) declared the following potential conflicts of interest with respect to the research, authorship, and/or publication of this article: Stacey Frede and Jim Kirby are full-time Kroger employees. Heidi Luder is an as needed Kroger employee.
Funding
The author(s) received no financial support for the research, authorship, and/or publication of this article.