
Abstract
After a traumatic brain injury, around 12% of patients require surgical interventions during their index hospitalization due to delayed or progressive intracranial hemorrhage or complications such as elevated intracranial pressure (ICP)1. Compiling data from four harmonized studies with 288 patients that have high-frequency physiological measurements, including ICP, we aimed to determine factors associated with those surgeries and whether longitudinal physiological measurements could be used to predict the need for craniectomy or craniotomy at least 1 h before the surgery occurred. The outcome was the occurrence of the first cranial surgery 6–120 h post-injury with 2:1 matched controls for those without surgery. Covariates included baseline characteristics and dynamic physiological measurements. Univariate associations were assessed, and the area under the receiving operating characteristic curve (AUC) was used to compare various machine learning and multivariable statistical models for the prediction of surgery. It was found that means, medians, and transgressions of both ICP and mean arterial pressure, as well as the linear regression slope of ICP by time in the 6 h prior to surgery, were significantly and independently related to whether a patient had cranial surgery or not. The best-performing model was found using random forests supervised learning algorithm (AUC = 0.75, 95% confidence interval 0.61–0.88). This model may assist clinicians in predicting when they may need to perform an emergent neurosurgical procedure, thus preventing more damage from elevated ICPs.
Background
Traumatic brain injuries (TBIs) affect approximately 5.48 million people worldwide yearly, of which around 12% receive surgeries during the initial hospitalization.1,2 When an intracranial hematoma large enough to cause mass effect is present on the initial CT scan, surgical evacuation is usually performed at admission. Subsequently, cranial surgeries (e.g., craniotomies and decompressive craniectomies) are often used to relieve pressure on the brain that could be causing secondary insults. Timely surgical interventions are critical to mitigate damage from elevated intracranial pressure (ICP). Understanding the physiology of patients leading up to the surgery could be key to swift and effective intervention. High-frequency monitoring can help identify early signs that a patient may require surgery, improving outcomes by allowing for prompt surgical intervention.
In this study, we aimed to determine whether high-frequency physiological data collected between 12 h before surgery to 1 h before surgery are predictors of cranial surgical interventions, therefore, aiding clinicians to take quick action to prevent further damage. We hypothesized that dynamic physiological measurements would be independent predictors and enhance the prediction accuracy of post-admit surgery after adjusting for baseline data at hospital admission, such as injury severity and age.
Methods
Data
The data used in this analysis were drawn from four TBI studies, including both observational studies and clinical trials, conducted between 1989 and 2018. These studies recorded high-frequency physiological data along with information on cranial surgeries. (1) BOOST-II was a Phase II randomized trial in severe TBI patients with neuromonitoring used to look at the advantages of using a tiered brain tissue oxygenation monitoring protocol. 3 (2) EPO Severe TBI was a randomized clinical trial observing the effects of erythropoietin and two hemoglobin transfusion thresholds on neurological recovery. 4 (3) TRACK-TBI is a repository of clinical data, imaging, blood biospecimens, and clinical outcomes. 5 The data from TRACK-TBI were accessed from the Federal Interagency Traumatic Brain Injury Research Informatics System (FITBIR) and collaborating with lead investigators for high-frequency data. 6 (4) The Ben Taub General Hospital Research Database is another repository of observational studies conducted by Baylor College of Medicine in Houston, TX (BTGH-Database). Subjects were deidentified. All subjects had to meet study-specific inclusion criteria, and those included in our analysis had severe TBIs and high-frequency monitoring using neuromonitoring systems.
Data harmonization, cleaning, and features
As the data are an amalgamation of various studies, the variables were not consistently coded or measured on the same scale, necessitating a process of harmonization. This was done using common data elements and by standardizing the high-frequency physiological data, as detailed in Yaseen et al. 7 Baseline variables in the models included demographics and injury severity characteristics. However, some variables, such as diastolic blood pressure, glucose, sodium, and hemoglobin, were excluded from modeling due to a high degree of missing data.
Analysis was limited to the 778 patients who had high-frequency data available for the high-frequency physiological data. High-frequency physiological variables were smoothed using repeated median filtering for extreme values and aligned on a common once-per-minute scale using interpolation up to a maximum of 120 h after injury. The high-frequency features included various summary statistics for ICP, cerebral perfusion pressure (CPP), and mean arterial pressure (MAP; see Table 2). Missing ICP, MAP, and CPP values were imputed when two were present and one was missing, using the formula ICP = MAP – CPP (<1% ICP and 24% CPP values imputed). ICP values of less than −5 were marked as missing as they were likely erroneous. This only affected around 5% of subjects in the time frame assessed. Summary measures were then computed over two different time intervals leading up to the surgery for each subject’s dynamic variables: from 12 to 1 h before the surgery and from 6 to 1 h prior. Features computed included means, medians, standard deviations, slope over time (10 mmHg increase per hour), and the number of transgressions of each patient’s ICP, CPP, and MAP within the two windows. Transgressions were defined as the count of data points (one per minute) with an ICP above 25, a CPP under 60, and a MAP under 80.
Cases and matched controls
Cases were those who had a cranial surgery at least 6 h after injury. For the 23 cases with multiple surgeries during their hospitalization, analysis was restricted to include only the first cranial surgery after 6 h. Of the 778 patients, 172 (22%) had a cranial surgery 6 or more h after injury. The cranial surgery cases were further limited to include only those who had at least 10 ICP data points (not necessarily 10 consecutive min) in the 1–12 h prior to surgery, leaving 96 cases to be used in analysis. All of these surgical interventions were either craniotomies (n = 67, 69.8%) or decompressive craniectomies (n = 29, 30.2%). To reduce confounding factors in analysis, each case was matched with two controls. 8 A consort diagram can be found in Figure 1. Matching was done using nearest neighbor propensity score matching with the MatchIt package in R. 9 To control for baseline injury severity and reduce bias from different study sites, variables used in matching included age, baseline Glasgow Coma Scale (GCS) motor score, baseline Marshall classification of TBI score, 10 surgery on admission, study, and the amount of available post-baseline physiological data around the same time as the surgical patients. This was achieved by matching each case to multiple controls and assessing the controls’ dynamic data points that fell in the post-injury window beginning 12 h prior to the case’s surgery (the earliest time point is 12 h prior to surgery and the latest is 1 h prior to surgery, described below as 12–1 h prior to surgery). Then, the control that had approximately equal data points or more and that best matched the other criteria was selected. This had to be done multiple times to find controls that matched well and had enough dynamic data points. After the first match was found, the process was done once again to match each case to a second control. After matching, the sample size was 288 patients, with 96 cases and 192 controls. No controls were matched to more than one case, so data were independent. Although we used 2:1 matching to obtain the control group to control for covariates, the analyses were conducted assuming the groups were independent. Multivariable models included the matching variables. Standardized mean differences were used to assess comparability of groups before and after matching.
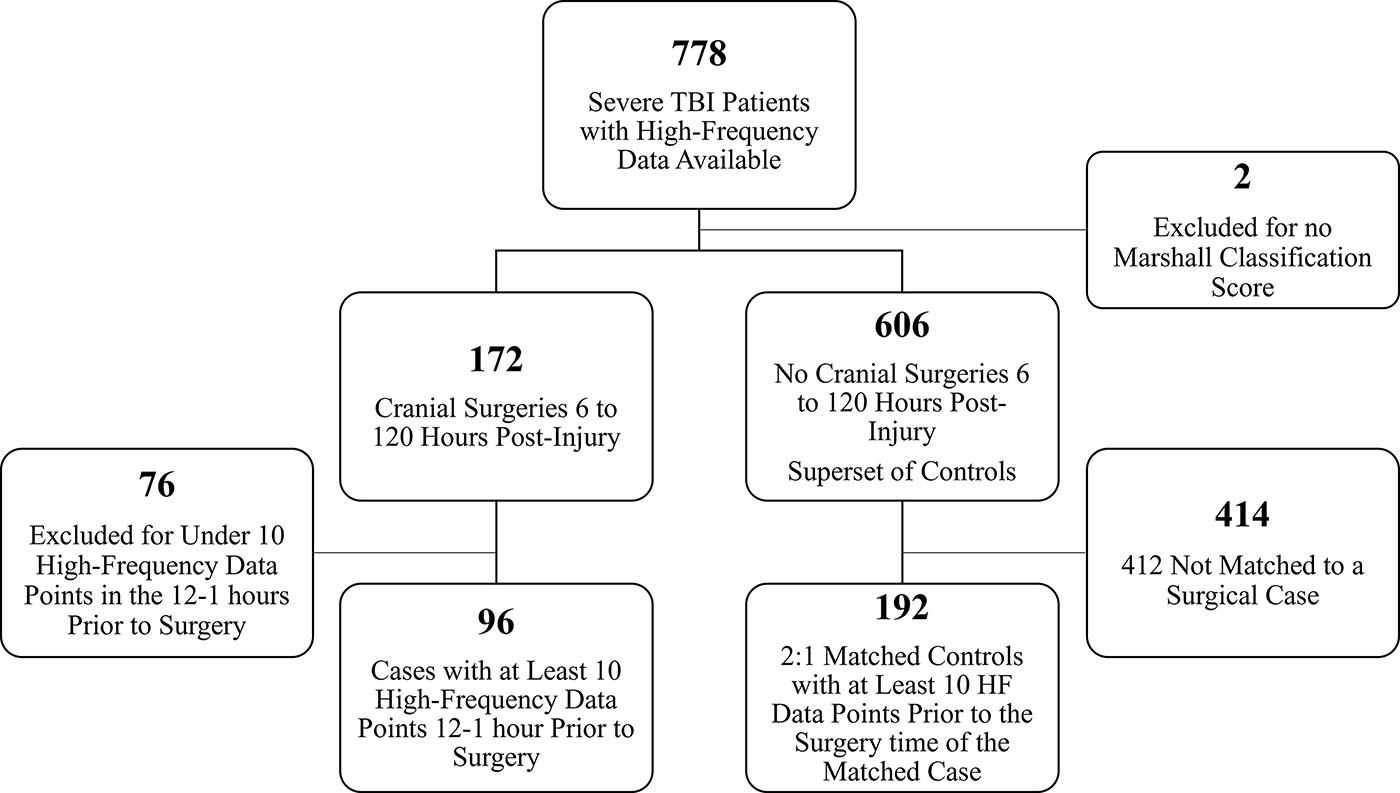
Consort diagram.
Statistical analysis
Univariate analysis was done with the dependent variable being if the subject had cranial surgery post-admission. p Values were calculated using Wilcoxon rank-sum tests and Fisher’s exact tests, as appropriate. Adjusted analyses, such as multiple logistic regression, were performed with variables selected using forward and backward stepwise selection, Hosmer and Lemeshow purposeful selection,11,12 and L-1 (LASSO) shrinkage. Supervised learning methods included logistic regression, L-1 (LASSO) and L-2 (ridge regression) shrinkage methods, linear discriminant analysis (LDA), quadratic discriminant analysis (QDA), random forests, and support vector machines (SVMs). LDA and QDA models were built using the same selected variables found to be the best performing in the logistic regression. Several SVM-kernel functions were compared, including linear, polynomial, and radial-basis, and all models’ parameters were tuned using 10-fold cross-validation. For the ridge regression model, standard errors for the log-odds were estimated using nonparametric bootstrap resampling. Given the presence of multicollinearity among predictors, these bootstrapped standard errors may be inflated.
The reference category for race/ethnicity is set as non-Hispanic, White. A training and testing set with a 70% training and 30% testing split, where matches were kept together, was used to validate and compare the models. Models were compared using the test AUC under the receiver operating characteristic curve [ROC]). Also reported are the test accuracy of the model built on the training set, test sensitivity, and test specificity. The primary software used in this analysis was R Statistical Software (v4.3.1; R Core Team). 13
Ethical consideration
This research included human subjects. In accordance with HIPAA, confidentiality was maintained through the use of deidentified data and was accessible through password-protected access. The UTHealth Houston Committee for the Protection of Human Subjects, Baylor College of Medicine Institutional Review Board, and the Department of Defense Human Research Protection Office reviewed and approved the research to use the deidentified datasets (HSC-SPH-16–0591).
Results
Table 1 contains the summary of the baseline and demographic information of the 700 (96 cases and 604 potential controls) subjects included prior to matching and the 288 (96 cases and 192 matched controls) subjects after matching. Prior to matching, cases were more likely to have a mass lesion, surgery on hospital admission, unilateral response pupil reactivity, subdural hematoma, and lower injury severity score. After matching, there was good balance among baseline values, and the standardized mean differences were all below 0.2.
Demographic and Baseline Injury Severity Characteristics Before and After Matching
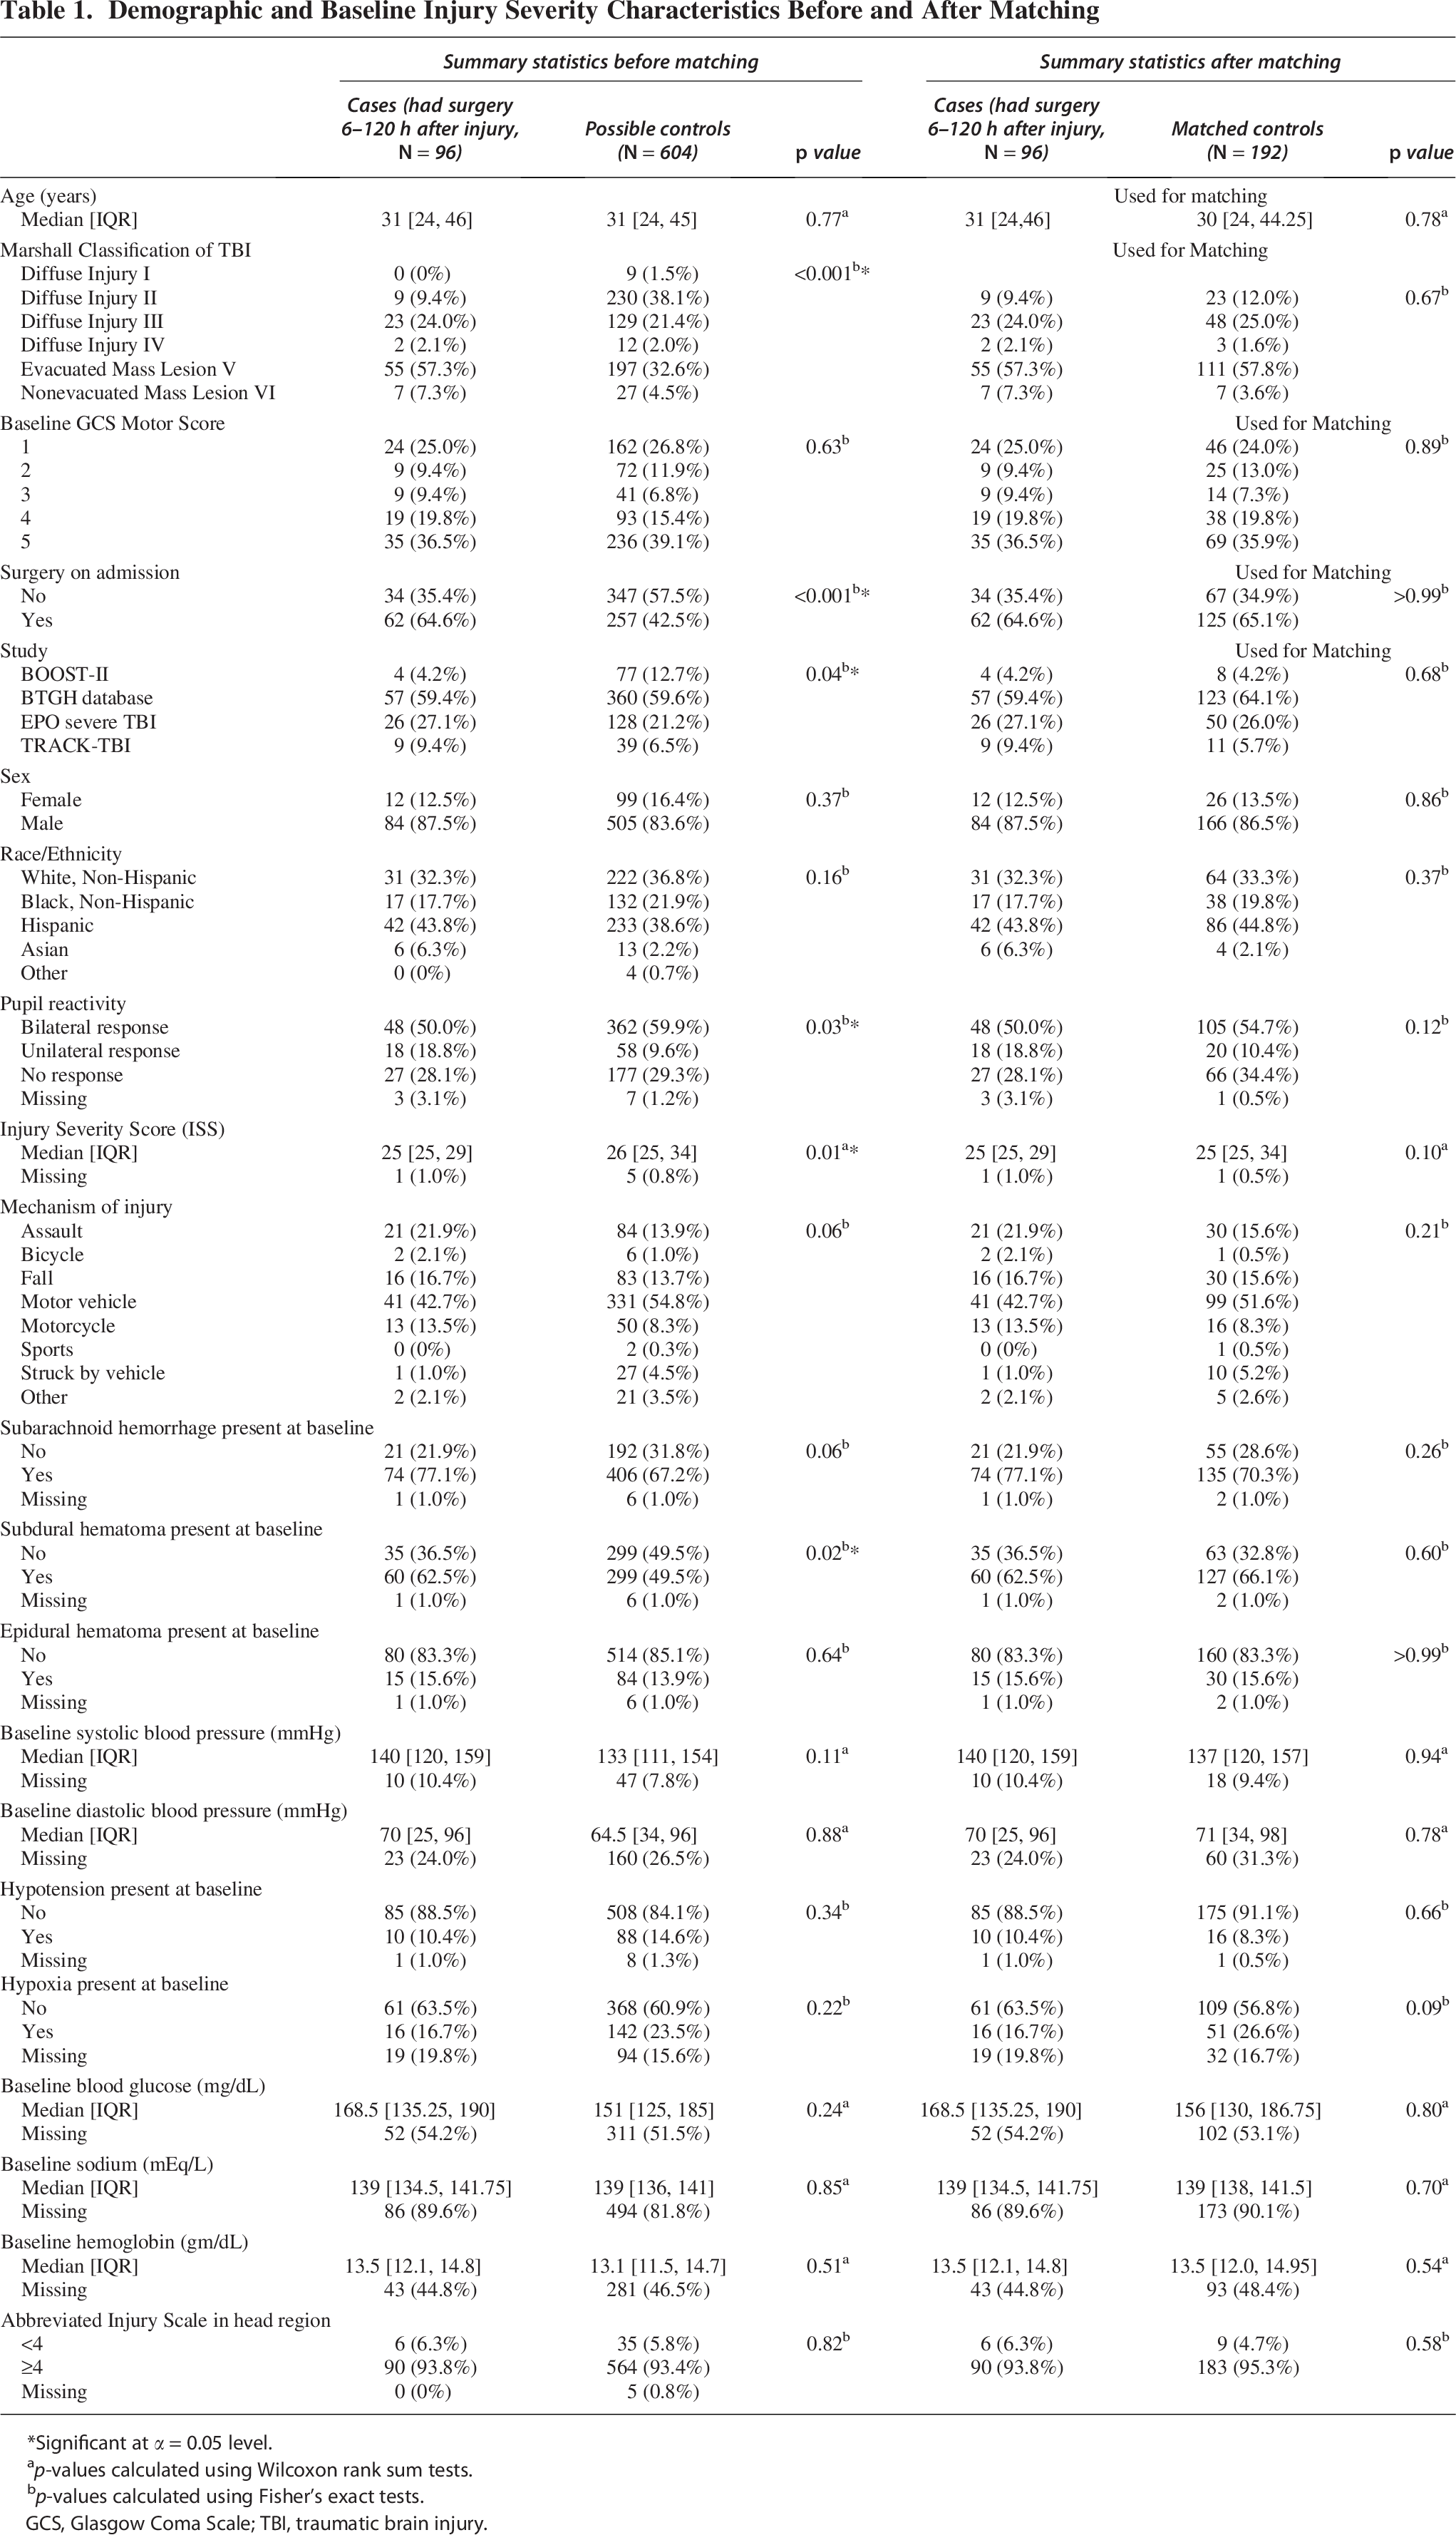
Significant at α = 0.05 level.
p-values calculated using Wilcoxon rank sum tests.
p-values calculated using Fisher’s exact tests.
GCS, Glasgow Coma Scale; TBI, traumatic brain injury.
Univariate Comparison of Physiological Data Between Cases (Had Surgery Between 6 and 120 h After Injury) and Matched Controls
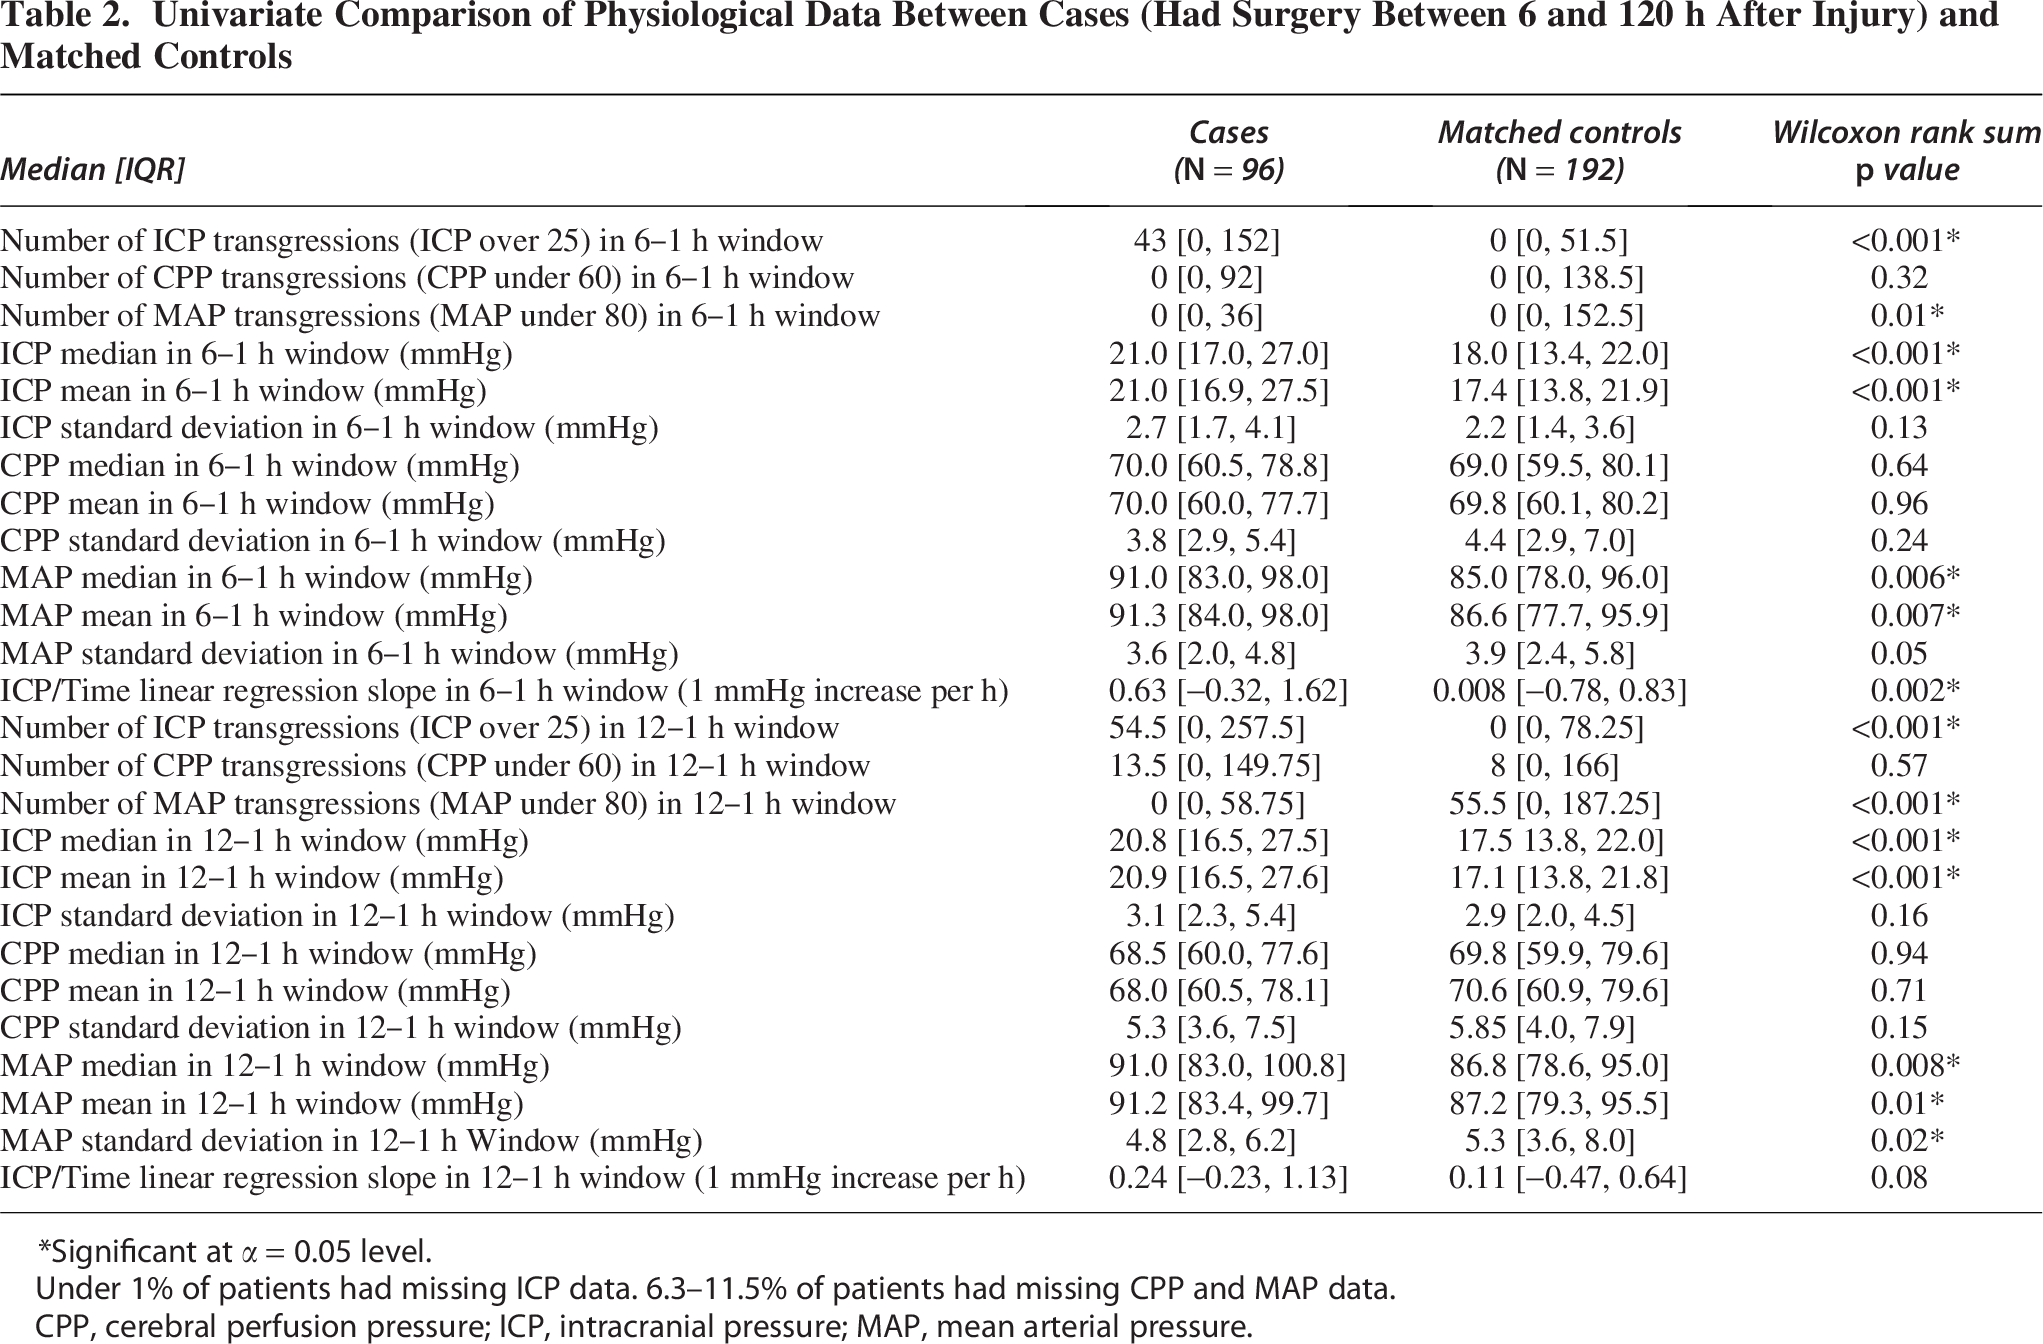
Significant at α = 0.05 level.
Under 1% of patients had missing ICP data. 6.3–11.5% of patients had missing CPP and MAP data.
CPP, cerebral perfusion pressure; ICP, intracranial pressure; MAP, mean arterial pressure.
There were a median of 559.5 (range 31–661, IQR 294–660) one-per-minute smoothed ICP measurements in the 12–1 h before the surgery event and a median of 300 (range 0–301, IQR 226.8–300) measurements in the 6–1 h before the surgery event (Supplementary Fig. S1). Two patients did not have any ICP data in the 6–1 h window. Dynamic variables such as arterial oxygen saturation (SaO2), temperature, and end-tidal carbon dioxide (ETCO2) were excluded as many patients did not have data on them.
Univariate analyses
Many of the physiological transgression summary statistics were significantly different between cases and controls, particularly for ICP and MAP, but not for CPP (Table 2). Significant variables included ICP and MAP transgressions, ICP median and mean, and MAP median and mean, all in both the 6–1 h prior to case surgery window and the 12–1 h windows, MAP standard deviation in the 12–1 h window, and ICP linear regression slope in the 6–1 h window. Those who had surgery 6–120 h after injury had more ICP and fewer MAP transgressions in both windows (6–1 h MAP p = 0.01, other p < 0.001), a higher ICP median and mean in both windows (p < 0.001), a higher MAP median and mean in both windows (median of MAP values in 12–1 h window p = 0.008, mean MAP in 12–1 h window p = 0.01, median MAP in 6–1 h window p = 0.006, mean MAP in 6–1 h window p = 0.007), a higher MAP standard deviation in the 12–1 h window (p = 0.02), and a higher positive slope in the ICP linear regression for the 6–1 h window (p = 0.002).
Multivariable analyses
Among the various variable selection and shrinkage methods, ridge regression had the best test AUC of 0.70 (95% CI: 0.54–0.85). This model also had the second-highest test AUC of the models considered. Details of this model, including odds ratios and bootstrap-estimated log-odds standard errors, can be found in Supplementary Table S1. Table 3 contains test set AUC, accuracy, sensitivity, and specificity of each model built. Including the machine learning algorithms, the best test set AUC was found using random forest (AUC = 0.75, 95% CI: 0.61–0.88). The ROC for the model is shown in Figure 2. The variable importance plot is shown in Figure 3, with the use of several other physiological features as being important for prediction of surgery. When refitting the random forest model without the physiological variables, the AUC dropped to 0.56.
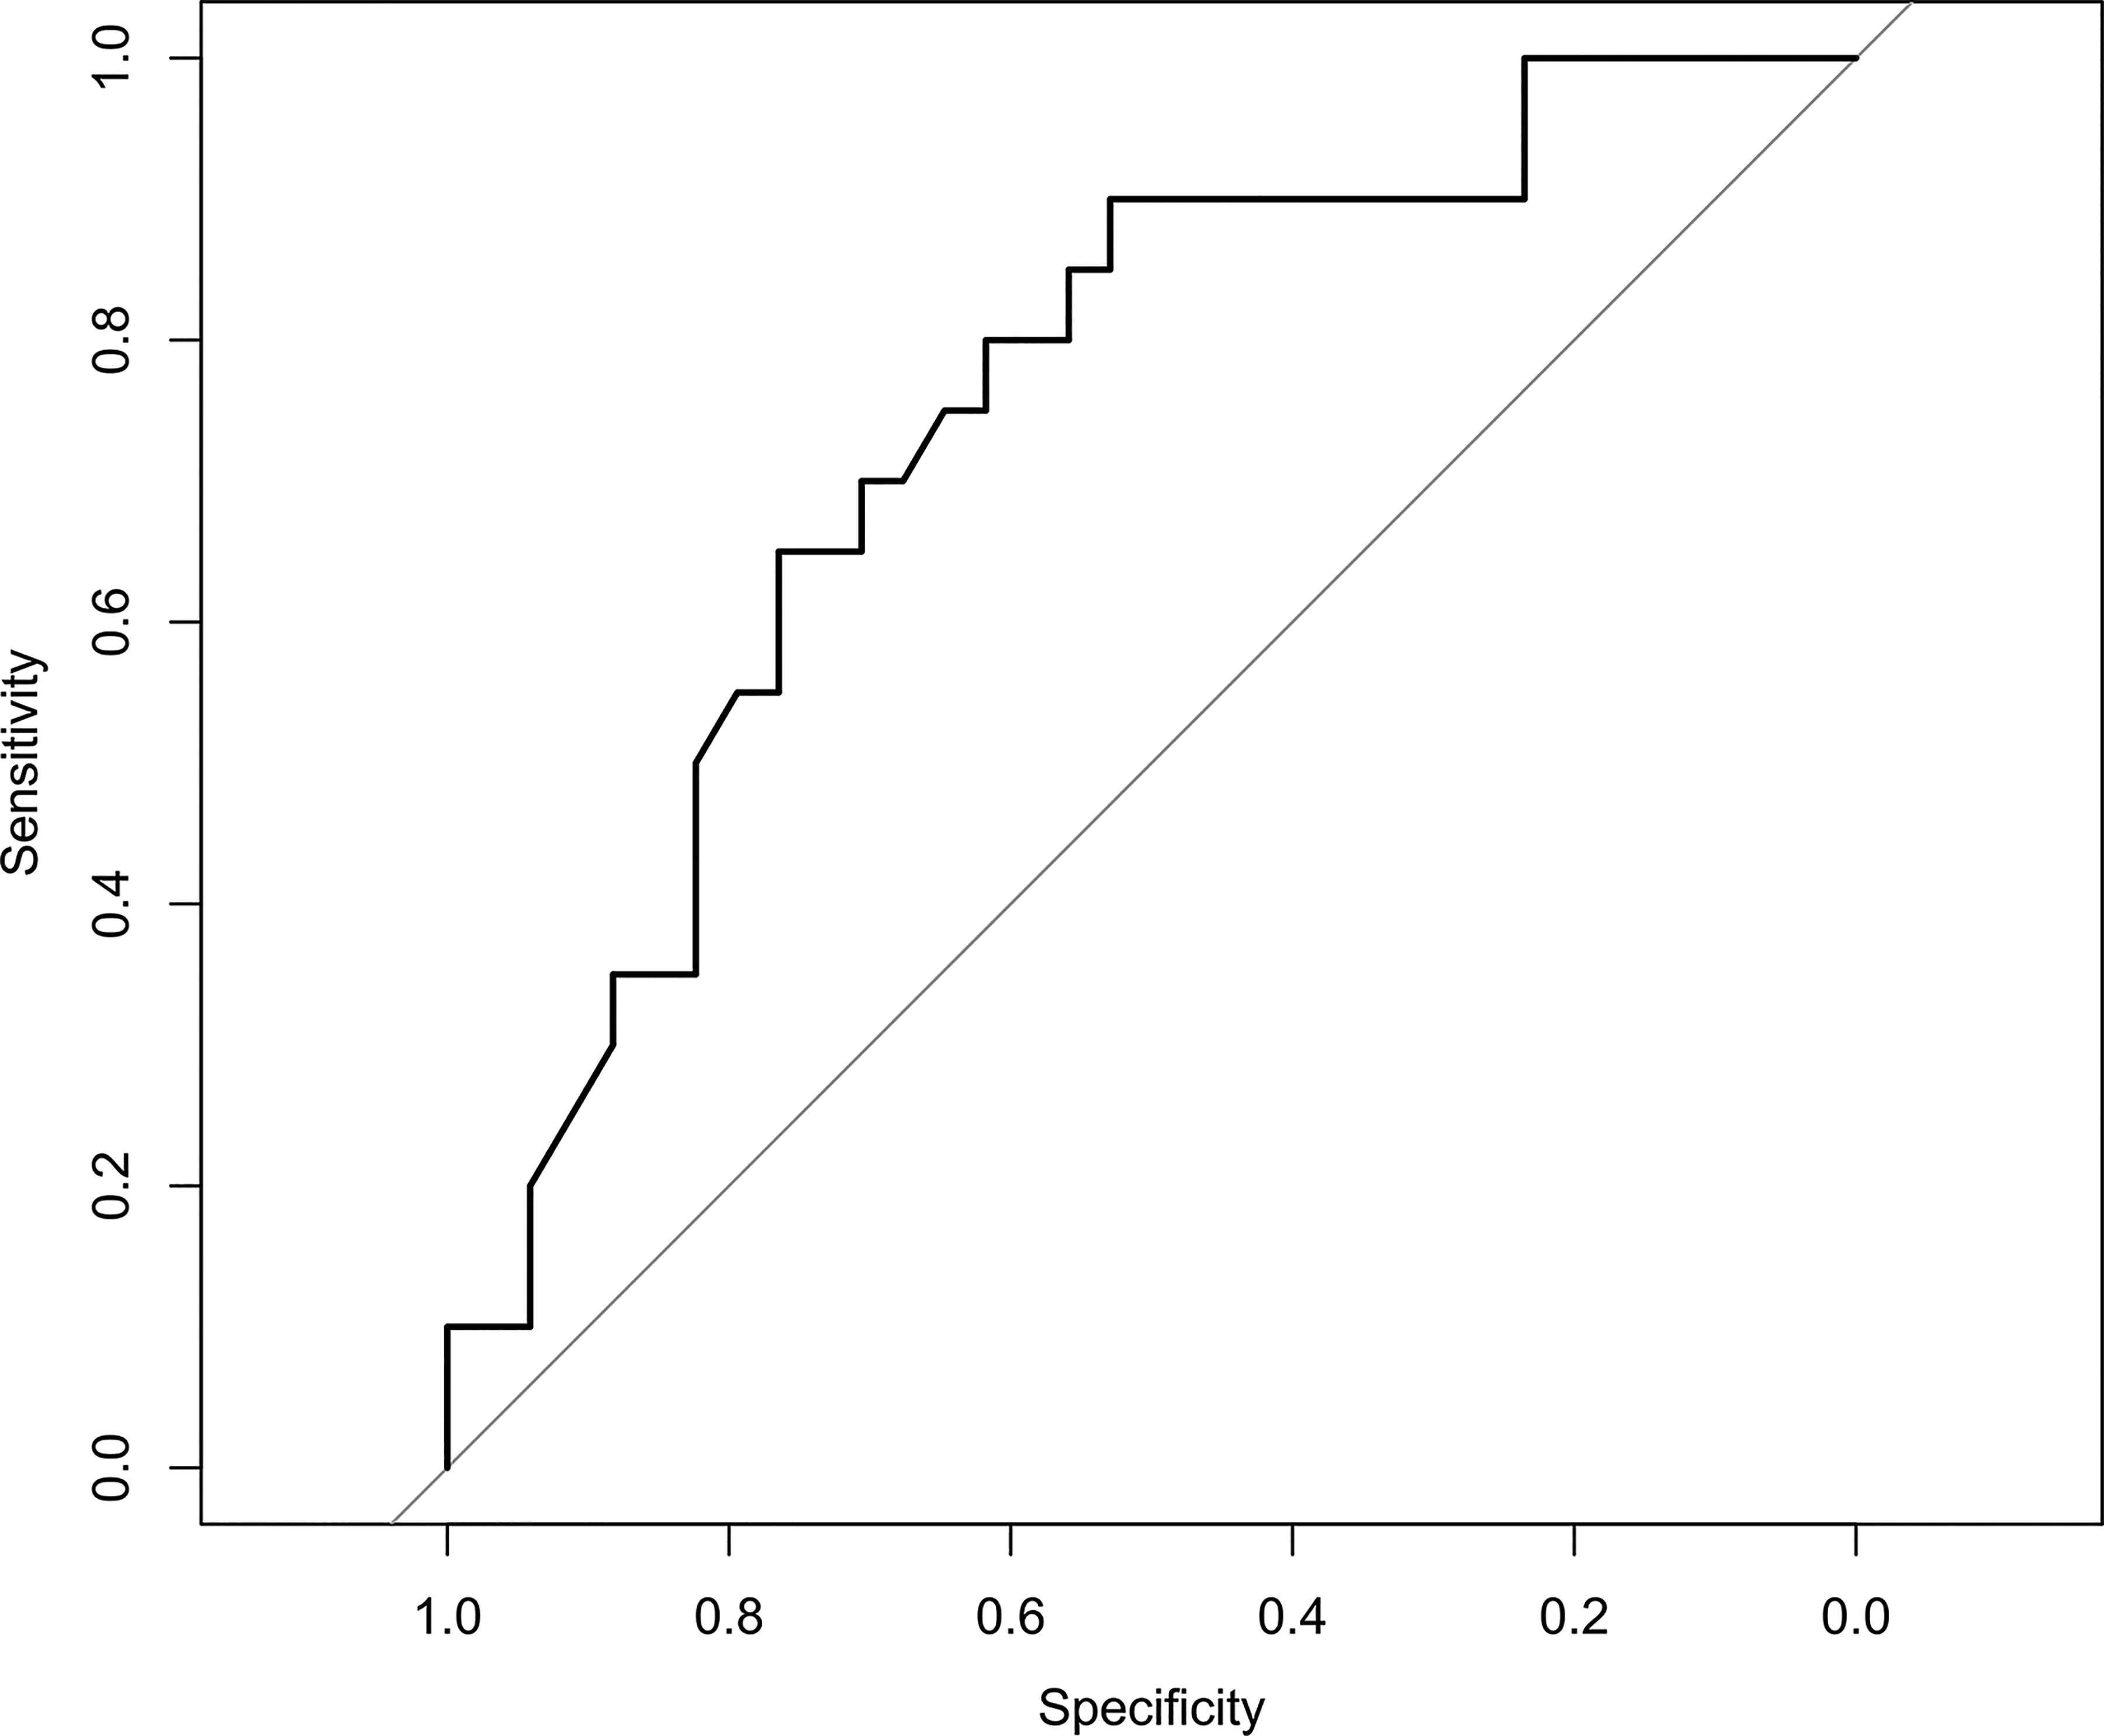
Test set receiver operating characteristic curve for Random Forest Algorithm.
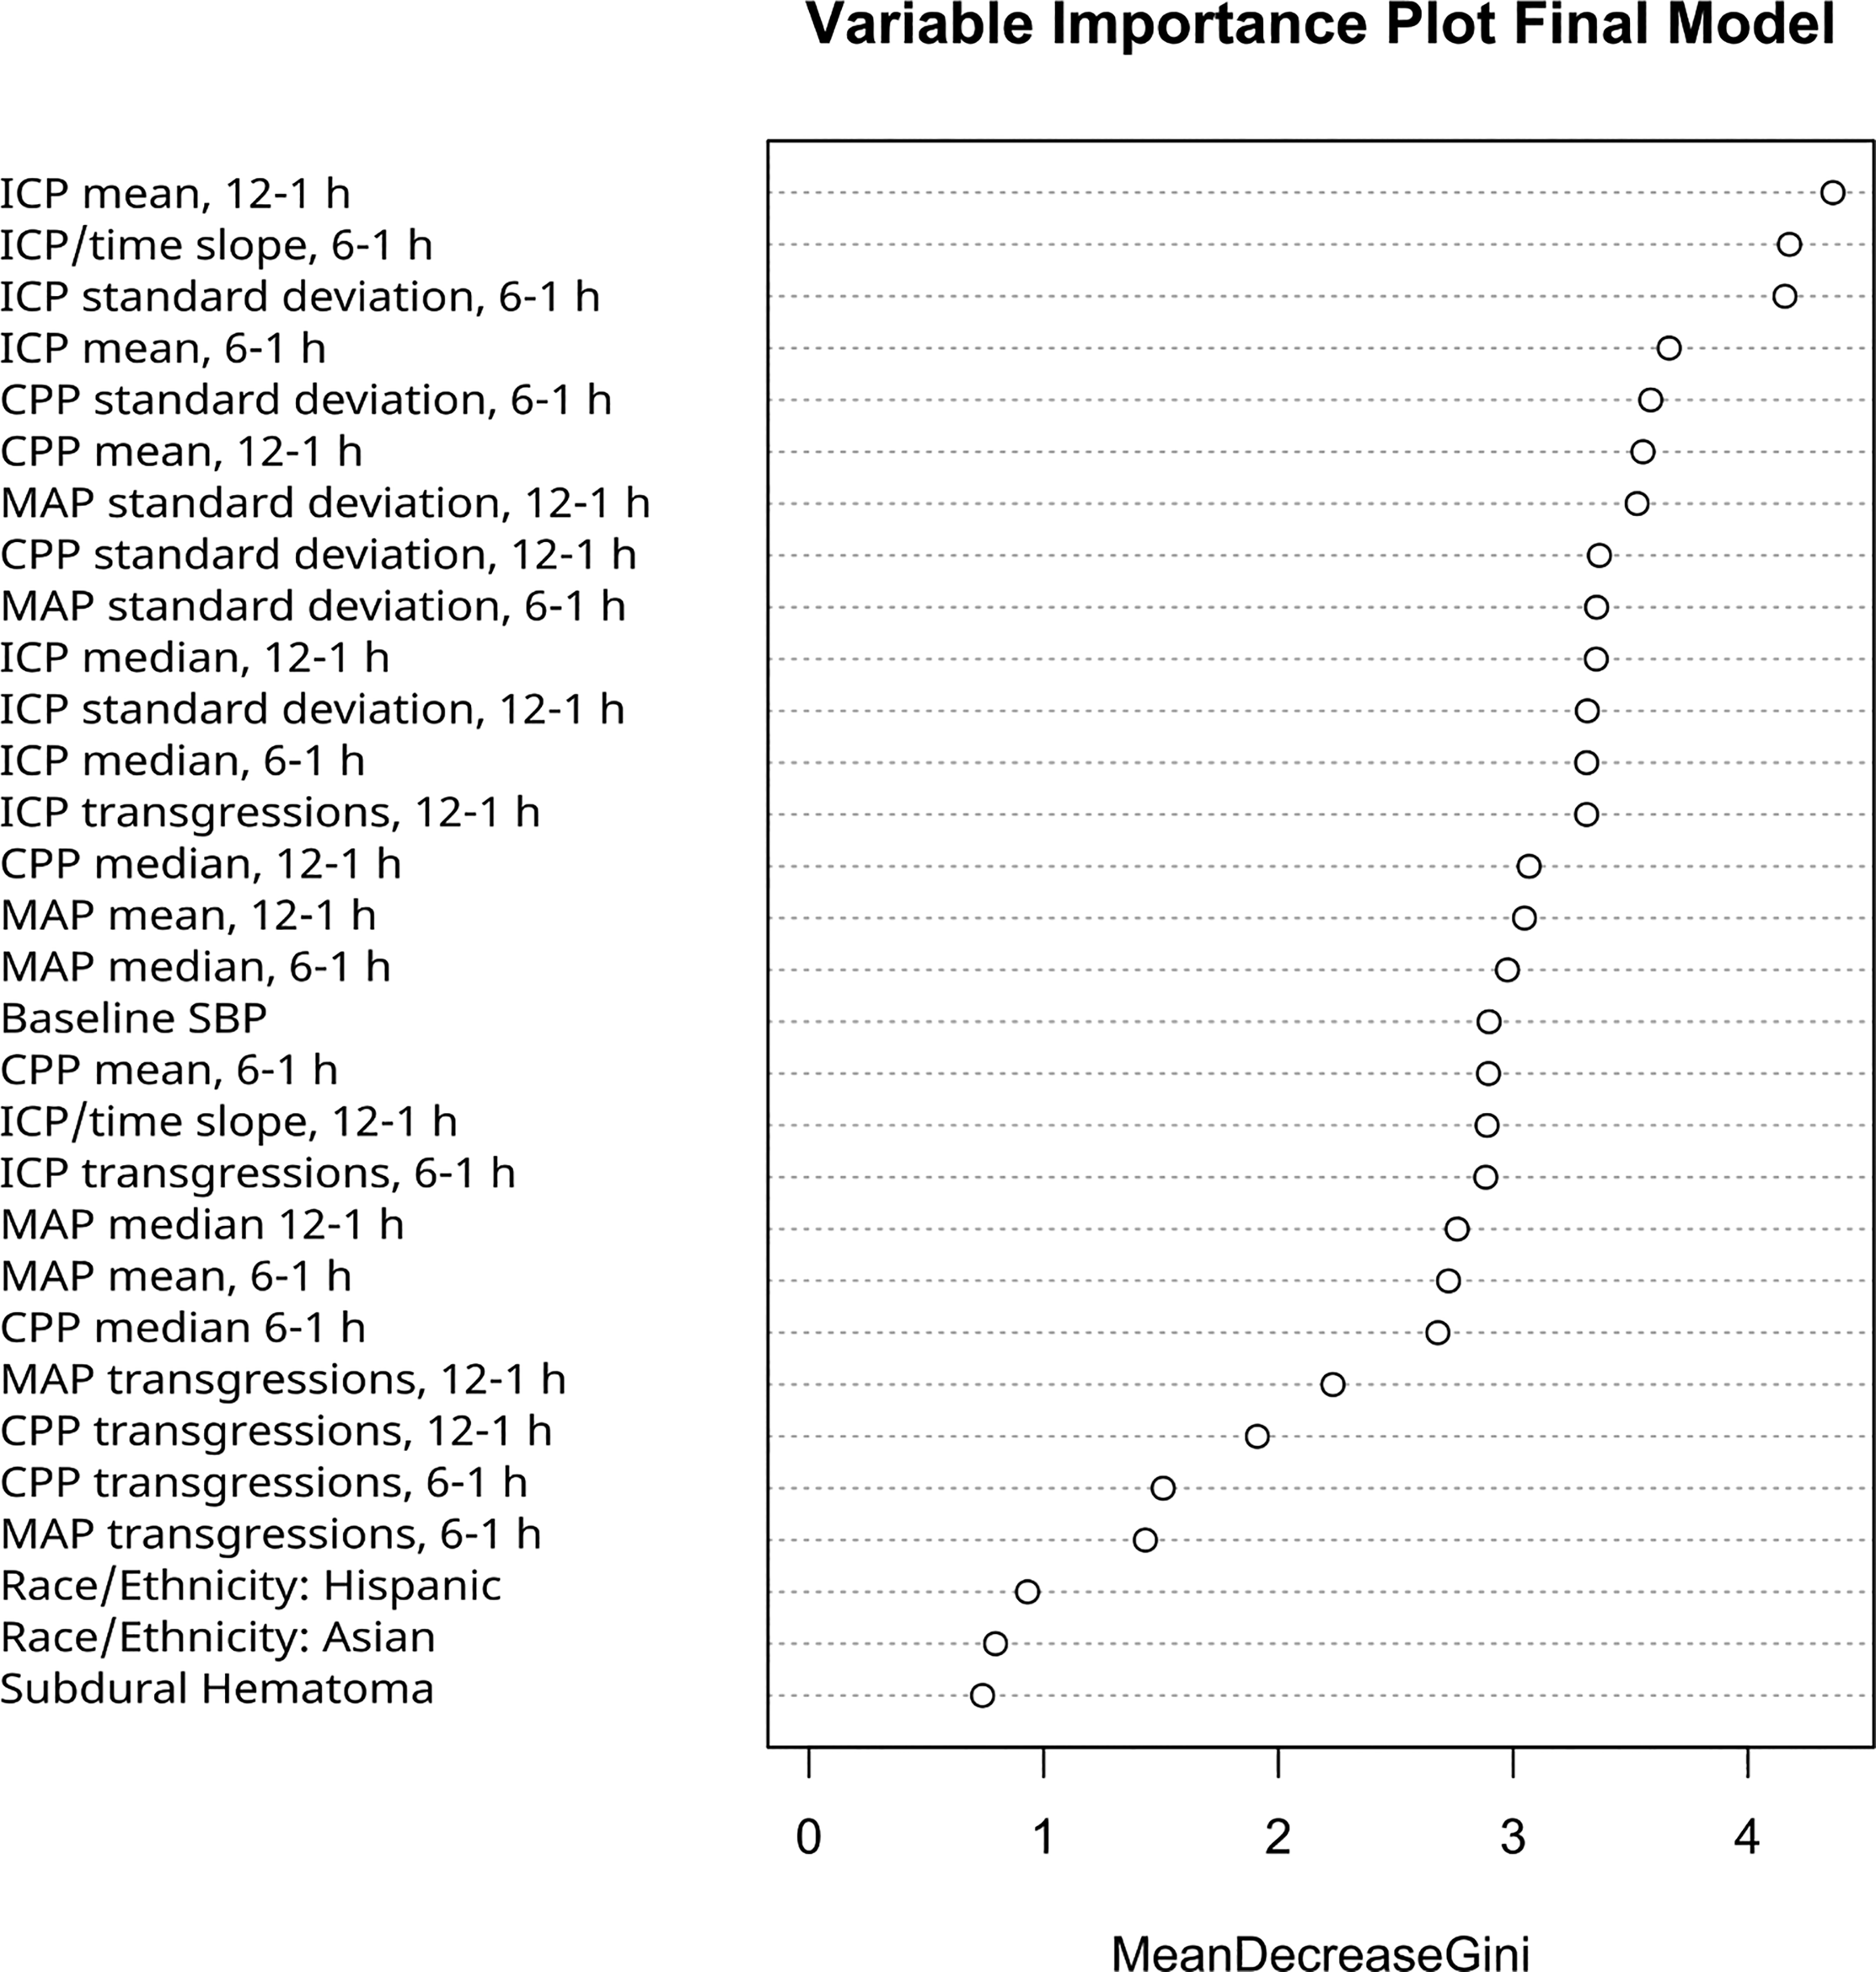
Variable importance plot built on the training set.
Model Comparison
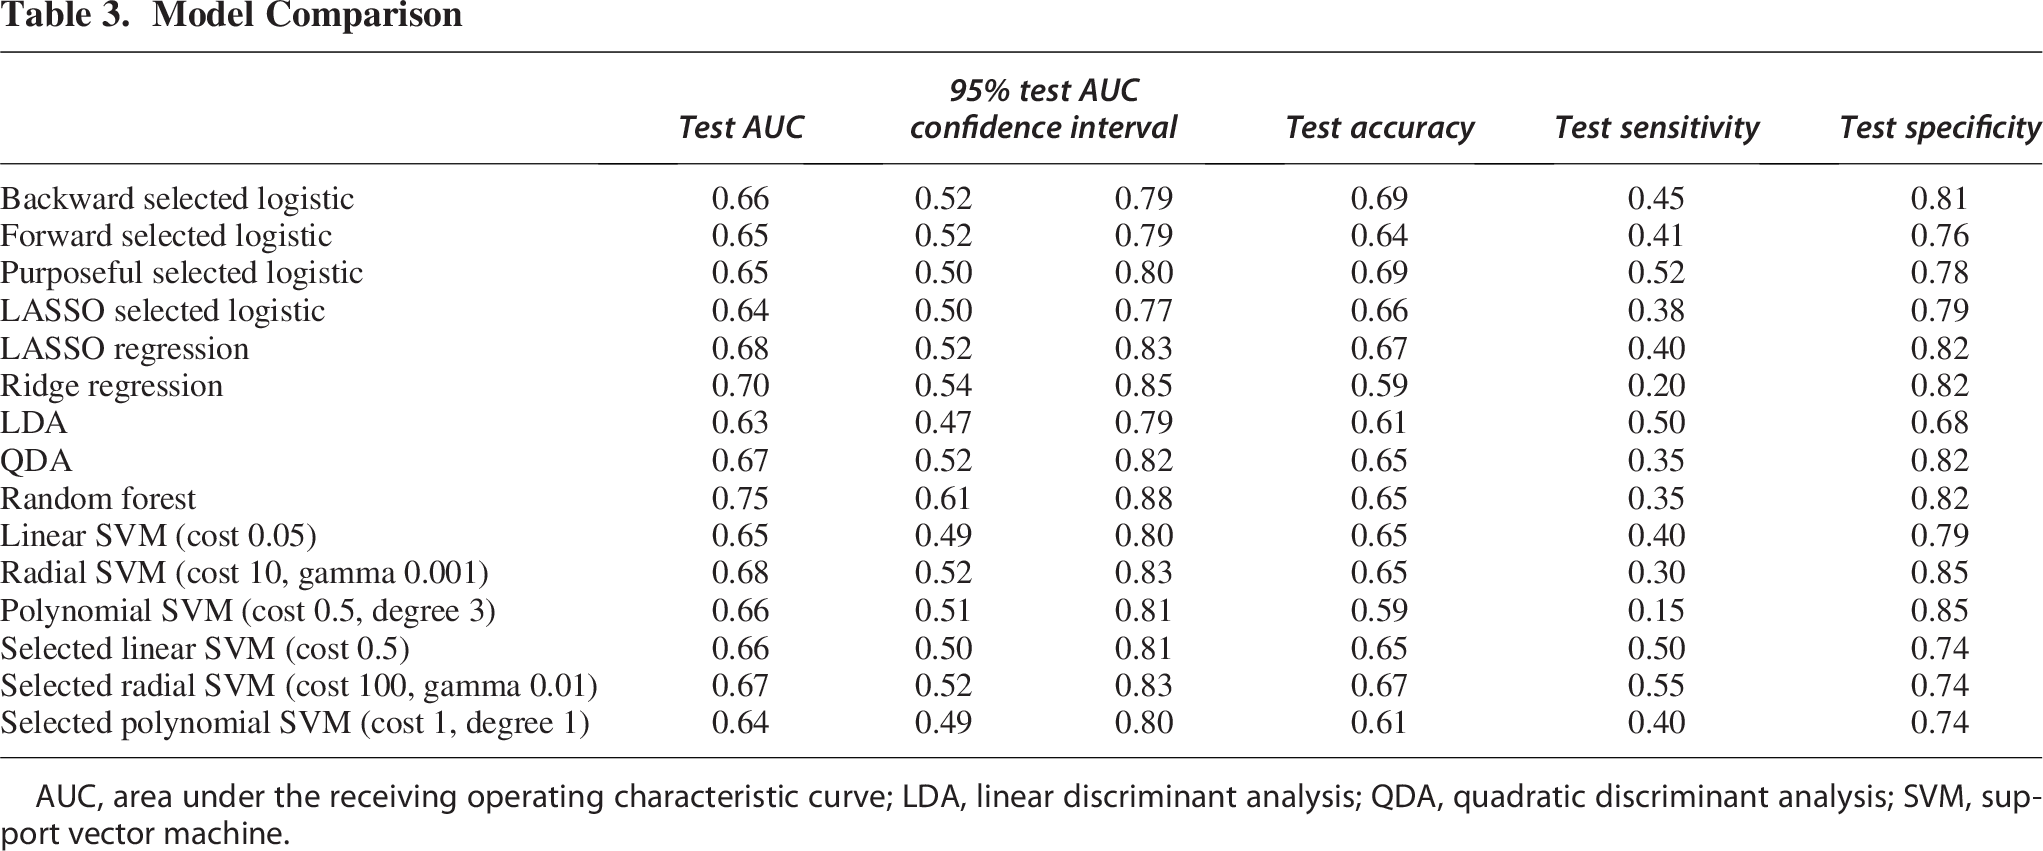
AUC, area under the receiving operating characteristic curve; LDA, linear discriminant analysis; QDA, quadratic discriminant analysis; SVM, support vector machine.
Discussion
Key findings
This analysis revealed that dynamic variables, especially concerning ICP and MAP, are significantly related to and could aid in the prediction of whether a patient had surgery post-admission. The most predictive model was a random forest. Some of the most important variables from this model were found to be the slope of ICP by time in the 6–1 h window, ICP mean and median in the 12–1 h window, and CPP, ICP, and MAP standard deviation in the 6–1 h window (Fig. 3). The machine learning model that incorporates the high-frequency monitoring of ICP and MAP can be used to provide valuable insights for clinicians into whether a patient will require surgery within the next 12 h. The random forest model is too complex to fully describe in article, but the trained algorithm (as an R file) can be obtained by contacting the corresponding author. Incorporating the model into a clinical workflow may be used to monitor patients based on whether the probability of surgery is high at a specific time point.
Other studies have also predicted the need for surgical intervention using machine learning techniques but did not consider the physiological measurements. One such study analyzed moderate to severe TBI patients, limited to the initial 24 h post-admission, and found that the CatBoost technique with initial low GCS, the regression of pupillary abnormality after osmotherapy, a high blood pressure and a low heart rate had an AUC of 0.81. 14 One major advantage they had was a large sample size, with 2159 moderate to severe injury patients compared with our 288 severe injury patients. A key limitation they have is that they only looked at surgeries within the first 24 h after admission. This could miss important decompensations that happened later. In our full dataset, prior to exclusions and matching, the average time after injury of the first cranial surgery, precluding any surgeries in the first 6 h after injury, was 27 h, beyond the window of events they examined. Our model has the advantage of being more generalizable since we looked at the first 5 days. The inclusion of physiological data improved the prediction accuracy of the models. In a separate small study of 36 severe TBI patients, machine learning methods were used to predict ICP crises, defined as ICP >22 mmHg for at least 75% of the data within a 5-min interval. The ICP data preceding the ICP crises were with 10- and 20-min lead-time intervals, and they estimated an AUC 0.86–0.88. 15 Our current study used the clinical outcome of surgery rather than a period of elevated ICP.
Limitations
While this analysis contributes valuable insights, it is not without limitations. The sample size was relatively small, with only 288 matched cases and controls, and 31.25% of patients had some amount of missing data, leading them to be excluded from the final model. Relatively small sample sizes are a limitation for many studies of severe TBI, and thus, we took the approach of conducting this study within a harmonized and integrated data set from four studies. Many factors, including five baseline and three dynamic measurements, had to be excluded from the analysis due to a lack of data. Some variables, such as glucose, were significantly related to post-admission surgery, but not included in multivariable models due to a high amount of missingness, as the values were not consistently collected as part of the included studies. Another limitation was the exclusion of surgeries that occurred after the 120-h cutoff of the high-frequency monitoring. This was done to align with the time period of availability of high-frequency monitoring data but may lead to missed associations. To keep data independent, we only considered the first surgery that occurred at least 6 h after injury. This could have introduced potential selection bias due to omission of subsequent surgeries. Since many patients receive treatments that can affect ICP prior to the decision to send them for surgery, it would be beneficial to include such treatments in the analysis. Although high-frequency data were incorporated, features were limited to means, medians, standard deviations, slope over time, and the number of transgressions. More advanced signal modalities, such as ICP pulse waveform morphology, RAP index, and slow-wave content, were not included and may have improved model performance. 16 These represent an important area for future investigation. A future study could be performed to address these limitations, and the final model could be improved upon to increase accuracy. Using more complex trajectory clustering would also likely benefit the model. The addition of other longitudinal variables, such as GCS and pupillary assessments, could provide complementary data to physiological data. Finally, the clinical impact of incorporating a prediction model or algorithm should be further explored. For example, a clinical trial could be conducted to examine whether the use of a model results in better clinical outcomes compared with those not using the strategy.
Conclusion
The need for post-admission surgical intervention is a complex issue, with limited studies focused on predicting such events. High-frequency monitoring variables have been identified as independent predictors associated with the likelihood of surgery. This type of monitoring shows promise in helping clinicians predict whether a patient will require surgery within the next 12 h. Trials should be conducted to assess the clinical impact of early indication of the need for surgery.
Transparency, Rigor, and Reproducibility Statement
Data sources for this work include a trial deposited and publicly available in FITBIR (EPO Severe TBI/EPO) and databases that are not deposited in FITBIR (BTGH-Database). Data deposited in FITBIR can be requested and then accessed through the FITBIR website at https://fitbir.nih.gov/. The EPO Severe TBI trial was registered at clinicaltrials.gov (NCT00313716).
Code used to conduct data processing and merging will be made available upon reasonable request by contacting the corresponding author.
Authors’ Contributions
S.H.: Methodology, formal analysis, data curation, and writing—original draft. C.R.: Conceptualization, writing—review and editing, project administration, and funding acquisition. J.C.: Data curation and writing—review and editing. A.Y.: Data curation and writing—review and editing. R.D.-A.: Resources, writing—review and editing, and supervision. N.R.T.: Writing—review and editing. J.C.N.: Writing—review and editing. S.M.D.: Writing—review and editing. J.-M.Y.: Conceptualization, methodology, formal analysis, data curation, writing—original draft, review and editing, supervision, project administration, and funding acquisition.
Footnotes
Acknowledgment
The authors would like to acknowledge the patients who volunteered for the studies to advance TBI research.
Author Disclosure Statement
No competing financial interests exist.
Funding Information
This study was supported by Department of Defense United States Army Medical Research Acquisition Activity (grant # W81XWH2010770).
Supplemental Material
References
Supplementary Material
Please find the following supplemental material available below.
For Open Access articles published under a Creative Commons License, all supplemental material carries the same license as the article it is associated with.
For non-Open Access articles published, all supplemental material carries a non-exclusive license, and permission requests for re-use of supplemental material or any part of supplemental material shall be sent directly to the copyright owner as specified in the copyright notice associated with the article.