
Abstract
Traumatic brain injury (TBI) represents a significant global health challenge, but a systematic, severity-stratified analysis of its epidemiology and risk factors is lacking. Using data from the Global Burden of Disease (GBD) 2021 study, this study compares the burden of mild TBI (mTBI) and moderate-to-severe TBI (msTBI) from 1990 to 2021. We analyzed incidence, prevalence, and years lived with disability (YLDs) for TBI across 204 countries and territories and by sociodemographic index (SDI) quintiles. Analysis included the characterization of age and sex distributions, assessment of temporal trends, and evaluation of risk factor attributions for both mTBI and msTBI. The results revealed that while the global age-standardized incidence rate (ASIR) of TBI declined, low-SDI regions experienced rising prevalence and YLD rates despite falling incidence. The ASIR of mTBI decreased significantly (average annual percentage change [AAPC]: −0.587; 95% confidence interval [CI]: −1.211–0.059), whereas the ASIR of msTBI showed no statistically significant decline (AAPC: −0.483; 95% CI: −1.235–0.275). The absolute number of mTBI cases peaked among young and elderly males, while the ASIR of msTBI increased with age in both sexes but remained consistently higher in males. Falls and road injuries remained the leading causes; however, the absolute number of msTBI cases due to these causes continued to rise. Notably, violence-related factors—including conflict and terrorism as well as police conflict and executions—were among the most rapidly increasing risk factors for both TBI subtypes. In conclusion, the global TBI burden is characterized by a stagnant crisis of msTBI, underscoring an urgent need for severity-specific prevention strategies that target high-risk mechanisms and populations to mitigate the devastating impact of msTBI worldwide.
Introduction
Traumatic brain injury (TBI) represents a critical global public health challenge, often resulting from external mechanical forces and leading to temporary or permanent neurological impairment and even death.1–3 Given its largely preventable nature, a systematic assessment of the TBI burden and its underlying risk factors is essential for developing effective prevention strategies.
Clinically, TBI is stratified by severity into mild TBI (mTBI), defined by a Glasgow Coma Scale (GCS) score of 13–15, and moderate-to-severe TBI (msTBI), corresponding to a GCS score of 3–12. 4 mTBI constitutes >90% of all TBI cases,2,5–7 whereas msTBI is associated with a mortality rate of 30–40%.1,8 Patients with mTBI predominantly experience symptoms such as dizziness, headache, fatigue, and weakness. In contrast, survivors of msTBI often face a more substantial burden of physical, cognitive, emotional, and psychiatric impairments, as well as disturbances in consciousness.1,2,4,9 These divergent clinical profiles underscore the necessity for tailored public health approaches. However, the current epidemiological studies often lack a systematic comparison of the burden and risk factors between mTBI and msTBI.
Substantial efforts, exemplified by large-scale collaborative studies such as CENTER-TBI, TRACK-TBI, and the InTBIR initiative,10–12 have been made to reduce the disease burden of TBI. These programs have generated valuable insights for TBI prevention and treatment through coordinated research primarily conducted in high-income countries. 13 Nevertheless, significant disparities in health care infrastructure and prevention capacity persist between HICs and low- and middle-income countries, limiting the generalizability of these findings.2,13
The Global Burden of Disease (GBD) study provides a powerful platform to address this gap. 14 Recent studies utilizing GBD data have elucidated the epidemiological trends and attributable risk factors of TBI, along with the projections of its future burden.9,13,15–19 However, there remains a lack of research specifically comparing the epidemiological trends and attributable risk factors between mTBI and msTBI. To address this knowledge gap, we utilized data from the GBD 2021 study to quantify the global burden of TBI by estimating its incidence, prevalence, and years lived with disability (YLDs), both as crude numbers and age-standardized rates (ASRs). Our objectives were to analyze their temporal trends and distribution patterns by sex and age and to evaluate their respective attributable risk factors across different geographic regions and over time. We anticipate that these findings will inform more targeted prevention strategies and help address critical disparities in TBI care systems worldwide.
Methods
Data sources and study design
This analysis utilized data from the GBD database for the period from 1990 to 2021. The GBD database employs comprehensive epidemiological data and standardized methodologies to analyze health loss from 371 diseases and injuries and 88 risk factors across 204 countries and territories, enabling the systematic assessment of global health trends. Data for the GBD 2021 study were extracted using the GBD Results Tool and the Global Health Data Exchange platform. A standardized approach was adopted to integrate data from multiple sources—including population-based registries, epidemiological surveys, and the published literature—which were systematically validated and harmonized to ensure consistency. 14
Case definition and classification
TBI was defined according to the International Classification of Diseases, Tenth Revision (ICD-10) criteria. 14 mTBI (ICD-10 codes S06.0, S09.90–S09.92) represents cases with transient neurological dysfunction, such as concussion or unspecified head injury without structural brain damage. msTBI (S06.1–S06.9) represents cases with intracranial hemorrhage, contusion, laceration, or diffuse brain injury indicating structural damage.
Burden description
The burden of TBI was assessed using three primary metrics: incidence, prevalence, and YLDs. To enable valid comparisons across populations with different demographic structures, we reported both crude numbers and ASRs. ASRs were calculated by applying age-specific rates to the GBD standard population structure.
Statistical analysis
For all burden estimates, 95% uncertainty intervals (UIs) were computed using the GBD 2021 data. These intervals were generated through a Bayesian hierarchical model that accounts for uncertainty from multiple sources, including data variability, parameter estimation, and model specification. The posterior distribution was constructed using 1000 iterations of Monte Carlo simulation, with the 95% UI defined by the 2.5th and 97.5th percentiles of this distribution. An association was considered statistically significant if the 95% UI excluded zero.15,16,18,19
To evaluate the influence of sociodemographic factors on the incidence and burden of TBI, we performed Spearman’s rank correlation analysis to assess the relationship between TBI metrics and the sociodemographic index (SDI). The SDI serves as a composite indicator of regional development levels, incorporating per capita income, average years of education, and total fertility rate. The index ranges from 0 to 1, with higher values indicating greater socioeconomic development.15,16,18,19
This study utilized joinpoint regression analysis to evaluate the temporal trends in the ASR of mTBI and msTBI between 1990 and 2021. The analysis identified significant inflection points in the long-term trends, dividing the study period into distinct segments. For each segment, the annual percentage change (APC) was calculated to determine the direction and magnitude of the trend. The overall average annual percentage change (AAPC) was also computed, along with the corresponding 95% confidence intervals (CIs) for both APC and AAPC, to assess the statistical significance of the observed trends. 15
All statistical analyses were conducted using R software (version 4.5.1). Joinpoint regression analysis was performed with the Joinpoint Regression Program (version 4.9.1.0, released in April 2020 by the National Cancer Institute). A two-sided p value of <0.05 was considered statistically significant.
Ethics statement
This study was based on publicly available, aggregated summary data from the GBD study. Therefore, there was no patient involvement in the development of the research question, the selection of outcome measures, or the design and implementation of the study. The Institutional Review Board at the University of Washington exempted the study from requiring informed consent for the use of GBD data. As the data are publicly accessible and completely anonymized, no additional ethical approval was required for this analysis. 20
Results
Global trends in TBI incidence, prevalence, and YLDs from 1990 to 2021
Globally, the age-standardized incidence, prevalence, and YLDs rates (age-standardized incidence rate [ASIR], ASPR, ASYR) of TBI exhibited an overall declining trend from 1990 to 2021. However, this trend masked notable disparities across regions of distinct socioeconomic development.
High-middle and high-SDI quintiles demonstrated notable declines in the three metrics of TBI (Table 1). In contrast, although the ASIR in low-SDI quintiles decreased from 254.295 per 100,000 in 1990 to 216.884 per 100,000 in 2021, the ASPR and ASYR exhibited increasing trends (Table 1).
Incidence, Prevalence, and YLDs for TBI, with Percentage Changes in ASRs per 100,000 Population by SDI Level, 1990 to 2021
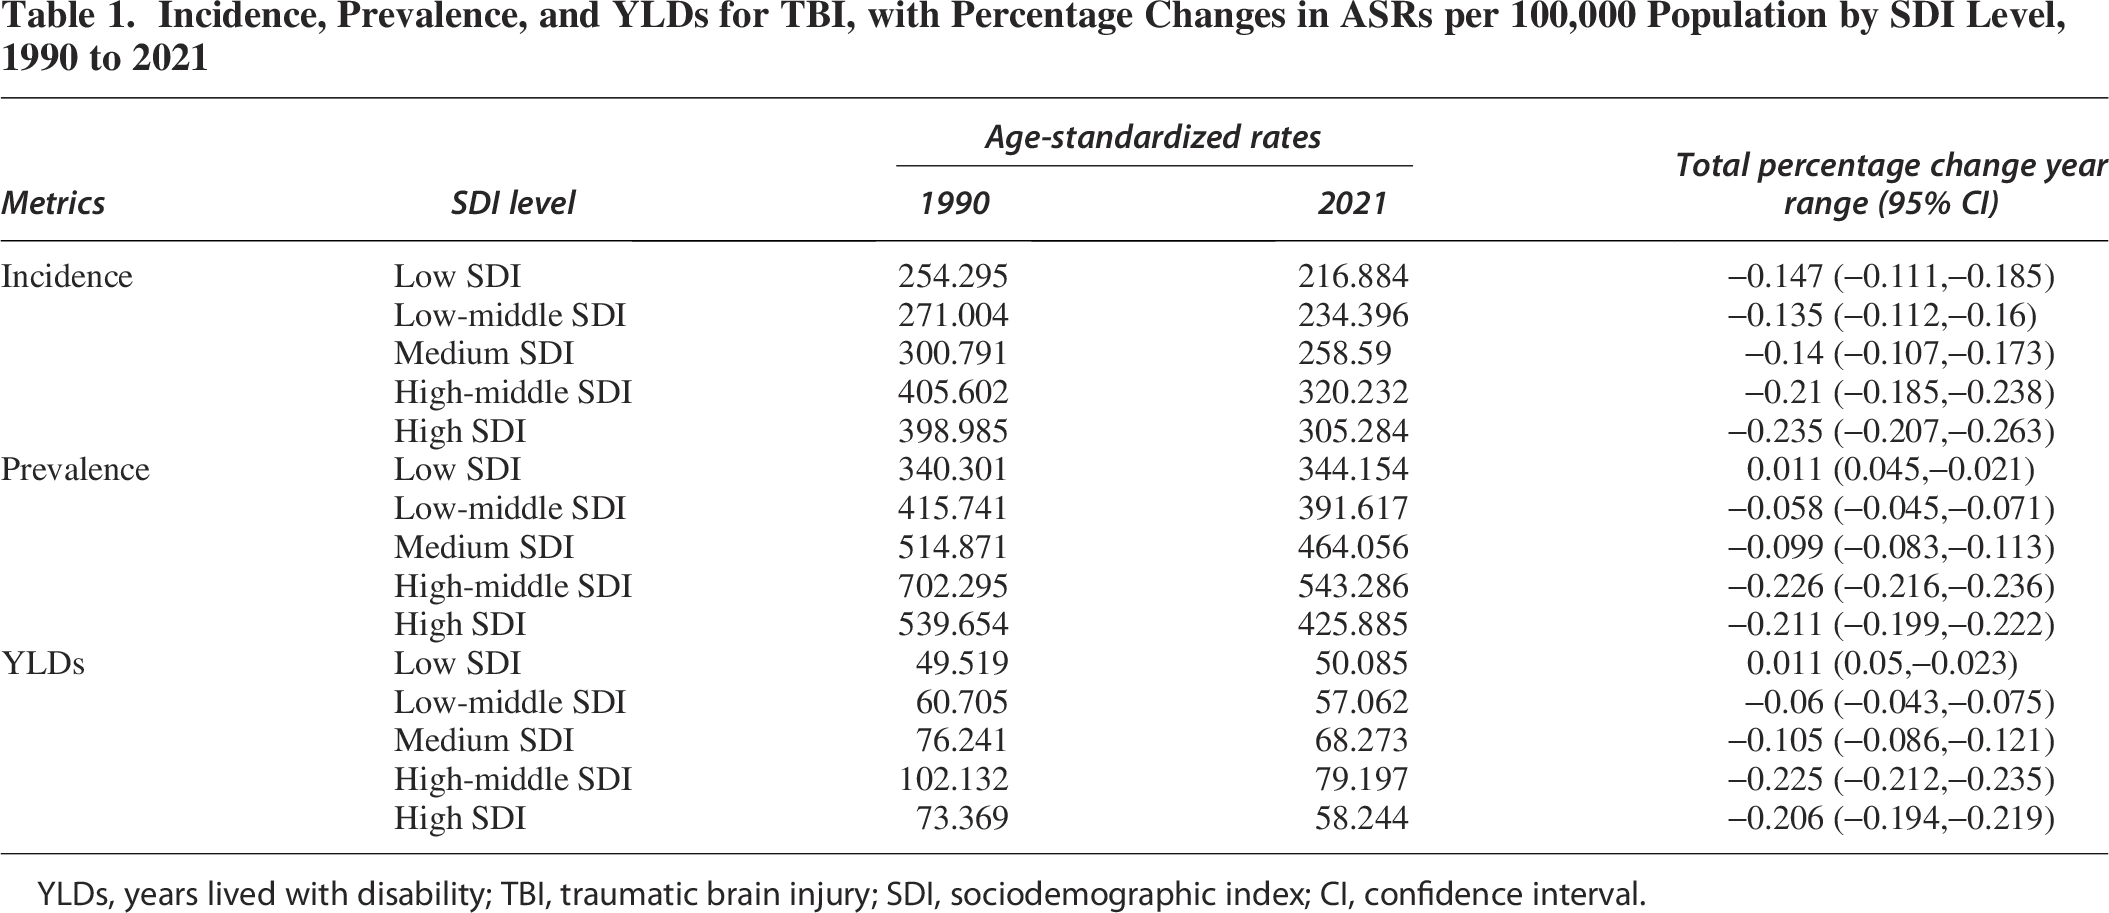
YLDs, years lived with disability; TBI, traumatic brain injury; SDI, sociodemographic index; CI, confidence interval.
Analysis across 204 countries and territories further indicated a relatively higher TBI burden in less developed nations. Afghanistan (0.840; 95% UI: 0.473–1.288), Lesotho (0.485; 0.430–0.539), and Yemen (0.428; 0.181–0.820) showed the most pronounced increases in TBI ASIR (Fig. 1 and Supplementary Tables S1 and S2). For ASPR and ASYR, the greatest increases were observed in Burundi, the Syrian Arab Republic, Haiti, Rwanda, and Lesotho (Fig. 1 and Supplementary Tables S1 and S2).
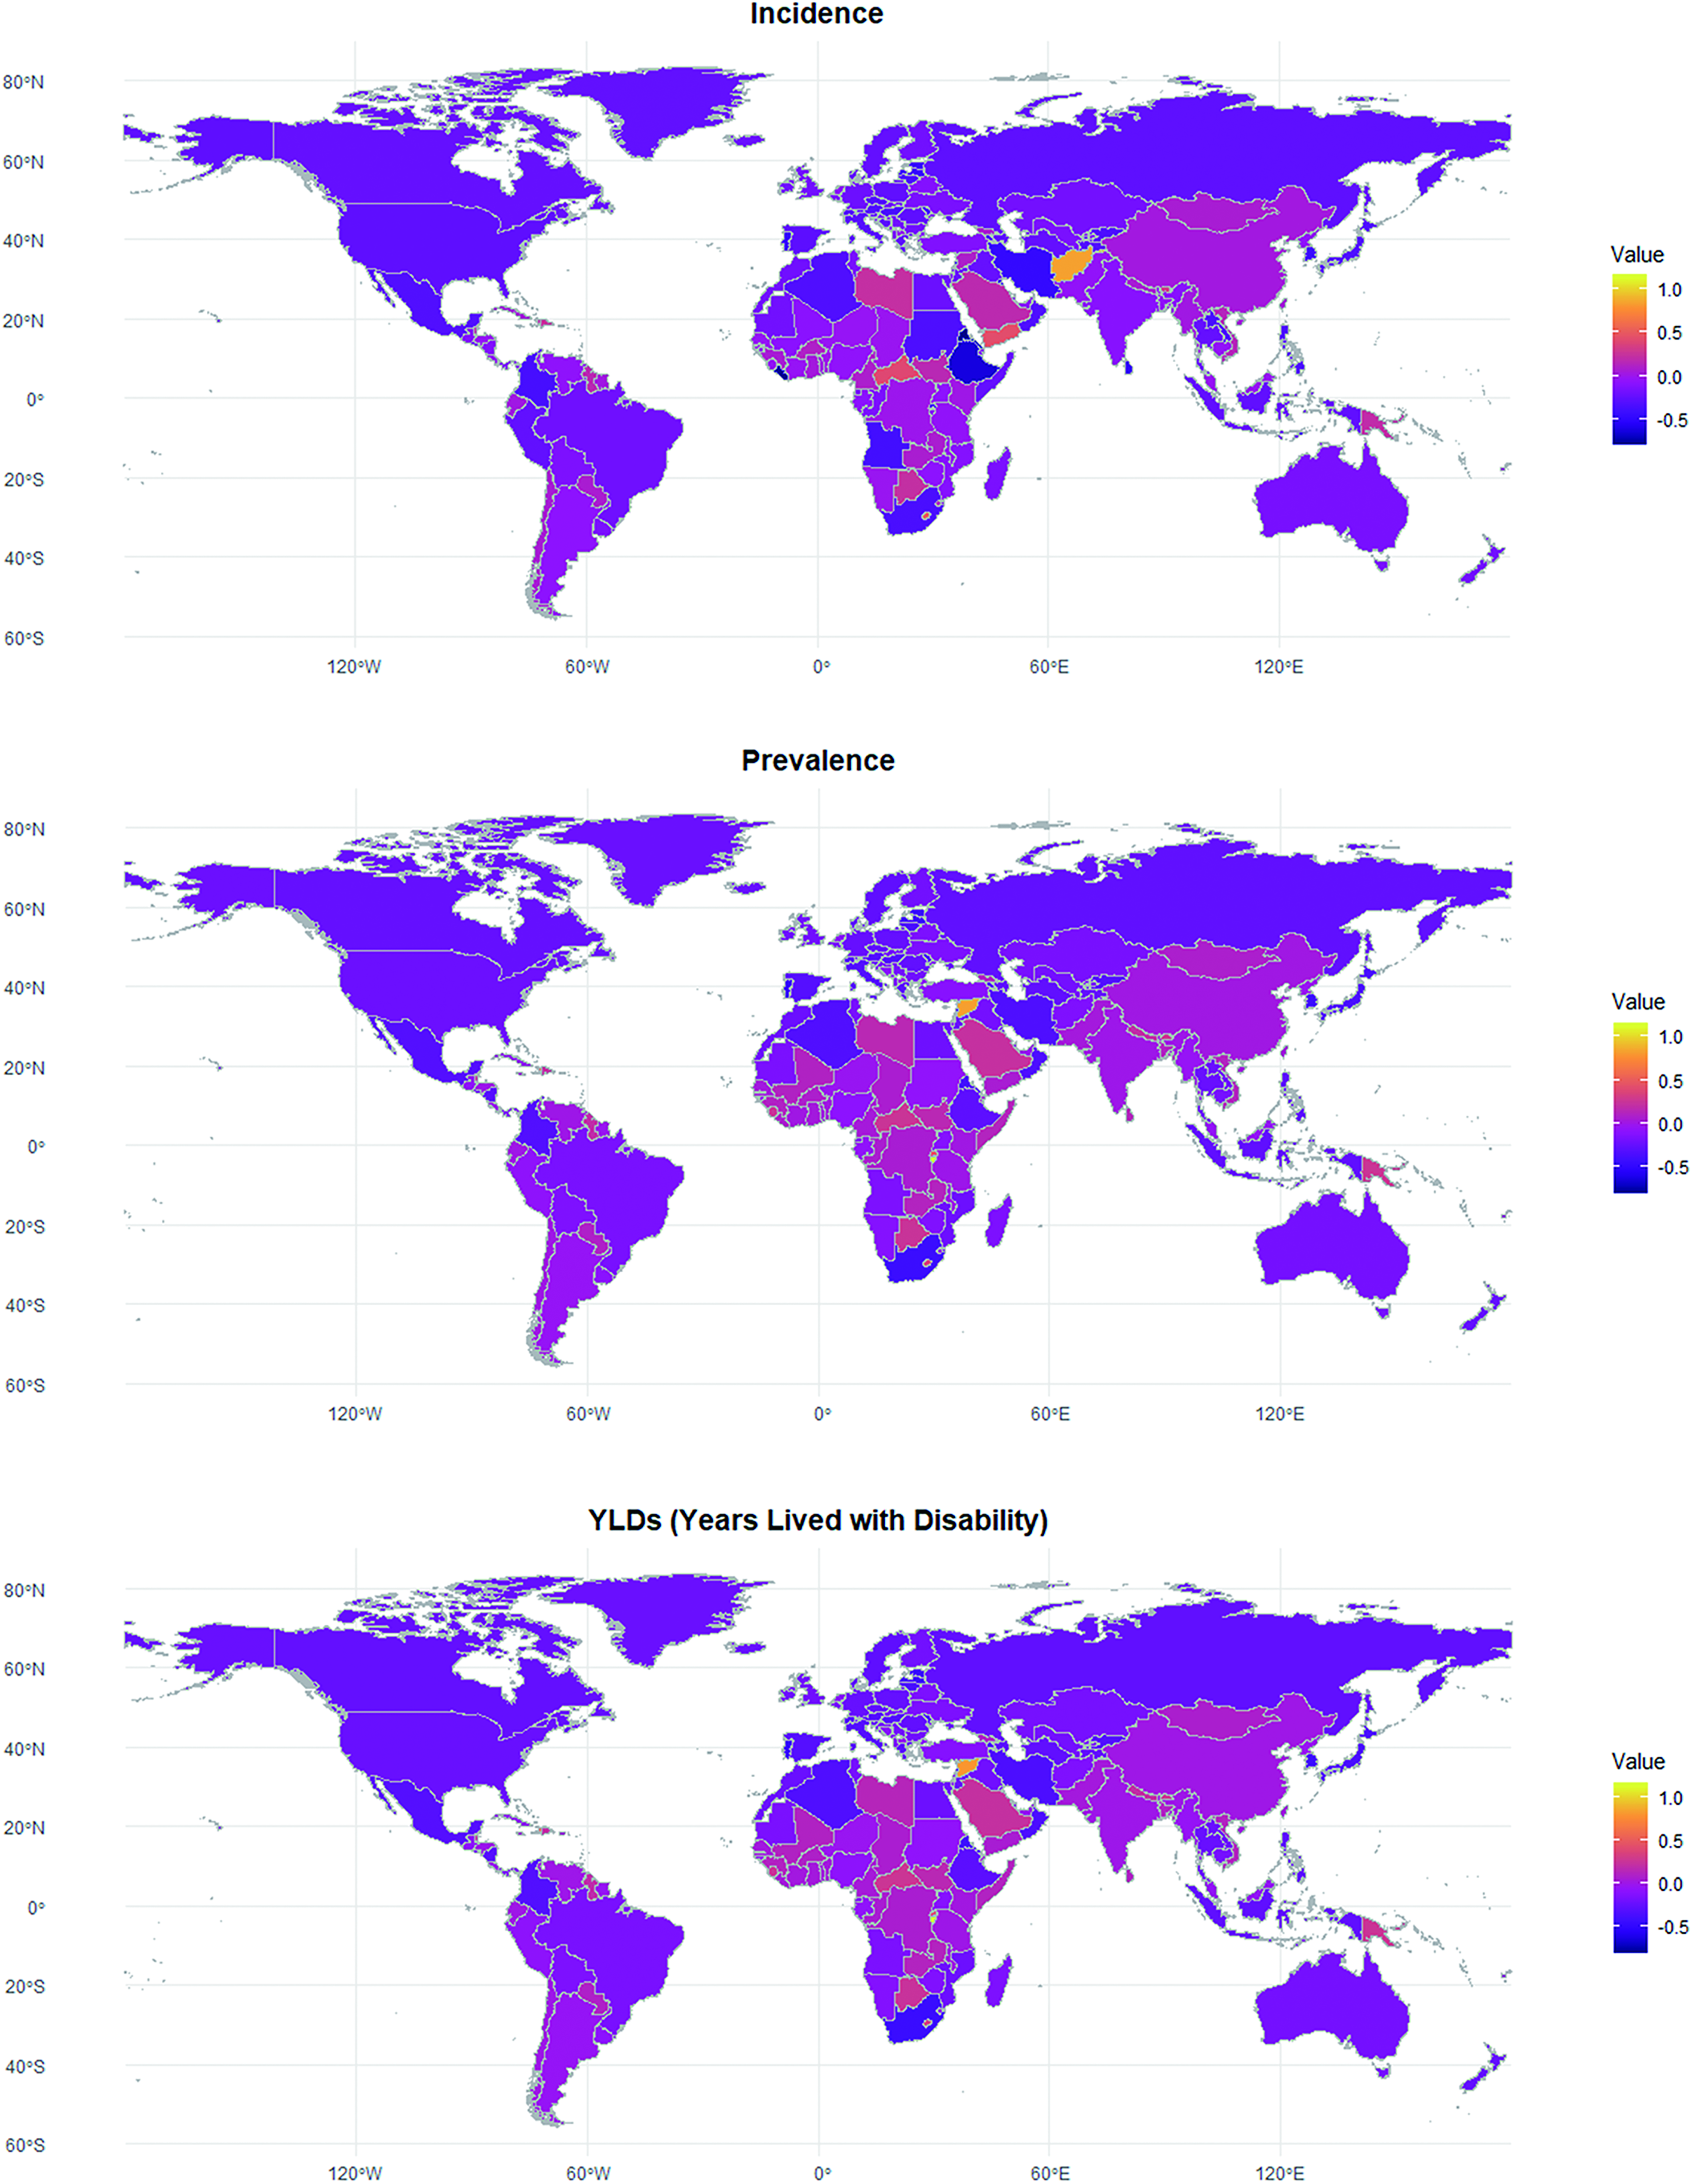
Total percentage change year range in age-standardized incidence, prevalence, and YLDs of TBI in 204 countries and regions. YLDs, years lived with disability; TBI, traumatic brain injury.
Temporal trends in incidence by TBI severity from 1990 to 2021
To inform more precise prevention and control strategies for TBI, we further stratified the analysis into mild and moderate-to-severe TBI subtypes, which exhibit distinct epidemiological, demographic, and geographic characteristics.
Joinpoint regression was used to assess the temporal trends in the global incidence of both subtypes from 1990 to 2021. Globally, the ASIR of mTBI decreased significantly from 1990 to 2021 (AAPC: −0.587; 95% CI: −1.211–0.059; p < 0.001), with significant reductions observed in most temporal segments (Fig. 2 and Table 2). In stark contrast, the global ASIR of msTBI showed no statistically significant decline over the same period (AAPC: −0.483; −1.235–0.275; p = 0.211). The trend was characterized by periods of nonsignificant fluctuation, including an atypical increase between 1995 and 1999, and none of the segmented intervals reached statistical significance (Fig. 2 and Table 2).
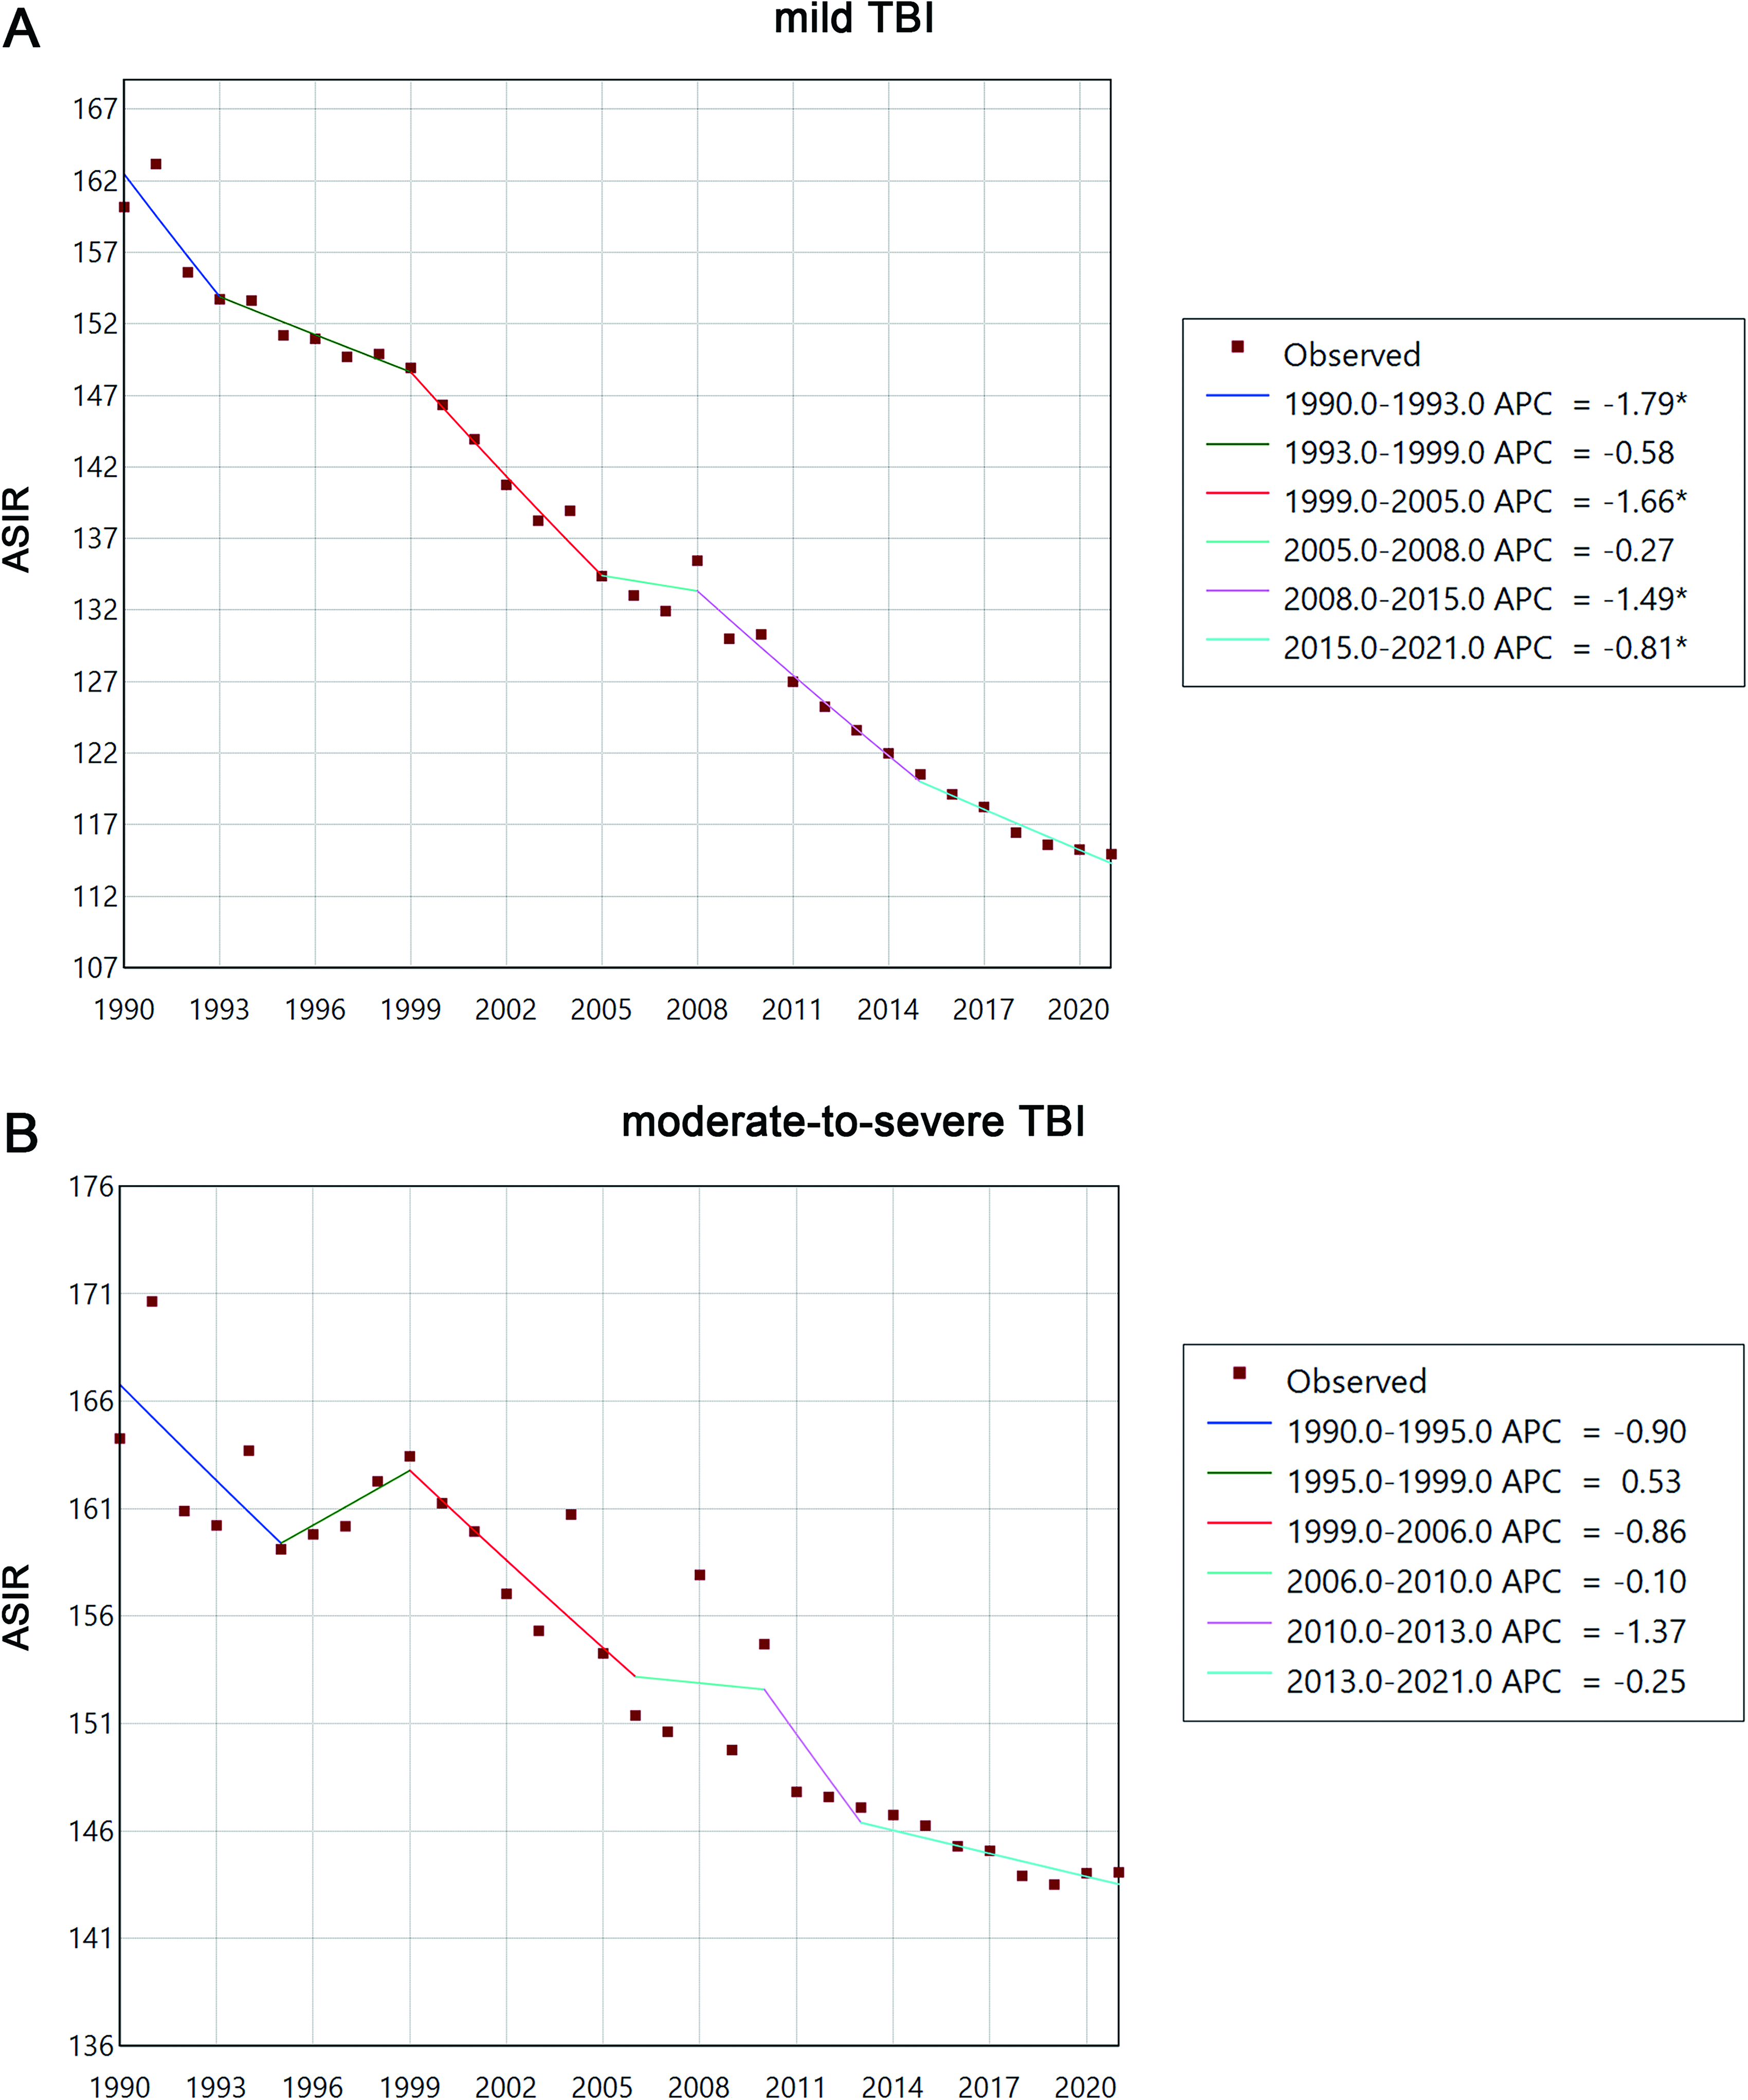
Joinpoint regression of global incidence rates of mild
Global Trends in ASIR of mTBI and msTBI Analyzed by Joinpoint Regression, 1990–2021
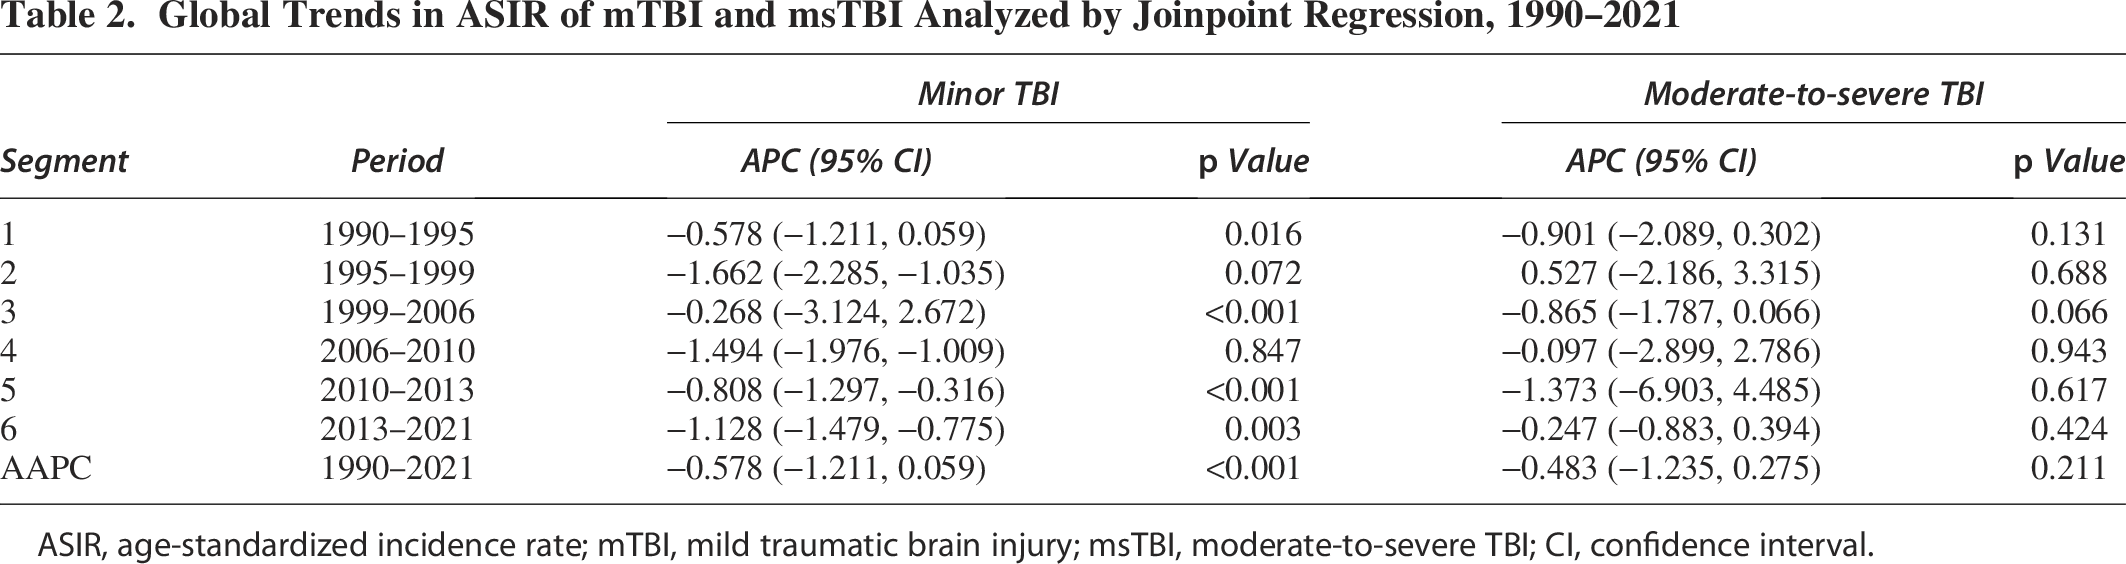
ASIR, age-standardized incidence rate; mTBI, mild traumatic brain injury; msTBI, moderate-to-severe TBI; CI, confidence interval.
Age and sex distribution patterns of mTBI and msTBI incidence in 2021 worldwide
Age and sex are two significant nonmodifiable factors influencing the burdens of TBI. The incidence of both mTBI and msTBI in 2021 demonstrated clear age- and sex-dependent patterns, with notable differences between subtypes.
For mTBI, the absolute number of incident cases in males peaked at 20–24 years (6.85 per 100,000; 5.36–8.63), while the ASIR in males exhibited a bimodal distribution, with the first peak in young adults (20–24 years) and a second peak in the oldest age group (90–94 years). In females, the incident number decreased continuously across the lifespan, while the ASIR showed persistent increasing with age (Fig. 3 and Supplementary Table S3).
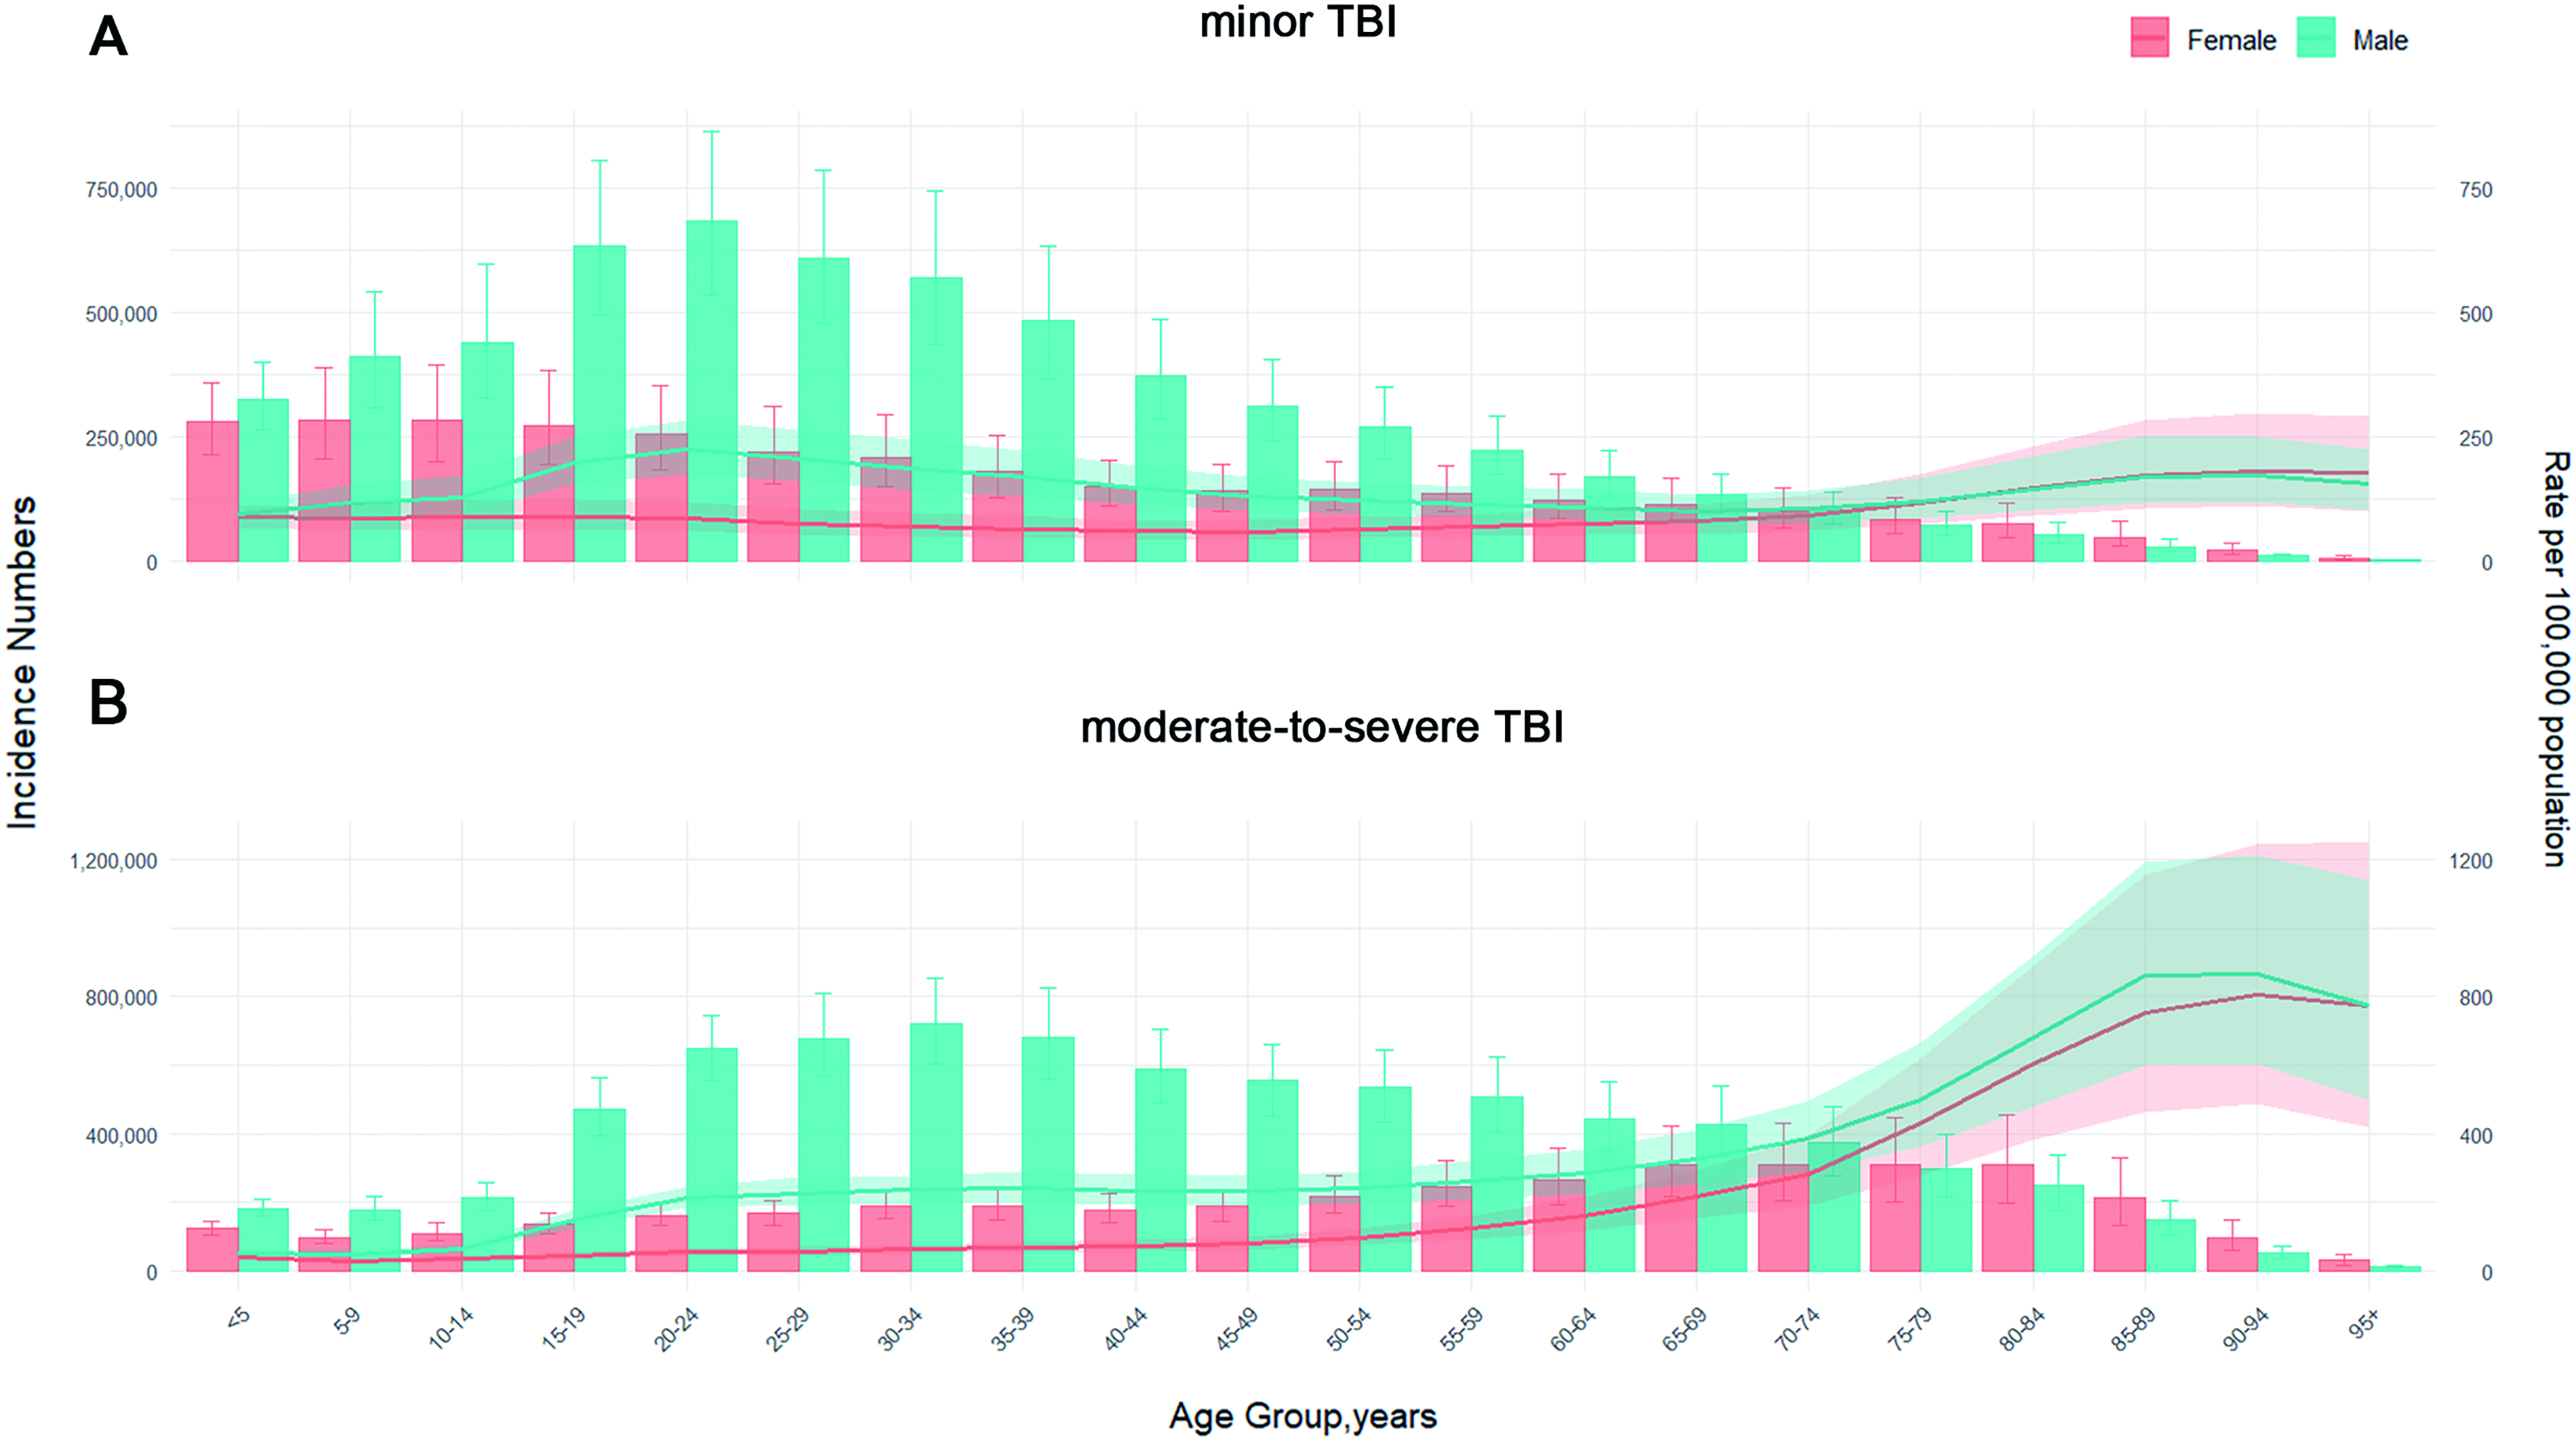
Global cases and ASIR of mild
For msTBI, the pattern was distinct. The peak incident number occurred in young and middle-age males (30–40 years; 7.20 per 100,000; 6.03–8.53) and elderly females (70–74 years; 3.10 per 100,000; 2.06–4.32). The ASIR increased continuously with age in both sexes; however, males consistently exhibited higher ASIRs than females across all age groups (Fig. 3 and Supplementary Table S3).
Leading risk factors and their geographic distributions in 2021
As a highly preventable condition, identifying the causes of TBI is crucial for policy development. We therefore conducted an attribution analysis of the ASIR for both TBI subtypes globally in 2021.
Falls (mTBI ASIR: 51.01; 95% UI: 32.45–77.83; msTBI ASIR: 66.18; 48.38–85.62) and motor vehicle road injuries (mTBI ASIR: 8.46; 5.57–12.31; msTBI ASIR: 16.32; 12.98–20.37) were the leading causes worldwide. Regionally, Australasia, Western Europe, and Eastern Europe had the highest burden of fall-related mTBI, while high-income North America and Australasia showed the greatest burden of mTBI attributable to motor vehicle road injuries. For msTBI, Central Europe, Eastern Europe, and South Asia were the most affected by falls, whereas North Africa and the Middle East, Southern Sub-Saharan Africa, and Eastern Europe carried the highest burden from motor vehicle road injuries (Fig. 4 and Supplementary Table S4).

Risk factors for ASIR of mild
Certain transportation-related risk factors contributed disproportionately to msTBI. Pedestrian road injuries (ASIR: 11.00; 8.34–14.12) and motorcyclist road injuries (9.01; 6.81–11.54) were also significant causes of msTBI globally, with geographic hotspots in East Asia and Tropical Latin America, respectively (Fig. 4 and Supplementary Table S4).
Furthermore, specific regions exhibited elevated TBI burdens from distinct risk factors. Conflict and terrorism contributed to strikingly high rates of both mTBI (ASIR 18.32; 6.50–42.16) and msTBI (16.46; 8.91–27.56) in North Africa and the Middle East. Similarly, mTBI (11.29; 6.14–18.17) and msTBI (ASIR: 9.98; 3.52–24.05), attributable to exposure to forces of nature, were particularly high in the Caribbean (Fig. 4 and Supplementary Table S4).
Temporal trends in risk factors for mTBI and msTBI from 1990 to 2021 worldwide
We further evaluated the temporal trends of all risk factors associated with both TBI subtypes globally from 1990 to 2021. The contributions of major risk factors to TBI incidence evolved differently over the 32-year study period, while falls and motor vehicle road injuries remained the two primary risk factors for both mTBI and msTBI throughout this period.
For mTBI, the ASIR of both falls and motor vehicle road injuries decreased. However, the absolute number of incident cases due to falls increased from 316.63 per 100,000 (95% UI: 196.03–481.26) in 1990 to 405.89 per 100,000 (258.54–620.61) in 2021, while those due to motor vehicle injuries decreased from 91.33 per 100,000 (60.68–131.76) to 67.36 per 100,000 (44.14–98.23) during the same period (Fig. 5 and Supplementary Table S5).
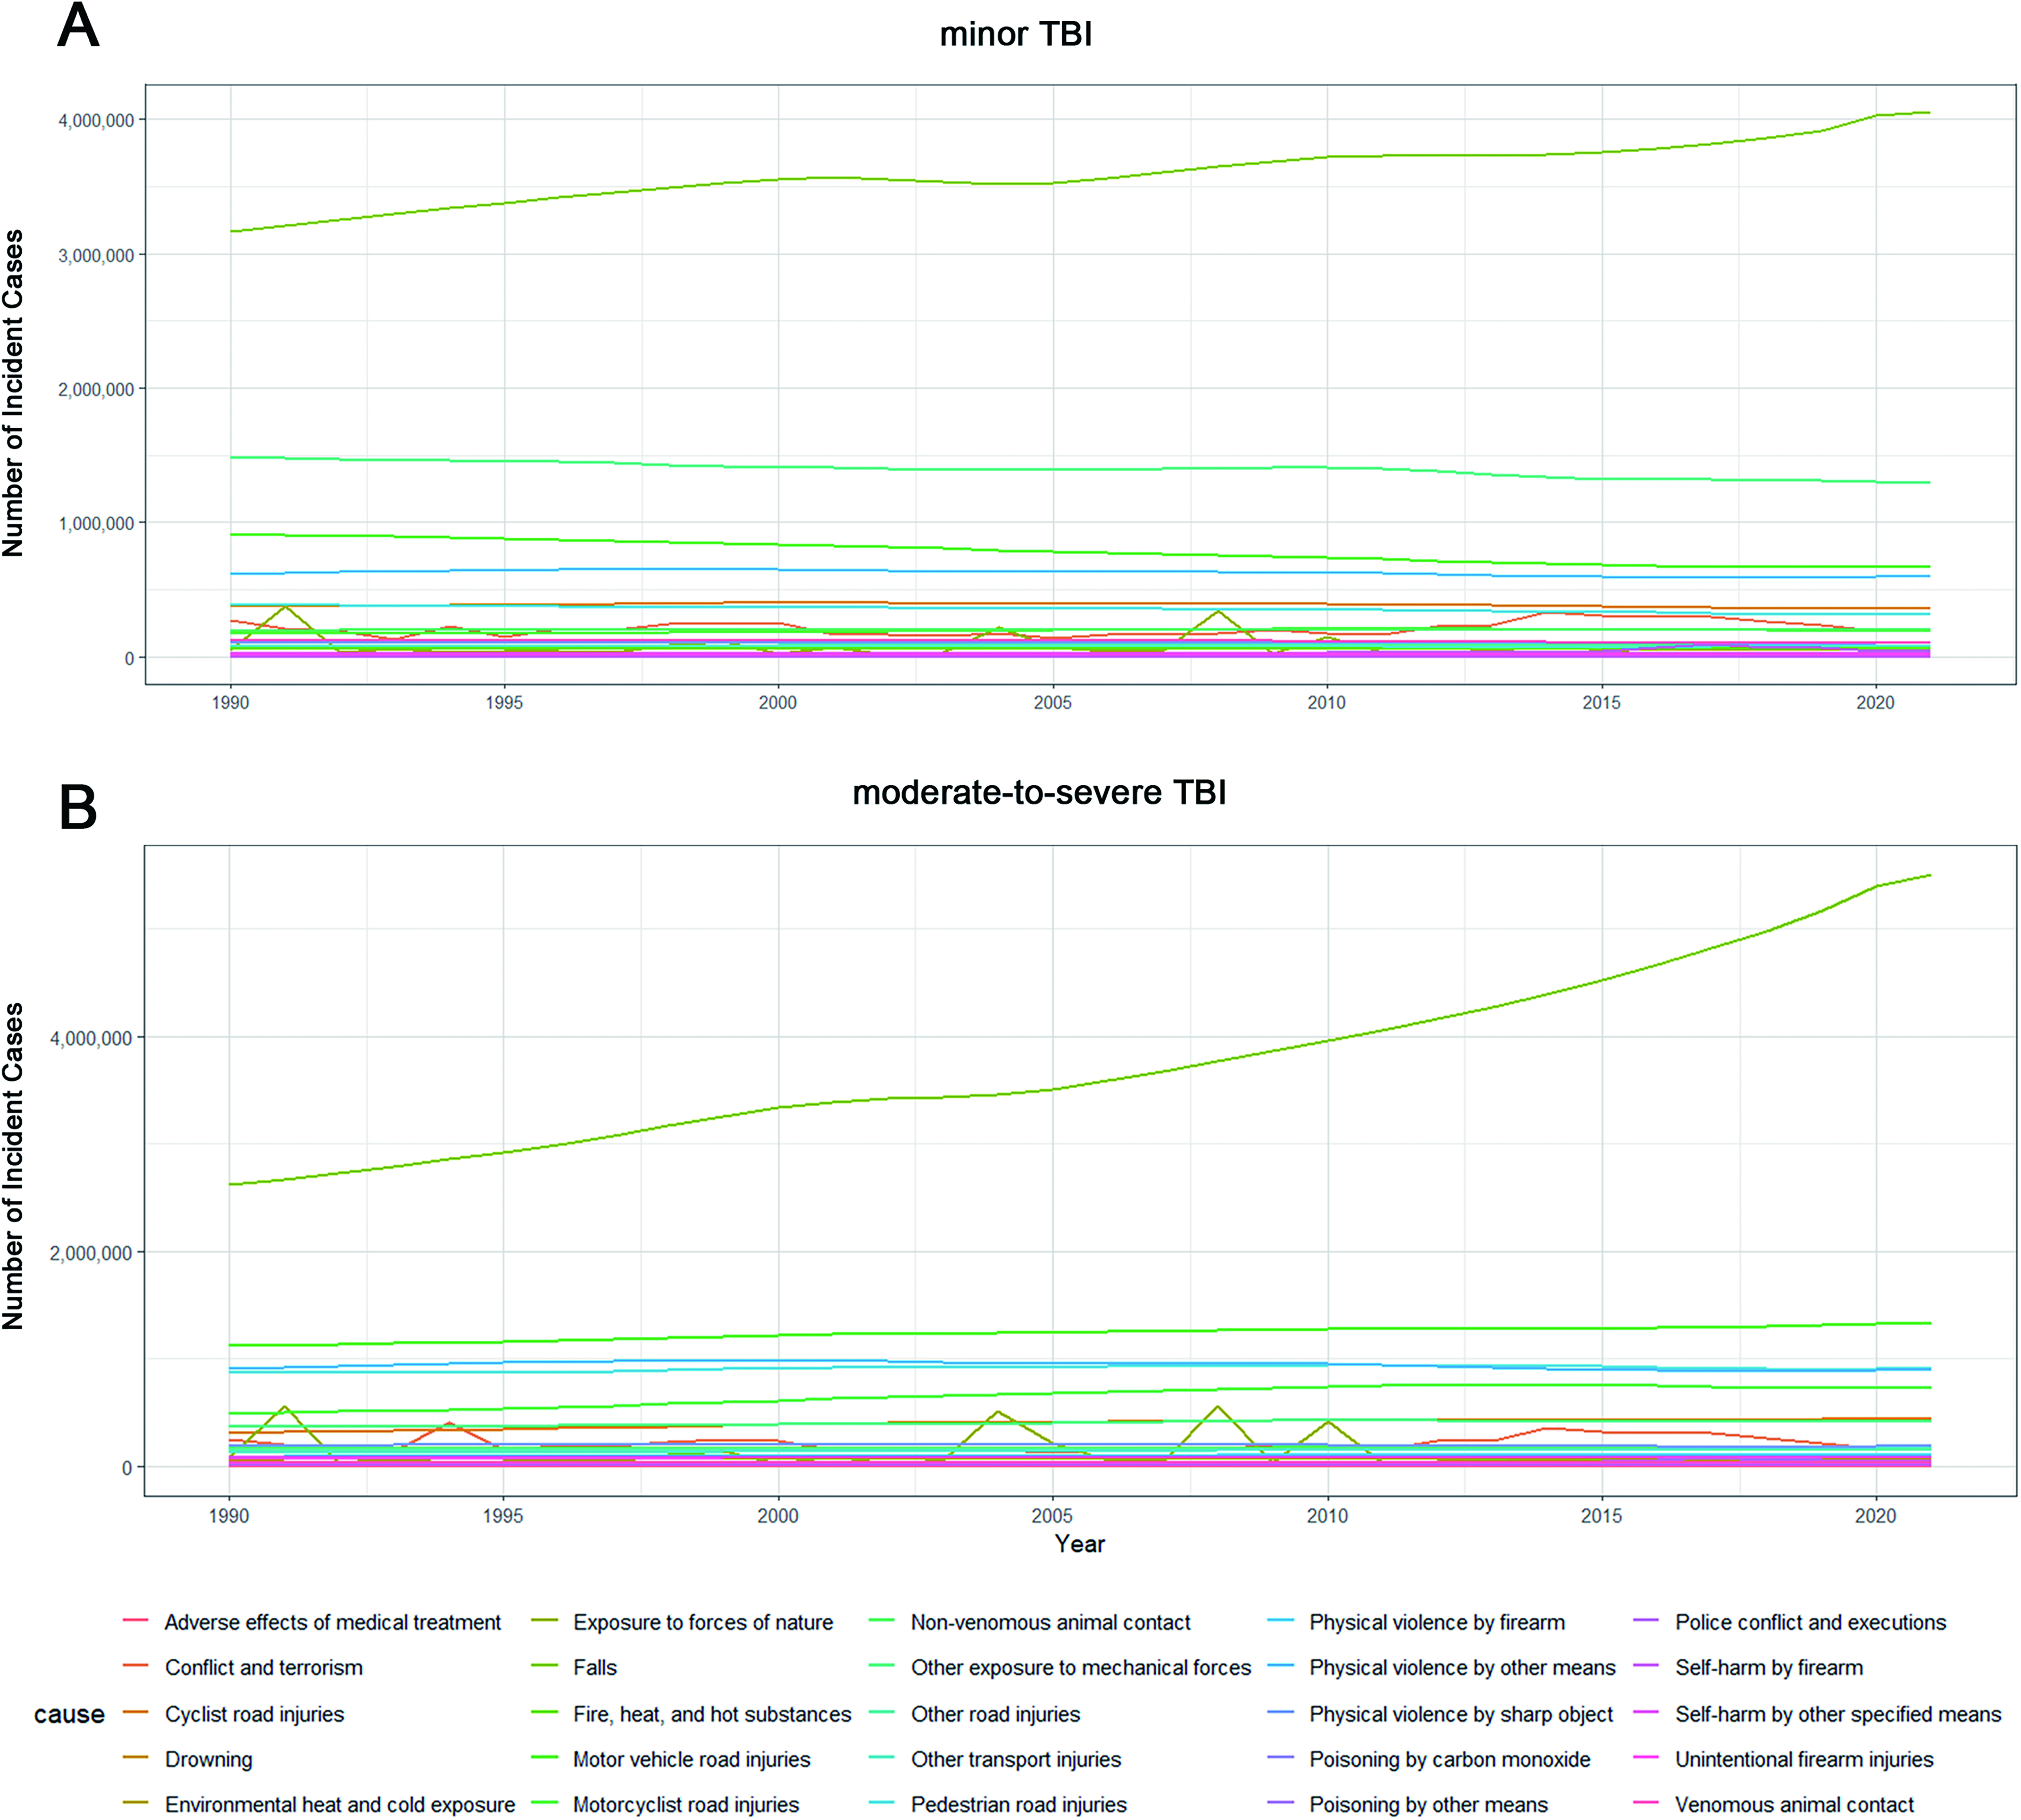
Trends of the number of mild
For msTBI, the trends were more concerning. Both the ASIR and the absolute number of incident cases due to falls increased substantially (from 261.37 per 100,000; 189.00–336.48; in 1990 to 550.73 per 100,000; 404.87–711.59 in 2021). For motor vehicle road injuries, although the ASIR decreased, the absolute number of incident cases increased (from 111.80 per 100,000; 87.50–141.81; to 133.49 per 100,000; 105.97–167.09; Fig. 5 and Supplementary Table S5).
Ranking of changing risk factors for mTBI and msTBI worldwide
To assess the potential contributions of different risk factors to TBI, we finally analyzed the ranking of the APC in absolute incident numbers for mTBI and msTBI risk factors from 1990 to 2021.
Among the top five increasing risk factors, police conflict and executions showed the highest APC for both mTBI (3.999; 2.970–5.037) and msTBI (2.770; 1.821–3.728; Fig. 6 and Supplementary Table S6). Falls and motorcyclist road injuries also demonstrated substantial increases for both subtypes. Additionally, self-harm by firearms showed marked increases as a risk factor for both mTBI (APC: 0.913; 0.763–1.063) and msTBI (APC: 1.166; 1.001–1.331; Fig. 6 and Supplementary Table S6).
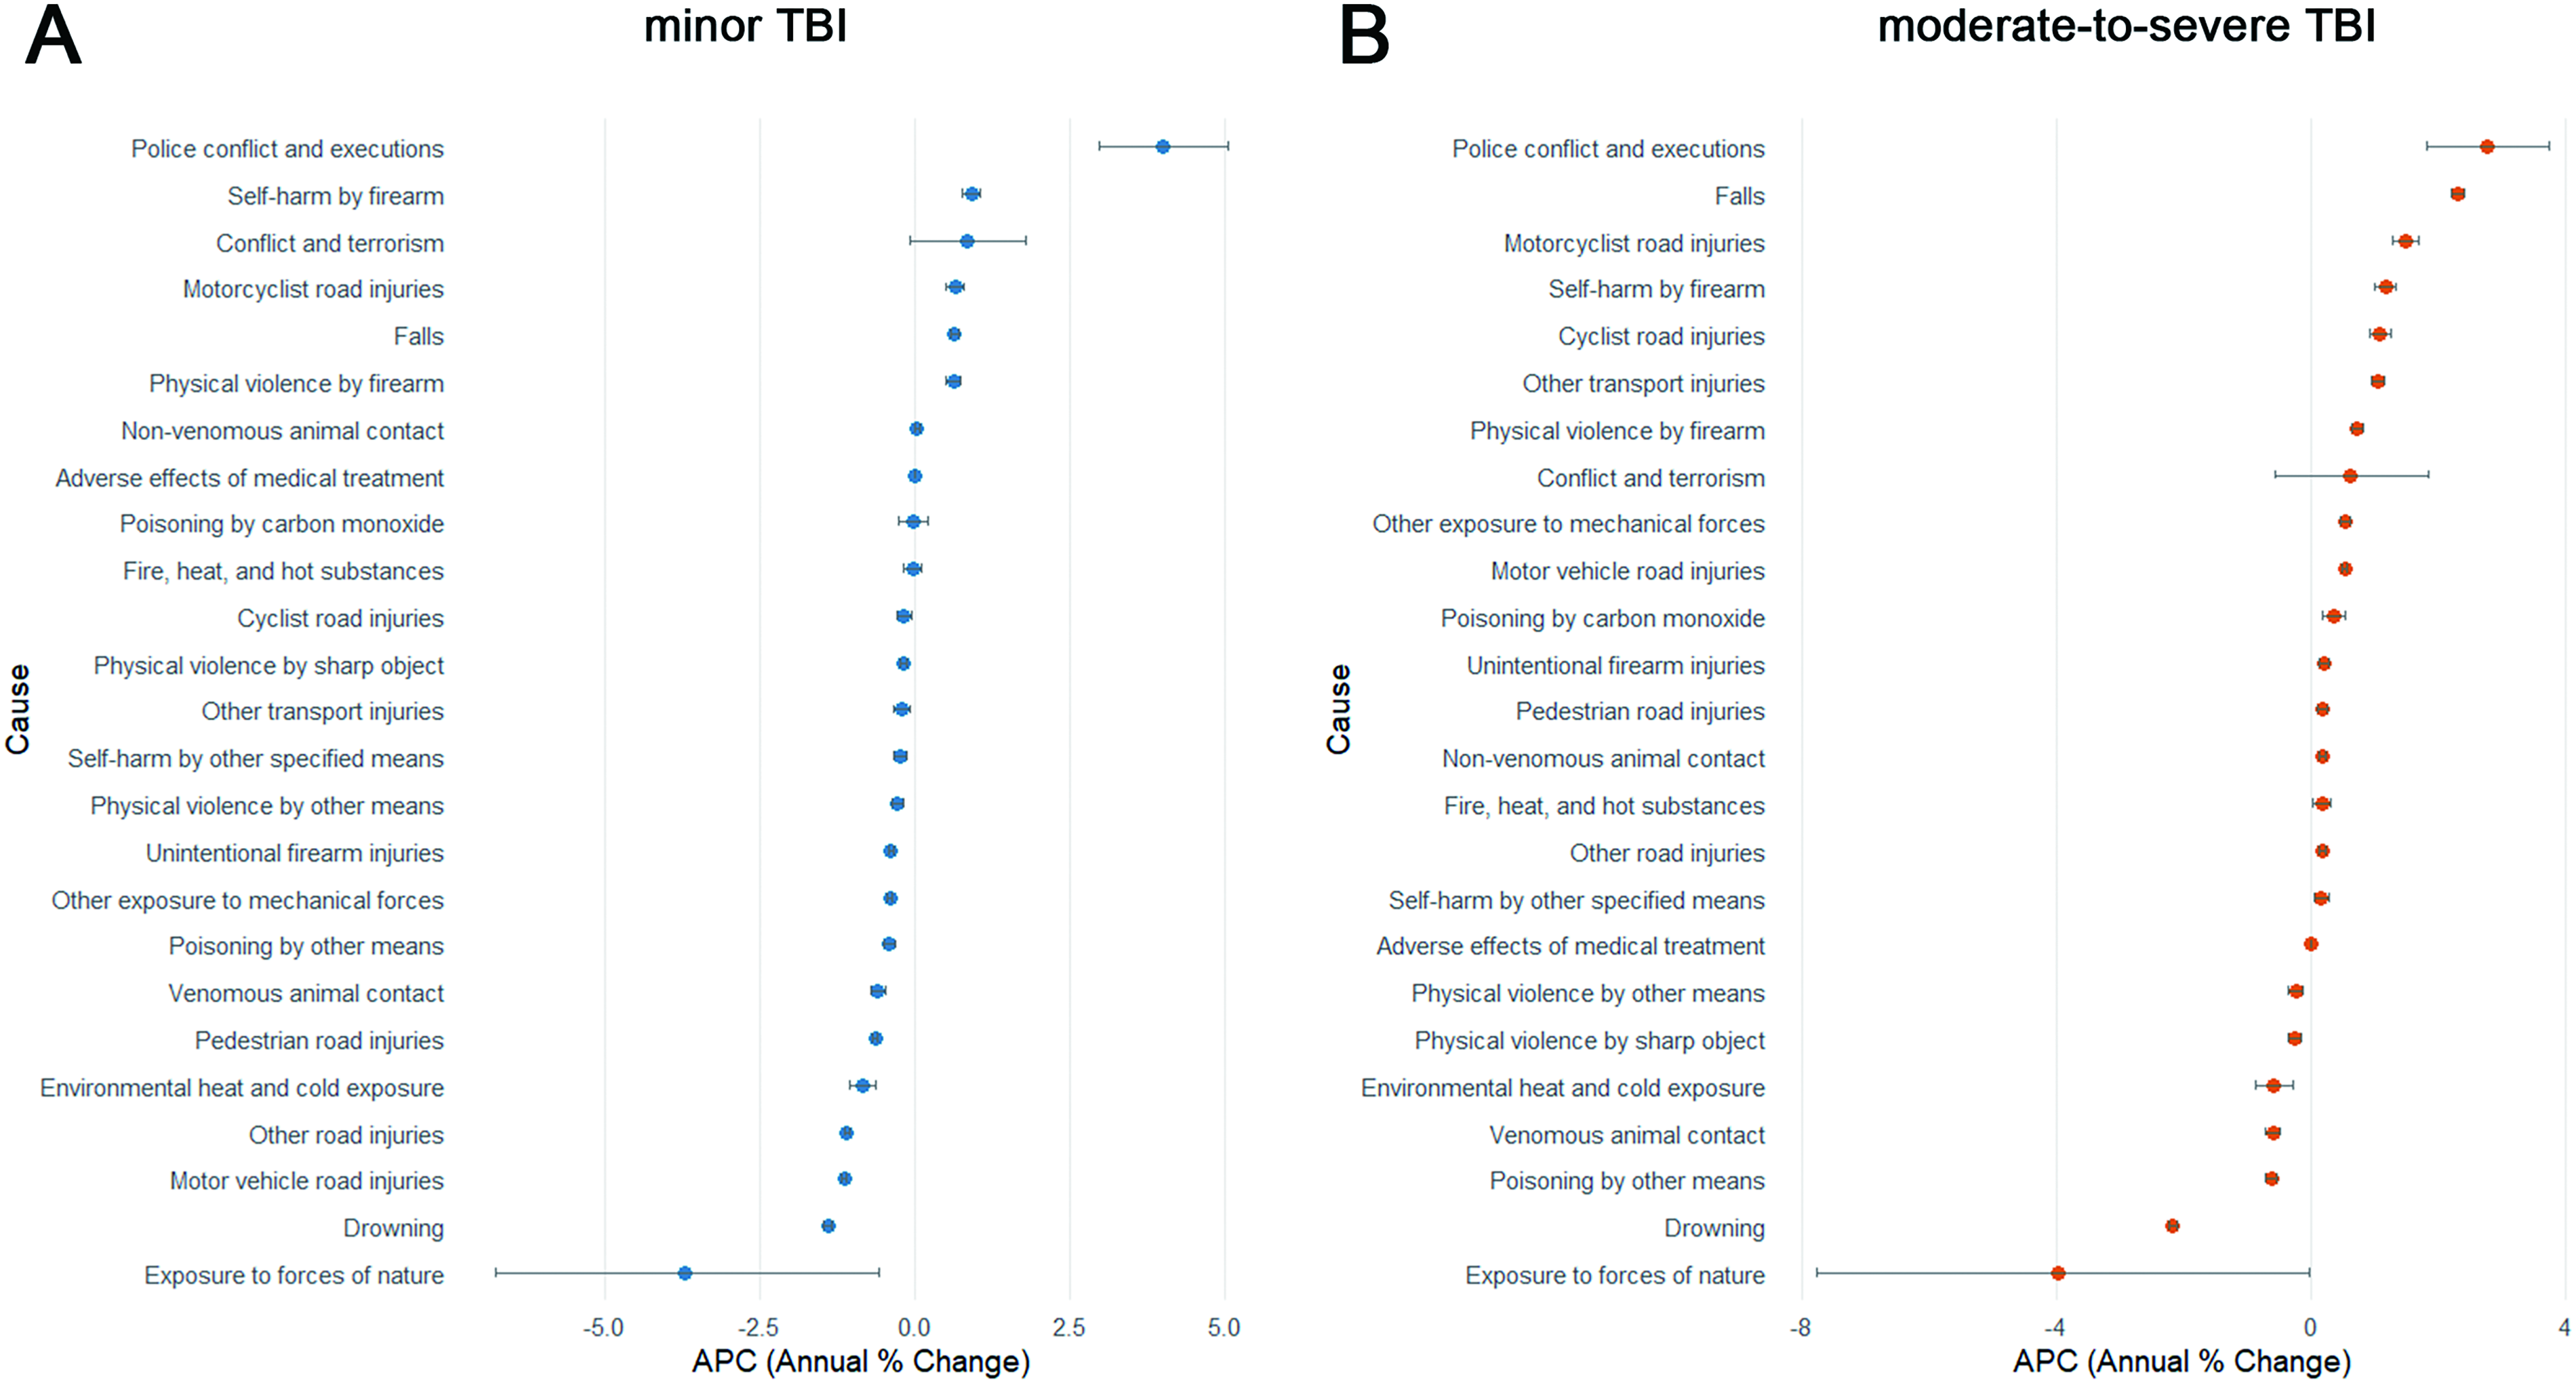
Ranking of APCs for each mechanism leading to mild
Discussion
Leveraging the comprehensive GBD 2021 dataset, our study provides a critical severity-stratified analysis of the global TBI burden. The most salient finding is the divergent epidemiological trajectory between mild and moderate-to-severe TBI, underscoring that these are not merely points on a spectrum of severity but distinct public health entities requiring tailored approaches. While global efforts have successfully reduced the burden of mTBI, the stagnant rates of msTBI signal an urgent, unmet challenge.
Global trends and the socioeconomic divide
Our analysis confirms a welcome overall decline in the ASIR of TBI from 1990 to 2021, aligning with recent literature and likely reflecting decades of public health investment (Fig. 1 and Table 1).13,15,17,18 Our findings of a declining global ASIR of TBI align with recent reports using GBD 2021 data, such as the study by Liu et al. 13 and Gu et al. 15 However, our severity-stratified analysis adds a critical nuance: the observed decline is primarily driven by the reductions in mTBI, while the burden of msTBI has remained stagnant. Notably, analyses based on the GBD 2016 data had previously indicated an increasing trend in the ASIR of TBI. 19 The reversal of this trend in our results likely reflects successful TBI prevention efforts during the most recent 5-year period. However, this global trend obscures a critical socioeconomic disparity. The concurrent rise in prevalence and YLDs in low-SDI quintiles, despite falling incidence, points to systemic failures in post-injury care. Inadequate rehabilitation, limited access to specialists, and fragile health care systems in these regions likely transform acute incidents into long-term disabilities, increasing the cumulative burden on societies least equipped to handle them.21–23
The critical divergence by severity
The stratification by severity reveals the core of the challenge. The ASIR of mTBI decreased consistently from 1990 to 2021, whereas the ASIR of msTBI displayed a fluctuating trajectory without a statistically significant overall reduction (Fig. 2 and Table 2). This divergence suggests that broad, nonspecific prevention strategies may have been effective for preventing milder injuries but have failed to curb the most severe and devastating forms of TBI. This discrepancy may be attributed to the fact that msTBI is frequently associated with high-energy trauma mechanisms—such as high-speed traffic accidents and severe falls—which are inherently more resistant to broad public health prevention strategies. Moreover, against the backdrop of global population aging, survivors of msTBI often present with more complex comorbidities, which can lead to prolonged recovery and extended periods of disability, thereby counterbalancing the reduction in the disease burden attributable to the declining incidence. This calls for a paradigm shift in prevention, moving beyond one-size-fits-all approaches to develop and implement interventions specifically targeted at the mechanisms—such as high-energy collisions and severe falls—that cause msTBI.
Demographic vulnerabilities and high-risk populations
Age and sex distribution patterns provide fundamental demographic insights into the TBI burden. In 2021, the age-specific incidence rate increased among adults aged >70 years in both sexes for both mTBI and msTBI (Fig. 3, Supplementary Table S3), reflecting the impact of global aging and elevated fall risk in older populations.24,25 Meanwhile, the absolute number of incident cases peaked among adolescent, young, and middle-aged males for both severity subtypes (Fig. 3, Supplementary Table S3), indicating a substantial social and economic burden. This pattern may be partly explained by males’ greater participation in sports, physical labor, traffic-related activities, and higher exposure to violence and conflict.26–29 Public health policy must therefore be dual-pronged, safeguarding the aging population while implementing targeted safety interventions for young males in occupational and recreational settings.
The evolving landscape of risk factors
The attribution analysis reveals both persistent challenges and emerging threats. Consistent with previous GBD 2016 and GBD 2019 analyses,9,16,19 falls and road injuries remain the dominant causes globally (Fig. 4 and Supplementary Table S4), but their dynamics are changing. The rising absolute number of fall-related TBI cases, for both subtypes (Fig. 5 and Supplementary Table S5), is a stark warning of the expanding impact of demographic aging due to age-related factors, including sarcopenia, osteoporosis, sleep disturbances, multimorbidity, and frailty.24,25,30 Geographic and environmental factors further influence the risk patterns—for instance, Northern European countries face elevated fall risks due to icy walkways during winter months. 31 These findings emphasize that both demographic aging and environmental hazards should be prioritized in preventive policy planning.
The observed reduction in the TBI burden partially reflects the successes in road injury prevention.13,18 The implementation of World Health Organization and United Nations road safety initiatives since 2004—emphasizing legislation on speed limits and alcohol control, mandatory seatbelt and helmet use, and improved road and vehicle safety standards—has contributed significantly to this decline in many countries. 32 Nevertheless, road injuries, particularly motor vehicle accidents, remain a major cause of TBI. While the absolute number of mTBI cases from road injuries generally decreased over the study period, msTBI cases attributable to this cause continued to rise (Fig. 5 and Supplementary Table S5). Regional variations are particularly evident, for example, East Asia experiencing a growing msTBI burden from road injuries, likely driven by rapid economic growth, expanding vehicle ownership, and large population bases.33–35 Strengthening the road infrastructure, enhancing traffic signage, and strictly enforcing traffic regulations represent essential strategies to mitigate this persistent public health challenge.
Most alarmingly, our study identifies violence as a rapidly growing driver of TBI. For instance, conflict and terrorism represent a particularly prevalent etiology in North Africa and the Middle East (Fig. 4 and Supplementary Table S4), underscoring the urgent need for conflict resolution and peace-building efforts.36–38 Police conflict and executions emerged as the most rapidly increasing risk factor for both mTBI and msTBI between 1990 and 2021 (Fig. 6 and Supplementary Table S6), with a particularly high prevalence in Latin America (Fig. 4 and Supplementary Table S4)—a pattern potentially linked to drug trafficking, organized crime, and governance challenges.39–41 Additionally, self-harm by firearms contributed to substantially increasing rates of both mTBI and msTBI throughout the study period, highlighting the critical need for enhanced mental health support, suicide prevention initiatives, and stricter firearm control measures.42–45
Limitations and public health implications
Several limitations should be considered. First, as with all GBD analyses, our estimates rely on medically documented cases, potentially underestimating the true incidence, particularly for mTBI. Second, the restriction of our burden assessment to nonfatal outcomes (incidence, prevalence, YLDs) precludes a comprehensive view. The inability to incorporate mortality data—as fatal injuries are classified by the external cause rather than the specific injury outcomes within the GBD framework—may lead to an underestimation of the overall societal burden of TBI, particularly msTBI. Finally, the data cutoff of 2021 means that subsequent major events—including the COVID-19 pandemic and ongoing armed conflicts such as the Russia–Ukraine war, the Syrian crisis, and the Israeli–Palestinian conflict—are not captured. Therefore, we recommend that future studies leverage updated datasets to assess the impact of these events on the incidence, severity distribution, and continuity of care for TBI.
Conclusion
In conclusion, our severity-stratified analysis reveals that the global decline in the TBI burden is uneven and masks a persistent crisis of moderate-to-severe injuries. Older adults emerged as a vulnerable population, exhibiting elevated susceptibility to both mTBI and msTBI. Falls and road injuries remained the predominant causes across all regions and severity levels, while violence emerged as a rapidly growing contributor to TBI incidence. To effectively mitigate the TBI burden, a new precision public health framework is imperative. We propose a three-tiered approach: (1) Primary prevention must be sharpened to target msTBI-specific mechanisms and address the rising tide of violence-related TBI. (2) Secondary prevention requires strengthening trauma systems globally, especially in low-SDI regions, to improve acute care and mitigate long-term disability. (3) Tertiary prevention and robust surveillance are needed to fully capture the burden, including mortality, and to guide resource allocation. Only by acknowledging and addressing the distinct nature of severe TBI can we hope to reduce its devastating global impact.
Transparency, Rigor, and Reproducibility Statement
The data were derived from here: http://ghdx.healthdata.org/gbd-results-tool. The analyzed data will be shared upon reasonable request to the corresponding author.
Authors’ Contributions
X.L. and X.X. conducted data analysis and drafted the article. K.H. performed data verification and validation. X.L., X.X., and K.H. contributed equally to this work. X.W. reviewed and edited the language of the article. T.T. conceived the study and designed its framework. C.J. provided funding support. Both T.T. and C.J. supervised the research and should be contacted for correspondence.
Footnotes
Acknowledgments
The authors extend our sincere gratitude to Professor Gao Chen and Dr. Feng Yan from the Department of Neurosurgery, Second Affiliated Hospital of Zhejiang University, for their invaluable contributions to code optimization and logical refinement of this study.
Author Disclosure Statement
No competing financial interests exist.
Funding Information
This work was supported by the National Natural Science Foundation of China (Nos. 82271314 and 82471319).
Supplemental Material
References
Supplementary Material
Please find the following supplemental material available below.
For Open Access articles published under a Creative Commons License, all supplemental material carries the same license as the article it is associated with.
For non-Open Access articles published, all supplemental material carries a non-exclusive license, and permission requests for re-use of supplemental material or any part of supplemental material shall be sent directly to the copyright owner as specified in the copyright notice associated with the article.