
Abstract
Traumatic brain injury (TBI) is the leading cause of death and neurological disabilities in young adults, representing a significant psychological and economic burden for patients, families, and society. Morbidity and mortality in TBI involve pathophysiological events such as rupture of the blood–brain barrier, neuronal death, and neuroinflammation triggered by the initial trauma and subsequent secondary injuries. A proper understanding of these pathophysiological events involved in TBI is essential to find new targets for the treatment of this disease. The purpose of this study was to analyze the signaling pathways involved in pericontusional brain tissue in severe human TBI. Twenty-two frozen pericontusional brain tissue samples from patients with severe TBI indicated for surgery were analyzed and compared against autopsy brain tissue samples from neurologically healthy donors. The transcriptome analysis by large-scale RNA sequencing (RNA-Seq) was performed in TBI and controls in the exploratory phase. The QuantSeq 3′ mRNA-Seq RNASeq was performed to identify altered gene expression triggered by TBI. Signaling pathway enrichment analysis identified increased expression of gene sets involved in inflammation, angiogenesis, extracellular matrix remodeling, and wound healing pathways, while genes related to ion transport and synaptic transmission were downregulated in TBI relative to controls. Moreover, upregulation of signaling pathways involving TNFα, NFkB, IL6-JAK-STAT, cholesterol homeostasis, inflammatory response, TGFβ, epithelial–mesenchymal transition, coagulation, apoptosis, p53, and angiogenesis was detected with predominant downstream activation of six transcription factors: NFKB2, FOS, RELB, KLF4, ATF3, and EGR2. Specific brain cell compartment analysis based on gene expression profiles previously reported in single-cell transcriptomes confirmed the upregulation of genes related to microglia, immune cells, and endothelial cells, in contrast to the downregulation of genes related to neurons, astrocytes, and mature oligodendrocyte compartments. Notably, the expression of CCL2 was significant and uniquely correlated with SPHK1 expression, linking inflammatory response to angiogenesis. The transcriptome profile of TBI revealed several differentially expressed genes related to inflammatory response but also to concomitant activation of signaling pathways involved in tissue repair. More specifically, the CCL2-SPHK1 axis was validated at gene and protein expression levels in TBI. Further studies elucidating their role in angiogenesis and promotion of brain tissue repair, together with their potential applicability as therapeutic targets, are warranted.
Background
Traumatic brain injury (TBI) is the leading cause of death and neurological disabilities in young adults, representing a significant psychological and economic burden for patients, families, and society.1,2 Morbidity and mortality in TBI involve pathophysiological events such as rupture of the blood–brain barrier, neuronal death, and neuroinflammation triggered by the initial trauma and subsequent secondary injuries. 3 Brain injury primarily occurs due to primary tissue damage at the time of trauma or additionally due to secondary injuries resulting from biochemical responses to the primary insult. 4 Neuronal loss involving glutamate excitotoxicity, mitochondrial dysfunction, neuroinflammation, and extracellular matrix remodeling number among the pathophysiological changes of secondary TBI injury. 5 Neuroinflammation is crucial in containing tissue damage and promoting functional recovery, although an excessive inflammatory response can increase tissue damage. Persistent secondary injuries in chronic stages contribute to neurodegeneration. 6 Therefore, a balanced secondary response is essential for structural and functional recovery of the brain tissue damage and should be the goal of therapeutic strategies in TBI. 7
Despite the intense search for effective therapies in TBI, progress is slow due to the challenges posed by the heterogeneity of injuries, multifactorial treatment responses, and unique characteristics of the central nervous system, characterized by the composition of multiple cell types with diverse reactions to injury, scant repair reserves, and limited regenerative capacity. 8
In this study, the gene expression profile in human severe TBI brain contusion was analyzed to further the understanding of signaling pathways involved in the acute phase of TBI.
Methods
TBI samples
The study included individuals over 18 years of age with severe TBI admitted to the emergency ward of Hospital das Clinicas of FMUSP (level 1 trauma center) between 2017 and 2021. The criteria for surgical treatment were the presence of intracranial hypertension characterized by midline deviation ≥ 5 mm and/or cisternal compression on computed tomography, hematoma > 50 cm3, and a 2-point decrease in initial Glasgow Clinical Scale (GCS). 9 Surgery was performed based on the craniometric references previously described by the neurotrauma group. 10 Cases with penetrating trauma were excluded. This project was approved by the local Research Ethics Committee—CAPPESQ (Ethics Committee for Analysis of Research Projects with permit no. 8276). The consent form was signed by a responsible family member.
Process of biological sample collection
Brain contusion tissue that is normally drained from the cerebral hematoma was collected from 22 patients; the perilesional region was macroscopically separated, snap frozen in liquid nitrogen, and stored at −80°C until use. Autopsy brain tissue of the postcentral gyrus of the parietal lobe from 20 sex- and age-matched subjects without neurological disorders collected within 24 h of death was selected as a control (permit no. 13041).
Total RNA extraction and cDNA synthesis
Cryosections of samples were stained for hematoxylin–eosin to analyze neuronal density, inflammatory infiltrate, and necrotic areas. Fragments with a low density of inflammatory cells were selected for RNA extraction, while necrotic areas were macrodissected before RNA extraction.
Total RNA of samples was extracted using the RNeasy Mini Kit (Qiagen, Hilden, Germany) according to manufacturer instructions. RNA concentration and integrity were analyzed by D1000 ScreenTape on the Agilent 4200 System (Agilent Technologies, Santa Clara, CA). The cDNAs were synthesized using SuperScript III Reverse Transcriptase, RNase inhibitor (RNaseOUT), and random and oligo dT primers, as recommended by the manufacturer (Thermo Fisher Scientific, Waltham, MA).
Transcriptomic analysis
RNA sequencing (RNA-Seq) was performed to investigate differentially expressed transcripts in 10 samples from controls without TBI and 10 pericontusional samples during the discovery phase. The samples were prepared using the QuantSeq 3′ mRNA-Seq Library Prep FWD for Illumina kit (Lexogen, Vienna, Austria) to generate about 5 million reads per library from the 3′ end of each gene with a size of 75 bp. Sequencing was conducted on the Illumina NextSeq 500 platform (Illumina, San Diego, CA, USA) at the multiuser Large Scale Sequencing Laboratory (SELA) of FMUSP. The alignment of the sequencing data was performed based on the GRCh38 using the RHisat2 (embedded in the qAlign function from QuasR). 11 Expression quantification was performed with the qCount function from QuasR. FeatureCounts 12 was utilized to count the number of reads that overlap each gene. GFF files containing the gene models were obtained from ftp.ensembl.org. The fastQC and RNASEQC programs were employed to assess sequencing quality and alignment metrics, respectively. The R-Bioconductor package limma was used to evaluate differential gene expression between pericontusional samples and controls without TBI, 13 applying the Benjamin–Hochberg test for the calculation of adjusted p values (adjP). Normalization was performed using the edgeR program 14 employing the trimmed mean of M-values method. Pathway signaling analysis and gene set enrichment analysis were conducted using online tools such as GSEA (http://software.broadinstitute.org/gsea), WebGestalt (http://www.webgestalt.org/), Gene Ontology Resources (accessed: 2021-02-10, 10.5281/zenodo.2529950), and the STRING Consortium. The contribution of brain cell types in the pericontusional expression profile was determined by calculating expression scores using the Gene Set Variation Analysis (GSVA) package 15 that provided sample-wise enrichment scores using gene sets from the cell-type signature collection of GSEA single-cell RNASeq datasets.
Gene expression analysis by quantitative real-time PCR
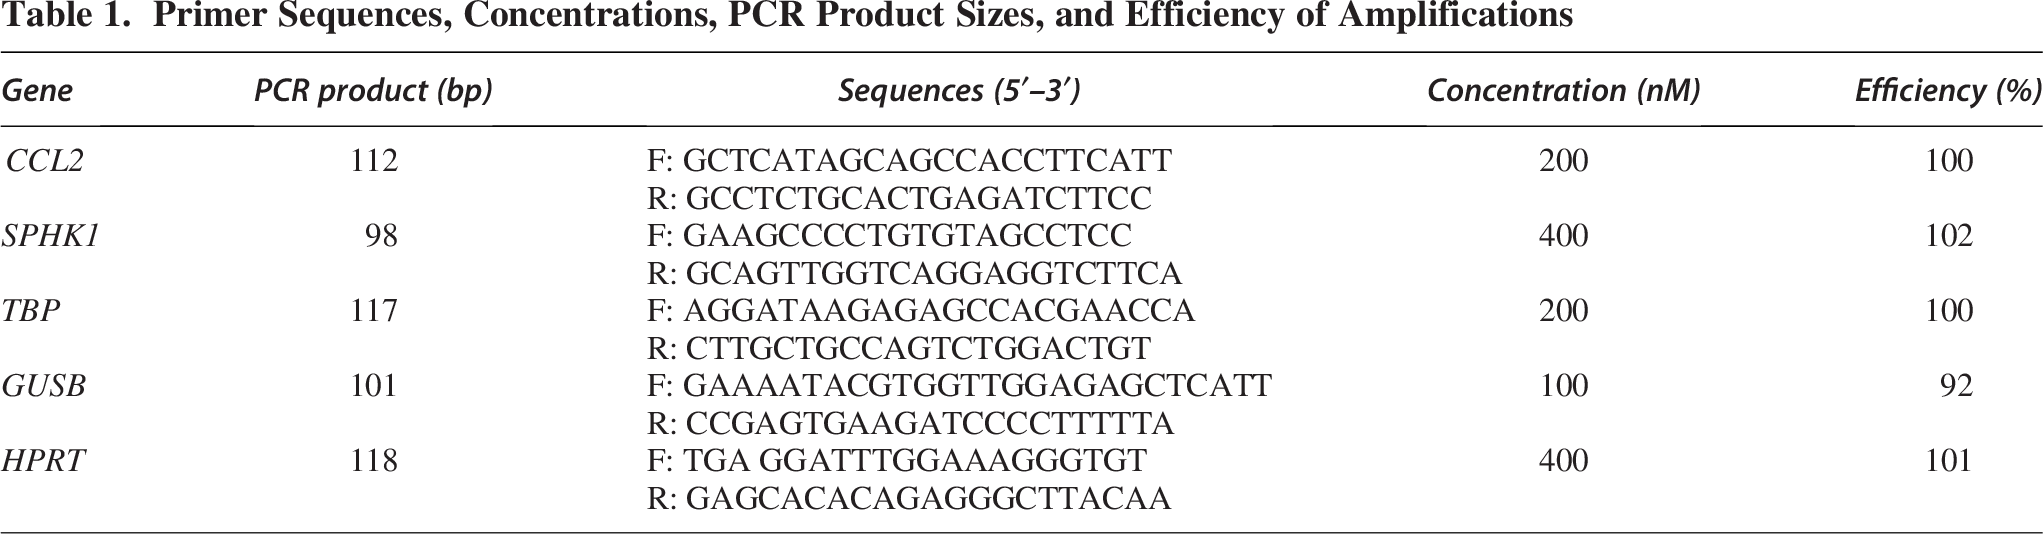
Expression levels of CCL2 and SPHK1 were quantified in an expanded series comprising 22 TBI and 20 controls samples by quantitative real-time PCR (RT-qPCR) using Maxima SYBR Green Master Mix (Thermo Fisher Scientific) on an ABI Prism 7500 Real-Time PCR System (Thermo Fisher Scientific). Three reference genes (HPRT, GUSB, and TBP) were used to normalize transcript levels. 16 The reactions were performed in duplicate and repeated when the standard deviation was above 0.4. Gene expression levels were calculated by the equation 2−ΔCt, where ΔCt denotes the Ct of the analyzed gene minus the geometric mean of the reference genes. Primer sequences and concentrations and amplification product sizes and efficiency are presented in Table 1.
Primer Sequences, Concentrations, PCR Product Sizes, and Efficiency of Amplifications
Immunohistochemistry
The protein expression levels of CCL2 and SPHK1 were analyzed by immunohistochemistry using the Novolink Polymer Detection System kit (Leica Biosystem). Rabbit polyclonal primary antibodies, anti-MCP1 (CCL2; ab73680, lot GR3272564-1, 1:100), and anti-SPHK1 (ab260073, lot GR3319187-5, 1:400) were from Abcam (Waltham, MA). The reaction was developed using 3,3′-diaminobenzidine (DAB), and nuclei were counterstained with Harris hematoxylin. Digital photomicrographs were captured with 400x magnification. Background illumination was normalized through NIS-Elements Viewer software (Nikon Instruments, Tokyo, Japan) to guarantee a uniform neutral color in the background. The intensity of immunopositivity was analyzed in the captured images by Colour Deconvolution plugin for ImageJ software (NIH, Bethesda, USA). 17
Statistical analyses
The Kolmogorov–Smirnov test was applied to test the normality of the distribution of the TBI and control groups. Data from both groups were compared using the Mann–Whitney test. Correlation between gene expression values was assessed using the Spearman correlation test for the RT-qPCR data and the Pearson correlation method for the transcriptome data, and results were plotted using the corrplot package in R. Discrimination of variables was calculated by the receiver operating characteristic (ROC) curve utilizing area under the curve (AUC) and asymptotic significance. The Mann–Whitney test was applied to compare the expression levels of the main regulated genes between patients with better outcomes (GCS > 8, survivors) and those with worse outcomes (GCS ≤ 8, deceased). Statistical significance was considered for p < 0.05. Analyses were performed using IBM SPSS Statistics 21 for Windows (IBM Corp) and GraphPad Prism version 5.02.
Results
Clinical characteristics
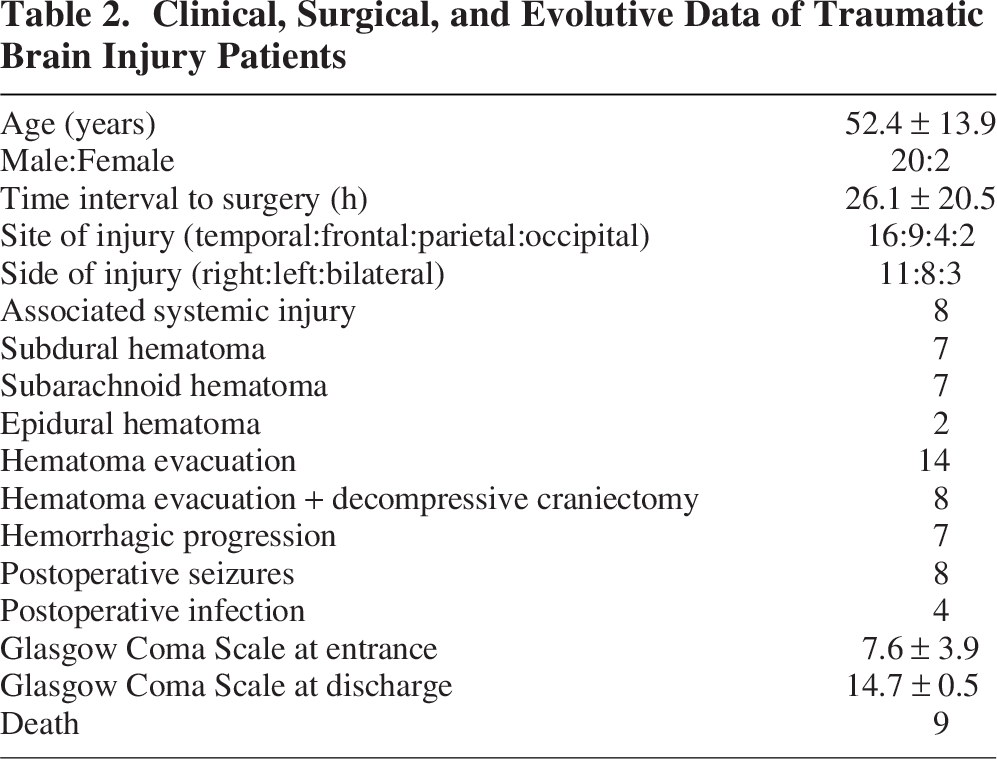
Samples from 22 patients with severe TBI and 20 autopsy controls (CTL, 16 males) were enrolled in the study. TBI’s clinical data are outlined in Table 2. No corticosteroids or other nonsteroidal anti-inflammatory drugs were administered to TBI patients, in accordance with the local neurotrauma protocol. Ten male cases were selected from both the TBI and CTL groups for the exploratory phase for RNASeq analysis. All cases were analyzed for the validation phase.
Clinical, Surgical, and Evolutive Data of Traumatic Brain Injury Patients
Transcriptomic analysis
A total of 13,067 transcripts with ensemble gene IDs were detected by RNA-Seq analysis, including 5,106 differentially expressed genes (DEG) in TBI compared with CTL (2,508 genes downregulated and 2,598 genes upregulated) for adjP ≤ 0.05. When filtering by logFC ≥ |1|, DEGs consisted of 291 downregulated genes and 553 upregulated genes.
Enrichment of TBI downregulated genes for ion transport and synaptic organization
The downregulated genes revealed enrichment for the top 10 Gene Ontology (GO) biological processes (BP) with p value <2.3 × 10⁻³ and false discovery rate (FDR) <2.1 × 10⁻⁴, encompassing 73 genes, corresponding to ion transport (51 genes) and synapse assembly (22 genes) (Fig. 1A,B). Of these DEGs, 16 had logFC < −1.5, where synaptotagmin 2 (STY2), encoding for a synaptic vesicle membrane protein, playing a role as a calcium sensor in vesicular trafficking and exocytosis, presented the lowest logFC (−3.9) in TBI relative to CTL. Additionally, four members of the potassium voltage-gated channel (KCNS1, KCNA2, KCNA1, KCND2), three members of sodium voltage-gated channel (SCN1A, SCN4B, SCN8A), a metal cation transport mediator (CNNM1), a solute carrier predicted to present
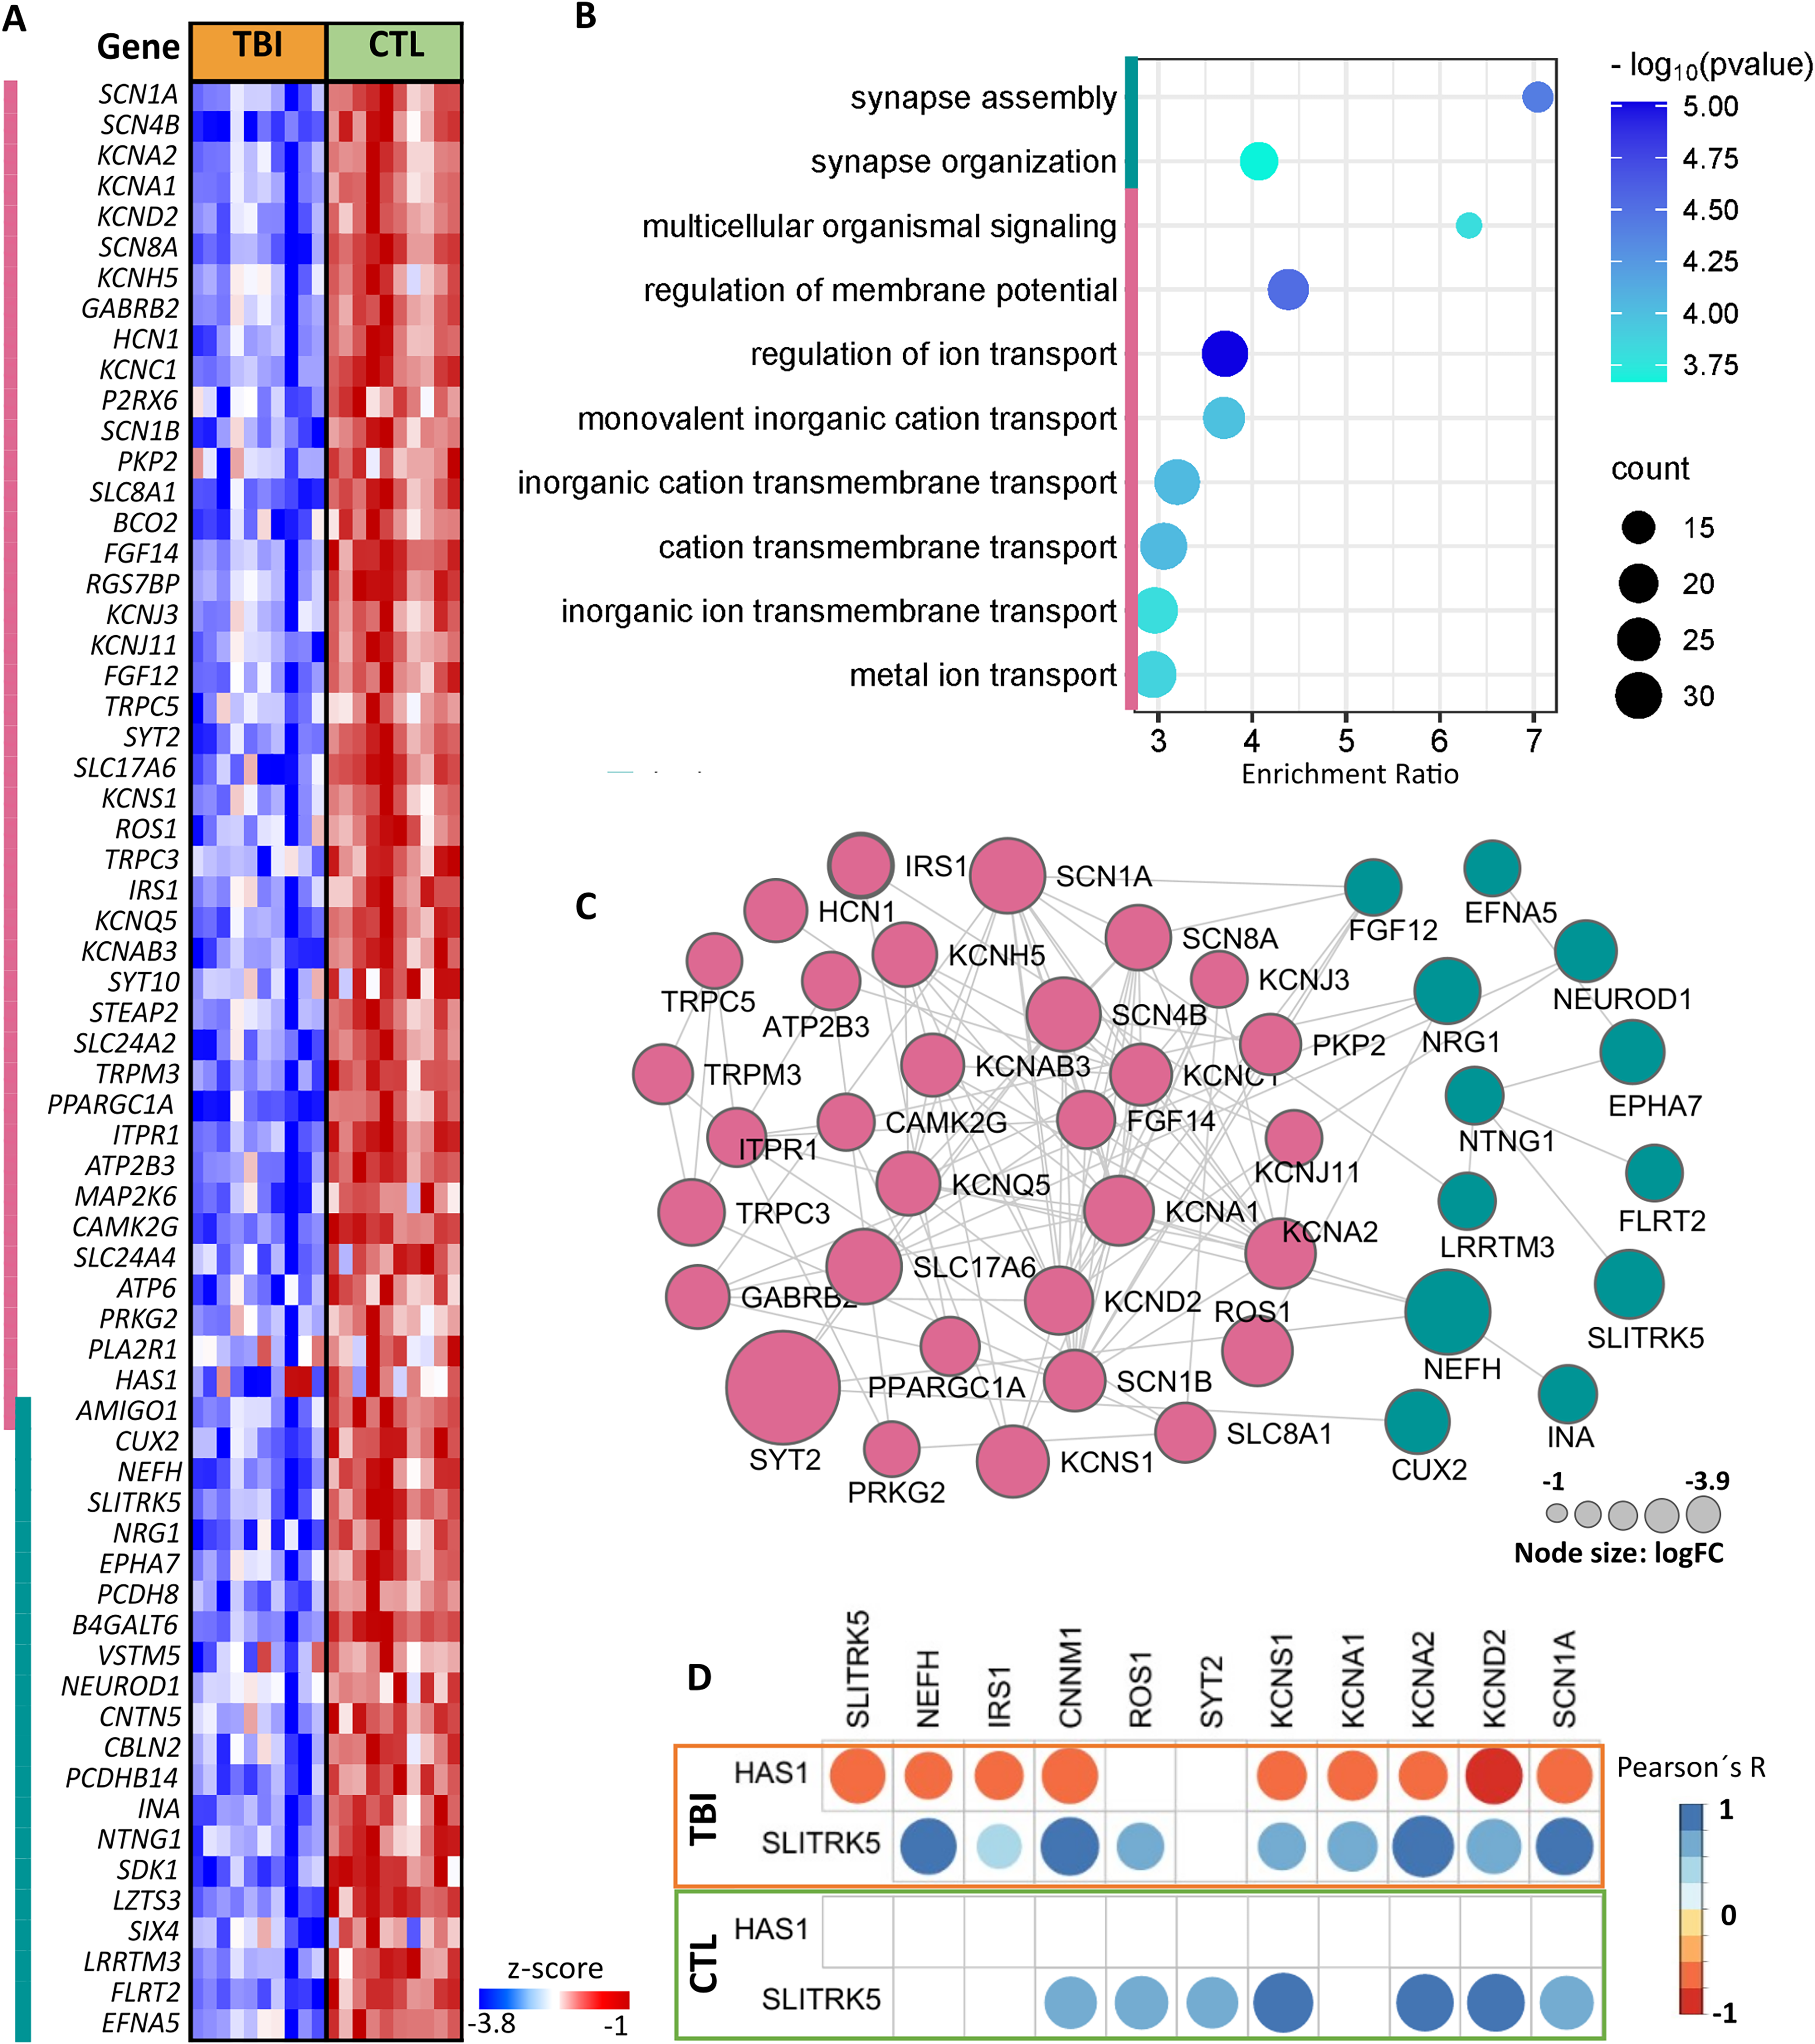
Enrichment analysis of downregulated transcripts in TBI compared with CTL using the Gene Ontology (GO) Resource.
Enrichment of TBI upregulated genes for inflammatory response, angiogenesis, exocytosis, response to wounding, and extracellular matrix reorganization
The upregulated genes were enriched for the top 10 GO BP with p-value and FDR < 2.2 × 10⁻¹⁶, encompassing 217 genes, corresponding to inflammation (133 genes), angiogenesis (78 genes), exocytosis (74 genes), response to wounding (69 genes), and extracellular matrix (ECM) organization (50 genes) (Fig. 2A,B). Among them, 79 had logFC > 1.5, and sets of DEGs were exclusively related to inflammatory response (FOS, IL1R1, IL1R2, IL1RN, RELB, GPR68, TNFRSF11A), to angiogenesis (NGFR, CLIC4, SHB, ROBO4), to response to wounding (INHBA, HBEGF, MAG, ZFP36, PLLP), and to ECM organization (LAMB3, COL6A2, SERPINH1, NFKB2). Interestingly, gene coding for the serpin family E member 1 (SERPINE1), the principal inhibitor of fibrinolysis through inhibition of tissue plasminogen activator (tPA) and urokinase (uPA), had the highest logFC (3.72). Moreover, the upregulated genes were highly and significantly associated, as demonstrated by PPI analysis (Fig. 2C), particularly the CCL2 associated not only with genes related to inflammatory response as expected, but also with genes related to angiogenesis, exocytosis, ECM, and response to wounding. Notably, CCL2 expression was strongly and uniquely correlated to SPHK1 expression in TBI samples (r = 0.84, p = 0.002, Pearson’s correlation test), but not in CTL samples (Fig. 2D). Additionally, ITGA5 expression level were significantly higher in TBI patients with worse outcomes (GCS ≤ 8, deceased) compared with those with better outcomes (GCS > 8, survivors), with p = 0.0381.
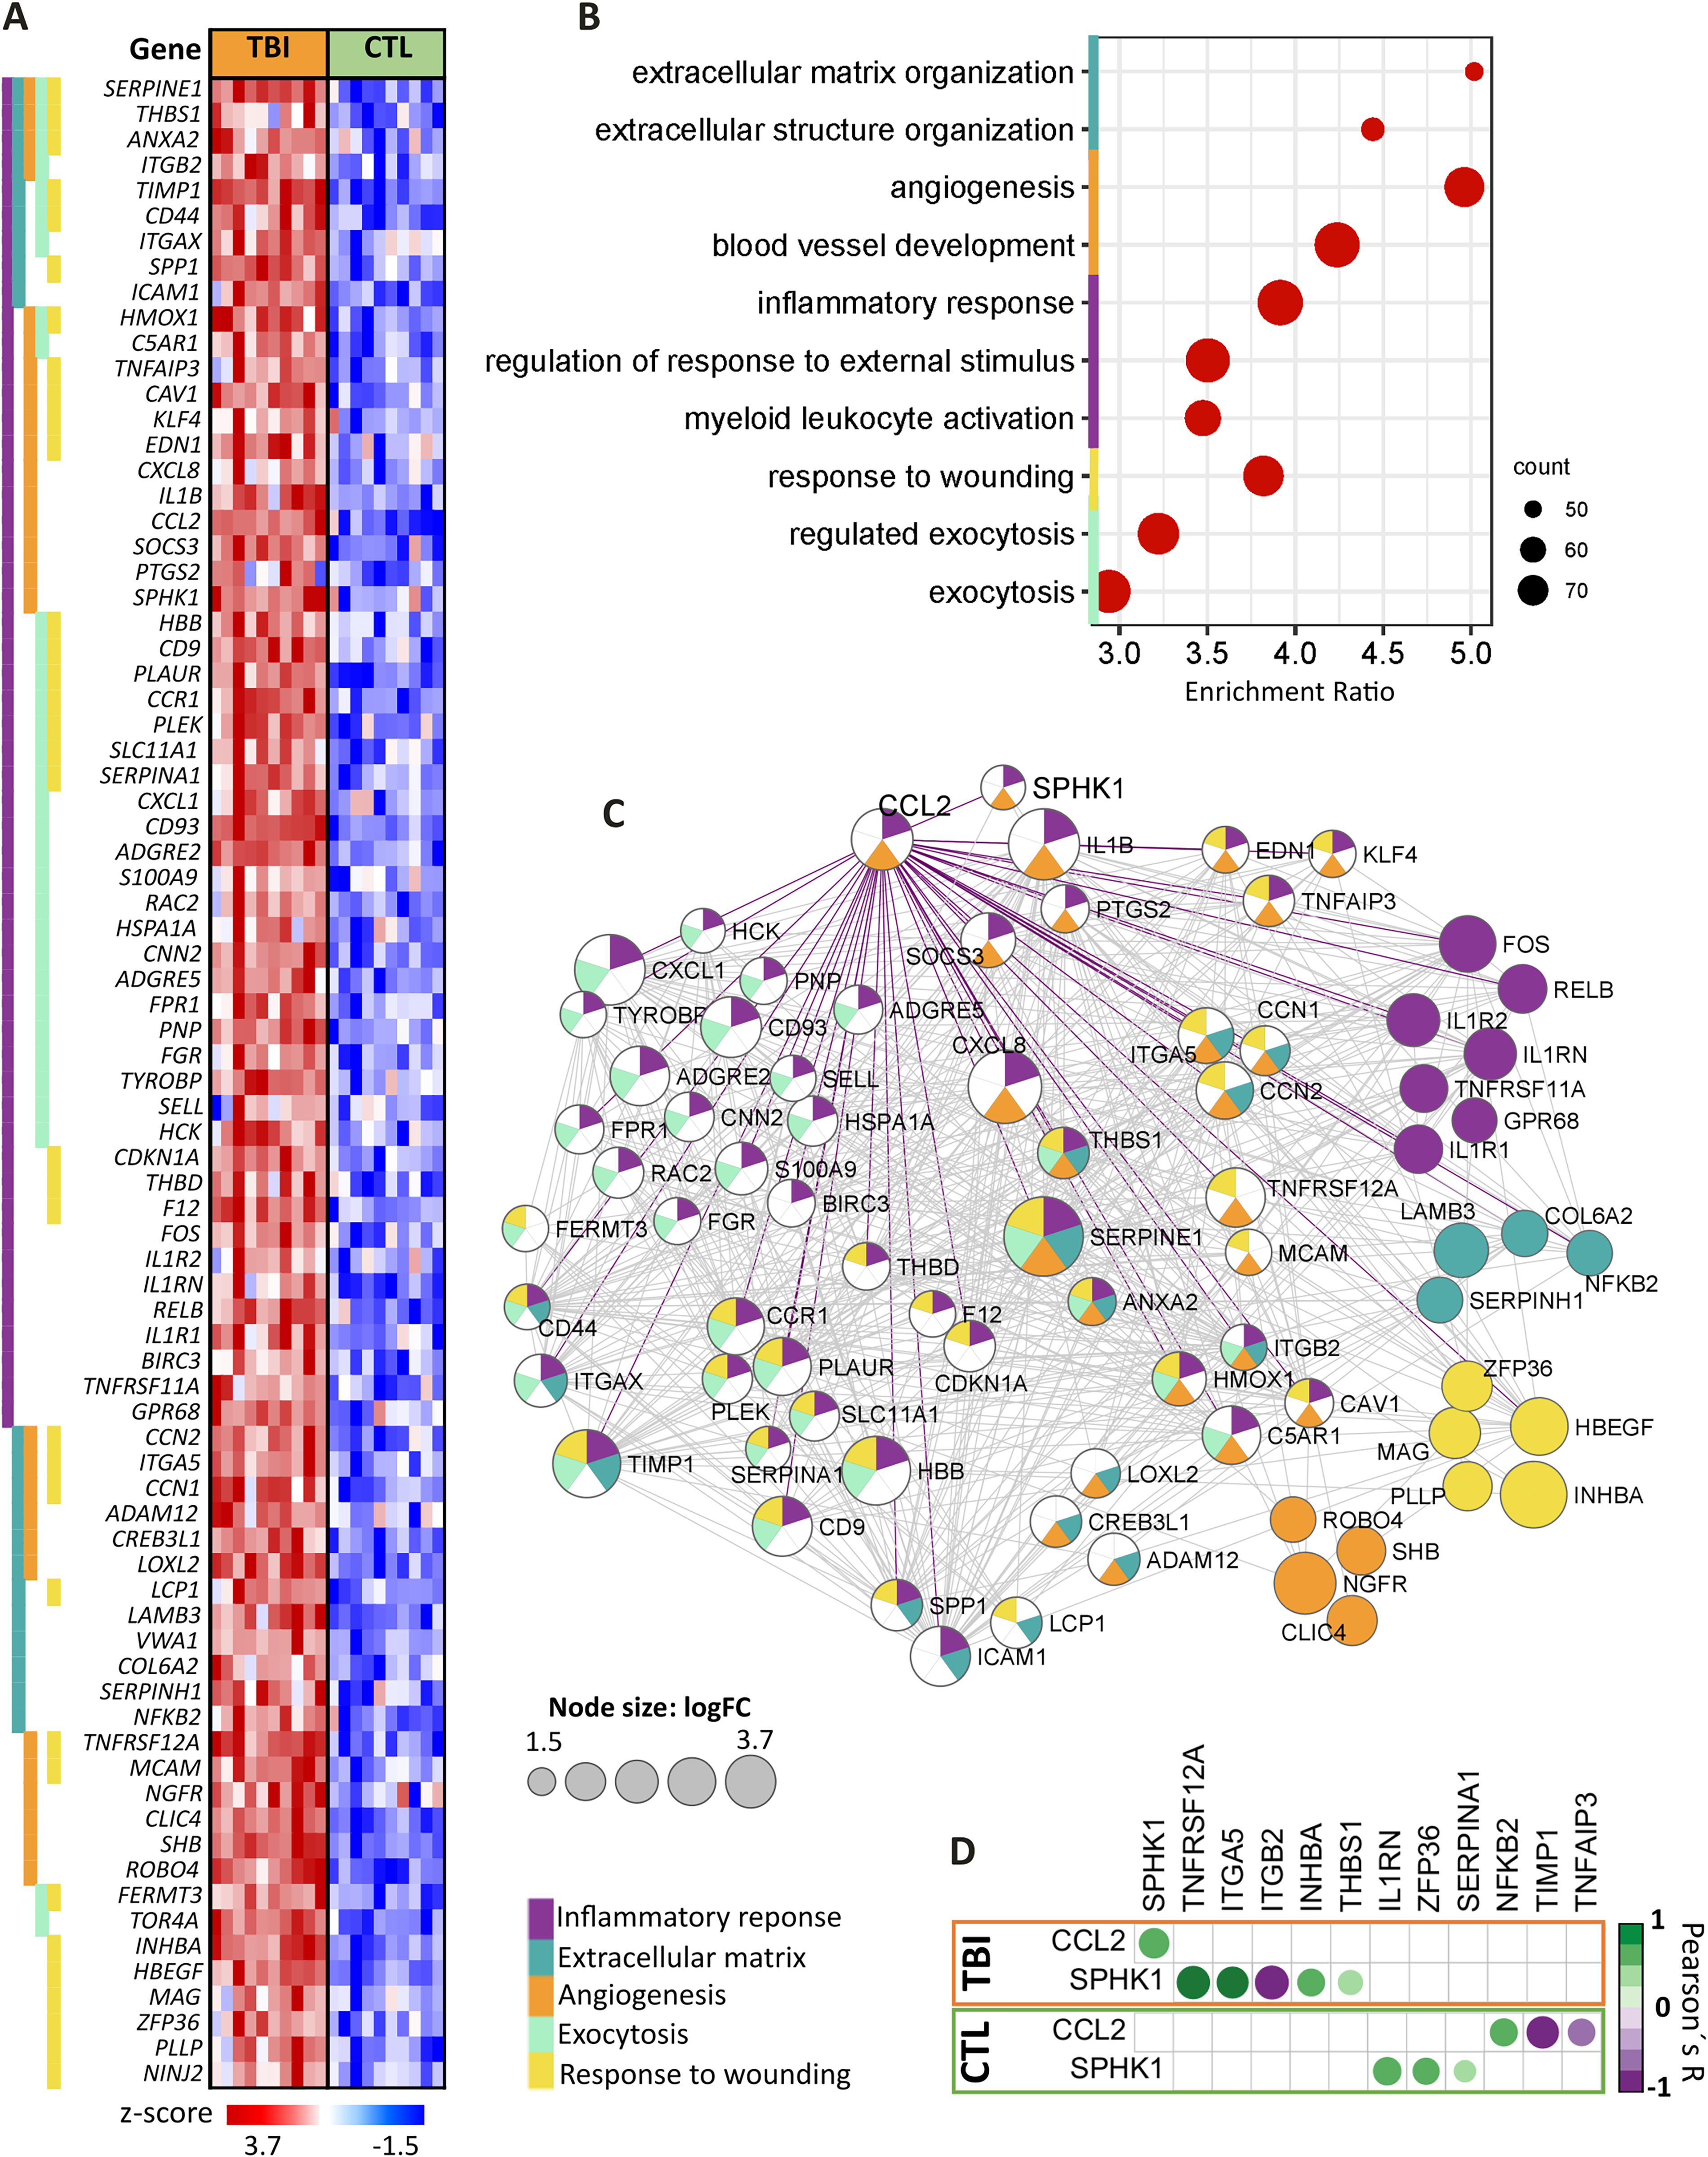
Enrichment analisys of upregulated transcripts in TBI compared with CTL using the Gene Ontology (GO) resource.
Enriched signaling pathways in TBI
Using the hallmarks database by GSEA revealed signaling pathways enriched with DEGs with logFC > 1.5 for: TNFα-NFκB; IL6-JAK-STAT, cholesterol homeostasis, inflammatory response, TGFβ, epithelial–mesenchymal transition (EMT), coagulation, apoptosis, p53, and angiogenesis (Fig. 3A). Notably, genes coding for several members of the TNF-receptor superfamily were identified (TNFRSFs 1B, 11A, 12A, 10A, 10D, and 16). Additionally, several genes coding for ligands (CXCL1, CXCL8, CCL2, IL1B, IL1RN, S100A9, HBEGF, and BDNF); membrane receptors (CCR1, IL1R1, IL1R2, CSF3R, PLAUR, C5AR1); integrins (ITGB2, ITG5, ITGAX); genes related to pro-inflammatory response (TNFAIP3, PTGS2, BCL2A1); angiogenesis and vascular tone (SERPINE1, EDN1, HMOX, and TIMP1); apoptosis (PMAIP1); proliferation/survival (SOCS3, CDKN1A, and G0S2); EMT involved in actin organization of cytoskeleton (RAC2, LCP1); and coagulation (F12, THBD) were highlighted.
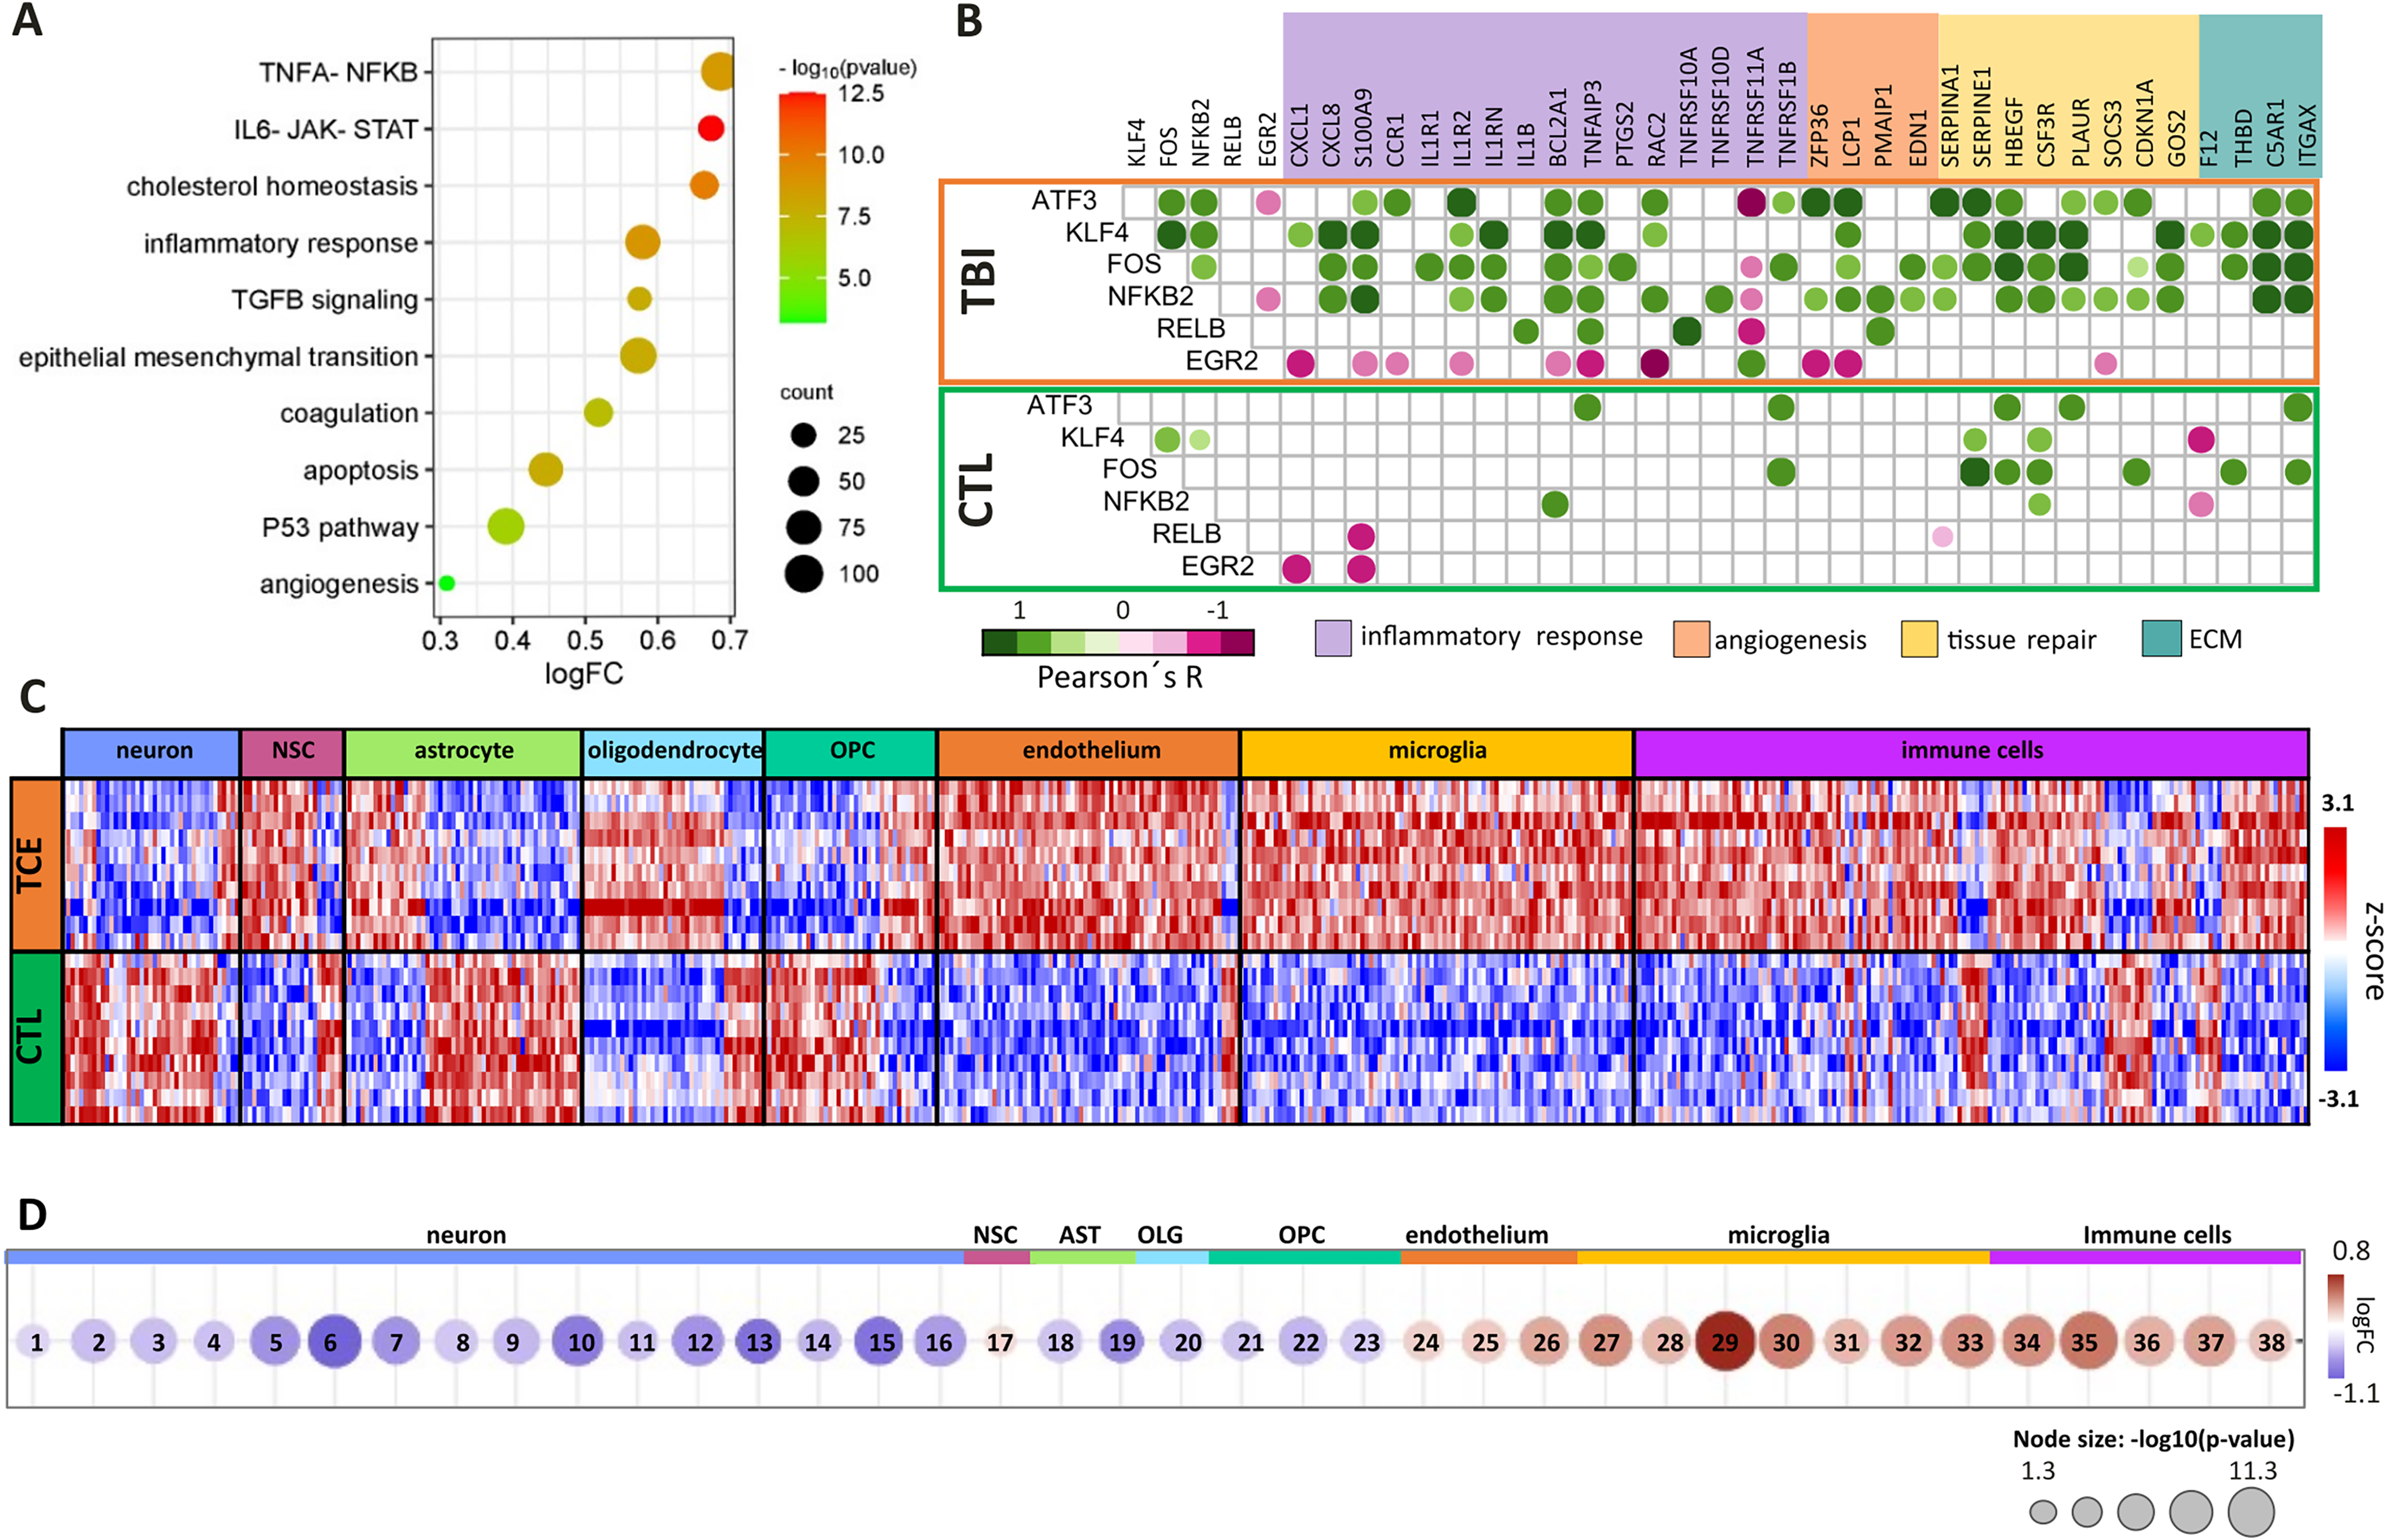
Enrichment analisys of upregulated genes through Hallmarks in GSEA platform
Interestingly, genes coding for six transcription factors, FOS, NFκB2, RELB, KLF4, ATF3, and EGR2, were significantly correlated with the upregulated genes in these pathways, in striking contrast with the poor correlation network observed in CTL (Fig. 3B). In TBI, FOS expression, a transcription factor quickly induced by extracellular stimuli and considered an immediate early gene, was positively correlated with PLAUR expression, a gene encoding for the urokinase plasminogen activator receptor (r = 0.9, p = 0.0003). Moreover, in TBI samples, FOS expression was also positively correlated with expression of NFκB2, coding for the p100 subunit of nuclear factor kappa B, NFκB (r = 0.75, p = 0.012); with KFL4, a member of the family of zinc finger transcription factors (r = 0.73, p = 0.017); and with ATF3, a member of the cAMP response element-binding family (r = 0.80, p = 0.006). In turn, KFL4 expression was positively (r > 0.9) and significantly (p < 0.0003) correlated with the expression of another four DEGs: CXCL8 (IL8), IL1RN, HBEGF, and CSF3R.
Additionally, ATF3 expression was positively correlated with expression of IL1R2 (r = 0.90, p = 0.0004) (Fig. 3B).
Neuronal-, astroglial-, and oligodendroglial-related genes were downregulated, and endothelial-, microglial-, and immune cell-related genes were upregulated in TBI
The expression scores of genes characterized as excitatory and inhibitory neurons, interneurons, astrocytes, and oligodendrocytes by Zhong, Fan, and Descartes were downregulated in TBI (Fig. 3C). These findings are consistent with the primary pathology of neuronal and glial cell death as a direct consequence of physical and mechanical impact on the brain. Interestingly, the score for NSC-related genes was slightly upregulated, indicating a concomitant regenerative/repair-promoting cell activation. Similarly, genes related to endothelium, microglia, and immune cells had a positive score, corroborating an angiogenic response, together with an inflammatory response including the activation of the resident immune cells of the brain, microglia, and recruitment of peripheral immune cells such as macrophages, dendritic cells, T and B cells within the injured tissue (Fig. 3D). The microglia score for the set of genes described by Fan was the most positive for activated microglia markers, including CCL3L1, TNF, IL1B, and NFκBIZ, consistent with the recently reported microglia expression stratification by single-cell analysis (data not shown). 18
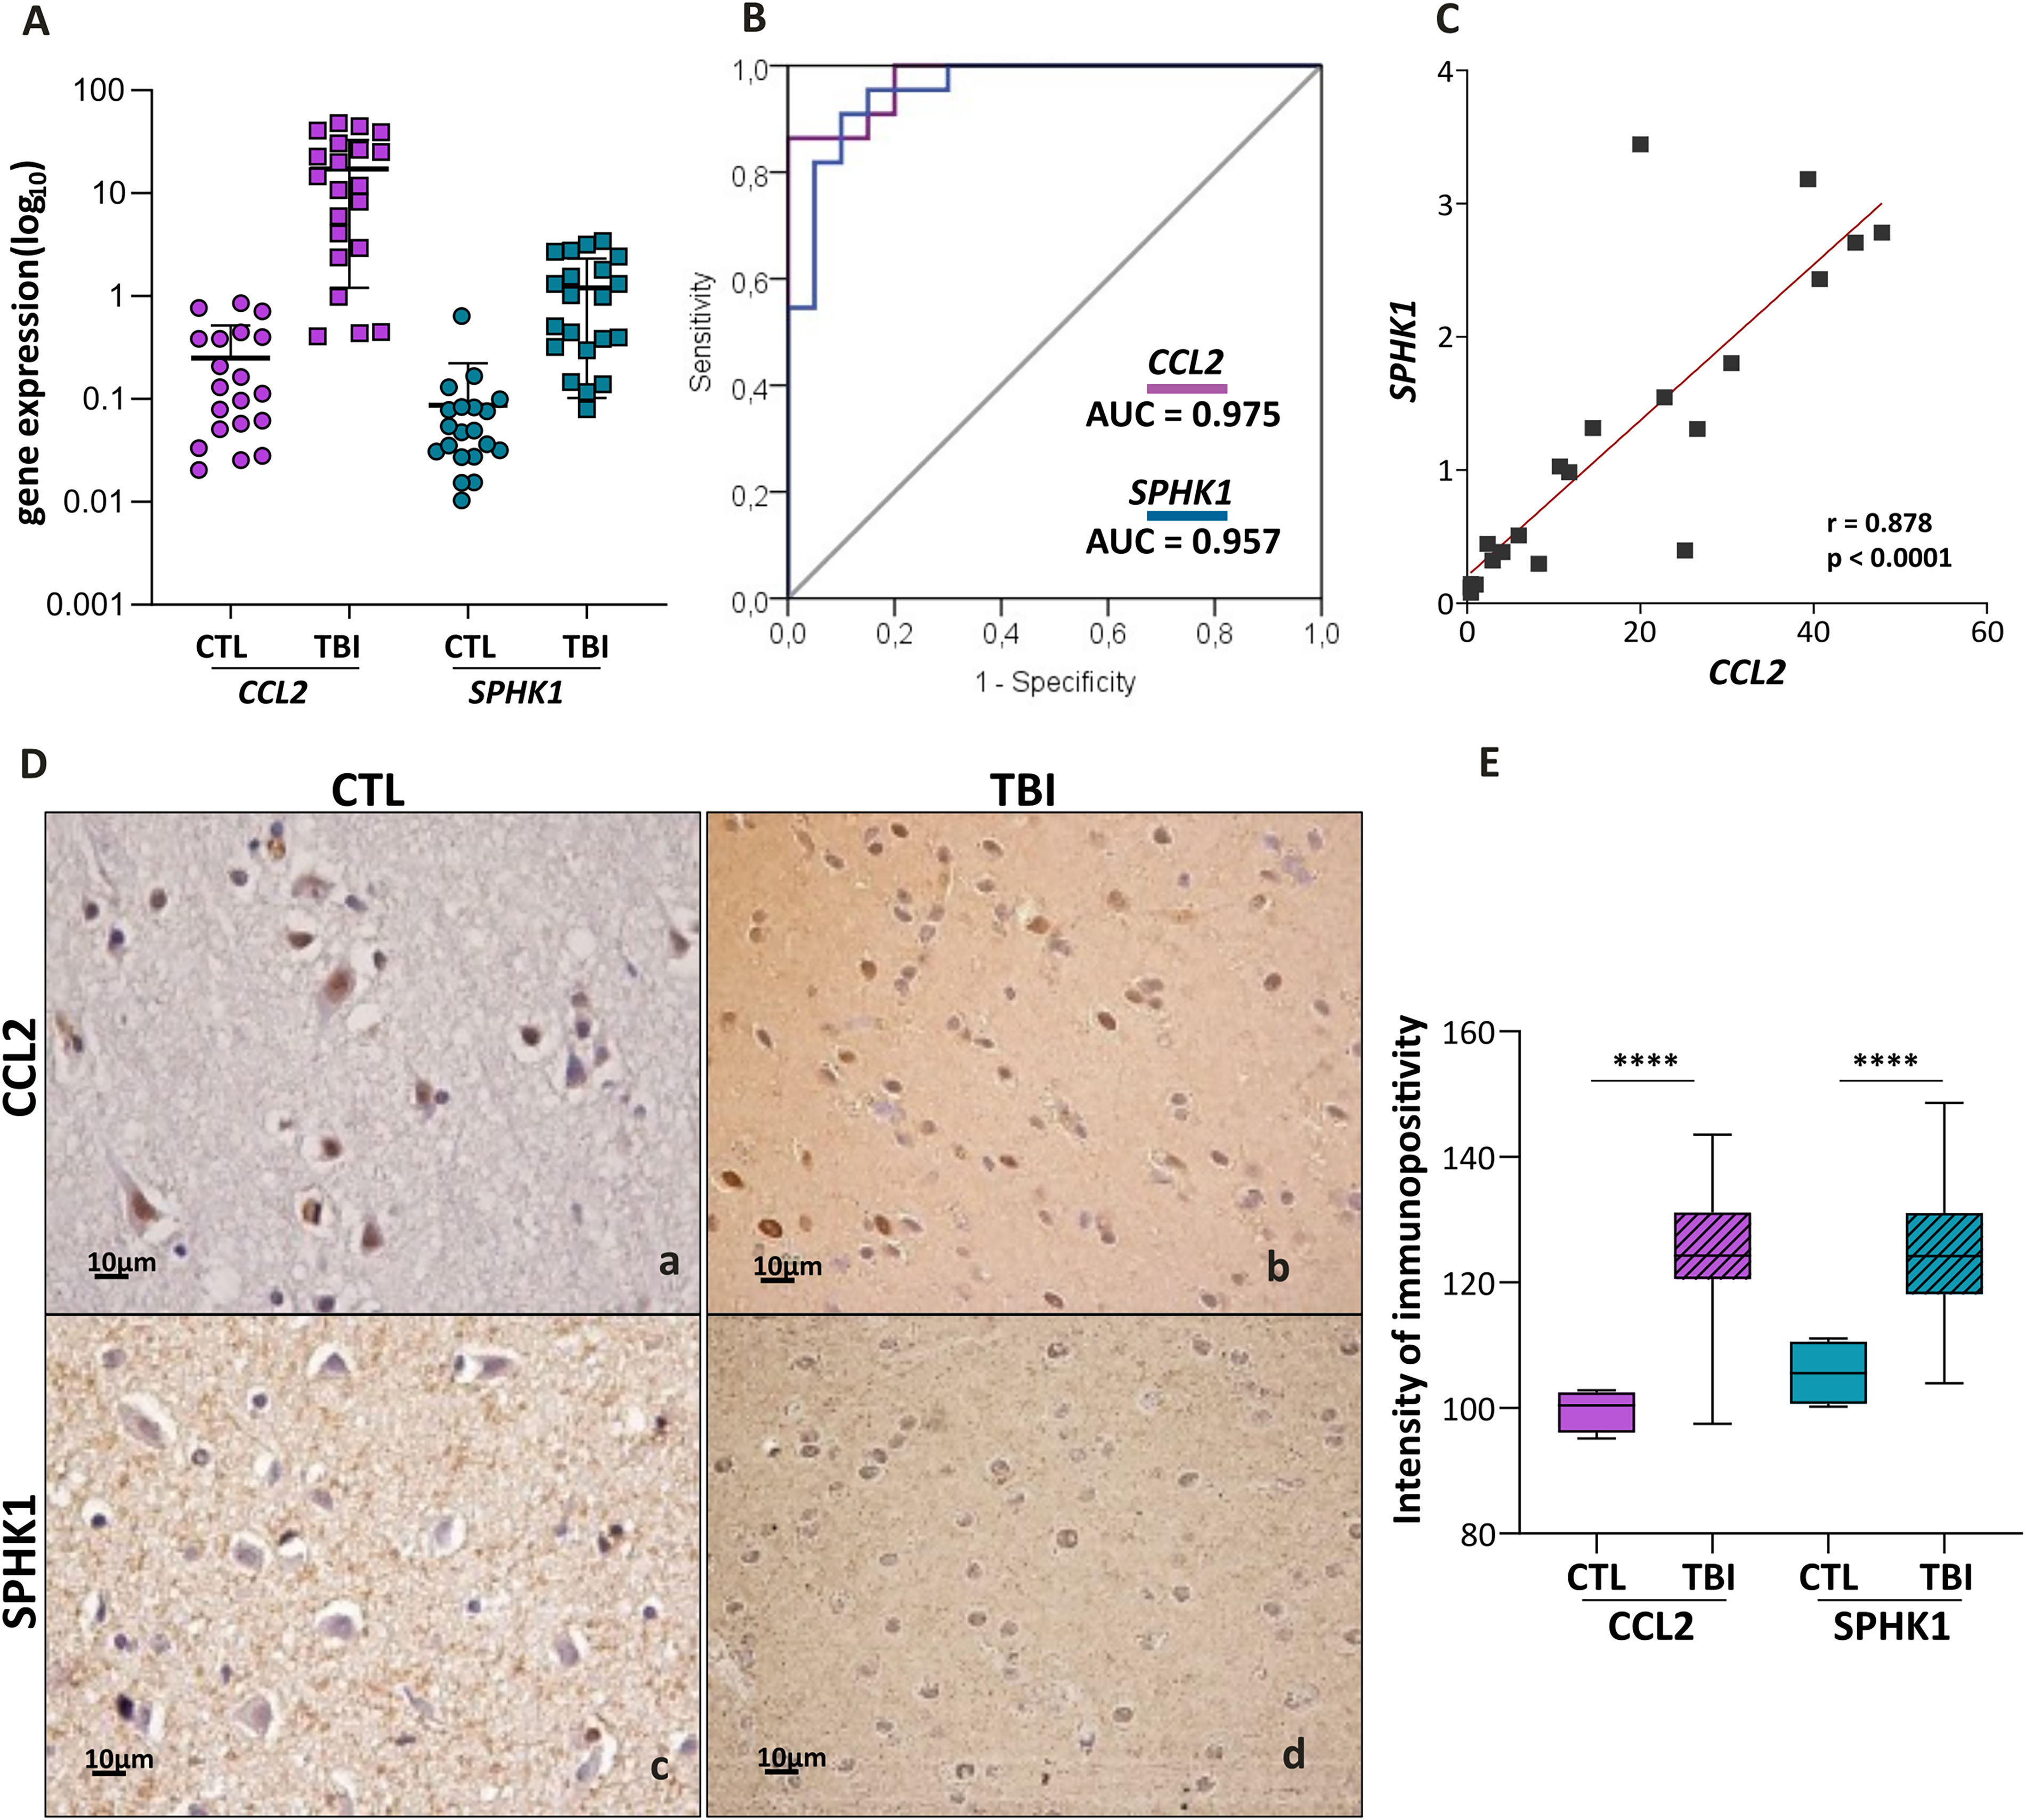
Upregulation of CCL2–SPHK1 axis correlates inflammation with angiogenesis
An exclusive significant correlation was observed in the TBI transcriptomic data between CCL2-related neuroinflammation and SPHK1-related angiogenesis (Fig. 2D). The upregulation of these targets identified in the transcriptomics was validated at gene and protein expression levels in an expanded series of 22 TBI cases. Significantly higher CCL2 and SPHK1 expressions were confirmed in TBI compared with CTL (p < 0.0001, Mann–Whitney) (Fig. 4A,D). The ROC curves of CCL2 and SPHK1 mRNA expressions exhibited high sensitivity and specificity for differentiating TBI from CTL, with an AUC of 0.975 for CCL2 and 0.957 for SPHK1 (Fig. 4B), and their expressions were highly correlated (r = 0.878, p < 0.0001) (Fig. 4C), while no correlation was observed among control samples (r = 0.3669, p = 0.115).
Discussion
Understanding the mechanisms involved in the pathophysiology of TBI is essential for the development of new treatment approaches to improve clinical outcomes.
The TBI transcriptome enrichment analysis revealed a predominant neuronal dysfunction with downregulation of genes coding for various transporters, ion channels, proteins associated with synaptic membranes, neurite formation, and axonal lengthening. Additionally, the downregulation of genes related to intracellular transport to axons and dendrites (NEFH), neurotrophic support (SLITRK5), 19 synapse membrane regulation (SYT2), 20 and synaptogenesis (IRS1) 21 further corroborated the altered neuronal network in TBI.
In TBI, there was a notable decrease in HAS1 expression, essential for synthesizing hyaluronan (HA), which is crucial for ECM hydration and support to neuronal activity. HA and HA-linked proteins regulate inflammation and tissue repair by managing inflammatory cell recruitment, cytokine release, cell migration, and stimulating endothelial cell tubulogenesis. 22 Treatment with HA tetrasaccharide significantly enhanced axonal regeneration and improved motor function recovery in an animal model of spinal cord injury. 23 Conversely, disruption of HA-based ECM leads to astrocyte proliferation and brain scarring, contributing to focal epilepsy after brain injury. 24 In this cohort, HAS1 expression negatively correlated with genes related to ionic homeostasis, metabolism, metal transporters, and neurite outgrowth, highlighting the importance of controlling HA synthesis for tissue repair after TBI. 25
Upregulated genes in TBI were enriched for neuroinflammation, essential for containment of damage and healing, although prolonged inflammation can cause secondary damage. 7 A balanced pro- and anti-inflammatory response is needed for recovery. Significant upregulation of genes coding for receptors (CCR1, IL1R1, IL1R2) and ligands (CXCL1, CCL2, CXCL8, IL1RN, IL1B) was observed in TBI. IL1R1 plays a role in regulating inflammation and neuromodulation, influencing neural circuits of a specific subpopulation of neurons. 26 IL1β, released by the inflammasome, triggers the inflammatory response in TBI, and its activity can be modulated by ILR2 and IL1RN. 27 The anti-inflammatory effect of IL1RN was demonstrated in a murine model of TBI, showing reduced tissue damage after 14 weeks of neurotrauma. 28 CCL2 and CXCL8 (IL8) are associated with post-traumatic brain damage and poor prognosis but also promote neural survival and protection against apoptosis. 29 CCL2 attracts neural progenitors to the injury site, contributing to tissue repair. 30 Therefore, the upregulated interleukins, chemokines, and their receptors may help delimit tissue damage and promote an environment conducive to tissue repair.
Interestingly, several other upregulated receptors, including several genes coding for members of the TNF receptor superfamily, may also participate in a restorative response in TBI. TNFRSF12A (FN14) is a receptor for TWEAK, involved in apoptosis and tissue repair by regulating the fate of progenitor cells. 31 TNFRSF11A (RANK) activates NFκB, PI3K/AKT, and MAPK signaling pathways in microglia, inducing immunosuppressive and reparative cytokines and growth factors like IL4, IL10, TGFβ, and IGF1, 32 aiding neuroprotection. TNFRSF10A, a death-signaling receptor, acts through TRAIL, but its effect may be counteracted by TNFRSF10D, a decoy receptor that inhibits TRAIL-induced apoptosis. 33 TNFR2 (or p75, coded by TNFRSF1B) has a neuroprotective role by accumulating oligodendrocyte progenitors for remyelination. 34 NGFR, coded by TNFRSF16, binds to NGF and BDNF, regulating cell survival, proliferation, and differentiation via NFκB, JNK, and ceramide signaling pathways. 35 Upregulated TNF receptors support neuroprotection during the acute TBI. TNFRSF12A expression is correlated to SPHK1 expression, which codes for a protein that phosphorylates sphingosine to sphingosine-1-phosphate (S1P), a lipid mediator regulating vascular integrity and angiogenesis. 36 SPHK1 expressions correlated with CCL2 expression, suggesting associations with the TNF-NFκB neuroinflammatory pathway and angiogenesis. In a model of cerebral ischemia, SPHK1 produced by microglia regulated brain endothelial responses, leading to angiogenesis. SPHK1 can also induce increased expression of CCL2 in macrophages, further corroborating the link between inflammatory and angiogenic responses. 37
In TBI, members of the complement and plasminogen activation systems were upregulated. The G protein-coupled complement receptor, coded by C5AR1, promotes secondary injury by calcium influx when binding to C5a, but also aids neuronal repair and regeneration postinjury by inducing pluripotency and proliferation of neural progenitor cells. 38 Similarly, uPAR receptor (coded by PLAUR) is involved in axonal regeneration after acute ischemic injury by promoting axonal repair through β1 integrin activation. 39
INHBA activates the TGFβ cascade in TBI, aiding tissue regeneration through SMAD2/3 signaling. INHBA expression increases within a few hours of injury, promoting regenerative cell proliferation from G0/G1 to S phase. 40
Activation of inflammatory, angiogenenic, and neuroprotective pathways in TBI was associated with upregulation of six transcription factor genes: FOS, NFKB2, RELB, KLF4, ATF3, and EGR2. FOS, induced by extracellular stimuli within 3 h to 3 days after brain injury, is linked to pro-inflammatory effects in microglia and reactive gliosis and scar formation in astrocytes. 41 NFκB2 and RELB regulate inflammatory, cell survival, and neuronal plasticity-related gene expressions, with NFκB2 inducing pro-inflammatory cytokines and chemokines and RELB initiating anti-inflammatory genes, as CHI3L1 and NFKBIA. 42 RELB also mediates microglia and monocyte tolerances, important in the prevention of excessive brain damage. 43 KLF4 regulates neuronal differentiation and progenitor cell migration in developing cerebral cortex, 44 ATF3 is associated with axon regeneration and inflammatory processes, 45 and EGR2 controls RANKL upregulation and recruitment of inflammatory monocytes and dendritic cells to the brain. 46
Notably, ITGA5 expression levels were higher in TBI patients with worse outcomes, consistent with previous findings on ITGA5’s detrimental role in endothelial and neuronal cells in stroke. 47
Taken together, intricate signaling pathways of inflammatory response and wounding reaction were observed in the acute brain injury at the pericontusional region, near the contusional epicenter. New targets were identified that warrant exploring as candidate markers for monitoring secondary damages during brain tissue repair (Fig. 5). Besides the CXCR4/CXCR7 inflammatory axis, 48 the upregulated CCL2-SPHK1 axis requires in-depth study to enhance angiogenesis for optimized tissue repair after neurotrauma.
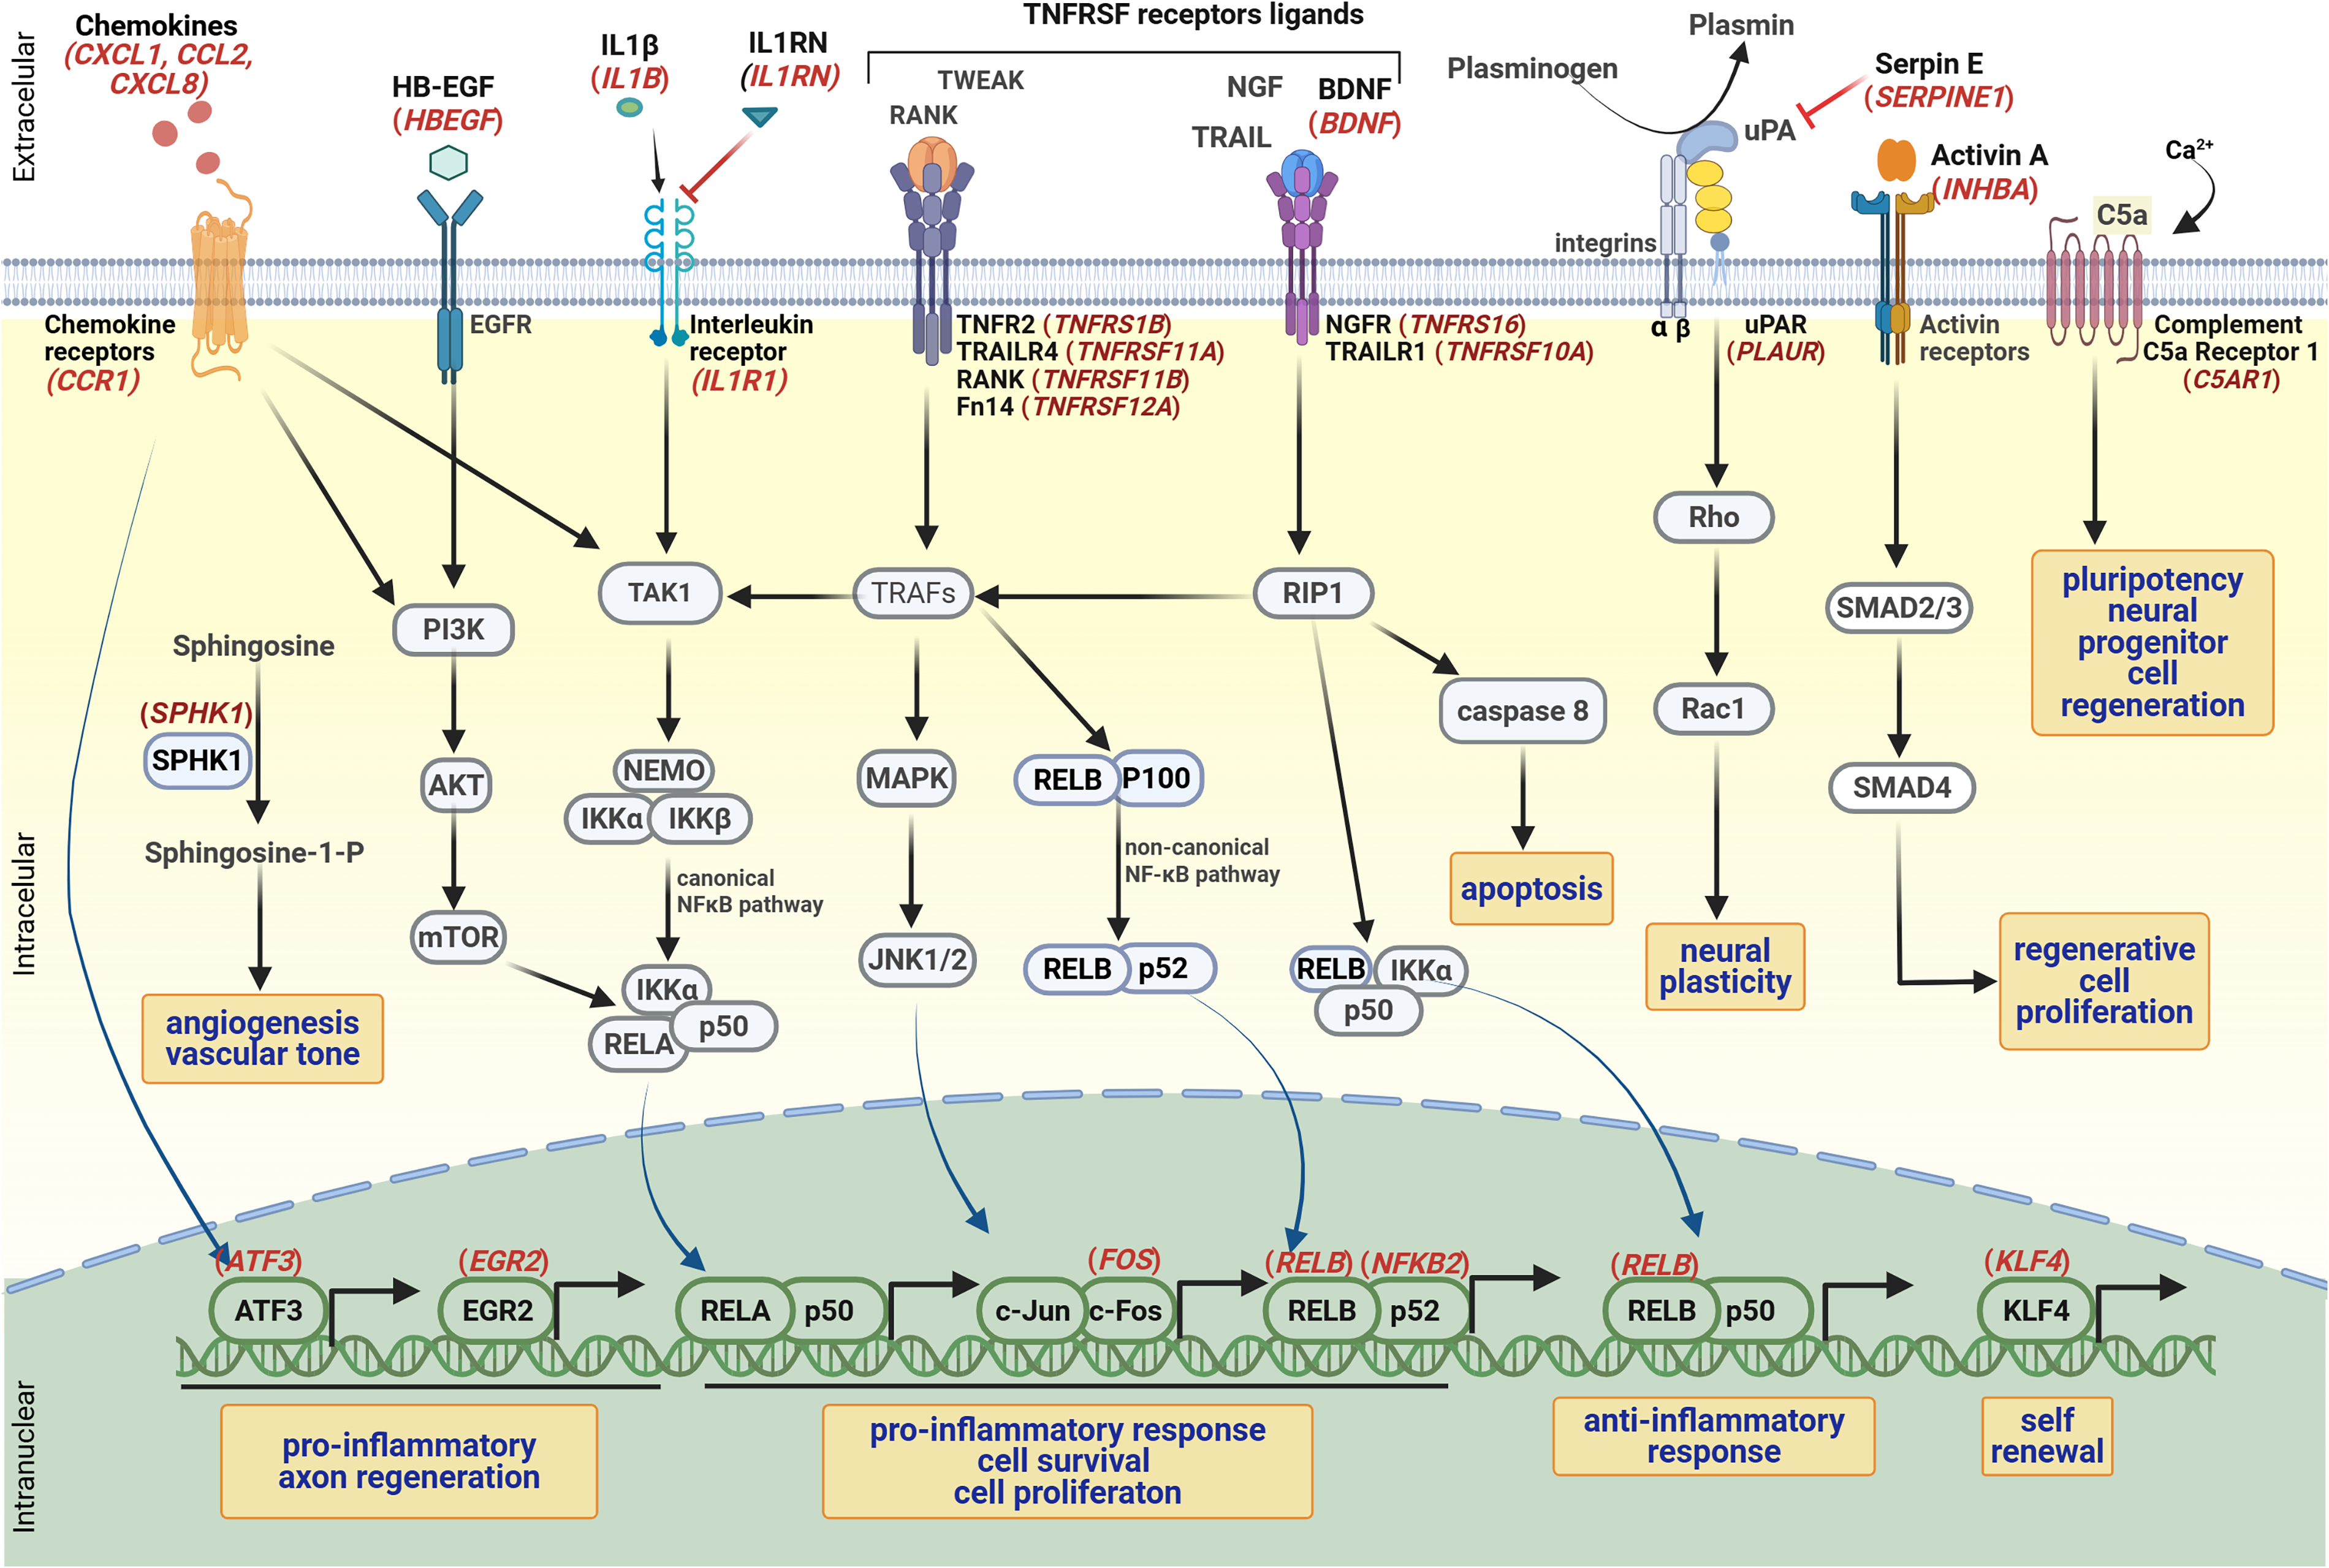
Activated signaling pathways in TBI, highlighting differentially expressed genes in TBI (logFC > 1.5).
Authors’ Contributions
A.S.M.O.: Data and biological sample collection, investigation, methodology, and writing—original draft. S.M.O.-S.: Methodology, supervision, and visualization. V.N.Y.: Neurosurgical investigation. A.M.L.: RNASeq raw data formal analysis. A.G.K.: Review and editing. P.R.S.: Methodology and investigation. S.G.C.: Methodology and investigation. I.F.M.: Methodology and investigation. W.S.P.: Conceptualization, investigation, and neurosurgical supervision. S.K.N.M.: Conceptualization, funding acquisition, investigation, visualization, supervision, and writing—review and editing.
Footnotes
Acknowledgments
The authors thank the Emergence and Neurosurgery Division of Hospital das Clinicas of University of Sao Paulo Medical School and also the SELA Facility Core of School of Medicine, University of Sao Paulo, for assistance with sequencing.
Author Disclosure Statement
A.S.M.O has nothing to disclose. S.M.O.-S. reports grants from National Council for Scientific and Technological Development (CNPq) and São Paulo Research Foundation (FAPESP) during the conduct of the study. V.N.Y. has nothing to disclose. A.M.L. has nothing to disclose. A.G.K. reports grants and nonfinancial support from National Institute for Health Research (NIHR), grants and nonfinancial support from School of Clinical Medicine, University of Cambridge, and grants and nonfinancial support from Royal College of Surgeons of England, during the conduct of the study. P.R.S. has nothing to disclose. S.G.C. has nothing to disclose. I.F.M. has nothing to disclose. W.S.P. reports grants and nonfinancial support from NIHR during the conduct of the study. S.K.N.M. reports grants from National Council for Scientific and Technological Development (CNPq) and São Paulo Research Foundation (FAPESP), during the conduct of the study.
Funding Information
This research was supported by Conselho Nacional de Pesquisa (CNPq) “Bolsa de Produtividade”: #304541/2020-6 (SKNM); Sao Paulo Research Foundation (FAPESP, grant #2020/02988-7; SKNM, SMOS); Coordenação de Aperfeiçoamento de Pessoal de Nível Superior-Brasil (CAPES/PROEX) grant #23038.018285/2019-21 (SKNM, SMOS), Fundação Faculdade de Medicina (FFM); and Faculdade de Medicina da USP (FMUSP).
Supplemental Material
References
Supplementary Material
Please find the following supplemental material available below.
For Open Access articles published under a Creative Commons License, all supplemental material carries the same license as the article it is associated with.
For non-Open Access articles published, all supplemental material carries a non-exclusive license, and permission requests for re-use of supplemental material or any part of supplemental material shall be sent directly to the copyright owner as specified in the copyright notice associated with the article.