
Abstract
Mild traumatic brain injury (mTBI) is a leading cause of sustained cognitive complaints in children. However, the TBI-related mechanisms underlying persistent cognitive symptoms including working memory (WM) dysfunction are not fully understood. Few pediatric studies of WM deficits in mTBI have taken advantage of the temporal and frequency resolution afforded by electromagnetic measurements. Using magnetoencephalography (MEG) and an N-back WM task, we investigated functional abnormalities in children with mTBI within a 3-week post-injury period. Children aged 8–15 years with mTBI (n = 60) and orthopedic injury (OI) controls (n = 37) from consecutive admissions to an emergency department were studied prospectively. MEG source-magnitude images were obtained for alpha (8–12 Hz), beta (15–30 Hz), gamma (30–90 Hz), theta (4–7 Hz), and delta (1–4 Hz) frequency bands. Compared with OI controls, children with mTBI showed decreased MEG signals (hypoactivity) across frequency bands in the proper WM network including dorsolateral prefrontal cortex (dlPFC), anterior cingulate cortex, and supramarginal gyrus (SMG), but over-recruitment with increased MEG signals (hyperactivity) in the frontal pole and ventromedial prefrontal cortex. The MEG activity from dlPFC and SMG regions also correlated with changes in symptom scores between 3-week and 3-month behavioral exams. This is the first pediatric study showing MEG hypoactivity from the WM proper network and over recruitment outside the WM network. One mechanism that may explain these novel findings could be the gamma-aminobutyric acid (GABA)-ergic inhibitory interneuron injury, which may cause disinhibition in the WM neural network, directly eliminating synchronized signals that are normally evoked by stimuli. This MEG study of abnormal MEG responses evoked by WM N-back stimuli provides a new functional imaging marker for pediatric mTBI.
Introduction
In the majority of individuals with mTBI, symptoms resolve within days post injury. 1 However, in a subset of individuals, post-concussive symptoms (PCSs) can persist for weeks to months.2,3 Persistent cognitive symptoms (e.g., working memory [WM], other executive functions, attention) are among the most commonly reported sequelae in children with mTBI4–6, and effective rehabilitation treatments are underdeveloped. Our study focused on an N-back task paradigm of WM 7 and its neural signature documented by magnetoencephalography (MEG) to potentially bridge the gulfs between symptoms, their underlying brain network mechanisms, and ultimately rational targeted interventions.
When mTBI causes problems with WM,8–10 the child experiences a disruption in the ability to maintain information in the face of competing stimuli and manipulate it in accord with current goals.11,12 Thus, WM is one of the fundamental mechanisms of executive functioning that mediates complex skills. The elemental, core neuroanatomical regions that participate in WM are illustrated in Figure 1 from Froudist-Walsh et al. 13 As highlighted in Figure 1, WM emerges from the bidirectional and reciprocal relationships between parietal and frontal lobes, along with subcortical areas, especially the thalamus and basal ganglia, all mediated by white matter connectivity. However, the critical WM regions shown in Figure 1 do not function in isolation, and like most complex behaviors, WM tasks activate and function in concert with a large-scale network of cortical regions, as also shown in Figure 1.12,15,16
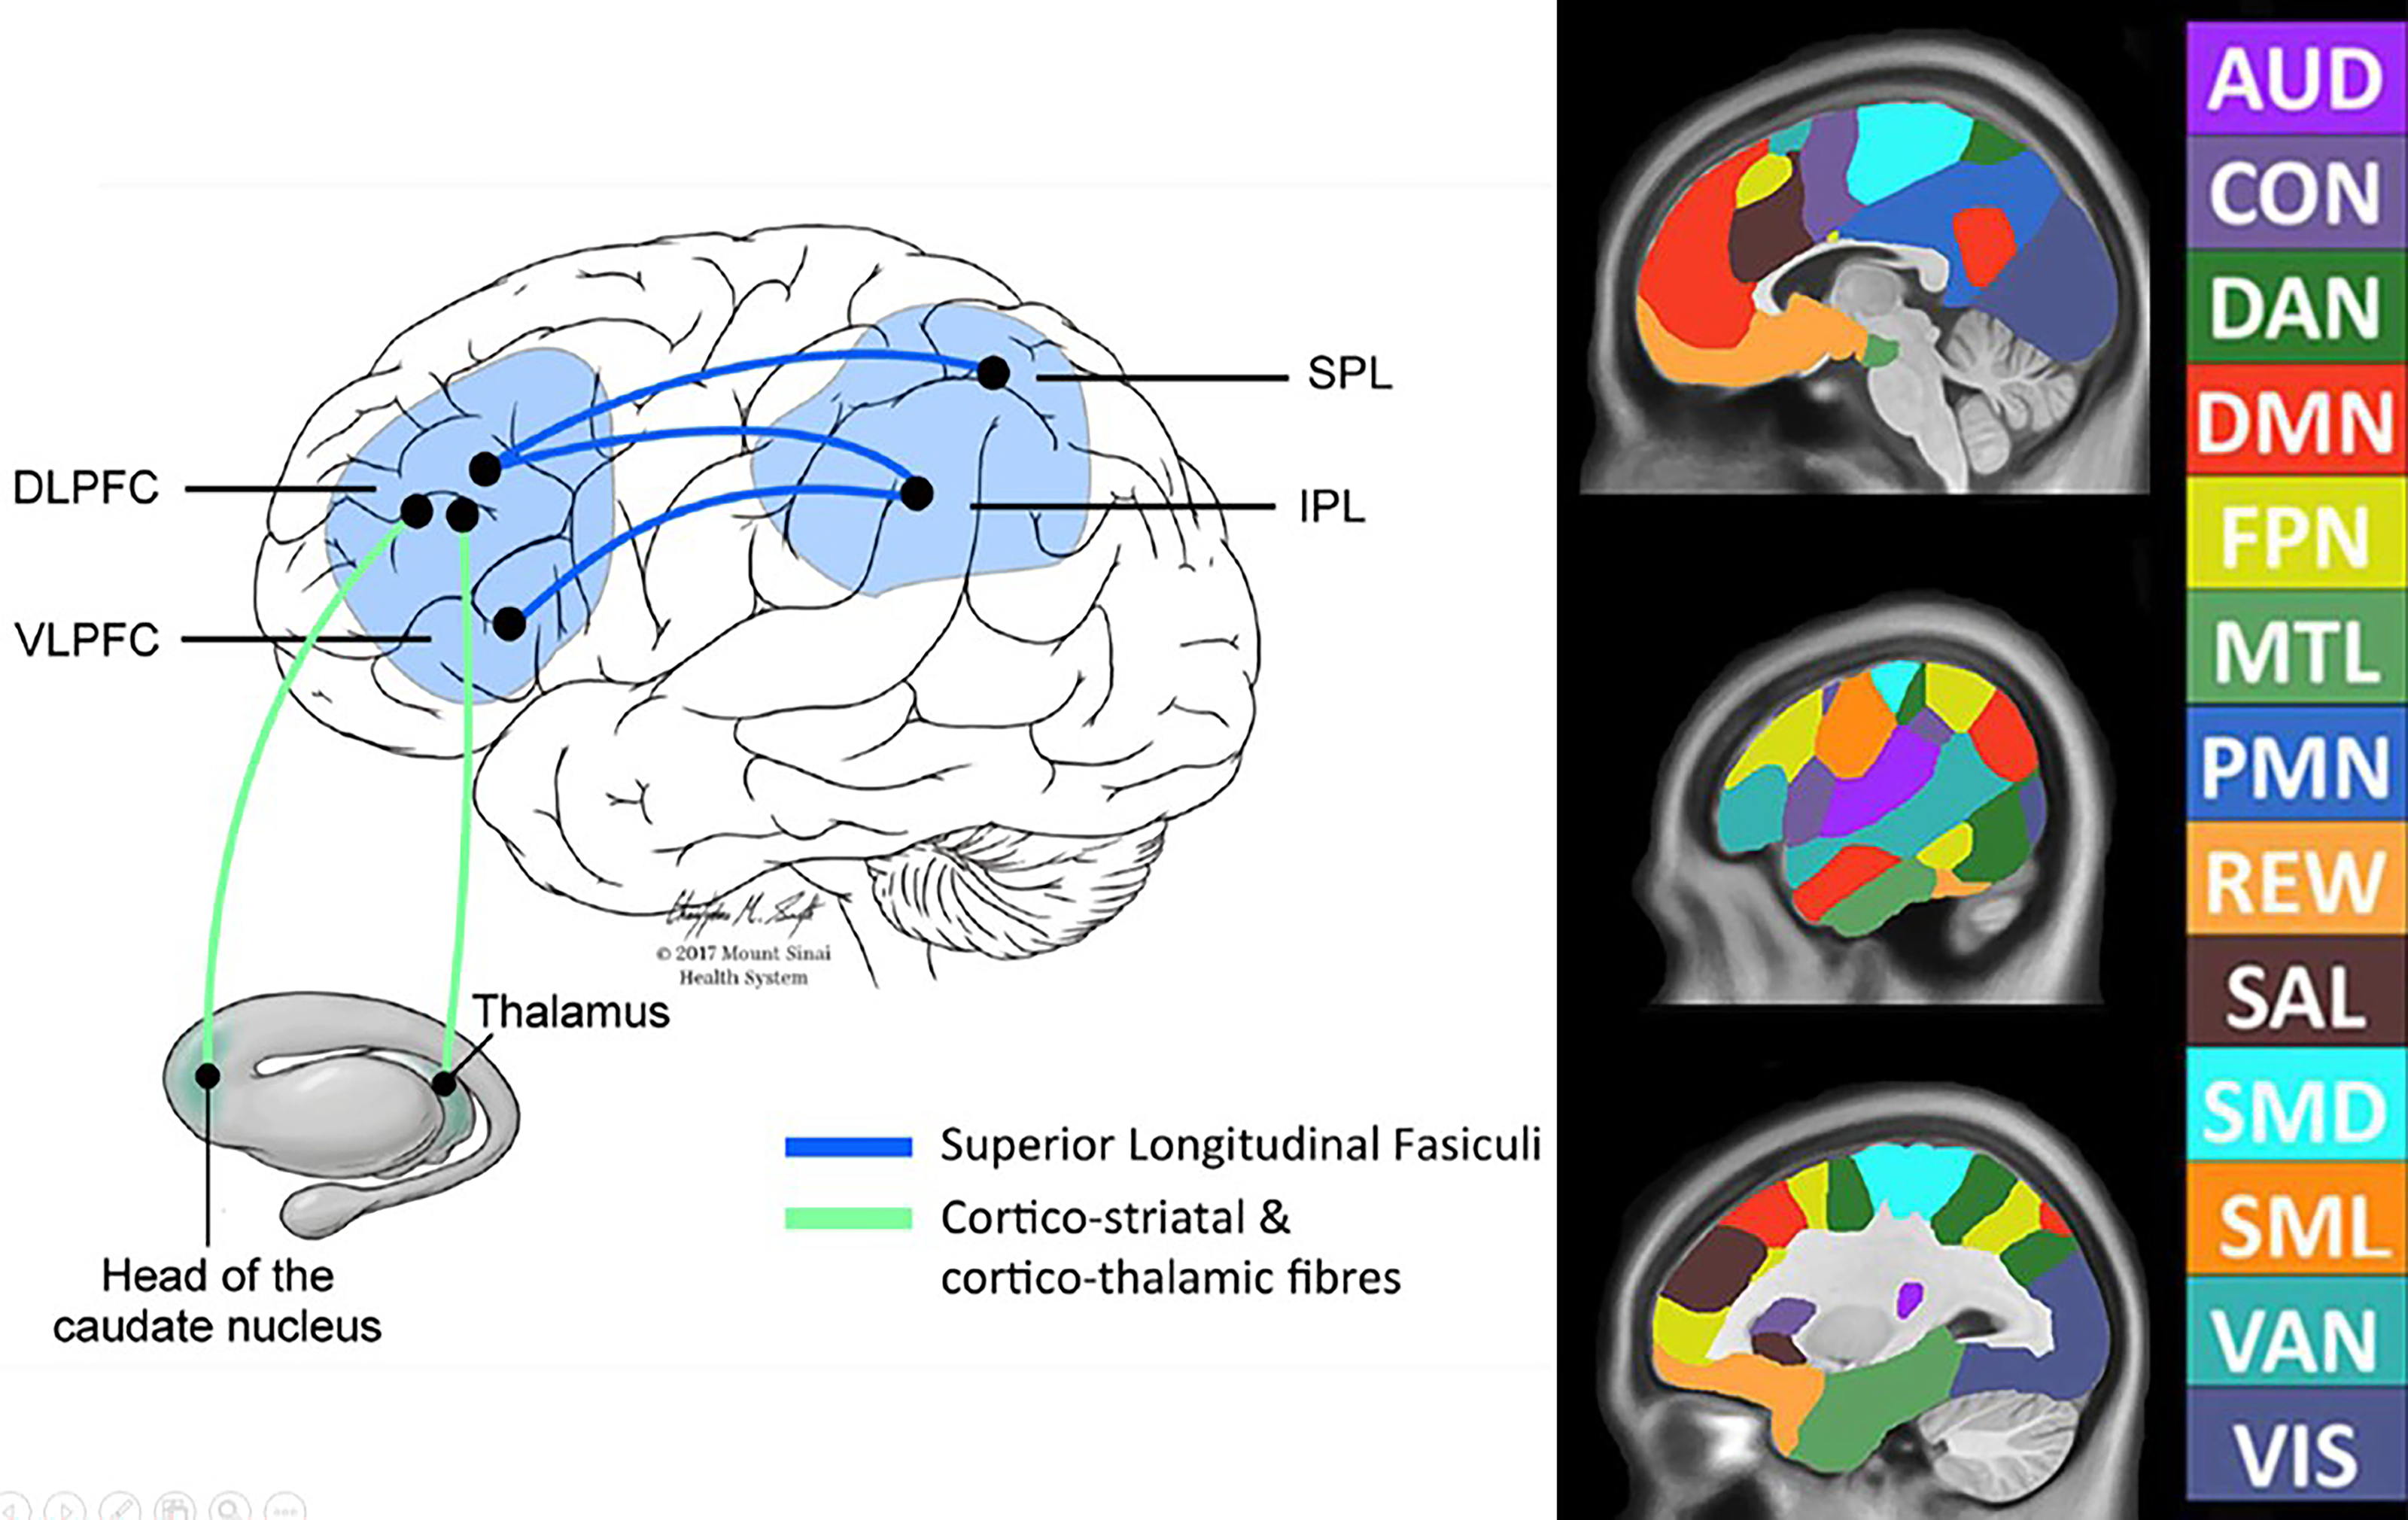
Core elements of the WM neurocircuitry: (Left) The core elements associated with WM performance as illustrated by Froudist-Walsh et al. 13 Note the cortical areas involve much of the parietal lobe, but do extend down toward the STG of the temporal lobe and both dorsal and ventral frontal areas. DLPFC, VLPFC, SPL, and IPL. Aspects of the superior longitudinal fasciculus are shown in Figure 2. Used with permission from Sage Publishing. (Right) Some of the major brain networks based on functional MRI connectivity analyses are shown, as adapted from Luckett et al. 14 Note that the majority of these networks are multi-lobular, emphasizing the importance of white matter neural connectivity for proper functioning within a domain. WM, working memory; STG, superior temporal gyrus; DLPFC, dorsal lateral prefrontal cortex; VLPFC, ventral lateral prefrontal cortex; SPL, superior parietal lobule; IPL, inferior parietal lobule; SMD, dorsal somatomotor; SML, lateral somatomotor; CON, cinguloopercular; AUD, auditory; DMN, default mode; PMN, parietal memory; VIS, visual; FPN, frontoparietal; SAL, salience; VAN, ventral attention; DAN, dorsal attention; MTL, medial temporal; and REW, reward. Permission to publish is provided by the Creative Commons Attribution license from Frontiers.
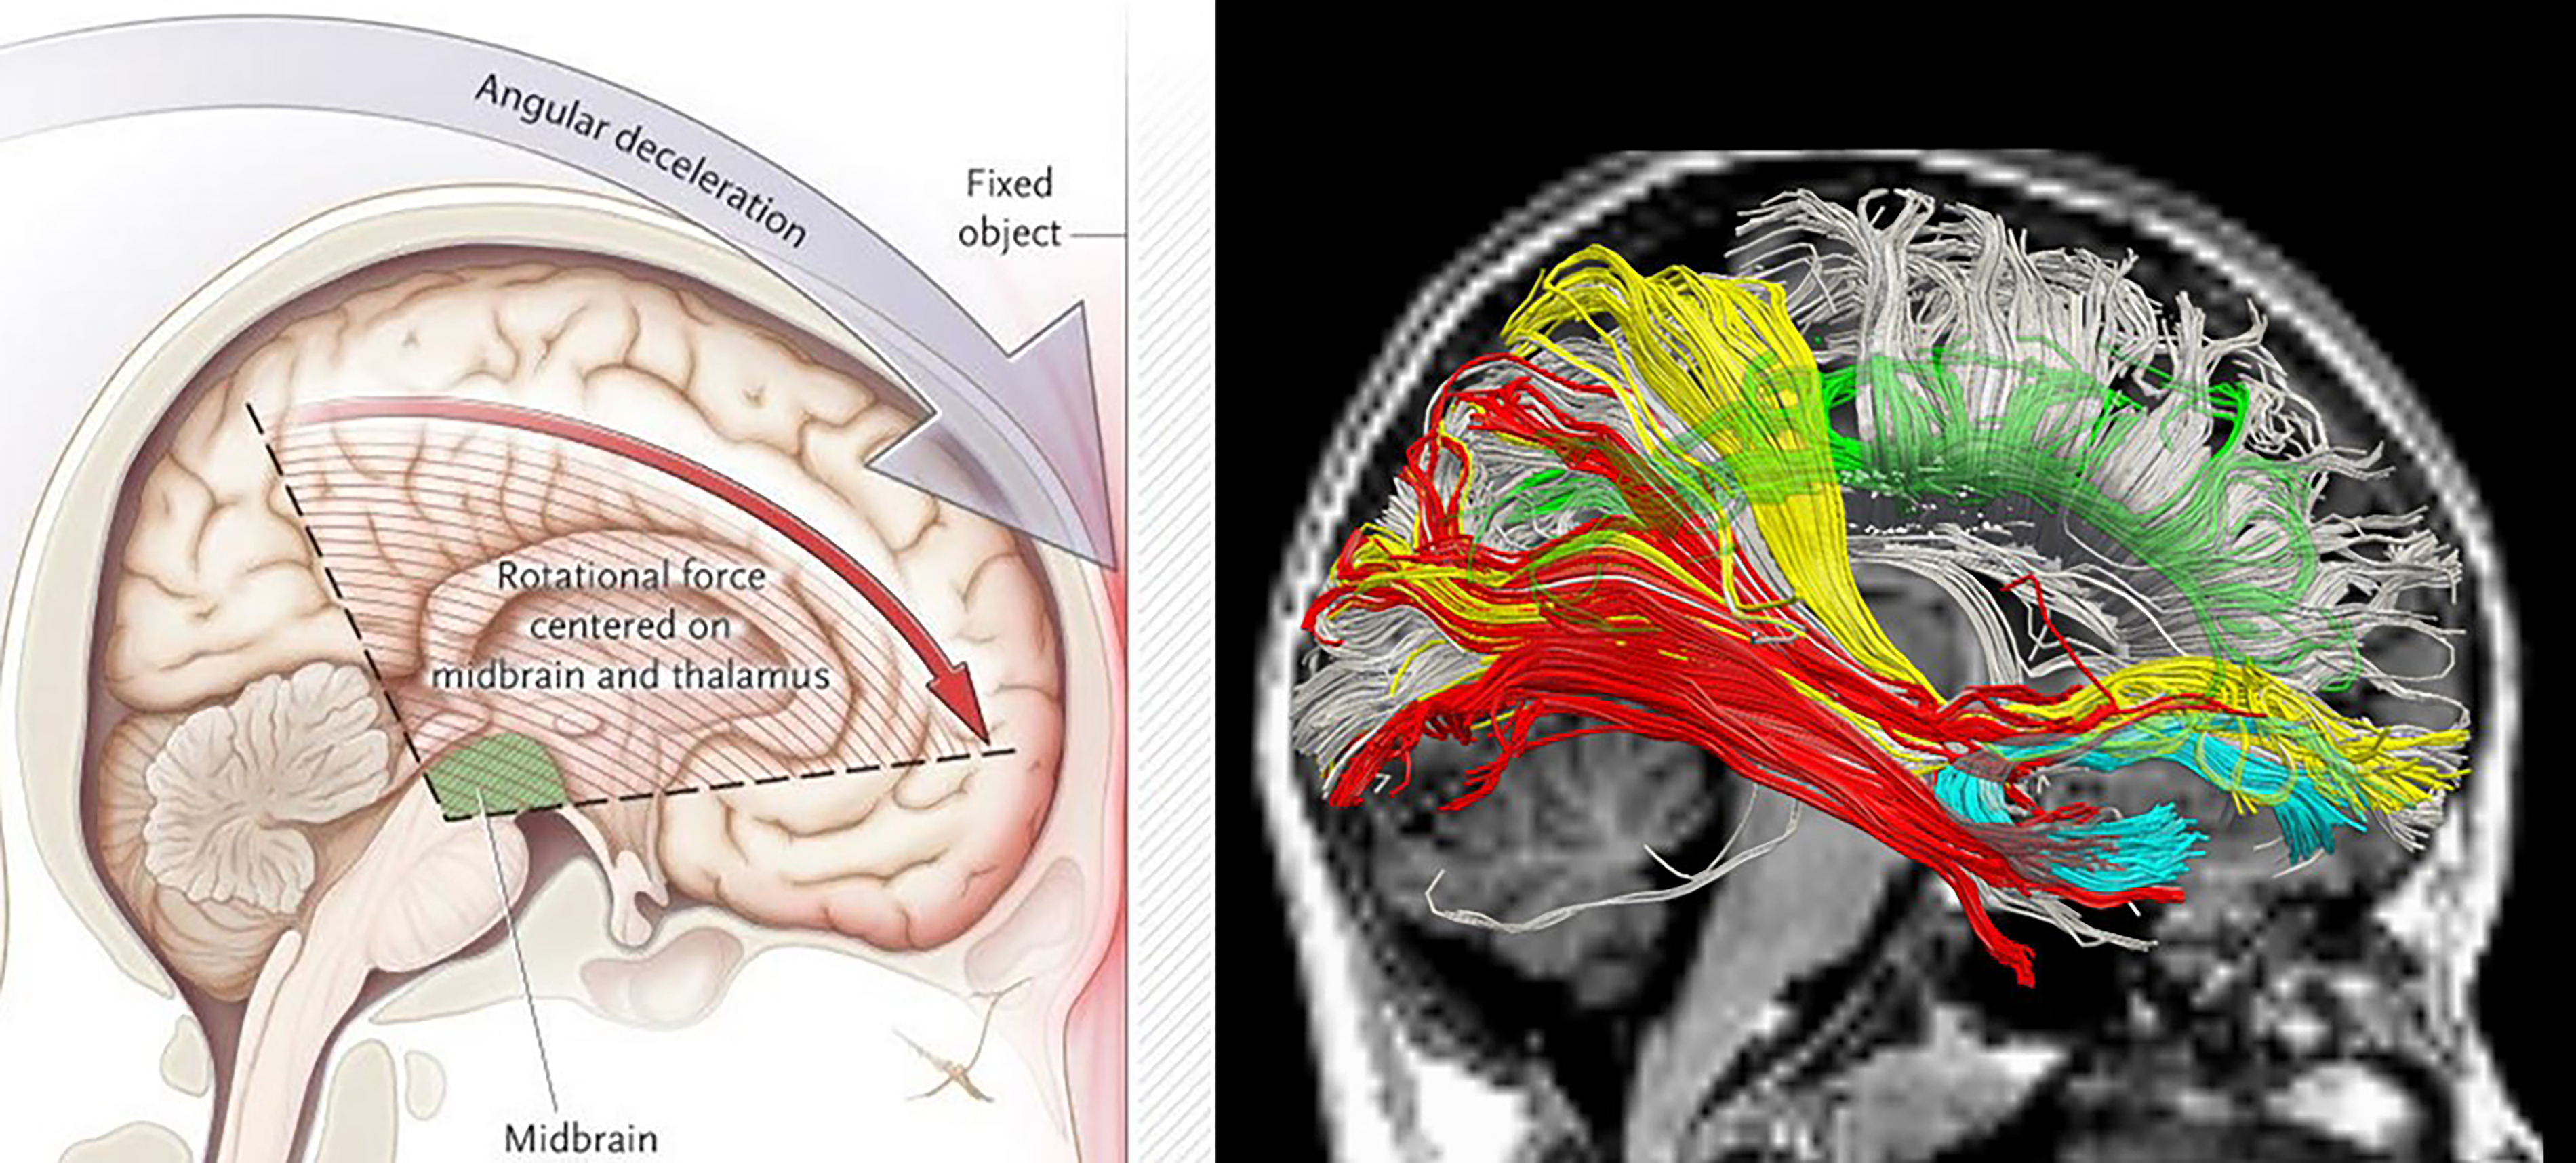
Brain regions vulnerable to deformation, stress-strain, and shearing injury: (Left) from Ropper and Gorson, 17 which depicts the brain regions most vulnerable to deformation, stress-strain, and shearing injury. Used with permission from the New England Journal of Medicine. (Right) MRI-based diffusion tensor imaging (DTI) tractography illustrating some of the major pathways of the brain. The DTI streamlines have been culled to highlight their position. Had this not been done because of the density and overlap of streamlines, some of the trajectories would be blurred. Color-coded pathways reflect the following: Red: Occipitotemporal fasciculus; Yellow: aspects of the parietofrontal and occipitofrontal projections that are part of the superior longitudinal fasciculus (SLF; see Fig. 1 for its role in working memory [WM]). Not shown is the arcuate fasciculus, which is part of the SLF and connects the temporal lobe with the frontal. Green: cingulum bundle; White: corpus callosum.
Figure 2 provides a schematic as to why the frontal lobes, including dorsolateral prefrontal cortex (dlPFC), medial prefrontal cortex, including the anterior cingulate cortex (ACC), orbitofrontal cortex (OFC) areas, and related circuitry (e.g., subcortical white matter, basal ganglia, thalamus) support WM and other executive functions that are particularly vulnerable to TBI.9,18,19 All of the above-mentioned areas are within what has been referred to as the “cone of vulnerability” as highlighted in Figure 2 on the left (see Bigler et al. and Woodrow et al.20,21), where the inverted triangle with striation marks shows the regions where the greatest deformation and rotational forces occur. Also, the red outline on the surface of the frontal lobe depicts the most vulnerable regions where the frontal cortex may strike the inner table of the skull (anterior cranial fossa; see Bigler 22 ) Not shown is also the vulnerability of the temporal pole of the temporal lobe to likewise be susceptible to mechanical injury as a result of TBI, due to its location within the middle cranial fossa 22 The right image in Figure 2 depicts some of the white matter pathways that course through this “cone of vulnerability,” which if injured, disrupt their functional connectivity between key WM centers and their companion neural networks essential for performing WM tasks. In mTBI, based on what is shown in Figure 2, the injury is a combination of white matter damage (disconnection) and gray matter deformation, resulting in diminished network integrity.23,24 Since the majority of children who sustain an mTBI do not exhibit demonstrable traumatic lesions visible on conventional neuroimaging, 25 the inferred white and gray matter abnormalities that may be shown with advanced neuroimaging methods, such as MEG used in the current study, relate to discontinuities in neural pathways and their efficiency for neural conduction and integration.
The N-back task is one of the most frequently used WM paradigms 7 to investigate the neural basis of WM processes, where fundamentally, WM performance is dependent on white matter integrity and the interplay with cortical and subcortical activation. 26 Meta-analyses of 24 N-back neuroimaging studies indicate that the WM network evoked by the N-back task consists of reliably activated cortical regions27,28 including the following: dorsolateral and ventrolateral prefrontal cortex (dlPFC and vlPFC); dorsal anterior cingulate (ACC) and medial premotor cortex; lateral premotor cortex; frontal poles (FPs); and medial and lateral posterior parietal cortex. The cerebellum is also consistently activated during WM.
Returning to Figure 1, while the core regions, as illustrated on the left panel, are essential to WM, they do not occur in isolation and require interaction with numerous other domains, depending on the task. A synopsis of some of the most important neural networks and functional domains are presented on the right side of Figure 2, adapted from Luckett et al. 14 For example, as will be explained in greater detail in the Methods section, the N-back task in this investigation required not only visual processing but also letter recognition, along with a motor response and sustained fixation (attention). Accordingly, in addition to the core brain areas of WM, as show in Figure 1 on the left, the N-back task used in this investigation, as depicted on the right side of Figure 1 would also depend, at a minimum on visual, motor, salience, frontoparietal executive control and the dorsal attention networks. For WM to function appropriately, all of these networks must be orchestrated and finely tuned in terms of neural transmission and neurotransmitter release. A perturbation in any aspect of the supporting networks would result in less efficient WM.
In contrast to the rich WM mTBI literature using fMRI,5,29–35 few studies have used electromagnetic-based techniques to assess WM abnormalities in mTBI (see review in Huang et al. 36 ), especially in pediatric mTBI. MEG directly measures the electromagnetic aspects of neuronal activity with excellent temporal resolution (milliseconds) and high spatial resolution (∼3 mm at the cortical level, vs. centimeters in EEG). 37 The excellent temporal resolution of MEG also enables analysis of signals from different frequency bands separately, rendering it a potentially powerful technique for studying WM deficits in pediatric mTBI. In a previous MEG N-back WM study in adult veterans and active-duty military personnel with combat-related mTBI, we found reduced evoked responses in dlPFC and ACC from gamma, beta, and delta-theta bands, while FP showed over recruitment across all frequency bands. 36 There have been only a few EEG studies of TBI using WM protocols. Using EEG recordings during a WM task, Bailey and colleagues showed higher gamma-band connectivity in both subjects with TBI and major depressive disorder (MDD) following TBI. 38 In a separate EEG study that examined the WM maintenance, parietal-occipital upper alpha-band signals were also reduced in MDD and TBI-MDD groups, but not in the TBI-only group. 39
The present prospective longitudinal controlled study was embedded within the context of pediatric mTBI as a major public health problem, associated with clinical relevance of WM function, an available, valid, and reliable measure of WM, and the absence of related WM-evoked MEG studies in this population. The study used MEG to investigate neuronal mechanisms underlying WM function in children with mTBI compared with orthopedic injury (OI) controls. We predicted the presence of abnormal MEG signals in the PFC of pediatric mTBI patients, owing to the vulnerability of this region to trauma-related injury and the key functional roles that it plays in executive functioning. Relationships between MEG WM activations and measures of changes in PCS scores were also examined to determine the characteristics of the abnormal MEG WM signals with respect to these symptoms in pediatric mTBI.
Methods and Materials
This cohort was recruited as part of a study that was a prospective, longitudinal, parallel-arms observational investigation of children aged 8–15 years consecutively treated at an emergency department (ED) for mTBI or for OI. 40 Assessments were conducted as follows: (1) baseline evaluation within approximately 3 weeks after the index injury that included an MEG, and interview assessments of preinjury and concurrent behavior ratings; (2) research MRI about 1 month after injury; (3) 3-month follow up that included an MEG which was not included in the present analyses, and interview assessments of concurrent behavior ratings. The study was approved by the University of California, San Diego Institutional Review Board. The informed consent followed the ethical guidelines of the Declaration of Helsinki (sixth revision, 2008). Written informed consent was obtained from parents, and children provided written consent or assent, depending on their age. To ensure that children with “a bump to the head” but with no brain trauma were excluded, the mTBI group recruited children only if they suffered a closed head injury that resulted in an observed loss of consciousness, or a Glasgow Coma Scale (GCS) score of 13 or 14 or if GCS score was 15, there had to be at least two concussion symptoms as reported by the ED medical staff (e.g., headache, diplopia, dizziness, vomiting, nausea, post-traumatic amnesia that persisted from the time of the injury to presentation in the ED, transient neurological deficits). 40 Children with delayed neurological deterioration (e.g., GCS < 13) were excluded. Children were excluded if they had a GCS score of less than 13 or loss of consciousness greater than 30 min. The GCS was obtained from the electronic medical record.
Other exclusion criteria for the mTBI group included the following: 40 (1) associated severe injury documented with the Abbreviated Injury Scale (AIS) 41 score greater than 3; (2) associated injury likely to interfere with cognitive testing (e.g., dominant upper limb injury); (3) hypoxia, hypotension, or shock associated with the injury; (4) alcohol, drug ingestion, or child abuse involved with the injury; (5) pre-injury autism spectrum disorder, schizophrenia, neurological disorder, or intellectual deficiency; (6) any medical contraindication to MRI or condition likely to interfere with scan quality such as orthodontia; (7) injury requiring neurosurgical intervention; or (8) self-reported illegal immigrant status.
Inclusion criteria for children with OI 40 were the presence of lower or upper limb fractures associated with AIS scores of 3 or less. Exclusion criteria included: (1) injury to the head or TBI and (2) exclusion criteria 1–8 listed above for the mTBI group.
Post-concussion symptoms assessment
The Health and Behavior Inventory (HBI) 42 is a 20-item questionnaire that was presented as an interview to the children and their primary caretaker. This instrument is validated and standardized on youth, ages 8–15, and their parents. The scale is separated into two domains: 11 cognitive symptoms and 9 somatic symptoms. During the clinical interview, both at the 3-week post injury assessment and then at the 3-month follow-up assessment, participants and their primary caretaker rated the child’s persistent PCSs on the HBI scale.
Motivation assessment
The Children’s Motivation Scale (CMS) 43 was completed by parents at the 3-week assessment on the same day as the MEG. The scale consists of 16 items that measure behavioral, cognitive, and emotional concomitants of motivation and has been used in pediatric TBI research. 44 The CMS has fair-to-good test-retest reliability, interrater reliability, and internal consistency. Mean and standard deviation scores in normative samples are 50 and approximately 10, respectively. Psychiatric outpatient or inpatient samples have a mean of 31 with standard deviation of 10.
N-back working memory task
Participants underwent MEG recordings while performing an N-back WM task similar to the one used in our combat-mTBI MEG study. 36 The task entails online monitoring, updating, and manipulation of remembered information. During the task, the participant was required to monitor a series of letters (both upper and lower case) presented for 0.5 sec in the middle of the screen. A fixation cross was presented during the 3-sec interstimulus interval. The participant was instructed to respond only when a letter was presented that matched the target letter presented N trials previously, while not to respond to the unmatched non-target stimuli. Two load conditions were used, 1-back and 2-back, which place increasing demands on WM processes. The participants were asked to pay attention to the performance accuracy, instead of the speed of the response. Fifty trials per load condition were collected for each participant. Performance was recorded using an MEG-compatible response pad, in which the finger blocks and unblocks a laser-beam. The output of the response pad was recorded in the MEG file. The percentage of correct responses and the time of the response to the stimuli were measured.
MEG data acquisition and signal pre-processing to remove artifacts
MEG responses to the N-back WM task were collected using the VectorView™ whole-head MEG system (Elekta-Neuromag, Helsinki, Finland) with 306 MEG channels, similar to. 36 Participants were seated in upright position inside a multi-layer magnetically-shielded room (IMEDCO-AG) 45 at the UCSD MEG Center. Data were sampled at 1000 Hz and were run through a high-pass filter with a 0.1 Hz cut-off and a low-pass filter with a 330 Hz cut-off. Eye blinks and eye movements were monitored using two pairs of bipolar electrodes with one pair placed above and below the left eye, and the other pair placed on the two temples. Heart signals were monitored with another pair of bipolar electrodes. Precautions were taken to ensure head stability; foam wedges were inserted between the participant’s head and the inside of the unit, and a Velcro strap was placed under the participant’s chin and anchored in superior and posterior axes. Head movement across different sessions was about 2–3 mm on average, ranging from 0 to 5.5 mm. Usually, the MEG data are rejected in our lab if the subject’s head movement is > 6 mm.
MEG sensor waveforms in raw (un-averaged) format were first run through MaxFilter, also known as signal space separation,46–48 to remove external interferences (e.g., magnetic artifacts due to metal objects, strong cardiac signals, environmental noises, etc.). Next, residual artifacts near the sensor array due to eye movements and residual cardiac signals were removed via Independent Component Analysis using Fast-ICA (http://research.ics.aalto.fi/ica/fastica/).49,50 The waveforms associated with the top independent components (ICs) were examined by an experienced MEG data analyst (M.-X.H.), along with ECG and EOG signals. ICs associated with eye blinks, eye movements, heartbeats, and other artifacts were removed.
Structural MRI, MEG-MRI registration, BEM forward model for MEG
Structural MRI of the participant’s head was collected using a GE Discovery MR750 3 T Scanner. The acquisition contains a standard high-resolution anatomical volume with a resolution of 0.94 × 0.94 × 1.2 mm3 using a T1-weighted 3 D-IR-FSPGR. Scanner-related imaging distortions were corrected using a gradient non-linearity correction approach. 51 To co-register the MEG with MRI coordinate systems, three anatomical landmarks (i.e., left and right pre-auricular or PA points, and nasion) were measured for each subject using the Probe Position Identification system (Polhemus, USA). By identifying the same three points on the subject’s MR images using MRILAB (Elekta/Neuromag), a transformation matrix involving both rotation and translation between the MEG and MR coordinate systems was generated. 36 Due to uncertainty related to the measurement of the three landmarks and to the identification of these landmarks in the MRI, to increase the reliability of the MEG-MR co-registration, approximately 120 points on the scalp were digitized with the Polhemus system, in addition to the three landmarks, and those points were co-registered onto the scalp surface of the MR images. The T1-weighted images were also used to extract the brain volume and innermost skull surface (SEGLAB software developed by Elekta/Neuromag). Realistic Boundary Element Method (BEM) head model was used for MEG forward calculation.52,53 The BEM mesh was constructed by tessellating the inner skull surface from the T1-weighted MRI into ∼6000 triangular elements with ∼5 mm size. A cubic source grid with 5 mm size covering cortical and subcortical GM areas was created. Such a source grid was used for calculating the MEG gain (i.e., lead-field) matrix, which leads to a grid with ∼10,000 nodes covering the whole brain. Then, the source grid was combined with the BEM mesh in the MRI coordinate for the BEM forward calculation. 36
Other conventional MRI sequences typical for identifying structural lesions in TBI participants were also performed: (1) axial T2*-weighted; (2) axial fast spin-echo T2-weighted; and (3) axial FLAIR; these conventional MRIs were reviewed by a board-certified neuroradiologist (JRH).
Covariance matrix of single trials and MEG source magnitude imaging using Fast-VESTAL
Following the pre-processing step, N-back MEG sensor-waveform datasets were run through band-pass filters for different frequency bands: 36 alpha (8–12 Hz), beta (15–30 Hz), gamma (30–80 Hz), theta (4–7 Hz), and delta (1–4 Hz) frequency bands. Each data set was then divided into trials, each with 2.5-sec duration (−500 ms to 1500 ms with respect to the stimulus onset). The figure in Supplementary Data shows an example of the MEG sensor waveforms from a typical participant, in which the MEG activity went back to baseline level before 1500 ms. In the present study, we focus on the trials associated with target stimuli.
Different from the conventional MEG approach in which sensor waveforms are averaged with respect to the onset of the stimuli, we calculated the sensor covariance matrices for individual trials. 36 Then, for each frequency band, a total sensor-waveform covariance matrix of the target condition was calculated by averaging across the covariance matrices from individual trials for the target stimuli. We averaged the covariance matrices across trials. This approach prevents potential signal cancellation across trials due to jitter of WM responses with respect to the onset of the visual stimuli, which leads to non-time-lock nature of the WM signals especially for high frequency components. Using the total covariance matrix, voxel-wise MEG source magnitude images that cover the whole brain were obtained for each subject, and each frequency band, following the Fast-VESTAL procedure [see Method in Huang et al. 36 and Huang et al. 54 and also Appendix in Huang et al. 55 ]. An Objective Pre-whitening Method was applied to remove correlated environmental noise and objectively select the dominant eigen-modes of sensor-waveform covariance matrix.36,54
Voxel-wise group statistical analyses for MEG source magnitude images
In all participants, voxel-wise whole-brain MEG source magnitude images obtained from Fast-VESTAL were first spatially co-registered to the MNI-152 56 brain-atlas template using a linear affine transformation program, FLIRT, in the FMRIB Software Library (FSL, version 7.4.0) software package.57,58 Then, in MNI-152 space, the MEG source magnitude images were spatially smoothed using a Gaussian kernel with 5 mm full-width half maximum (FWHM), followed by a logarithmic transformation using FSL. Next, voxel-wise group statistical analysis was performed to detect group differences in brain activation during the MEG N-back task. 36
For each frequency band, a voxel-wise repeated measure ANOVA was performed to create F-value maps for examining the group differences (i.e., mTBI vs. control groups), with 1- and 2-back conditions treated as repeated measures. 36 Corrections to maintain the family-wise error rate across voxels at 0.01 level were done by standard cluster analysis for the F-value maps, using “3dFWHMx” and “3dClustSim” functions in the current version of AFNI (http://afni.nimh.nih.gov), 59 version 24.3.10. A mask that contained the statistically significant clusters was created and then applied to the F-value maps to create the corrected group statistical maps for the MEG source magnitude images. 36
Potential differences in motivation, which could conceivably influence MEG task engagement and activation patterns in the mTBI versus OI groups, were analyzed with an independent sample t-test.
Results
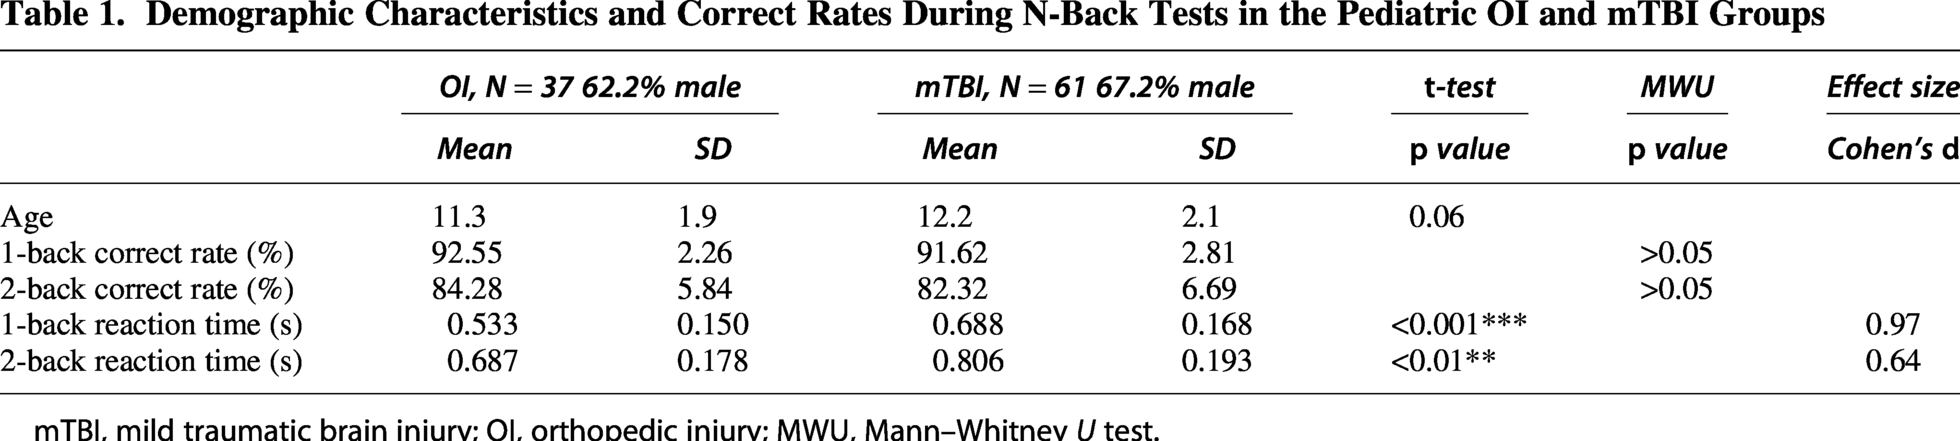
Demographic characteristics of participants are listed in Table 1. With regard to GCS scores, the mTBI group had 57 participants with a GCS score of 15, 2 participants with a GCS score of 14, and 1 participant with a GCS score of 13, whereas the OI group, by default, had all 37 participants with a GCS score of 15. The study neuroradiologist, J.R.H., documented trauma-related abnormalities in 2/60 (3.3%) of the research MRI scans in the mTBI group and 0/37 (0%) in the OI group. The mTBI and OI groups were predominantly male (40/60 [66.7%] and 23/37 [62.2%]), respectively (Fisher’s exact test p = 0.667). Right-handedness in the mTBI and OI groups was present in 55/60 (91.7%) and 32/37 (86.5%), respectively, (Fisher’s exact test p = 0.498). The groups scored similarly on global intellectual functioning as measured by the Wechsler Abbreviated Scale of Intelligence-Second Edition (WASI-II) Full Scale IQ-2 subtest (Vocabulary and Matrix Reasoning) score 60 (mTBI mean = 107.73, SD = 12.24, OI mean = 108.89, SD = 14.81; t = −0.40; df = 65.59; p = 0.691).
Demographic Characteristics and Correct Rates During N-Back Tests in the Pediatric OI and mTBI Groups
mTBI, mild traumatic brain injury; OI, orthopedic injury; MWU, Mann–Whitney U test.
Participants attended three research sessions: (1) at baseline (days between injury and baseline for mTBI group mean = 24.58, SD = 6.52, for OI group mean = 21.89, SD = 5.97; t = 2.04; df = 95; p = 0.044); (2) at MRI (days between injury and MRI for mTBI group mean = 52.68, SD = 21.68, for OI group mean = 46.76, SD = 21.66; t = 1.31; df = 95; p = 0.194); and (3) at 3-month follow-up (days between injury and follow-up for mTBI group mean = 109.83, SD = 32.16, for OI group mean = 107.30, SD = 14.31; t = 0.452; df = 95; p = 0.652).
Parent HBI symptom rating total scores for the mTBI group ranged from 0 to 51 at baseline acute/subacute visit, and 0 to 37 at the 3-month follow-up. Parent HBI symptom rating total scores for the OI group ranged from 0 to 28 at baseline acute/subacute visit, and 0 to 29 at the 3-month follow-up. The difference scores for parent HBI symptom rating total scores at 3-month follow-up minus baseline acute/subacute visit ranged from −34 to 18 for the mTBI group and −17 to 16 for the OI group.
Parent-completed Children’s Motivation Scale rating mean (standard deviation) scores for the mTBI and OI groups were 51.3 (7.8) and 52.5 (7.5), t = −0.73; df = 95; p = 0.47; respectively.
Table 1 also shows performance accuracy for the target stimuli during the N-back tests in the mTBI and OI groups. The percentage of correct responses decreased as task difficulty increased from 1-back to 2-back in both groups. In addition, Table 1 shows the mean reaction times (RTs) for correct responses during the N-back tests in both groups. The mTBI group showed significantly longer reaction times than the OI group for both 1- and 2-back tasks, with effect sizes measured by Cohen’s d. Rank-based nonparametric Mann–Whitney U test was used to assess group differences in percent accuracy, and there were no significant group differences in percent accuracy for 1- or 2-back tasks.
Table 2 shows the post-concussion symptom HBI total scores in OI and mTBI groups at 3-week and 3-month exams, and the difference in total PCS scores with 3-month minus 3-week.
Post-Concussion Symptom HBI Total Scores in OI and mTBI Groups at 3-Week and 3-Month Exams, and 3-Month Minus 3-Week Difference in Total PCS Scores
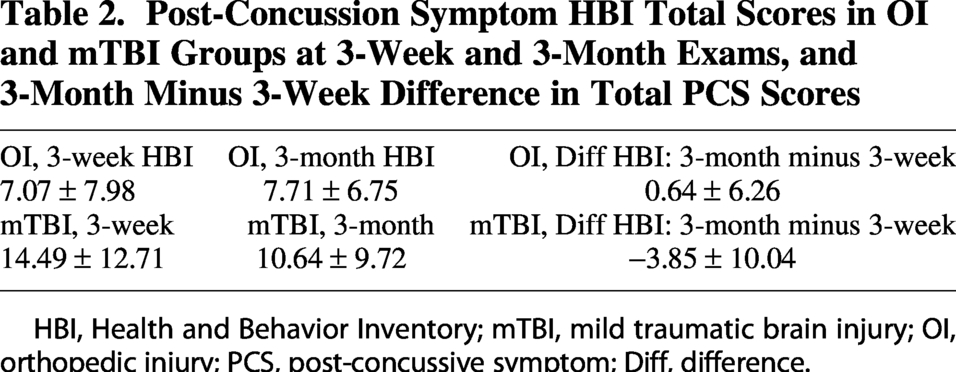
HBI, Health and Behavior Inventory; mTBI, mild traumatic brain injury; OI, orthopedic injury; PCS, post-concussive symptom; Diff, difference.
Hyper- and hypoactivity revealed by MEG source images in children with mTBI
Figure 3 displays the main findings of hyper- and hypoactivity from 22 areas evoked by the WM N-back task in the mTBI group relative to the control group, for the correct responses of the target stimuli. The WM task-evoked MEG (te-MEG) source imaging results (ANOVA F-score maps) show the delta (1–4 Hz), theta (4–7 Hz), alpha (8–12 Hz), beta (15–30 Hz), and gamma-band (30–80 Hz) frequencies. Three main regions in the proper WM network, i.e., dorsolateral prefrontal gyrus, supramarginal gyrus (SMG), and anterior cingulate cortex (ACC), showed lower evoked responses across different frequency bands in children with mTBI versus OI. In addition, children with mTBI showed over-recruitment from FP and ventromedial prefrontal cortex (vmPFC).
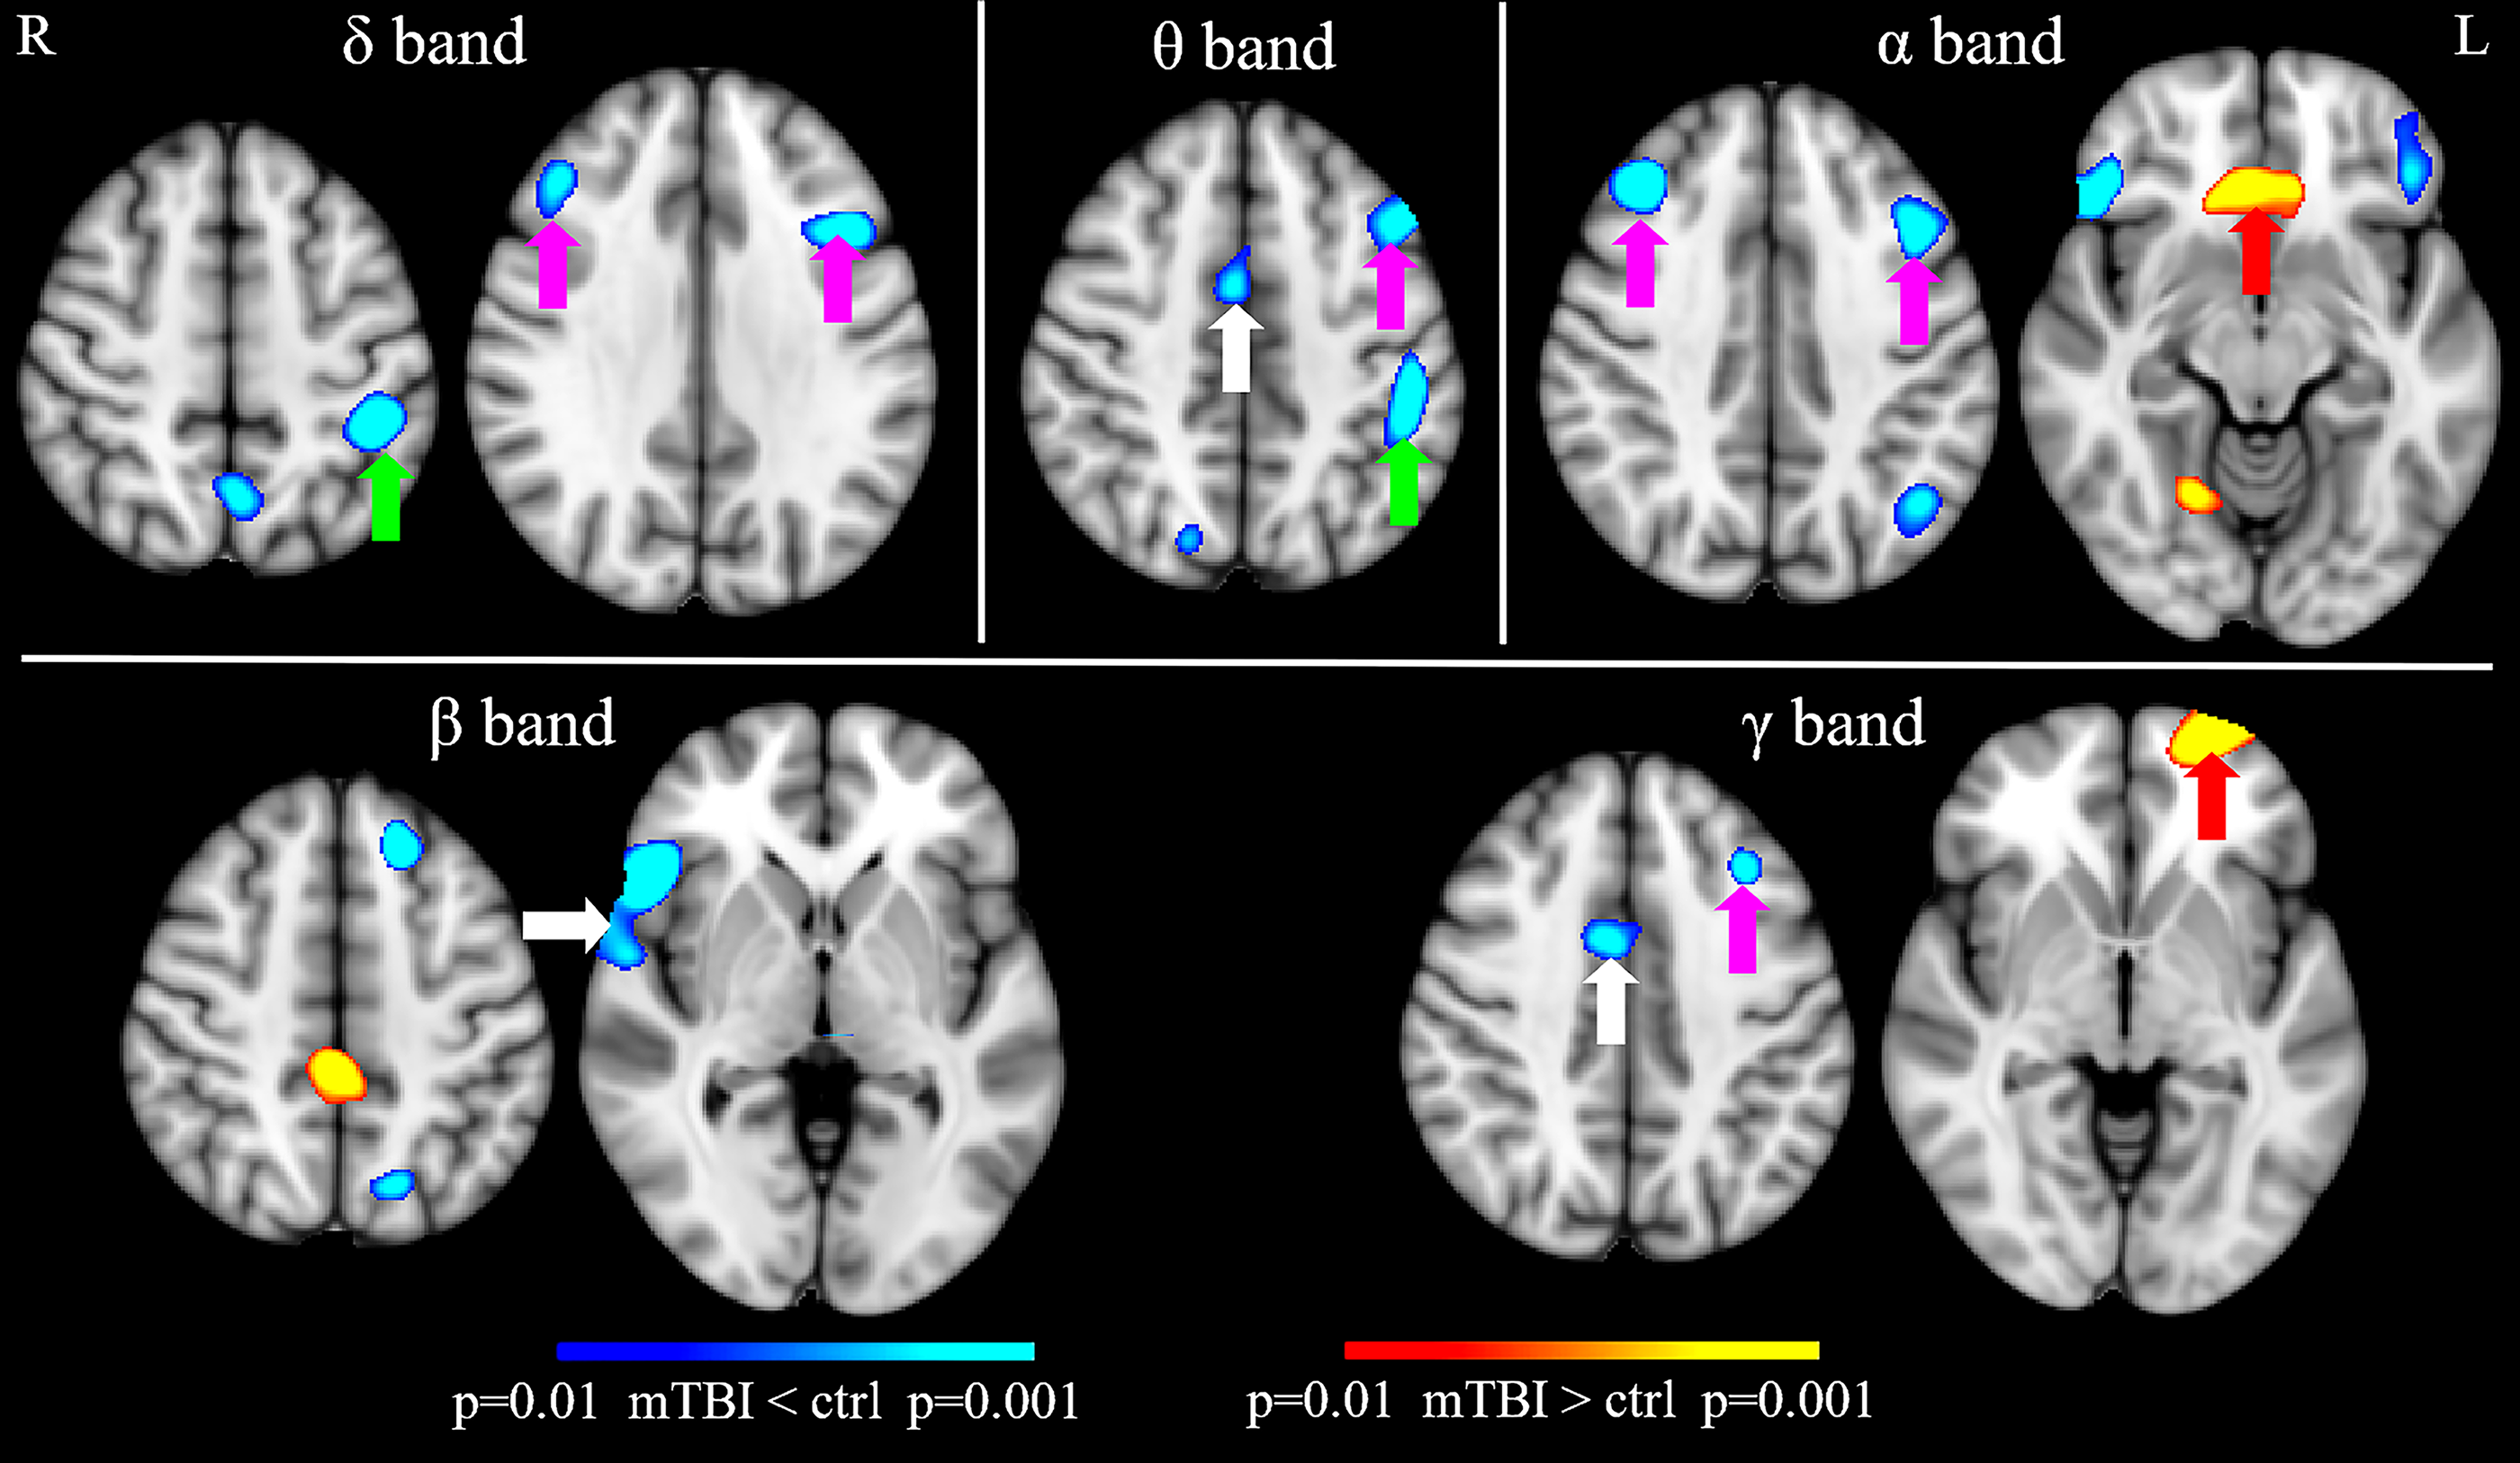
Significant differences in MEG working memory responses: mTBI vs. OI: Task-evoked MEG hypoactivity and over recruitment revealed by working memory N-back task in pediatric mTBI versus OI control subjects. Magenta arrows: hypoactivity in mTBI over OI from dlPFC; Green arrows: hypoactivity in mTBI over OI from supramarginal gyrus; White arrows: hypoactivity in mTBI over OI from ACC, vlPFC, and temporal pole; Red arrows: over recruitment in mTBI over OI from frontal pole cortex and vmPFC. Corrections to maintain the family-wise error rate across voxels at a p value of 0.01 threshold were done by cluster analysis for the F-value maps. MEG, magnetoencephalography; mTBI, mild traumatic brain injury; OI, orthopedic injury; dlPFC, dorsolateral prefrontal cortex; vlPFC, ventrolateral prefrontal cortex; vmPFC, ventromedial prefrontal cortex; ACC, anterior cingulate cortex.
Correlation between MEG N-back activations and the post-injury changes in PCSs
To examine the associations of WM N-back te-MEG regional activities and the postinjury changes in PCSs, we examined the regional MEG responses evoked by the N-back task from the children with mTBI and OI. We focus on the 22 areas that showed significant hyper- or hypoactivity. Figure 4 shows scatter plots of PCS changes and te-MEG responses across four areas with significant correlations, including three regions that are part of the typical WM network (i.e., SMG, dlPFC, and ACC) and the FP. These correlations remain significant after the correction of multiple comparisons using the false discovery rate (q < 0.05). 61 In Figure 4, changes in PCS HBI score (3-month minus 3-week, difference score) are plotted against SMG, dlPFC, ACC, and FP regional te-MEG WM responses. In 60 children with mTBI (but not in 37 children with OI), the te-MEG responses from SMG, dlPFC, and ACC evoked by WM N-back task significantly and negatively correlated with changes in PCSs, whereas FP te-MEG response significantly and positively correlated with changes in PCSs. Furthermore, in SMG, dlPFC, and ACC, the children with mTBI also showed hypoactivity (see y-axis) with WM N-back stimuli compared with children with OI. In contrast, in FP area, children with mTBI showed te-MEG hyperactivity (over recruitment) compared with children with OI. So, less N-back te-MEG responses from regions that are part of the typical WM network (i.e., SMG, dlPFC, and ACC), as well as over recruitment from FP, predicted poorer symptom outcomes in mTBI but not in OI, again suggesting that these abnormal MEG activities are mTBI specific.
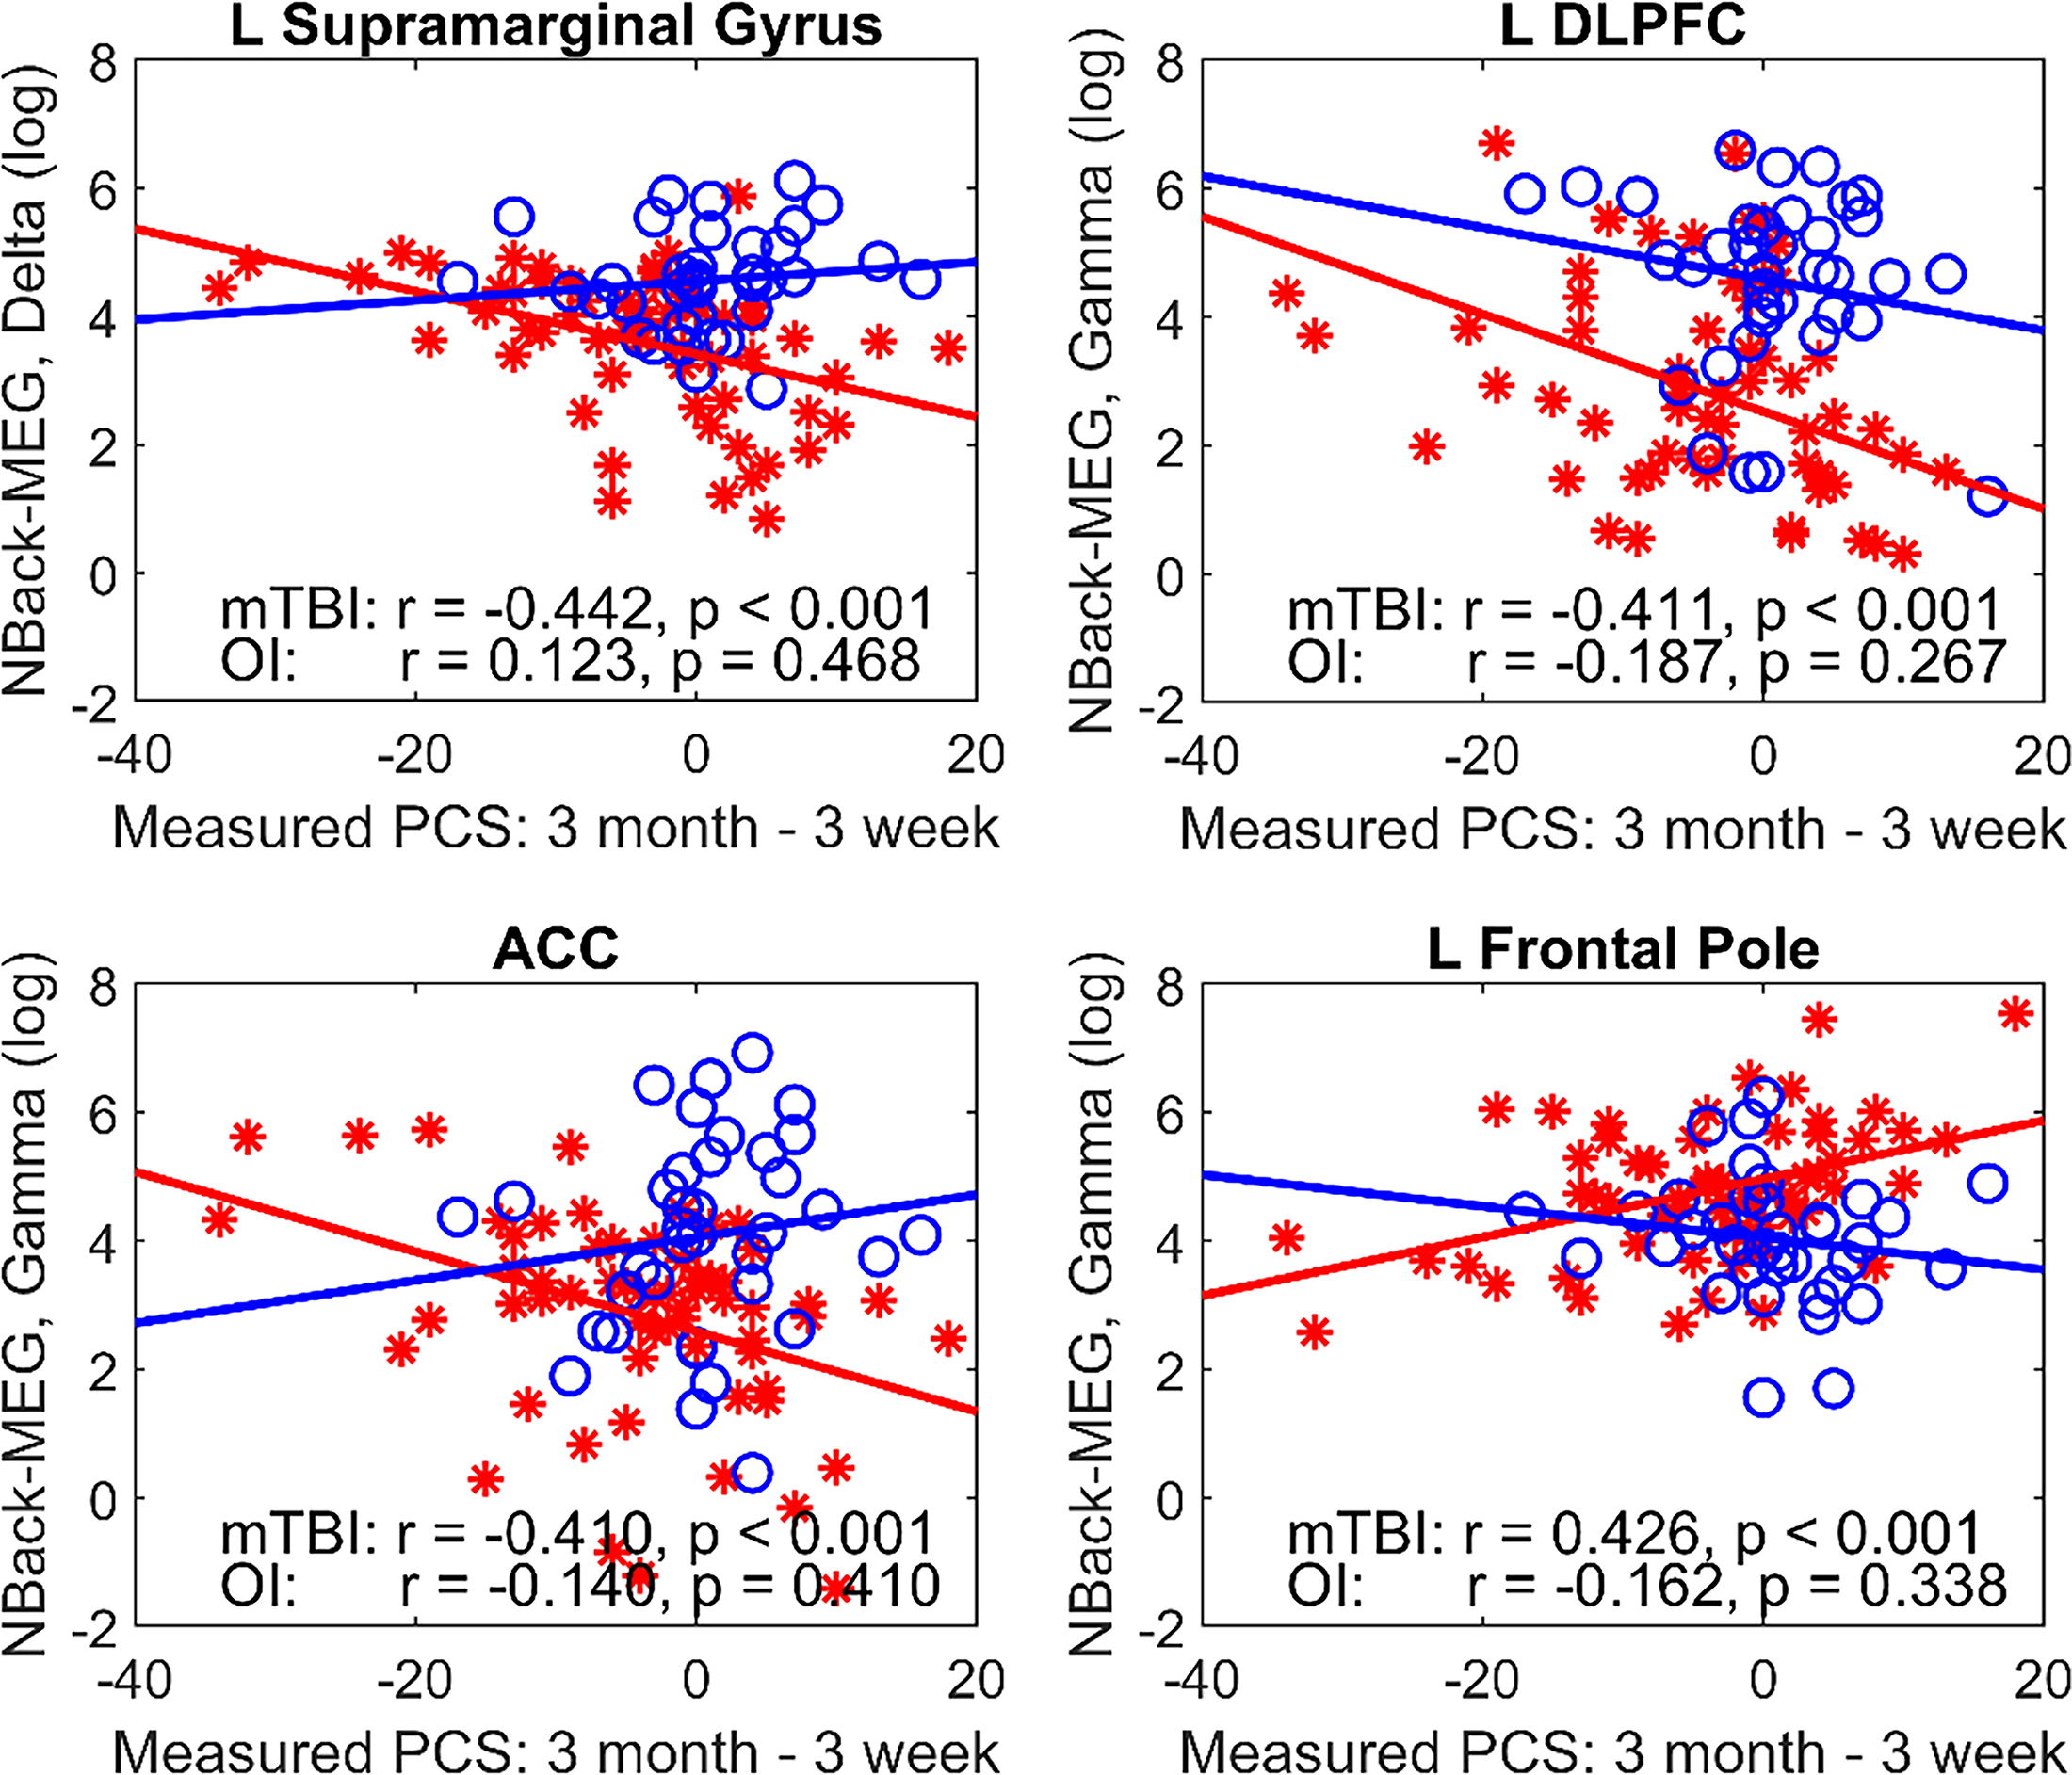
MEG working-memory responses correlated with PCS: Working-memory evoked MEG responses in delta and gamma bands correlated with PCS score (3-month follow-up minus 3-week post-injury) significantly and negatively in mTBI (red stars) but not in OI (blue circles) subjects. In these two regions, the mTBI showed hypo-responses in mTBI over OI. MEG, magnetoencephalography; PCS, post-concussive symptom; mTBI, mild traumatic brain injury; OI, orthopedic injury.
Discussion
In the present study, aberrant activations during a WM task, not explicable by a measure of motivation, were revealed for the first time in pediatric mTBI using MEG source magnitude imaging. Although correct responses on the WM N-back neurocognitive test (1-back and 2-back) were not significantly different between participants with mTBI and a well-matched OI comparison group, reaction times on the test were significantly longer in the mTBI group. The neuronal activity in the group with pediatric mTBI was characterized predominantly by hypoactivity in WM-proper network including dlPFC, ACC, and SMG. As shown in Figures 1 and 2, these are all key areas for WM proficiency, which are vulnerable to TBI and exhibit dysregulation and a differential pattern of functioning as demonstrated by this investigation. In addition, MEG over-recruitment in the form of hyper-activations was shown in FP and vmPFC in the mTBI group. Furthermore, in the mTBI group, the MEG activity from dlPFC and SMG regions also correlated significantly with changes in symptom scores between 3-week and 3-month behavioral exams. These findings suggested that aberrant neuronal activity in pediatric mTBI was functionally significant, relating both to group differences in the processing pattern and efficiency of WM function as well as to relative changes (improvement or worsening) in postconcussion behavioral symptoms.
Hypoactivity in WM te-MEG from dlPFC, ACC, and SMG in children with mTBI, as well as their negative correlations with the PCS changes, may signify a weaker engagement of executive and cognitive-control processes that are involved in WM.28,62–65 The functional roles of dlPFC in WM include holding, updating, and manipulating information for tasks, 66 essential for creating and executing detailed plans and organizing behavior toward goals. 67 In addition, the executive functions of dlPFC are also involved in cognitive flexibility that enables switching between different tasks or mental sets, 68 response inhibition that controls impulses and suppresses inappropriate or automatic responses, 69 abstract reasoning that supports higher-level thinking and making judgments, 70 as well as attention control and decision making. 71 ACC also plays an important role in executive functions of cognitive control, including error detection, conflict monitoring, adjustment, and/or task switching.72–77 Activity in the ACC is also related to changes in effort, complexity, or attention.27,78,79 Furthermore, SMG is crucial for WM, especially verbal WM, acting as a key part of the phonological loop to temporarily store sound-based info, manage serial order, and link to long-term memory (see reviews in Barch et al. and Deschamps et al.17,80). It handles phonological processing like phoneme discrimination, supports articulation, and helps with attentional control, playing a role in manipulating verbal data and maintaining sequence, not just content.17,80 Thus, in the present study, it is possible that compared with the OI subjects, children with mTBI were not able to activate the dlPFC, ACC, SMG as much, due to deficits in these functions described above.
In contrast, te-MEG’s hyperactivity in FP (lateral portion, see Fig. 3) in children with mTBI and its positive correlation with the PCS changes may suggest over-recruitment during WM test. FP contains two subdivisions: the lateral FP and medial FP. Lateral FP is involved in cognition, WM, and perception (see review in Bludau et al. 81 ) and is particularly important for organized behavior, action planning, and the management of multiple goals based on information from episodic and short-term memory. 81 In contrast, the medial portion of FP is mainly involved in emotional and social cognition. 81 These functional distinctions between the lateral and medial FP are compatible with our findings of over-recruitment from the lateral portion of FP in mTBI, with positive correlation of the PCS (i.e., over-recruitment in FP was associated with a higher PCS score). These results provide compelling evidence to suggest a compensatory mechanism from FP in children with mTBI when performing the WM test.
From the beginning of experimental psychology, the role of attention, concentration, mental focus or effort have been interchangeable descriptors of essential cognitive processes that guide behavioral responses to sensory stimuli, especially those involved in memory. While these features have been discussed and written about for over a century, how to operationalize these terms and empirically investigate has been the challenge. The outdated schema of differentiating attention from short-term and long-term memory was fraught with definitional limitations, especially when attempting to study clinical populations where memory and attentional deficits are core symptoms/problems like in dementia and TBI. In 1986, Baddeley 11 summarizes his research that began with devising methods to experimentally investigate memory disorders in various types of dementia, introducing the concept of “WM (see also Baddeley 82 ).” Over the next few years, Baddeley formalized measures to assess different components of WM. In his 1992 refinement of this theory, 83 Baddeley proposed the following: “The term WM refers to a brain system that provides temporary storage and manipulation of the information necessary for such complex cognitive tasks as language comprehension, learning, and reasoning. This definition has evolved from the concept of a unitary short-term memory system. WM has been found to require the simultaneous storage and processing of information. It can be divided into the following three subcomponents: (1) the central executive, which is assumed to be an attentional-controlling system, is important in skills such as chess playing and is particularly susceptible to the effects of Alzheimer’s disease; and two slave systems, namely (2) the visuospatial sketch pad, which manipulates visual images and (3) the phonological loop, which stores and rehearses speech-based information and is necessary for the acquisition of both native and second-language vocabulary.” As discussed in the review papers, 84 WM paradigms have become the mainstay in cognitive neuroscience studies of attention and memory, including neural network analyses of brain regions that subserve WM. 85
The current findings help explain why some of the most enduring symptoms associated with mTBI occur in what is ostensibly a “normal” appearing brain from a routine MRI structural imaging standpoint. As Polinder et al., 86 along with numerous others, have shown, some of the most common symptoms/problems encountered by individuals who experience an mTBI are “trouble concentrating,” “taking longer to think,” “inability to concentrate” as well as “poor memory.” Each of these domains of neurocognitive functioning depends on an intact and rapidly efficient WM network, which, as the current investigation demonstrates, is perturbed following mTBI.
There were several strengths of the study that should be noted. First, this was a prospective longitudinal study of consecutive patients in a single ED treated for pediatric mTBI. Second, control participants with similar IQ and sex representation, and presumptively similar predisposing factors for suffering an injury and a similar experience of trauma and treatment in the ED were studied. This is particularly important because of known brain structural (and the potential of currently unknown functional) similarities between mTBI and OI controls and significant differences when comparing mTBI to healthy non-injured controls.87,88 In other words, it is easier to find structural (and possibly by extension, functional) brain imaging differences when an mTBI group is compared to healthy controls rather than OI controls. Third, sophisticated te-MEG techniques and analyses that included alpha, beta, gamma, delta, and theta bands were conducted.
An appreciation of the pathophysiology of brain damage is important to bridge the gulf between WM dysfunction, WM evoked MEG band patterns, brain network disruptions, and brain tissue pathology. Diffuse axonal injury plays a major role in mTBI, producing an imbalance in excitatory/inhibitory neural activity.
36
Traditionally, it is assumed that white matter tracts are primarily vulnerable to diffuse axonal injury, which produces cortical network disconnection (see reviews in89,90). However, more recent animal studies extend this view by showing that gray matter is also vulnerable to diffuse axonal injury,
24
which damages GABA-ergic inhibitory interneurons, specifically near the soma of the parvalbumin-positive (PV+) interneurons (see references in
91
) or degrades the perineuronal net, which is a specialized extracellular structure enwrapping cortical PV+ inhibitory interneurons.
92
PV+ inhibitory interneurons are the most common type of GABA-ergic cells that express the calcium-binding protein PV+ and receive N-methyl-
Though performance accuracy during the N-back test of the mTBI group tended to be worse than that of the OI group, no significant group differences were found. The lack of a significant difference in N-back accuracy was related to the instructions of the task, in which the participants were asked to pay attention to the performance accuracy, instead of the speed of the response (i.e., not to react as soon as possible). Another potential factor was the ceiling effect of the performance accuracy.
Limitations and conclusions
There are several limitations of the present study that warrant consideration. First, modest sample size and related limited power precluded analyses controlling for potentially confounding psychosocial variables. Second, a deep learning approach would be more powerful than our ML approach. Third, only parent-rated PCS scores were analyzed. Child self-report PCS ratings would likely provide a different pattern of results with respect to brain-behavior relationships, specifically WM evoked MEG responses and the pattern of recovery of PCSs. For example, in our unpublished data of over 1,500 parent-child pairs, at the item level, parents and their children reported symptoms similarly across most items, but parents consistently underreported symptoms compared to children, particularly somatic concerns involving sensitivity to sound, vision problems, fatigue, and dizziness. Fourth, the reliability and validity of the construct of PCS itself have been debated. The behavioral assessment would be strengthened with clinician-rated psychiatric symptoms and/or disorders. Fifth, altered task engagement and co-morbid psychiatric conditions may confound WM-evoked MEG results. However, the study’s standardized assessment of motivation failed to reveal group differences. Furthermore, standardized psychiatric assessment, which was not a focus of these analyses, showed approximately equivalent prevalence of pre-injury current/ongoing disorders in mTBI versus OI such as ADHD (mTBI 9/60 (15.0%); OI 4/37 (10.8%), anxiety disorders (mTBI 15/60 (25.0%); OI 6/37 (16.2%), and substance abuse (none in either group).
The WM evoked MEG study findings yielded several clinical implications regarding executive functioning. Compared with a well-matched comparison group of children with OI, the mTBI group exhibited aberrant WM efficiency and brain activation mechanisms. The WM MEG findings clearly show that in children with mTBI, brain regions that typically subserve healthy WM function show abnormal hypoactivity and that there exists a pattern of recruitment (hyperactivity) of additional brain regions that do not typically subserve healthy WM function. The group differences most likely reflect brain damage in areas of hypoactivity and compensatory plasticity-related changes in areas of hyperactivity. 103 These findings expose regional brain targets for potential treatments to remediate mTBI-related WM changes with modalities such as transcranial magnetic stimulation. 104 Linking the WM MEG evoked data with readily accessible PCS behavioral parent-reported PCS data (see Fig. 4) may lead to a personalized medicine approach with effective treatment modalities, 105 specific to mTBI. Availability and cost of MEG Superconducting QUantum Interference Devices (SQUIDs) technology has limited clinical application of MEG findings. However, MEG will be widely available for mTBI and general research and clinical use because laser-based Optically Pumped Magnetometers (OPMs) have been developed as a wearable, more flexible, less expensive, and very sensitive alternative, whereby sensors that do not require cryogenic cooling and can be flexibly placed on any part of the body.106,107 The OPM-based MEG systems, in combination with a compact magnetic shielded tube, 108 will enhance clinical accessibility of MEG. Furthermore, the OPM sensors will enhance the MEG signals in young children since they can be placed on the scalp and close to the neuronal sources. In contrast, the SQUID-based MEG sensors are mounted to a rigid helmet with thermal insulation, resulting in a wider gap between the sources and sensors.
Transparency, Rigor and Reproducibility Summary
These analyses are derived from data collected systematically at a single site, the University of California, San Diego. The University of California, San Diego Institutional Review Board approved the study. Written informed consent was obtained from parents, and children provided written consent or assent, depending on their age. The study involved an enrolled cohort (N = 97) of injured children aged 8–15 years. Participants were assessed at the time of enrollment and at 3-months postinjury. Assessments included psychiatric, behavioral, and family assessment, neuroimaging, and neurocognitive testing. 109
Authors’ Contributions
M.H.: Writing—review and editing Conceptualization, Formal analysis, Funding Acquisition, Investigation, Methodology, Writing—original draft, Writing—review & editing. A.A.-Q.: Data curation, Investigation, Validation, Writing—review & editing. A.R.-S.: Data curation, Investigation, Validation, Writing—review & editing. E.B.: Conceptualization; Writing—review and editing. E.W.: Conceptualization; Funding Acquisition; Investigation; Methodology; Writing—review and editing. F.V.: Conceptualization; Funding Acquisition; Investigation; Methodology; Visualization; Writing—review and editing. E.T.: Writing—review and editing. J.H.: Conceptualization; Funding Acquisition; Data Curation; Rating the MRI scans; Methodology; Writing—review and editing. C.-K.C.: Writing—review and editing. W.M.: Writing—review and editing. E.Z.: Data Curation; Writing—review and editing. J.M.: Conceptualization; Data Curation; Formal Analysis; Funding Acquisition; Investigation; Methodology; Resources; Supervision; Writing—review and editing.
Footnotes
Author Disclosure Statement
J.E.M. provides expert testimony in cases of traumatic brain injury on an ad hoc basis for plaintiffs and defendants on a more or less equal ratio. This activity constitutes approximately 5% of his professional activities. No competing financial interests exist for the remaining authors.
Funding Information
This research was supported by a National Institute of Child Health and Development Grant HD088438 (Principal Investigator: J.E.M.; Co-investigators: M.-X.H., E.A.W., and F.V.) and by NIH 1S10-OD034302-01 (Principal Investigator: R.R. Lee; Co-investigator: M.-X.H.), and by Merit Review Grants from the Department of Veterans Affairs (Principal Investigator: M.-X.H. I01-CX000499, I01-RX001988, MHBA-010-14F, NURC-022-10F, NEUC-044-06S).
Supplemental Material
References
Supplementary Material
Please find the following supplemental material available below.
For Open Access articles published under a Creative Commons License, all supplemental material carries the same license as the article it is associated with.
For non-Open Access articles published, all supplemental material carries a non-exclusive license, and permission requests for re-use of supplemental material or any part of supplemental material shall be sent directly to the copyright owner as specified in the copyright notice associated with the article.