
Abstract
Finite-element modeling and in vivo MR strain mapping show that mechanical strain concentrates in the cortex, and late-life neurodegenerative sequelae of traumatic brain injury (TBI) are predominantly gray matter disorders. Nonetheless, in vivo evidence of acute gray matter damage after mild TBI (mTBI) has remained elusive. The empirical gap derives from a limitation of conventional diffusion tensor metrics, which are blind to the cortex’s isotropic yet mechanically relevant solid-phase matrix of soma (glial and neural), dendrites, and extracellular scaffold. Here, we leveraged constrained spherical deconvolution (CSD)-derived “total” apparent fiber density (AFD) to index this solid-phase microarchitecture to test two predictions: (1) regional AFD covaries with magnetic resonance elastography (MRE)-derived cortical stiffness, and (2) AFD can detect gray matter injury that tensor metrics miss. We tested the first hypothesis by relating AFD from 349 healthy adults who underwent diffusion MRI to measures of shear modulus from an independent cohort of 59 healthy adults scanned with MRE. The regional distribution of AFD explained 74% of the variance in MRE-measured shear stiffness, indicating AFD is strongly coupled to the microarchitectural features that influence tissue rigidity. We then tested the clinical utility of AFD in three cross-sectional mTBI cohorts—acute (∼72 h), subacute (2 weeks to 90 days), and chronic (>90 days)—each compared with age- and sex-matched controls. Effect sizes were thresholded using Cohen’s d; parcels or tracts with |d| ≥ 2.0 were chosen to isolate effects that are both statistically extreme and robust to distributional effects and technical noise. Using those criteria, 11 cortical parcels in the acute cohort showed decreased AFD. This expanded to 116 parcels in the subacute group and 106 parcels in the chronic cohort; fractional anisotropy detected no parcels, and mean diffusivity flagged only 7–9 parcels. MRE-based stiffness estimates in healthy controls further stratified the observed abnormalities: compliant cortex (∼1.6 kPa) showed AFD gains during recovery; by contrast, the stiffest cortex (∼3.0 kPa) showed persistent decreases, with baseline modulus accounting for >50% of variance in ΔAFD. Across parcels, baseline stiffness from healthy controls predicted the magnitude of AFD change in both the subacute and chronic cohorts: stiffer cortex showed larger AFD decreases; less stiff cortex showed AFD increases (Spearman ρ ≈ −0.72 to −0.74, p < 0.001). AFD also revealed robust abnormalities in 12 major white matter tracts across all mTBI cohorts, outperforming diffusion tensor metrics. Because MRE and diffusion MRI were acquired in independent cohorts, these findings should be interpreted as showing that normative region-wise stiffness gradients predict the direction and magnitude of postinjury AFD alterations. This is the first in vivo evidence that joint diffusion MRI and MRE analysis sharpens mechanistic interpretations of gray matter microarchitecture and detects gray matter disruption across the mTBI timeline.
Introduction
Mild traumatic brain injury (mTBI) is fundamentally a biomechanical disease in which mechanical forces—typically from acceleration, impact, or blast—disrupt normal brain function. 1 A dominant mechanistic paradigm holds that the dysfunction of mTBI arises from microstructural damage to neural tissue, impairing the coordinated signaling of brain networks.2,3 Most evidence supporting this theory comes from large animal studies and human diffusion MRI, both of which emphasize the vulnerability of white matter axons to tensile and shear strains.2,3 Axonal stretch, swelling, and disconnection—collectively referred to as diffuse axonal injury—have been well documented to relate to cognitive, affective, and sensorimotor dysfunction following head trauma.2,3
However, there exists a critical and underacknowledged discrepancy between mechanical models of head injury and empirical imaging findings. Finite-element simulations of TBI consistently predict that during rapid head acceleration, strain concentrates disproportionately in gray matter, particularly at the gray-matter-skull and white matter interfaces where mismatches in mechanical impedance amplify local deformation.4–7 This can be especially consequential given the cortex’s laminar architecture and vascular richness,8,9 which may compound its vulnerability to strain. Long-term, TBI and repetitive head impact are associated with various neurodegenerative diseases of the gray matter. 10 Despite this, most of the acute to subacute stage neuropathological and neuroimaging studies have focused on white matter abnormalities, and detecting gray matter pathology in vivo in humans has proven difficult. 11
MR imaging investigations of mTBI have primarily used diffusion tensor imaging (DTI), which quantifies axonal alignment and integrity. Diffusion tensors are usually reduced to scalar metrics, such as fractional anisotropy (FA) and mean diffusivity (MD). These metrics have robust sensitivity to disruption of white matter integrity12,13 but do not detect abnormalities in gray matter across mTBI cohorts.11,14 This is not necessarily because gray matter is unaffected but because DTI is not sensitive to gray matter changes. 15 Unlike the coherent, fiber-aligned structure of white matter, gray matter contains densely packed, nonuniformly oriented dendrites, axons, glial processes, and vasculature—yielding a largely isotropic diffusion signal. 15 The Gaussian, single-compartment diffusion assumptions used in DTI fail to capture intravoxel diffusion heterogeneity arising from barriers, compartmentalization, and microstructural complexity in gray matter.15–17
Advanced diffusion models allow for multiple compartments within each voxel (e.g., neurite orientation dispersion and density imaging; NODDI 18 ) or describe the signal nonparametrically (Q-ball imaging [QBI], 19 diffusion spectrum imaging [DSI] 19 ) One such nonparametric model, a version of QBI, is constrained spherical deconvolution (CSD), which models the diffusion signal on a sphere and allows for multiple orientations of fibers via the fiber orientation distribution function (fODF)—thus allowing for intravoxel orientational heterogeneity. From the fODF, the apparent fiber density (AFD) metric can be derived. 20 In its conventional “fixel-wise” form, AFD corresponds to the fODF amplitude along each resolved orientation and, at sufficiently high diffusion weightings, is proportional to the intra-axonal volume fraction along that orientation. The total AFD (AFD) is obtained by integrating the fODF over all directions (equivalently, the zeroth-order l = 0 spherical-harmonic term), and at high b-values can approximate the total intra-axonal volume fraction within a voxel. However, at the more moderate b-value used in this study (b = 1000 s/mm2), this proportionality is weakened, and AFD is better interpreted as a voxelwise, orientation-independent index of the overall amount of diffusion-hindering, tissue-like compartments in gray and white matter, rather than a calibrated intra-axonal volume fraction. Throughout this article, “AFD” refers to this voxelwise total AFD, the l = 0 term. In gray matter, the diffusion-hindering compartments contributing to AFD likely include distinct microstructural elements—such as dendrites, glial processes, and short axon terminals—that exhibit anisotropic or restricted diffusion within a voxel. 21 As such, CSD-based AFD remains sensitive to the cytoarchitecture in the gray matter. 8 AFD has shown promising sensitivity to microstructural alterations in gray matter in both clinical and preclinical studies, outperforming FA and MD in several contexts. 22 Yet its precise biomechanical meaning in the human brain remains unclear. Providing such a biomechanical interpretation is crucial because it converts AFD from a purely descriptive marker into a mechanistically informed metric that can be integrated with models of tissue deformation, vulnerability, and recovery.
To link AFD (specifically, total AFD) with the biomechanics of brain tissue, we require a framework that links diffusion-derived microstructure to tissue stiffness. Poroelastic theory treats brain parenchyma as a biphasic material composed of (1) a solid matrix substrate—soma, dendritic arbors, glial cytoskeleton, perineuronal net, axons, and other extracellular-matrix scaffolds, and even the fine microvascular framework 23 —and (2) an interstitial fluid. 24 At the frequencies used in magnetic resonance elastography (MRE), fluid cannot redistribute quickly enough, so the estimated shear modulus chiefly reflects the rigidity of the solid matrix.24–26 Crucially, this same solid phase also defines the diffusion micro-environments that give rise to AFD; the “compartments” in diffusion MRI correspond to spatially confined regions—intracellular, axonal, glial, or extracellular—within which water encounters different degrees of restriction.8,20,21,27,28 Hence, both AFD and MRE-based stiffness can theoretically probe complementary properties of a common structural substrate. Establishing a link between microstructural imaging (diffusion MRI-derived AFD) and mechanical imaging (MRE-derived stiffness estimates of the solid phase) would allow us to interpret them within a single solid-phase framework.
In this study, we hypothesize that using CSD-derived total apparent fiber density (hereafter, AFD) as a marker of gray matter architecture will be (1) predictive of MRE-derived estimates of tissue stiffness in the brain, and (2) more sensitive to microstructural changes between healthy and mTBI groups than traditional diffusion measures. To test these hypotheses, we first assessed the relationship between AFD and stiffness of both gray and white matter, under the assumption that regional differences in microarchitecture—independent of pathology—should produce corresponding variation in both diffusion contrast and MRE-derived stiffness. This analysis served as a critical validation step: if AFD covaries with regional stiffness in the healthy brain, then it can be used to study changes to the solid-phase matrix over time in mTBI. We thus tested whether AFD could detect gray matter microstructural alterations in mTBI and whether such alterations evolve or persist across time. To do so, we examined three cross-sectional cohorts representing acute (∼72 h postinjury), subacute (2 weeks to 90 days), and chronic (>90 days) timepoints following mTBI, each compared to demographically matched control participants. We performed parcel-wise analysis of AFD in cortical and subcortical gray matter and, in parallel, measured DTI-derived FA in the same regions to directly compare the sensitivity of tensor-based versus AFD-based models. Finally, we asked whether intrinsic gray matter stiffness estimated with MRE in healthy controls modulates both the vulnerability to injury and the subsequent AFD trajectory after mTBI. Overall, this study design allowed us to assess both the presence and temporal evolution of gray matter abnormalities after injury, addressing a key gap in the neurotrauma literature.
Methods
MRE data acquisition and processing
MRE data were obtained from a publicly available dataset collected from healthy control participants at the University of Delaware (UDEL). 29 The cohort consisted of 59 subjects (33 females, 26 males, average age of 37.4, range 15–75), and the data were collected using a Siemens 3T Prisma scanner with a 64-channel head/neck coil (complete protocol available at Ref. 29 ). Skull harmonic motion was generated using a resoundant acoustic (Resoundant Acoustic Driver System, Resoundant™ Rochester, MN) driver system with a soft pillow occipital actuator at 30, 50, and 70 Hz. A 3D multiband, multishot spiral sequence was used to measure brain tissue displacements, providing whole-brain coverage with an imaging resolution of 1.5 mm isotropic (240 × 240 × 120 mm³). The complex shear modulus (G) was estimated from the MRE displacement with a nonlinear inversion (NLI) algorithm30,31 to quantify viscoelastic shear stiffness (μ) and damping ratio (ξ). We used data that has been processed using the NLI implementation distributed with this publicly available dataset, as described in detail by Bayly and colleagues and related NLI work.30,32 In this implementation, NLI solves the viscoelastic inverse problem on overlapping 19.6 mm cubic finite-element subzones, and the resulting stiffness field is interpolated back to the native imaging grid. Consequently, each voxel’s stiffness estimate reflects the solution over a spatial subdomain rather than strictly local tissue. Thus, the effective spatial resolution of the stiffness estimates is on the order of the subzone dimension (∼2 cm), with the precise degree of smoothing dependent on overlap, regularization, and interpolation. Accordingly, AFD–stiffness associations are interpreted at a mesoscale (regional/parcel) level rather than as millimeter-scale colocalization. All group analysis and correlations with diffusion data were conducted in a common registered space—the 1 mm MNI152 template (Montreal Neurological Institute). Briefly, each subject’s MRE T2-magnitude image and T1 image were skull stripped using the FSL (FMRIB Software Library, 6.0.7) brain extraction function. The magnitude image was then linearly registered to the T1 image using rigid and affine transformations using ANTs (Advanced Normalization Tools, http://stnava.github.io/ANTs/). The resulting transformation matrix was concatenated with the nonlinear transform obtained from warping the subject’s T1 image to the MNI152 space. This concatenated matrix and warp were applied to the material property scalar maps to align them with the MNI space for further analysis. For generalizability analyses, we additionally used an independent normative MRE dataset (“MRE134”) comprising 134 neurologically healthy young adults (collected at 6 sites by various research groups, age 18–35 years, mean age ± SD: 23.4 ± 4.0 years, 78 female and 56 male) from a previously published viscoelastic atlas. 32 The 50-Hz shear stiffness maps from MRE134 were already reconstructed and normalized to MNI152 space; we applied the same analysis and AAL3 parcellation pipeline as for the UDEL cohort, without further modification.
The MRE-derived stiffness was compared to diffusion-MRI-derived AFD from a healthy control group comprising 349 healthy participants collected at the University of Rochester: 188 females, 160 males, and one individual whose sex was not recorded. Ages spanned 15–86 years (mean ± SD = 50.4 ± 16.9 years; median = 53 years).
Acute mTBI subjects
We also analyzed a previously collected cohort of concussed collegiate athletes (15 females, 14 males; mean age = 19.1 ± 1.26 years) and age-matched male controls (n = 15; mean age = 19.67 ± 1.25 years). These individuals were part of a broader prospective NCAA Division I/III study conducted at the University of Rochester and the Rochester Institute of Technology between 2009 and 2014. 33 Concussion diagnoses were made on the field by certified athletic trainers using the Sport Concussion Assessment Tool 2. Diffusion MRI was obtained within 72 h postinjury. Diagnosis and imaging were conducted independently of decisions regarding inclusion in the present analysis. This secondary analysis was approved by the University of Rochester IRB under exemption status.
Subacute and chronic mTBI subjects
We conducted a retrospective analysis of high school and college athletes diagnosed with concussion and postconcussive syndrome (PCS) who underwent MRI between February 2016 and December 2019. All subjects were referred to the University of Rochester Medical Center outpatient imaging center due to incomplete symptom resolution following concussion. The study was approved by the University of Rochester Institutional Review Board, and all participants provided written informed consent. Inclusion criteria included a history of concussion and PCS; exclusion criteria were standard MRI contraindications (e.g., dental braces, skull fracture, prior brain surgery, shunts). Concussion diagnoses were made in the emergency department and documented in the medical record. PCS diagnosis was determined through multidisciplinary consensus by neurologists, physical medicine and rehabilitation physicians, and sports medicine providers. All diagnoses were made independently of, and blinded to, this study’s hypotheses. Control participants were age-matched individuals with no history of concussion, recruited independently but scanned using the same MRI protocol and scanner. MRI and clinical data were curated retrospectively by a single clinician (S.P.M.) who also de-identified the dataset. Data curation occurred between June and December 2022. Other study investigators remained blinded to participant identity. The number of previous concussions, presence of loss of consciousness, and time between injury and MRI were extracted from medical records. All MRIs were reviewed by a board-certified neuroradiologist (S.P.M.), blinded to group assignment and hypotheses, to screen for motion artifacts, hemorrhage, abnormal signal, hydrocephalus, or congenital anomalies. A total of 44 mTBI participants with usable diffusion MRI and known injury-to-scan intervals were classified as subacute mTBI (2 weeks to <90 days postinjury, n = 27, all female; mean age = 20.4 ± 2.7 years) and chronic mTBI (>90 days postinjury; n = 17 subjects, all female; mean age = 19.1 ± 3.43 years). The control group used for comparison to the subacute and chronic mTBI cohorts consisted of all female subjects (n = 26; age = 20.7 ± 3.8 years) from the same scanner and protocol. This control group was a subset of 349 healthy participants collected at the University of Rochester: 188 females, 160 males, and one individual whose sex was not recorded. Ages spanned 15–86 years (mean ± SD = 50.4 ± 16.9 years; median = 53 years). This entire control group is also used for testing the relationship between AFD and stiffness measured with MRE.
Analysis
Whole-brain diffusion metrics were computed using the DIPY toolbox (version 1.1.1, https://www.dipy.org). Fiber orientation distributions were estimated using CSD, and AFD was obtained as the zeroth-order (l = 0) spherical-harmonic coefficient of the fODF in each voxel (i.e., the spherical-mean fODF amplitude), yielding a single scalar map per subject. In parallel, DTI fitting was performed to calculate FA and MD using FSL DTIFIT. 34 These scalar maps—AFD, FA, and MD—were then used as complementary diffusion-derived microstructural metrics for direct head-to-head comparison to detect gray matter differences between mTBI and controls.
To enable voxelwise comparison of AFD and FA across subjects in a common anatomical space, we employed the Tract-Based Spatial Statistics framework in FSL.34,35 This process is specifically designed for diffusion MRI data. Each subject’s FA image was nonlinearly registered to the FMRIB58_FA template (in Montreal Neurological Institute (MNI) 152 1 mm space) using FMRIB's Nonlinear Image Registration Tool (FNIRT), and the resulting transformations were applied to both the FA and corresponding AFD maps using the tbss_non_FA utility in FSL. This procedure placed all diffusion metric maps into a common standard space, enabling voxelwise correspondence across individuals.
We used the AALv3 gray matter atlas 36 (in MNI152 1 mm space) to parcellate the brain into discrete anatomical regions. For each subject, the mean AFD and FA values across all voxels within each parcel were computed. To account for intersubject variation in global signal intensity, these parcel-wise means were normalized by the subject’s global AFD or FA, defined as the mean value across all voxels with nonzero atlas labels.
Formally, for subject
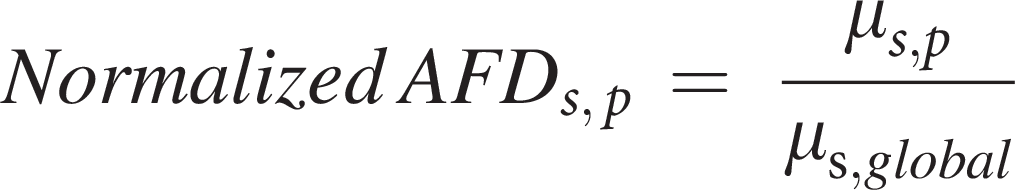
Where
Rigor and reproducibility
To ensure that we focused only on brain regions showing meaningful group differences, we calculated parcel-wise Cohen’s d for both AFD and FA and retained parcels with |d| ≥ 2.0 for all subsequent analyses and visualization. A |d| ≥ 2.0 is far beyond measurement errors associated with DTI (≈0.20 SD 37 ). Interpreted through normal-theory benchmarks, |d| = 2 implies 97.7% of mTBI values lie above or below the control mean, and that a randomly chosen TBI value will differ from a randomly chosen control value 92.1% of the time. From a diagnostic perspective, the same separation translates to a number needed to diagnose of roughly 1.5—in other words, evaluating just one or two additional individuals would, on average, identify one extra true case beyond baseline. Taken together, these considerations indicate that our |d| ≥ 2.0 threshold isolates effects that are not only statistically extreme but also ensure that subsequent interpretations are grounded in a robust signal rather than distributional effects and technical noise. Finally, since diffusion and MRE datasets were acquired in independent healthy control cohorts, all analyses linking AFD and stiffness are based on spatial correspondence in a common template space rather than within-subject multimodal acquisitions.
Results
AFD varies systematically with tissue stiffness across the brain
If there is an intrinsic relation between solid-phase microstructure and mechanical rigidity, then AFD should increase with stiffness in both gray and white matter. We tested this in two ways: agnostic to anatomical location and in a region-driven manner using independently defined gray matter parcels of the brain.
To test whether AFD reflects biomechanically meaningful microstructural variation, we first evaluated the relation between voxelwise AFD and tissue stiffness derived from MRE at 50 Hz harmonic head motion. In gray matter, we grouped voxels into nonoverlapping bins based on shear stiffness; AFD increased monotonically with stiffness, plateauing at higher stiffness values (Fig. 1A). In white matter, AFD also scaled positively with stiffness (Fig. 1B). To verify that the underlying stiffness estimates and their dynamic range were not idiosyncratic to a single dataset, we compared gray matter stiffness between the UDEL and an independent normative MRE atlas dataset (MRE134). Mean gray matter stiffness in MRE134 increased almost linearly across stiffness bins defined in UDEL (R2 = 0.99, p < 0.001; Supplementary Fig. S2A), and parcel-wise median stiffness was likewise highly reproducible between datasets (R2 = 0.89, p < 0.001; Supplementary Fig. S2B), indicating that the full distribution of gray matter stiffness, including its lower tail, is robust across acquisitions. These findings support the hypothesis that AFD and mechanical stiffness both reflect solid-phase material properties of the tissue.
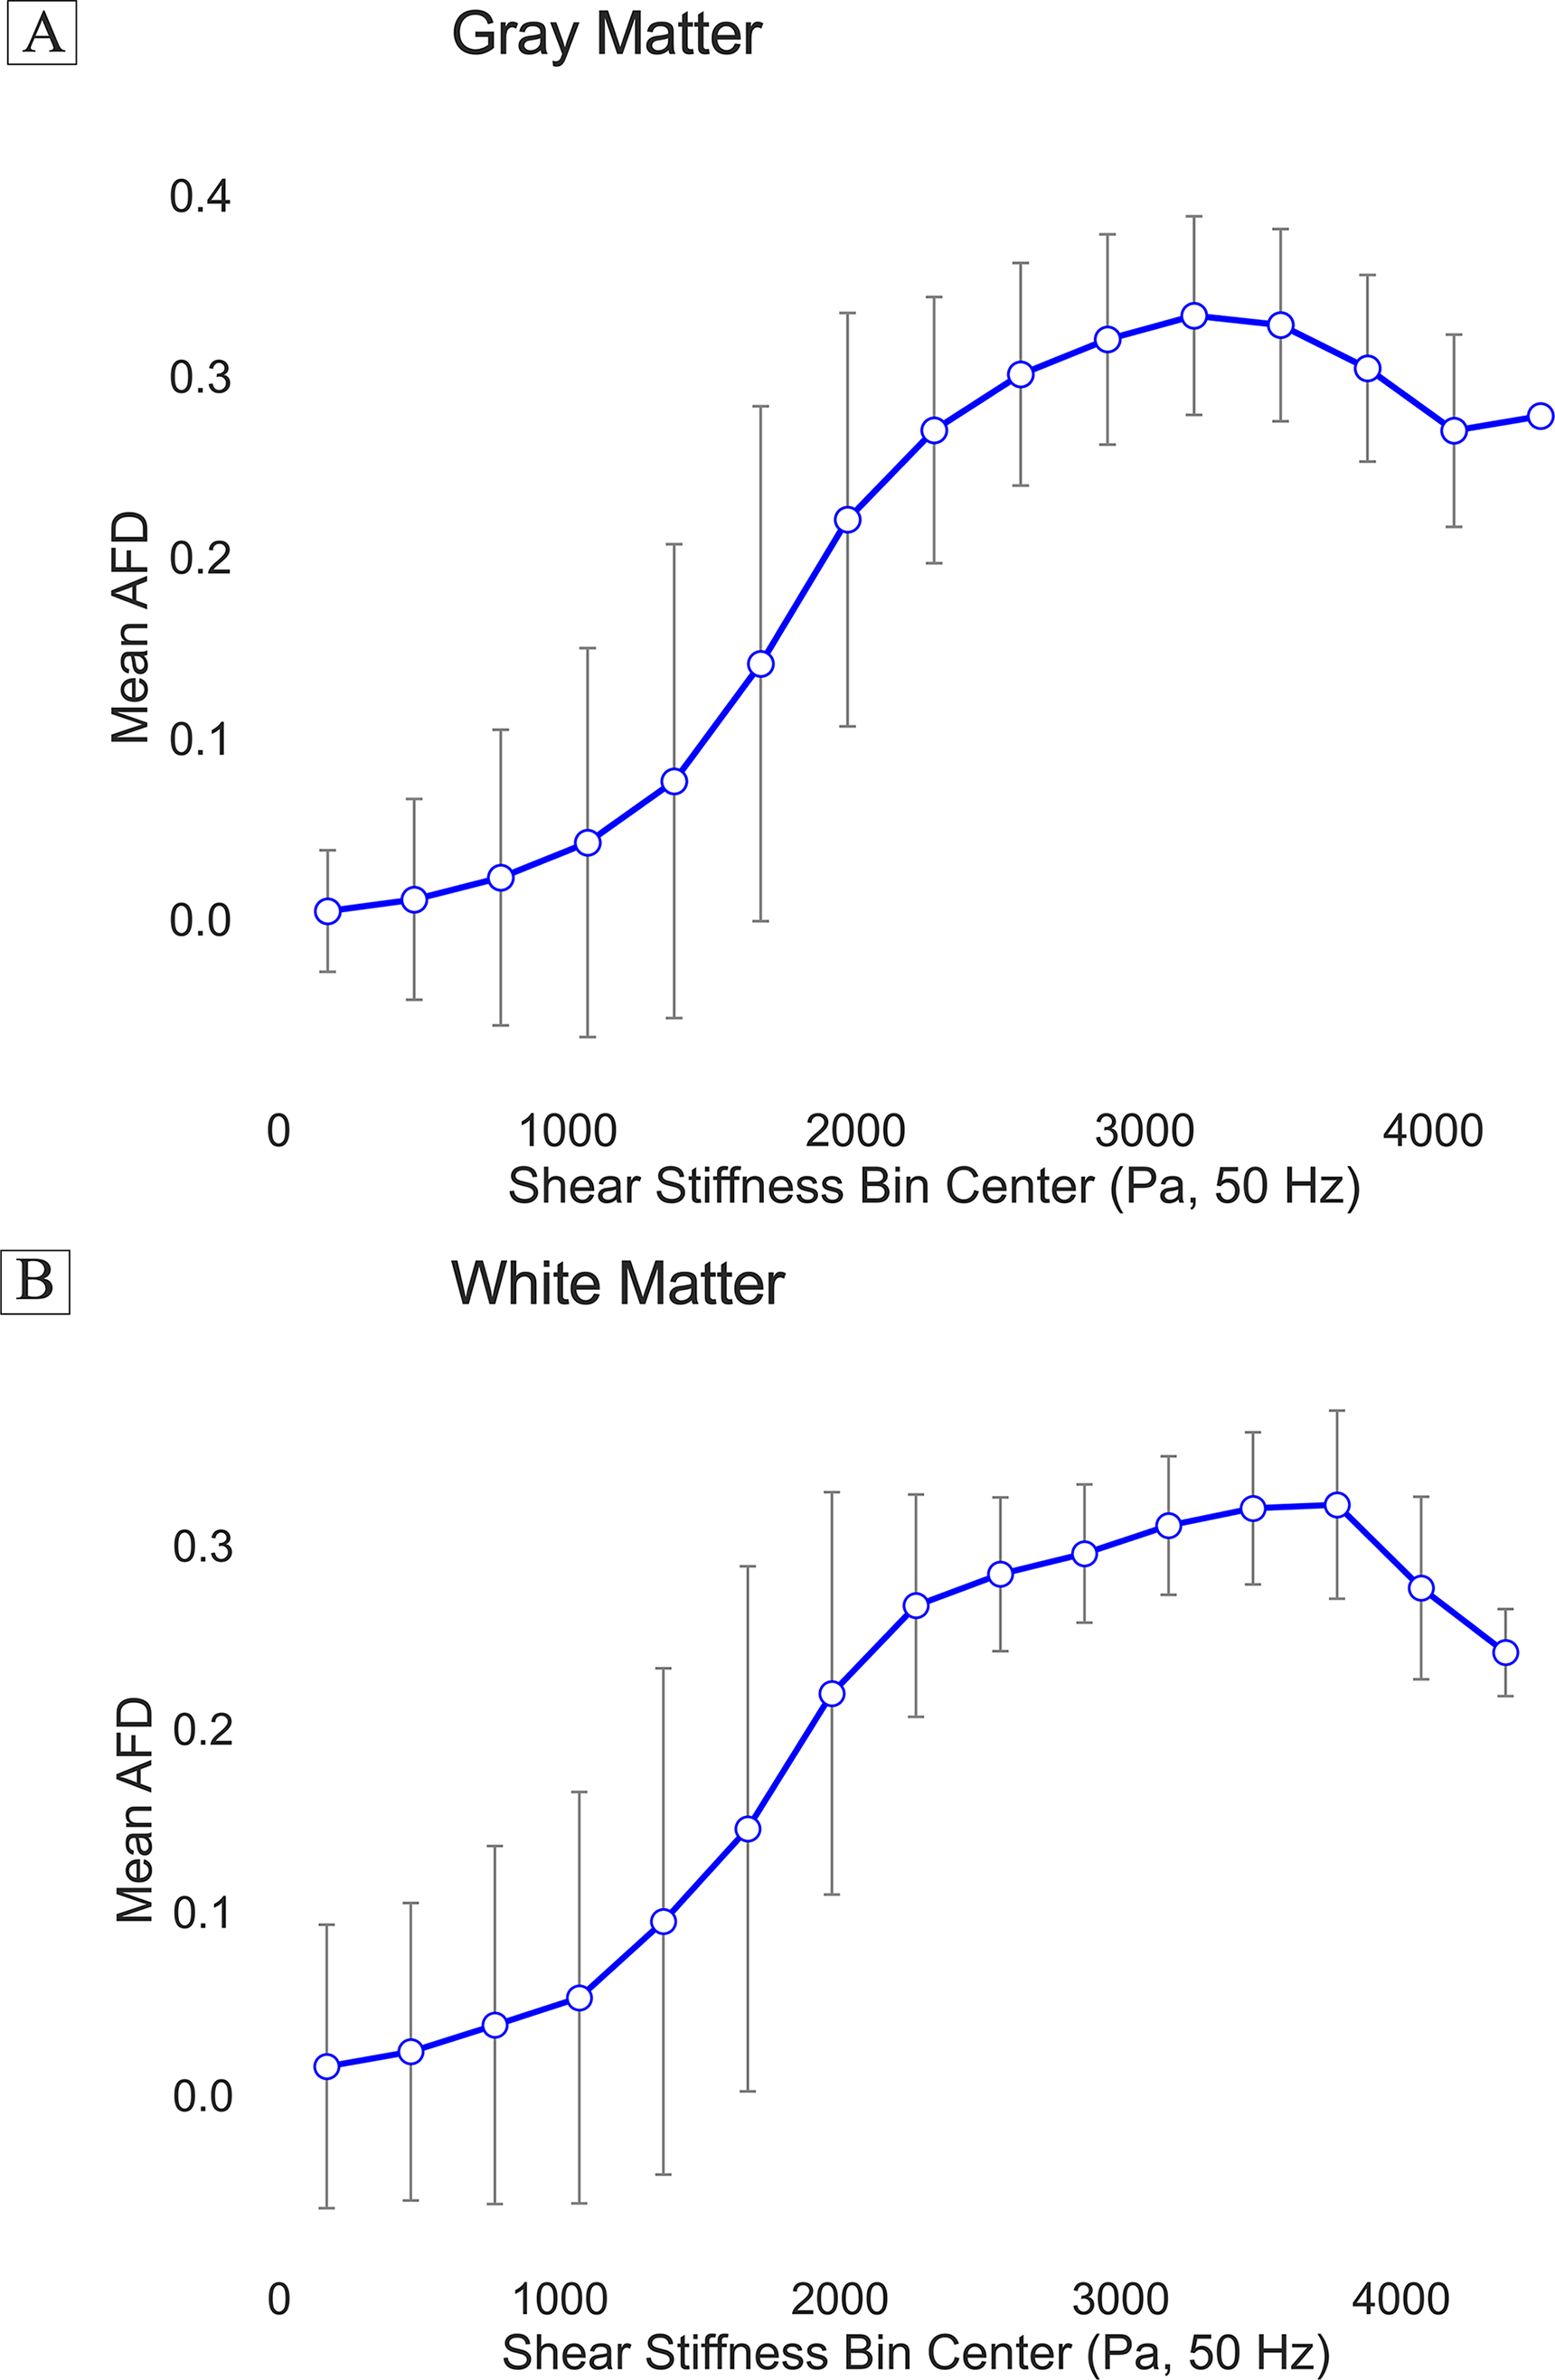
Voxelwise relationship between apparent fiber density (AFD) and MRE-derived shear stiffness in gray and white matter. AFD values were averaged within nonoverlapping shear stiffness bins across the brain, separately for gray matter
We then tested whether AFD and stiffness co-vary across independently defined cortical and subcortical gray matter parcels (using the AAL3 atlas). AFD was strongly positively related to stiffness (R2 = 0.74, p < 0.001; Fig. 2; see also Supplementary Fig. S1 for equivalent findings 30 and 70 Hz MRE). This AFD–stiffness coupling replicated in the independent MRE134 dataset (R2 = 0.72, p < 0.001; Supplementary Fig. S3), demonstrating that the relationship between microstructural signal and regional mechanical stiffness generalizes across cohorts. This parcel-based analysis complements the voxelwise findings by demonstrating that the correlation between AFD and stiffness is preserved when diffusion and mechanical metrics are aggregated at a larger anatomical scale and using independent anatomical criteria.
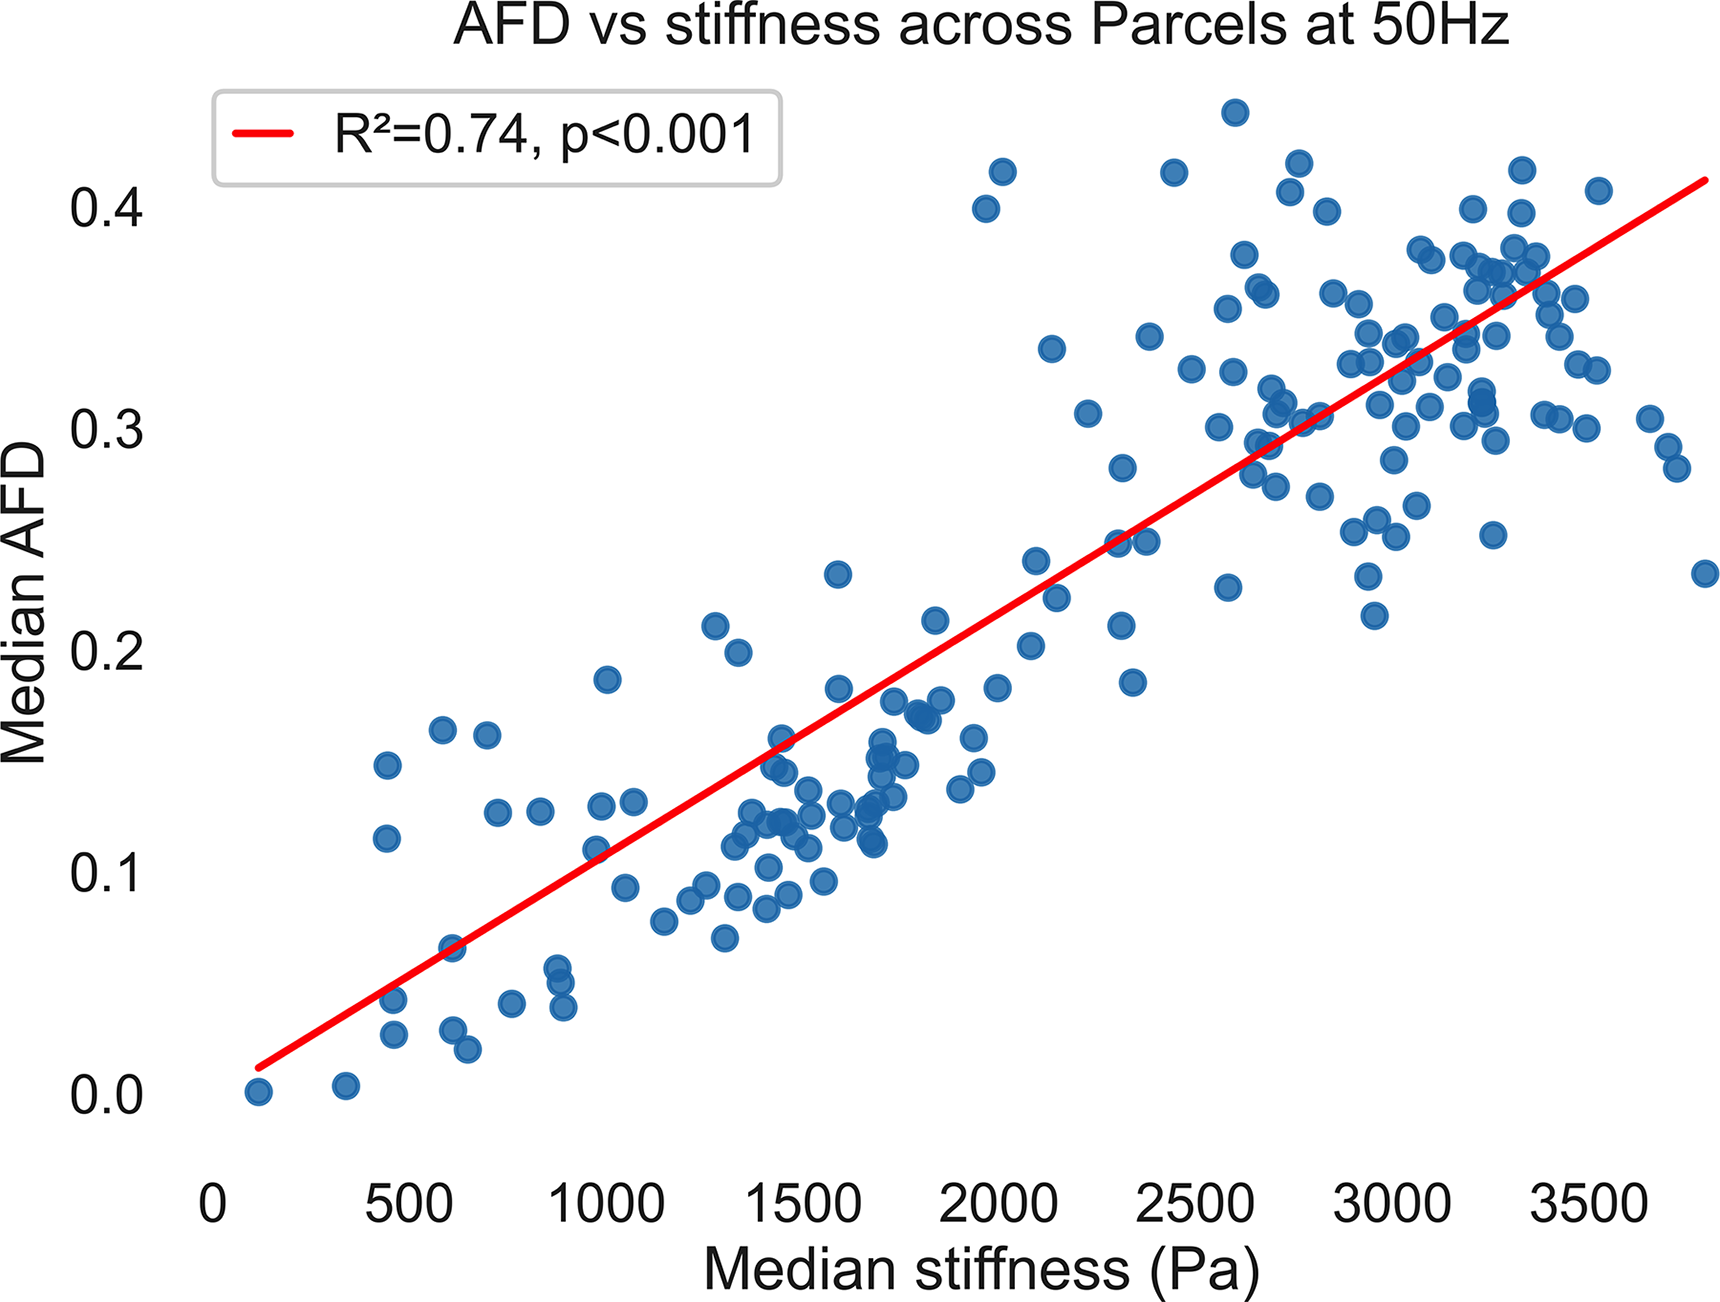
Apparent fiber density (AFD) covaries with MRE-derived shear stiffness across anatomically defined gray matter parcels. 50 Hz MRE actuation frequency. Each blue dot represents one cortical or subcortical parcel from the AAL atlas, positioned by its median shear stiffness (x-axis) and median AFD (y-axis). The red ordinary-least-squares fit indicates a strong positive association between AFD and stiffness (R2 = 0.74, p < 0.001). An analogous linear AFD–stiffness relationship is observed at 30 and 70 Hz (Supplementary Fig. S2), although the absolute stiffness values and slope of the relationship differ with driving frequency, in line with frequency-dependent viscoelastic stiffening of brain tissue. These findings support the hypothesis that diffusion-restricted microstructural compartments (captured by AFD) and bulk tissue rigidity (captured by MRE) index common underlying properties of the brain’s solid phase. MRE, magnetic resonance elastography.
These findings: (1) support the premise that the microstructural properties that govern water diffusion, which AFD measures, also contribute to tissue rigidity, which is what MRE measures; and (2) motivate the hypothesis that solid-phase substrate is the key target for mTBI injury. We therefore sought to test whether AFD would be able to identify injury in gray matter, which has eluded prior investigations focused on diffusion tensor-based metrics.
AFD identifies injury in both gray and white matters
We then tested whether AFD could detect and tract mTBI-associated gray- and white-matter injury across the postinjury timeline. We examined three cross-sectional cohorts representing the acute (∼72 h), subacute (2 weeks to 90 days), and chronic (>90 days) phases following mTBI, each compared to a matched control group. We computed voxelwise AFD maps for each subject and extracted region-wise summary metrics from a standardized set of cortical and subcortical gray matter parcels defined by the AAL3 atlas. Between-group differences were quantified using Cohen’s d effect sizes (mTBI minus the respective control group).
We found that in the acute phase, 11 parcels showed large group differences (|Cohen’s d| ≥ 2.0) and exhibited lower AFD in mTBI participants relative to controls, with no regions showing increased AFD. Anatomically, all the regions showing significant difference between groups in the acute phase were either in the midbrain or on the ventral surface of the brain next to the stiff tentorium or rigid skull. In the subacute phase, 116 brain regions exhibited large group differences (d ≤ 2.0 and d ≥ 2.0) compared to the respective control group (Fig. 3 [middle], Fig. 4B, Supplementary Fig. S2): 36 regions showing increased AFD and 80 regions showing decreased AFD in mTBI relative to controls. The regions with large effects in the acute cohort were a subset of the subacute regions. Finally, in the chronic phase, 106 regions met the threshold (d ≤ 2.0 or d ≥ 2.0), including 31 with increased AFD and 75 with reduced AFD in mTBI. The chronic phase map is a subset of the subacute (Fig. 3 [bottom], Fig. 4B) and included only three regions identified in the analysis of the acute cohort (the ventral tegmental area, fusiform gyrus, and cerebellum crus). These findings provide in vivo evidence that AFD can capture temporally dynamic changes in tissue microstructure following mTBI.
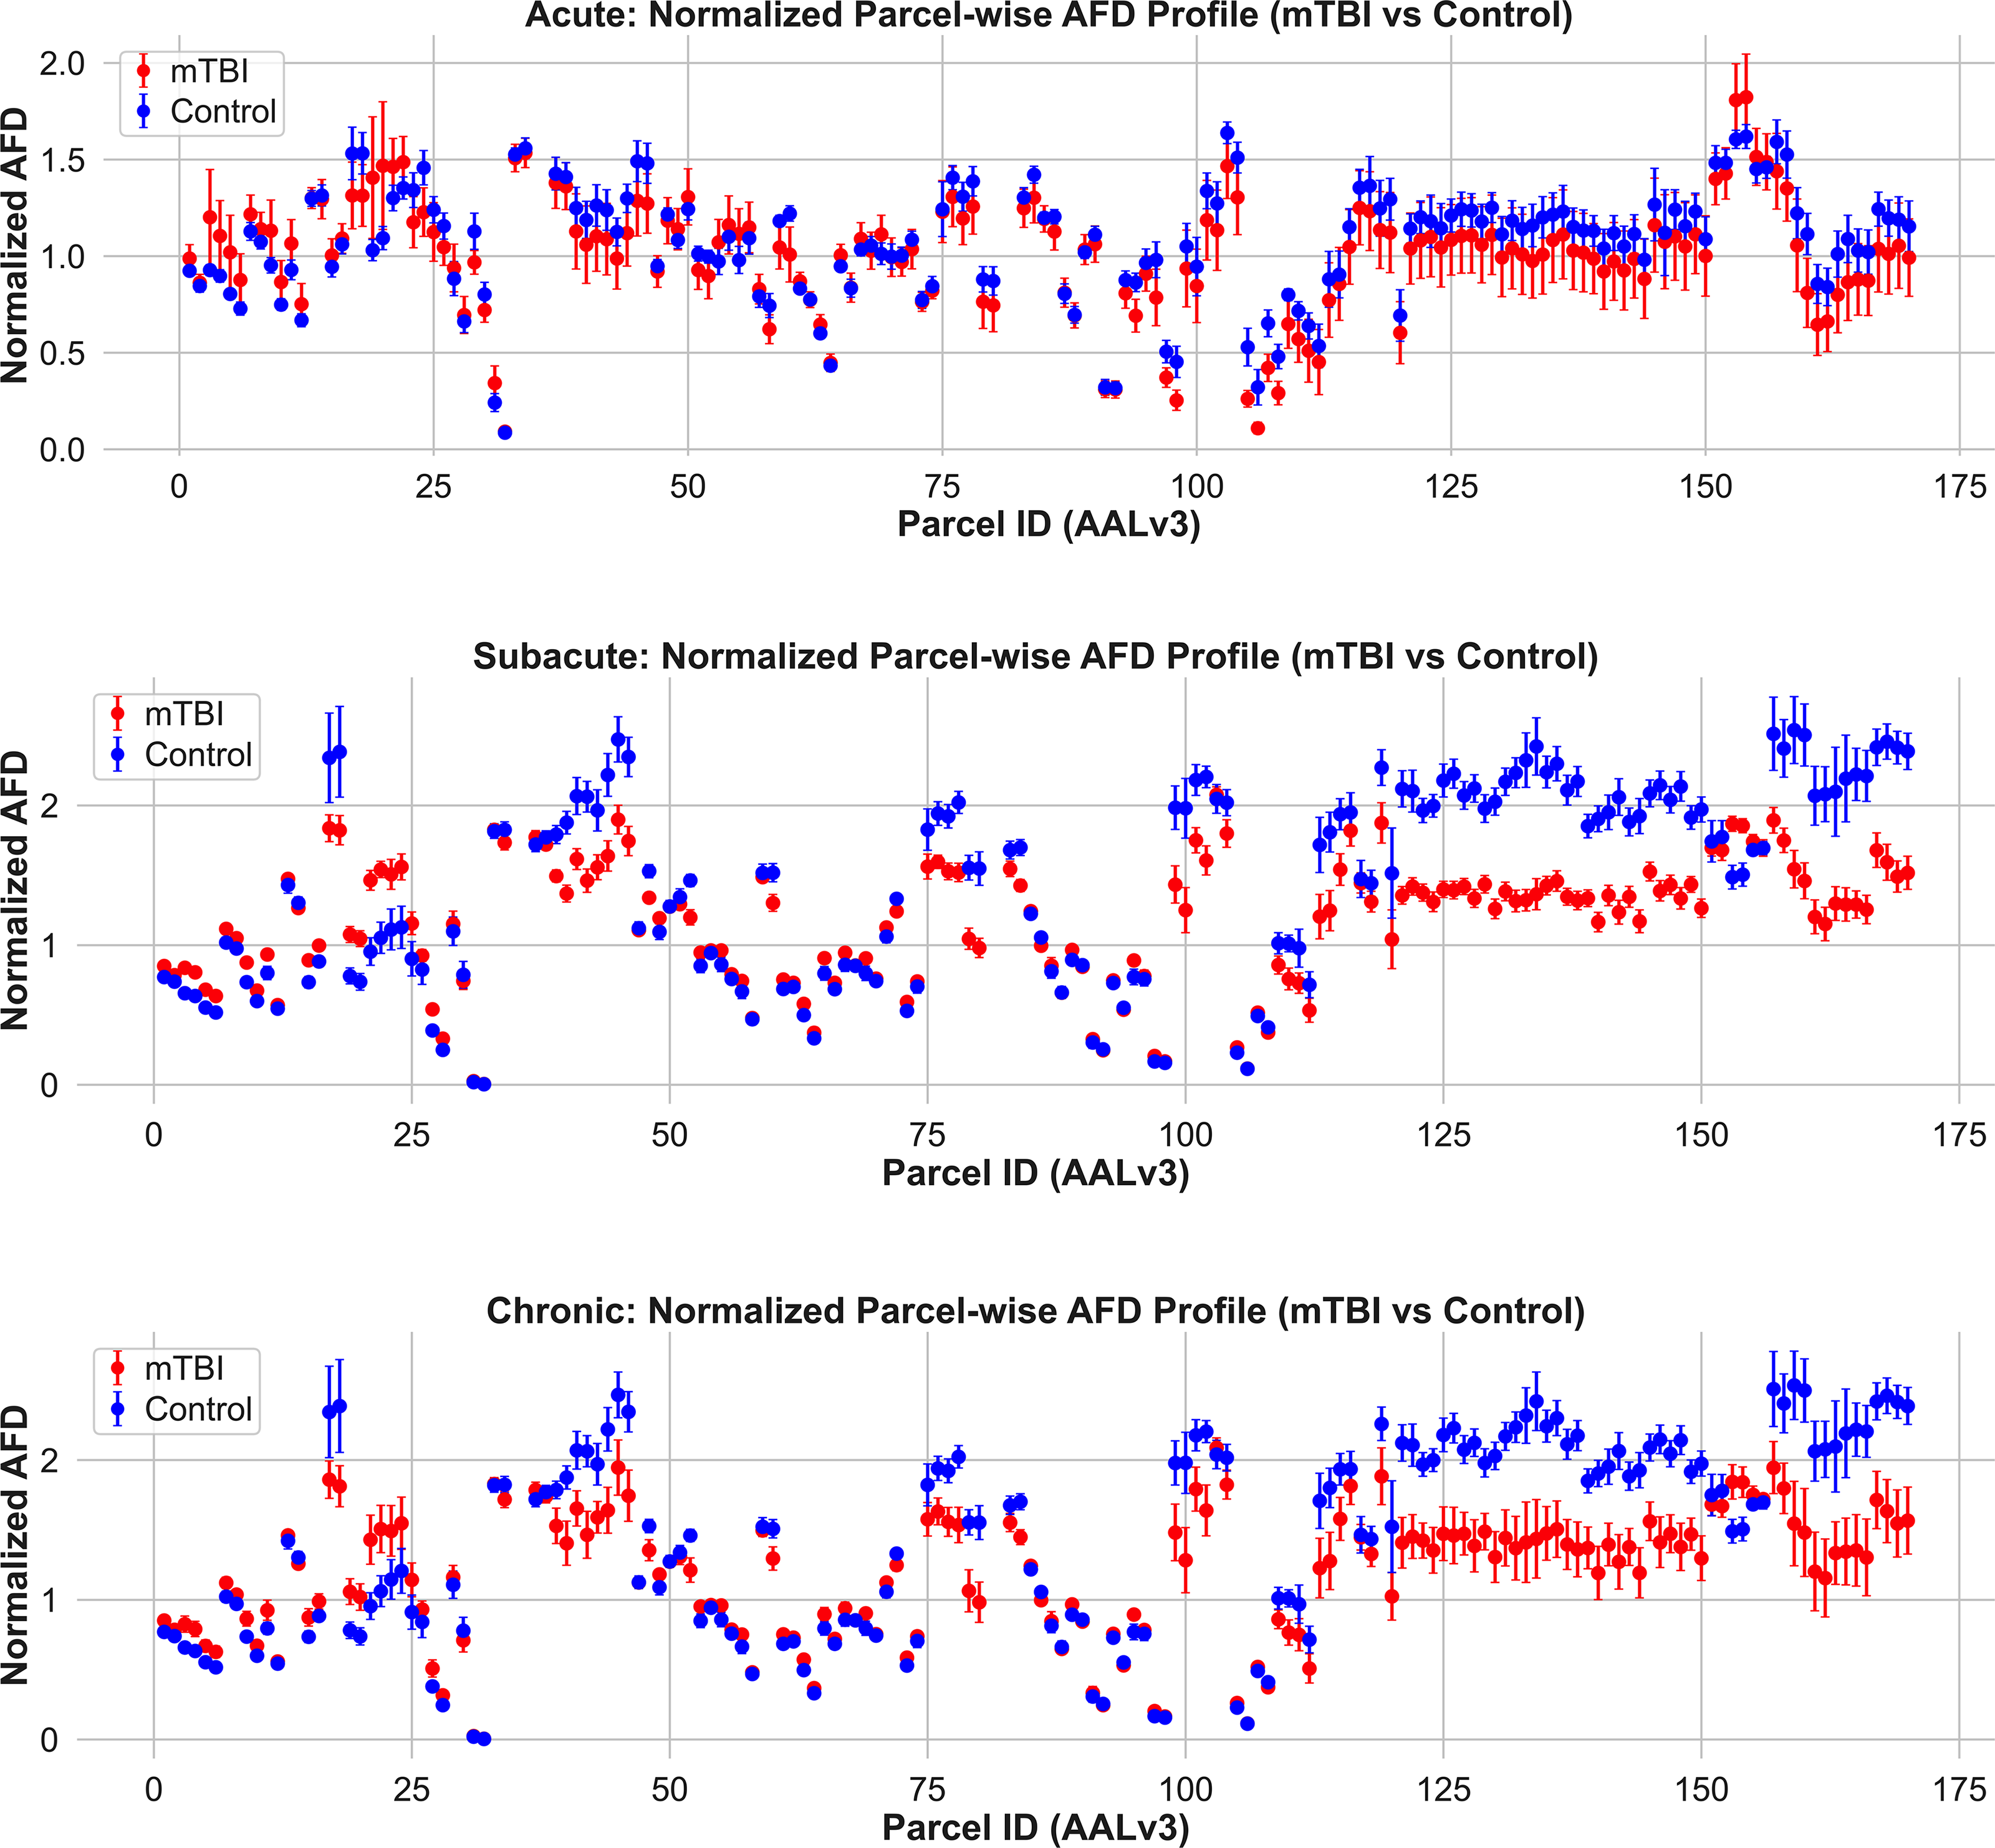
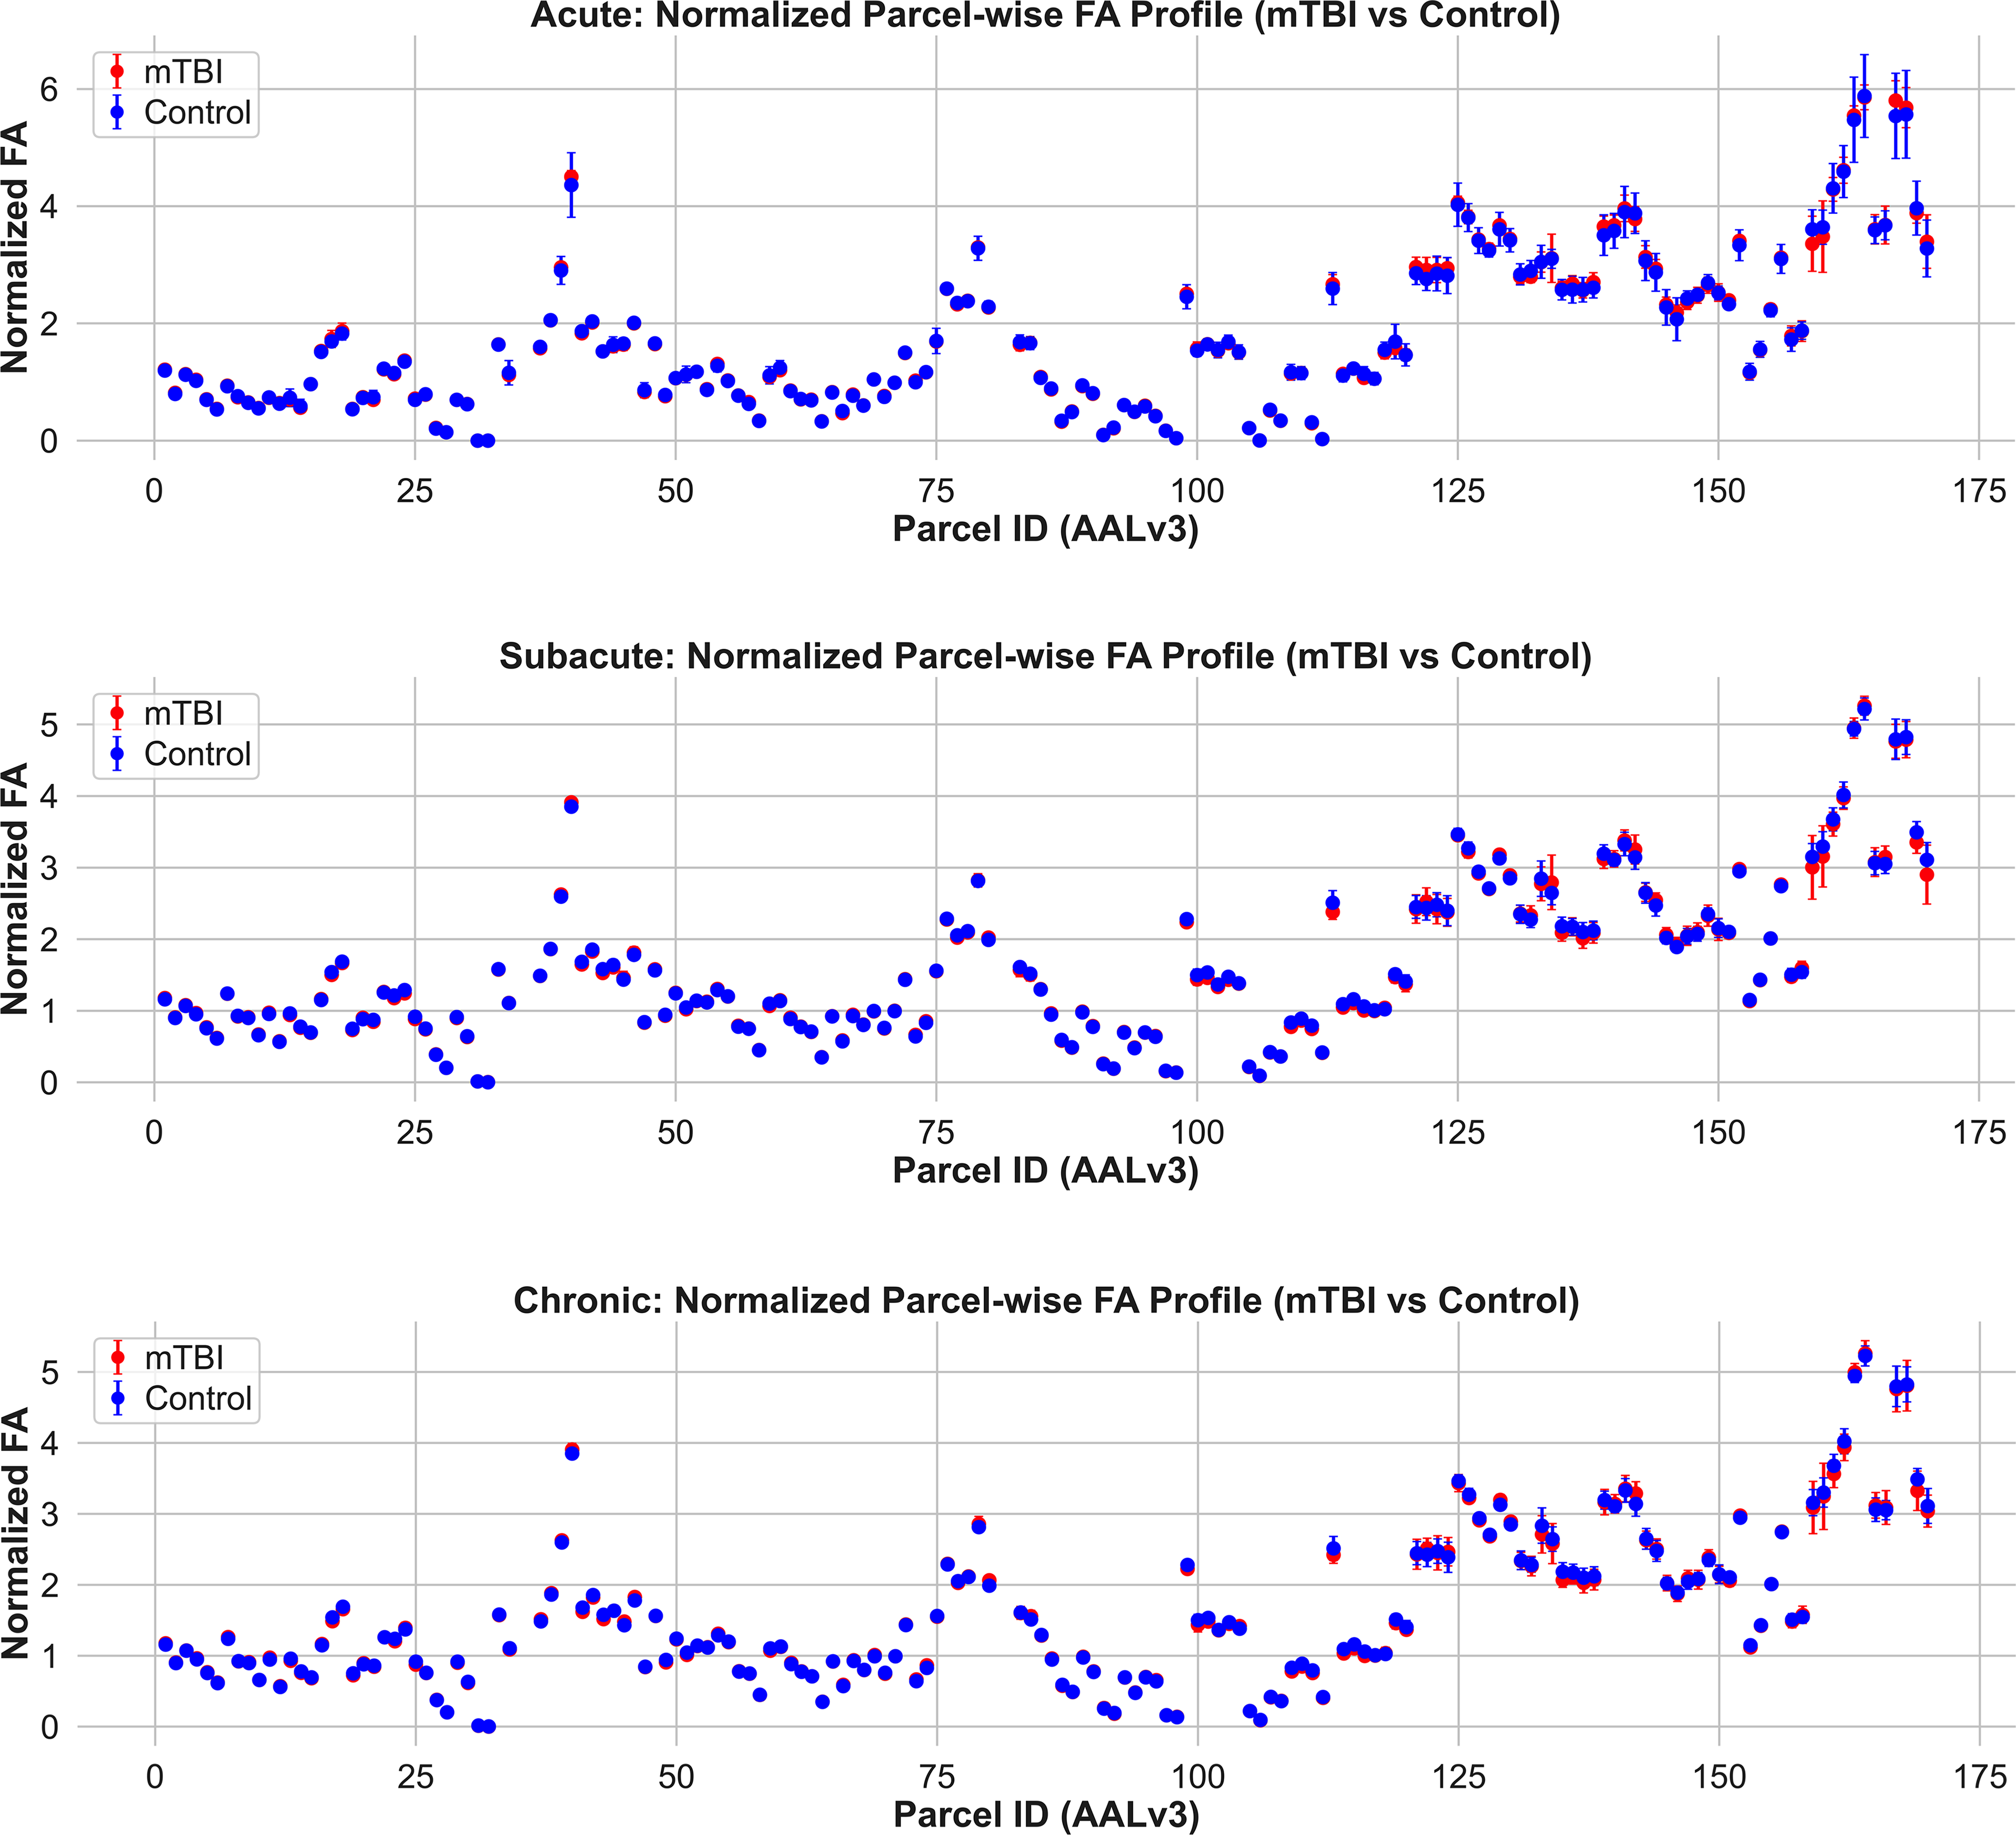
Normalized apparent fiber density (AFD) profiles across gray matter parcels in mTBI and control groups. Mean ± SD AFD values are shown for each AALv3-defined gray matter region in the acute (top), subacute (middle), and chronic (bottom) phases postinjury. Compared to controls, mTBI participants exhibit lower AFD in numerous regions across all timepoints, particularly in the subacute and chronic phases. These differences are spatially distributed and most pronounced in frontal, temporal, and limbic cortices. These findings highlight the enhanced sensitivity of AFD over FA for detecting gray matter microstructural abnormalities in mTBI. mTBI, mild traumatic brain injury.
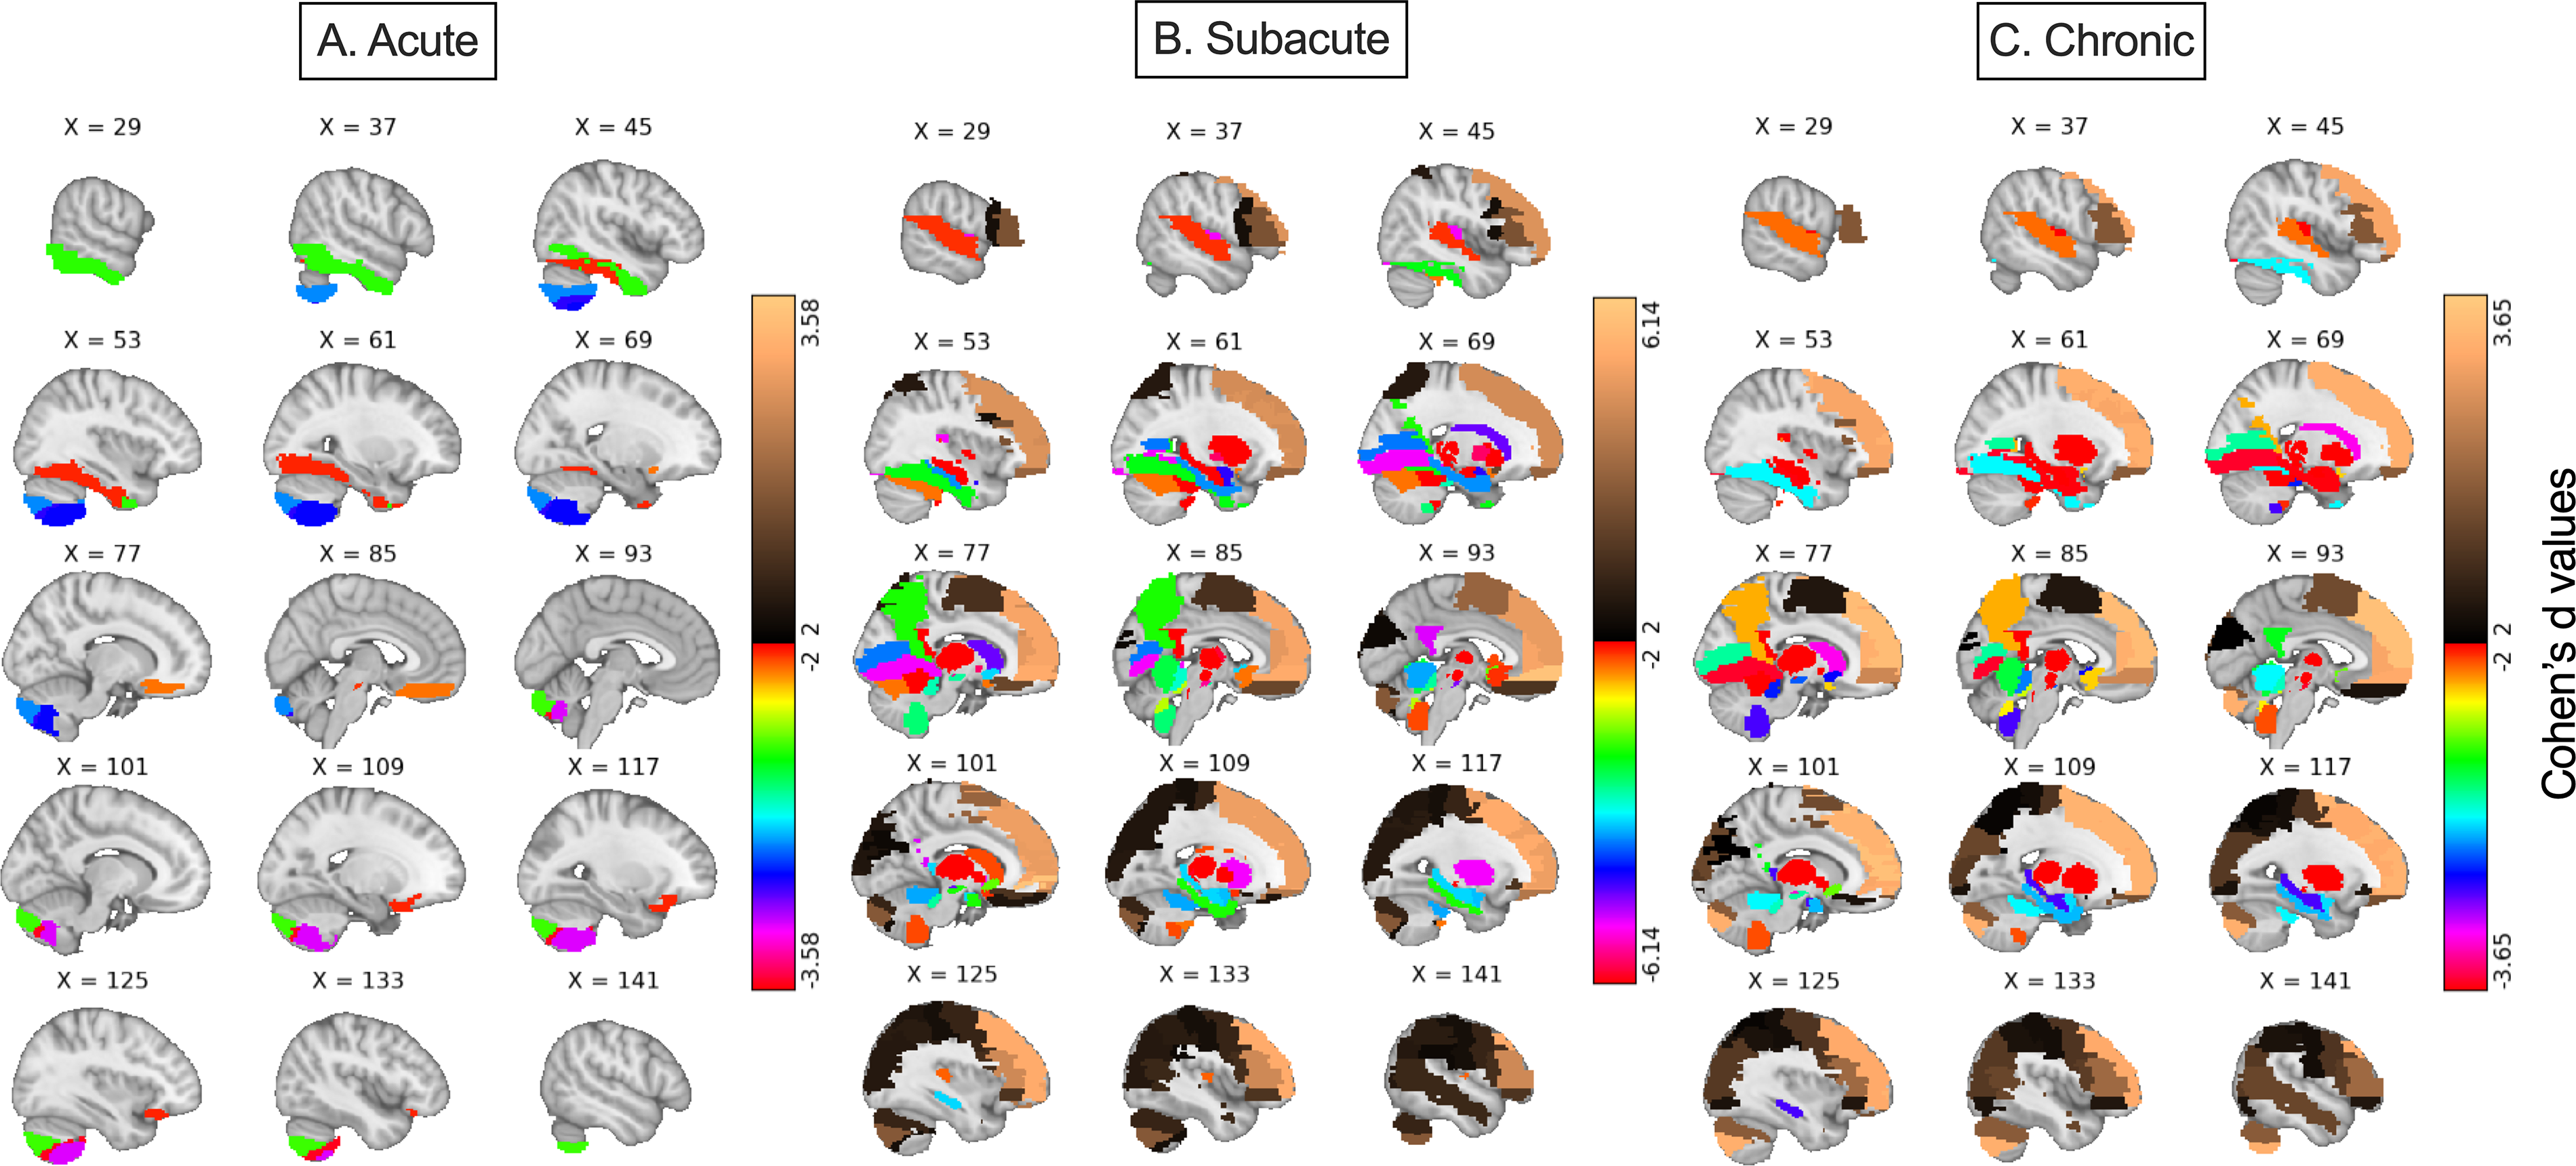
Voxelwise maps of parcel-based Cohen’s d effect sizes for gray matter AFD in mTBI across timepoints. Cohen’s d values (mTBI—Control) for normalized AFD are projected back into MNI space using the AALv3 atlas (Colorbar: Cohen’s d values). From left to right: acute, subacute, and chronic cohorts. Warmer colors indicate regions where AFD is higher in mTBI compared to controls; cooler colors indicate regions with reduced AFD in the mTBI group. In the acute phase, all larger effect sizes are negative and only observed in ventral brain regions abutting rigid structures such as the skull base and tentorium cerebelli, including the orbitofrontal cortex, rectus gyrus, ventral temporal regions, and ventral tegmental area. During the subacute and chronic phases, large negative effect sizes extend to medial frontal, temporal, limbic, midbrain, thalamic, and cerebellar areas—regions previously shown to accumulate high mechanical strain in both models and human studies. Positive effect sizes—where mTBI participants exhibited higher AFD than controls—emerged only during the subacute and chronic phases and were localized to regions such as the anterior cingulate cortex, precuneus, and dorsolateral prefrontal cortex. These patterns suggest potentially evolving microarchitectural changes or secondary cascades over time following mTBI, reflecting a dynamic interplay between injury, repair, and reorganization processes. AFD, apparent fiber density; mTBI, mild traumatic brain injury.
A key question raised by the group-level findings for the subacute and chronic cohorts is why some brain regions exhibited increased AFD while other regions exhibited reduced AFD. We tested whether intrinsic biomechanical properties of parcels measured in healthy adults explain whether AFD will increase (AFD ↑) or decrease (AFD ↓) after mTBI. We sorted all of the AAL3 parcels by their control-group stiffness and observed a striking split distinction: Baseline material rigidity largely determines the polarity of microstructural change in the subacute and chronic. Compliant, or less stiff, cortex (≈1.6 kPa) tends to show increased AFD (AFD↑), whereas the stiffest cortex (≈3.0 kPa) shows reduced AFD (AFD↓) (Fig. 5, Welch-t < −11, p < 0.0001 in both cohorts; see Supplementary Table S1 for a complete list). Interestingly, in the acute cohort (∼72 h postinjury), only parcels corresponding to the most compliant cortex exhibited changes in AFD beyond the a priori threshold of Cohen d ∼ 2, and all of them showed reduced AFD (AFD↓; Cohen d ≤ –2) (Fig. 5). These findings indicate early microstructural disruption within the most compliant gray matter. Over subsequent weeks, these same compliant regions rebound, while stiff cortex—initially spared—progresses to chronic compartment loss. Thus, baseline biomechanics as determined from healthy brains stratify gray matter into two distinct pathological trajectories: (1) a vulnerability-plus-recovery track for soft regions and (2) a delayed-degeneration track for stiff regions. These findings suggest baseline MRE-derived stiffness gradient provides a biomechanically motivated mechanistic framework for predicting where, when, and how microstructural injury unfolds after mild TBI.
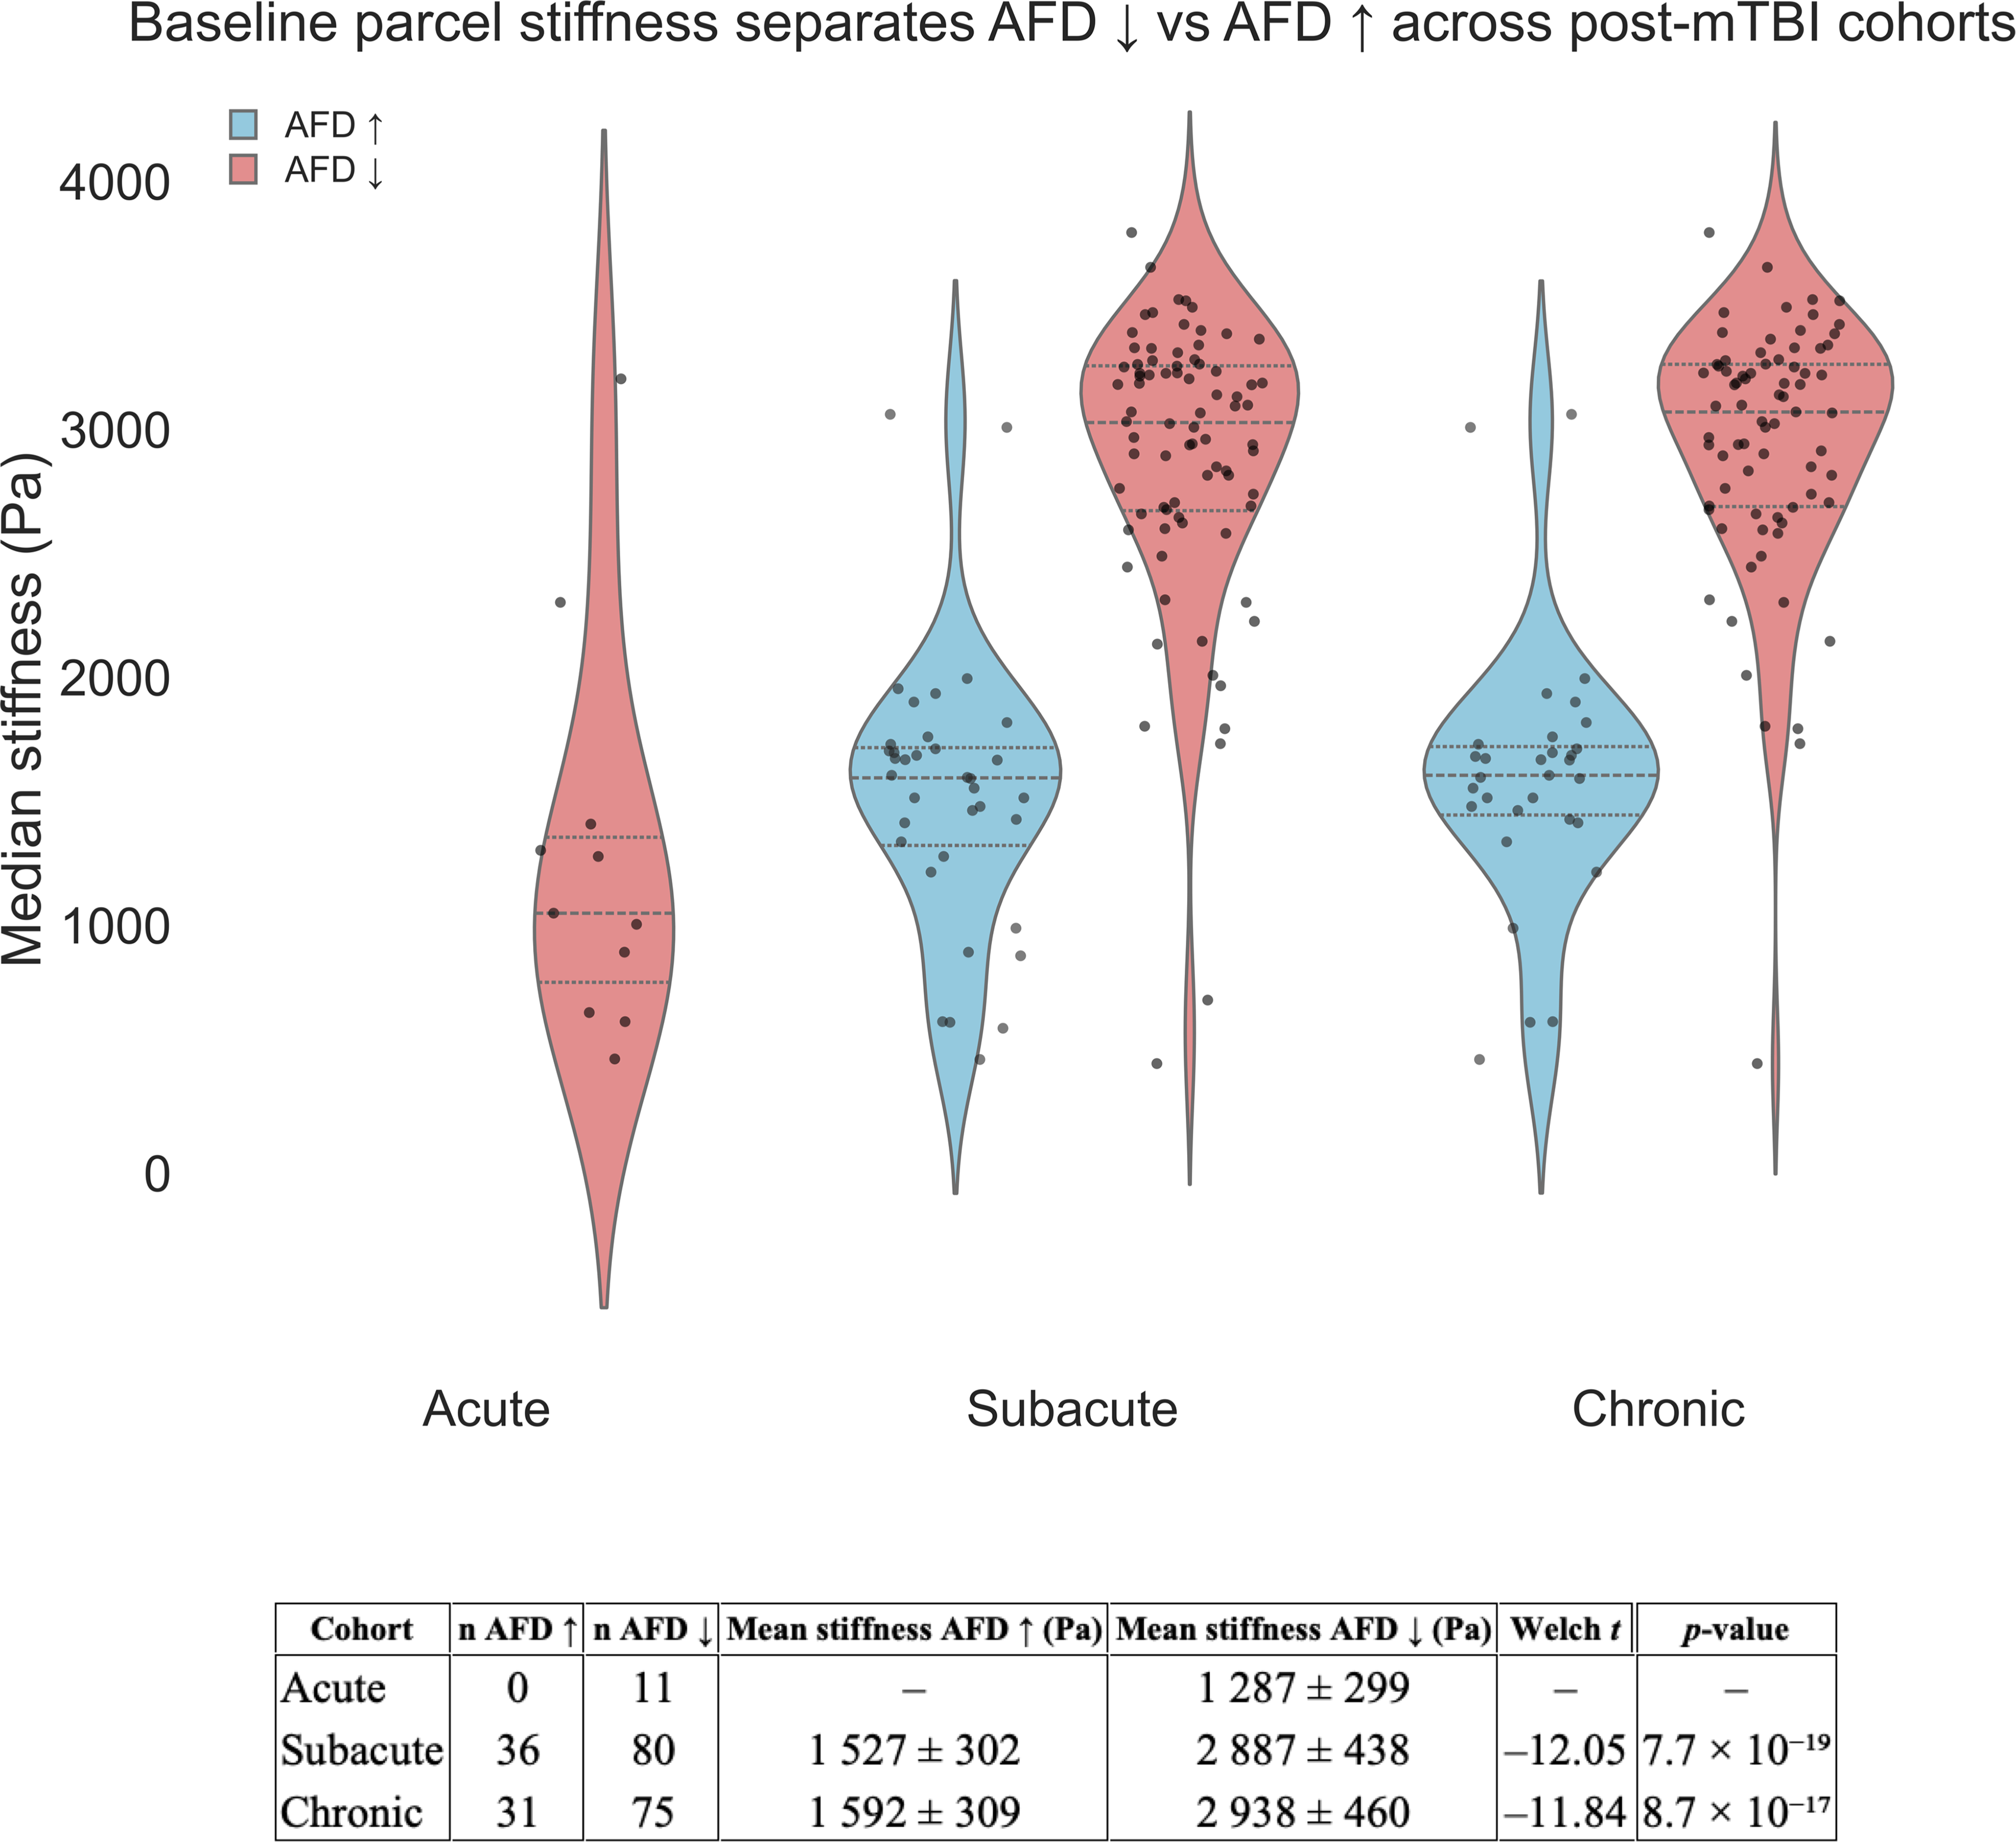
Baseline parcel stiffness separates AFD ↓ from AFD ↑. Violin plots show the distribution of control-group median stiffness values for every AAL3 parcel that later exhibited a large AFD change (|d| ≥ 2) in the three post-mTBI cohorts. Sky-blue violins represent parcels with AFD increases (AFD ↑) in patients, light-coral violins represent parcels with AFD decreases (AFD ↓). Horizontal dashed lines inside each violin mark the quartiles; overplotted black dots are individual parcels. The accompanying table (below) summarizes the Welch unequal-variance t-tests comparing stiffness between AFD ↑ and AFD ↓ parcels within each cohort group (reporting n per group, t, df, and two-sided p-values). AFD, apparent fiber density; mTBI, mild traumatic brain injury.
Finally, we asked whether baseline stiffness also predicts the magnitude of parcel-wise change (Fig. 6). Plotting Cohen’s d against stiffness revealed a negligible trend in the acute phase (ρ = –0.19, p < 0.05) but a strong, monotonic negative relation in the later phase cohorts (subacute ρ = –0.74; chronic ρ = –0.72; both p < 0.001). As such, baseline modulus alone accounted for ∼52% to ∼54% of the variance in ΔAFD. As such, baseline stiffness is not only a yes/no predictor of polarity but also a continuous predictor of injury magnitude. Combined with the voxel- and parcel-level coupling observed in healthy controls (R2 ≈ 0.72 between stiffness and AFD), the data support a simple rule: the stiffer a parcel is in healthy brains, the greater the decrease in AFD following injury. Thus, intrinsic modulus is potentially both a map of regional vulnerability and a scalar predictor of ensuing microstructural decline.
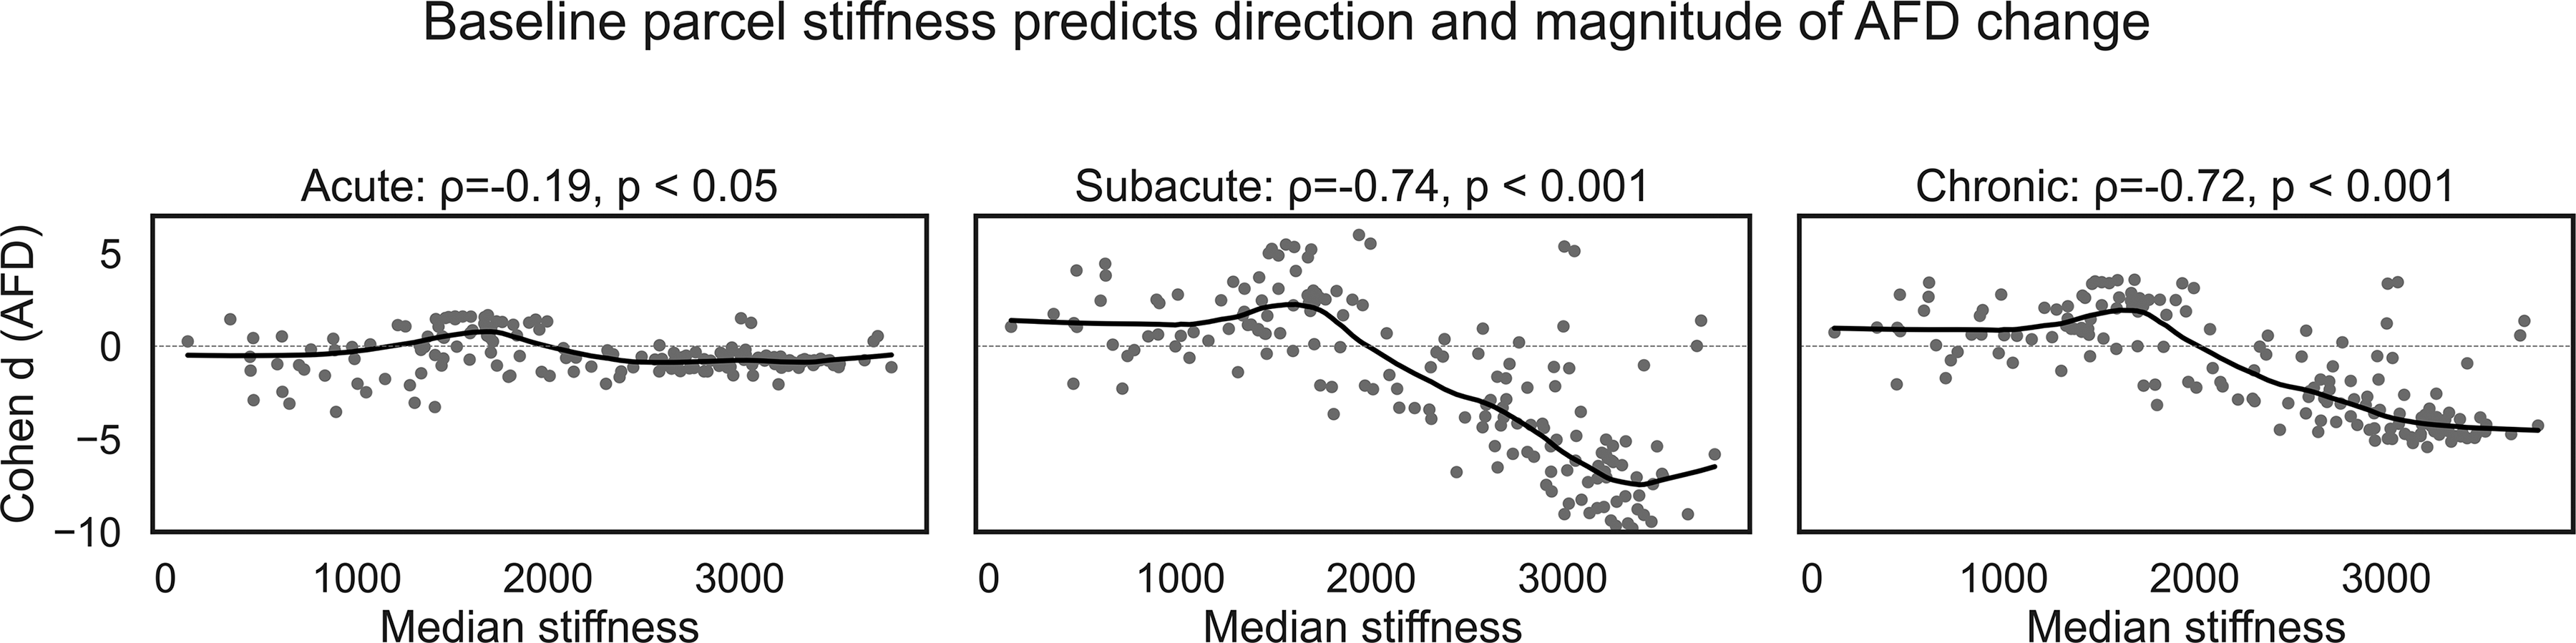
Parcel-level baseline stiffness is a strong determinant of AFD change after mTBI. Each panel plots 166 AAL3 parcels; the x-axis is the parcel’s median stiffness (Pa) measured in healthy controls, and the y-axis is the between-group effect size (Cohen d) for AFD (mTBI—control). Gray circles are individual parcels; the solid black line is a LOWESS fit. Acute (∼72 h). A shallow, non-significant trend (ρ = –0.19, p < 0.05) indicates that immediate AFD alterations are largely independent of baseline mechanics. Subacute (2 weeks to 3 months). A pronounced negative monotonic relation emerges (ρ = –0.74, p < 0.001): parcels stiffer than ≈ 2 kPa show progressively larger AFD decreases, whereas compliant parcels remain neutral or show slight increases. Chronic (>3 months). The negative relation persists (ρ = –0.72, p < 0.001), explaining ≈ 52% of the variance in chronic AFD change. Dashed horizontal lines denote zero change. Together, the panels show that stiff cortex is predisposed to chronic compartment loss (AFD ↓), whereas compliant cortex is relatively resilient or exhibits compensatory increases (AFD ↑). AFD, apparent fiber density; mTBI, mild traumatic brain injury.
AFD outperforms FA and MD in detecting gray matter injury in mTBI
Importantly, the group differences observed in gray matter AFD were not detectable using FA (Fig. 7 [middle], Supplementary Fig. S2A), supporting our hypothesis that AFD is more sensitive to mTBI-related gray matter microstructural changes. MD showed modestly better performance than FA, with a limited number of parcels meeting the large-effect threshold (Cohen’s d ≥ 2.0) in the subacute (9 parcels) and chronic (7 parcels) cohorts; no parcels met this criterion in the acute phase (Fig. 8, Supplementary Fig. S3).
Normalized fractional anisotropy (FA) profiles across gray matter parcels in mTBI and control groups. Mean ± SD FA values are plotted for each AALv3-defined gray matter region for acute (top), subacute (middle), and chronic (bottom) timepoints. Across all stages, FA values remain low and show substantial overlap between mTBI and control participants. These findings underscore the limited sensitivity of FA for detecting gray matter microstructural abnormalities in mild TBI, in contrast to fiber-specific metrics such as AFD. AFD, apparent fiber density; mTBI, mild traumatic brain injury.
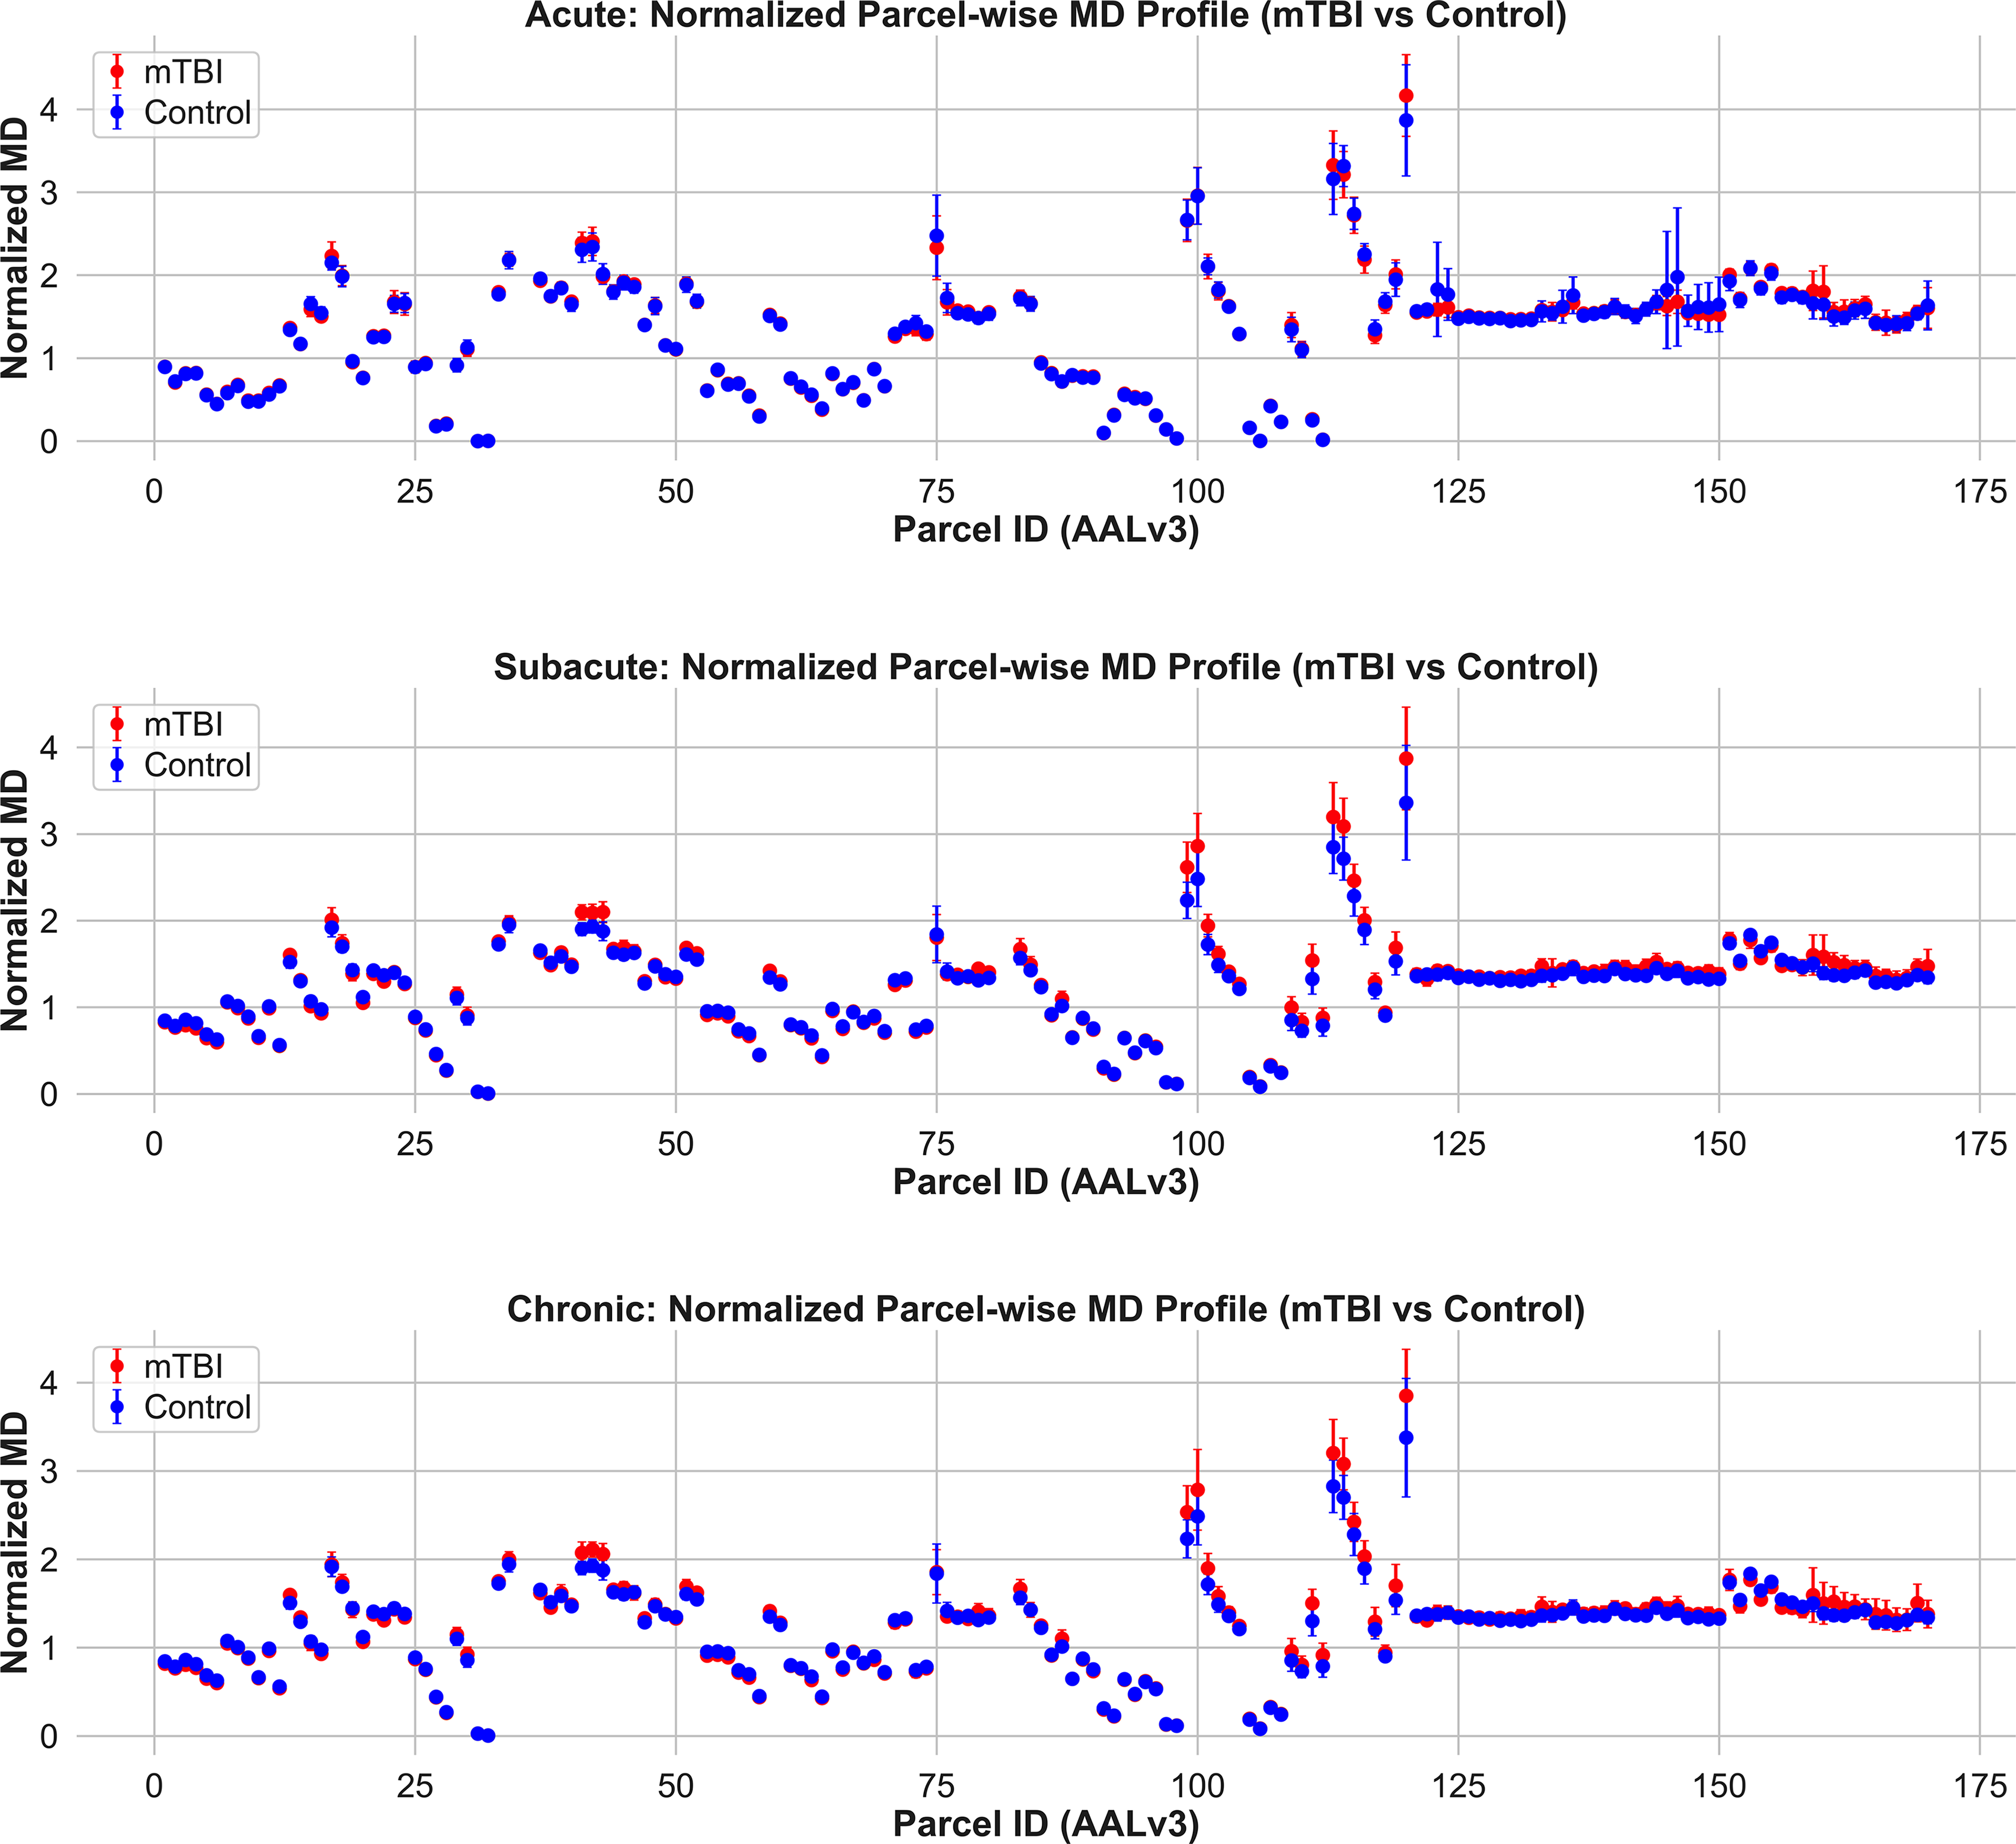
Normalized mean diffusivity (MD) profiles across gray matter parcels in mTBI and control groups. Mean ± SD MD values are plotted for each AALv3-defined gray matter region in the acute (top), subacute (middle), and chronic (bottom) phases postinjury. Across all timepoints, group differences in MD are limited in magnitude and spatial extent. A few parcels show elevated MD in mTBI during the subacute and chronic stages, but overall, the patterns are modest compared to those observed with AFD. These results suggest that while MD may capture general diffusivity shifts, it lacks the directional and compartment-specific sensitivity needed to detect widespread gray matter pathology in mTBI. AFD, apparent fiber density; mTBI, mild traumatic brain injury.
AFD detects white matter injury missed by traditional DTI
To assess whether AFD also offers improved sensitivity in white matter, we compared AFD, FA, and MD across JHU-ICBM-defined white matter tracts. 38 Tract-wise normalized AFD revealed consistent and robust group differences (Cohen’s d ≥ 2.0) between mTBI and control participants in both the subacute and chronic cohorts, with a trend toward similar effects in the acute group (Fig. 4, acute [top], subacute [middle], and chronic [bottom]). These differences spanned 12 tracts, including the corpus callosum, corticospinal tract, and parahippocampal cingulum, with AFD consistently reduced in the mTBI group. In contrast, FA and MD showed minimal group separation across all tracts and timepoints, including the acute phase, and no effect sizes approaching those observed with AFD (Figs. 9 and 10; Supplementary Figs. S3A and S4). This dissociation highlights that even in highly anisotropic white matter, AFD may detect subtle microstructural abnormalities that conventional tensor-derived metrics fail to capture. Together, these findings support the utility of AFD as a more sensitive and anatomically generalizable marker of tissue disruption across both gray and white matter following mTBI.
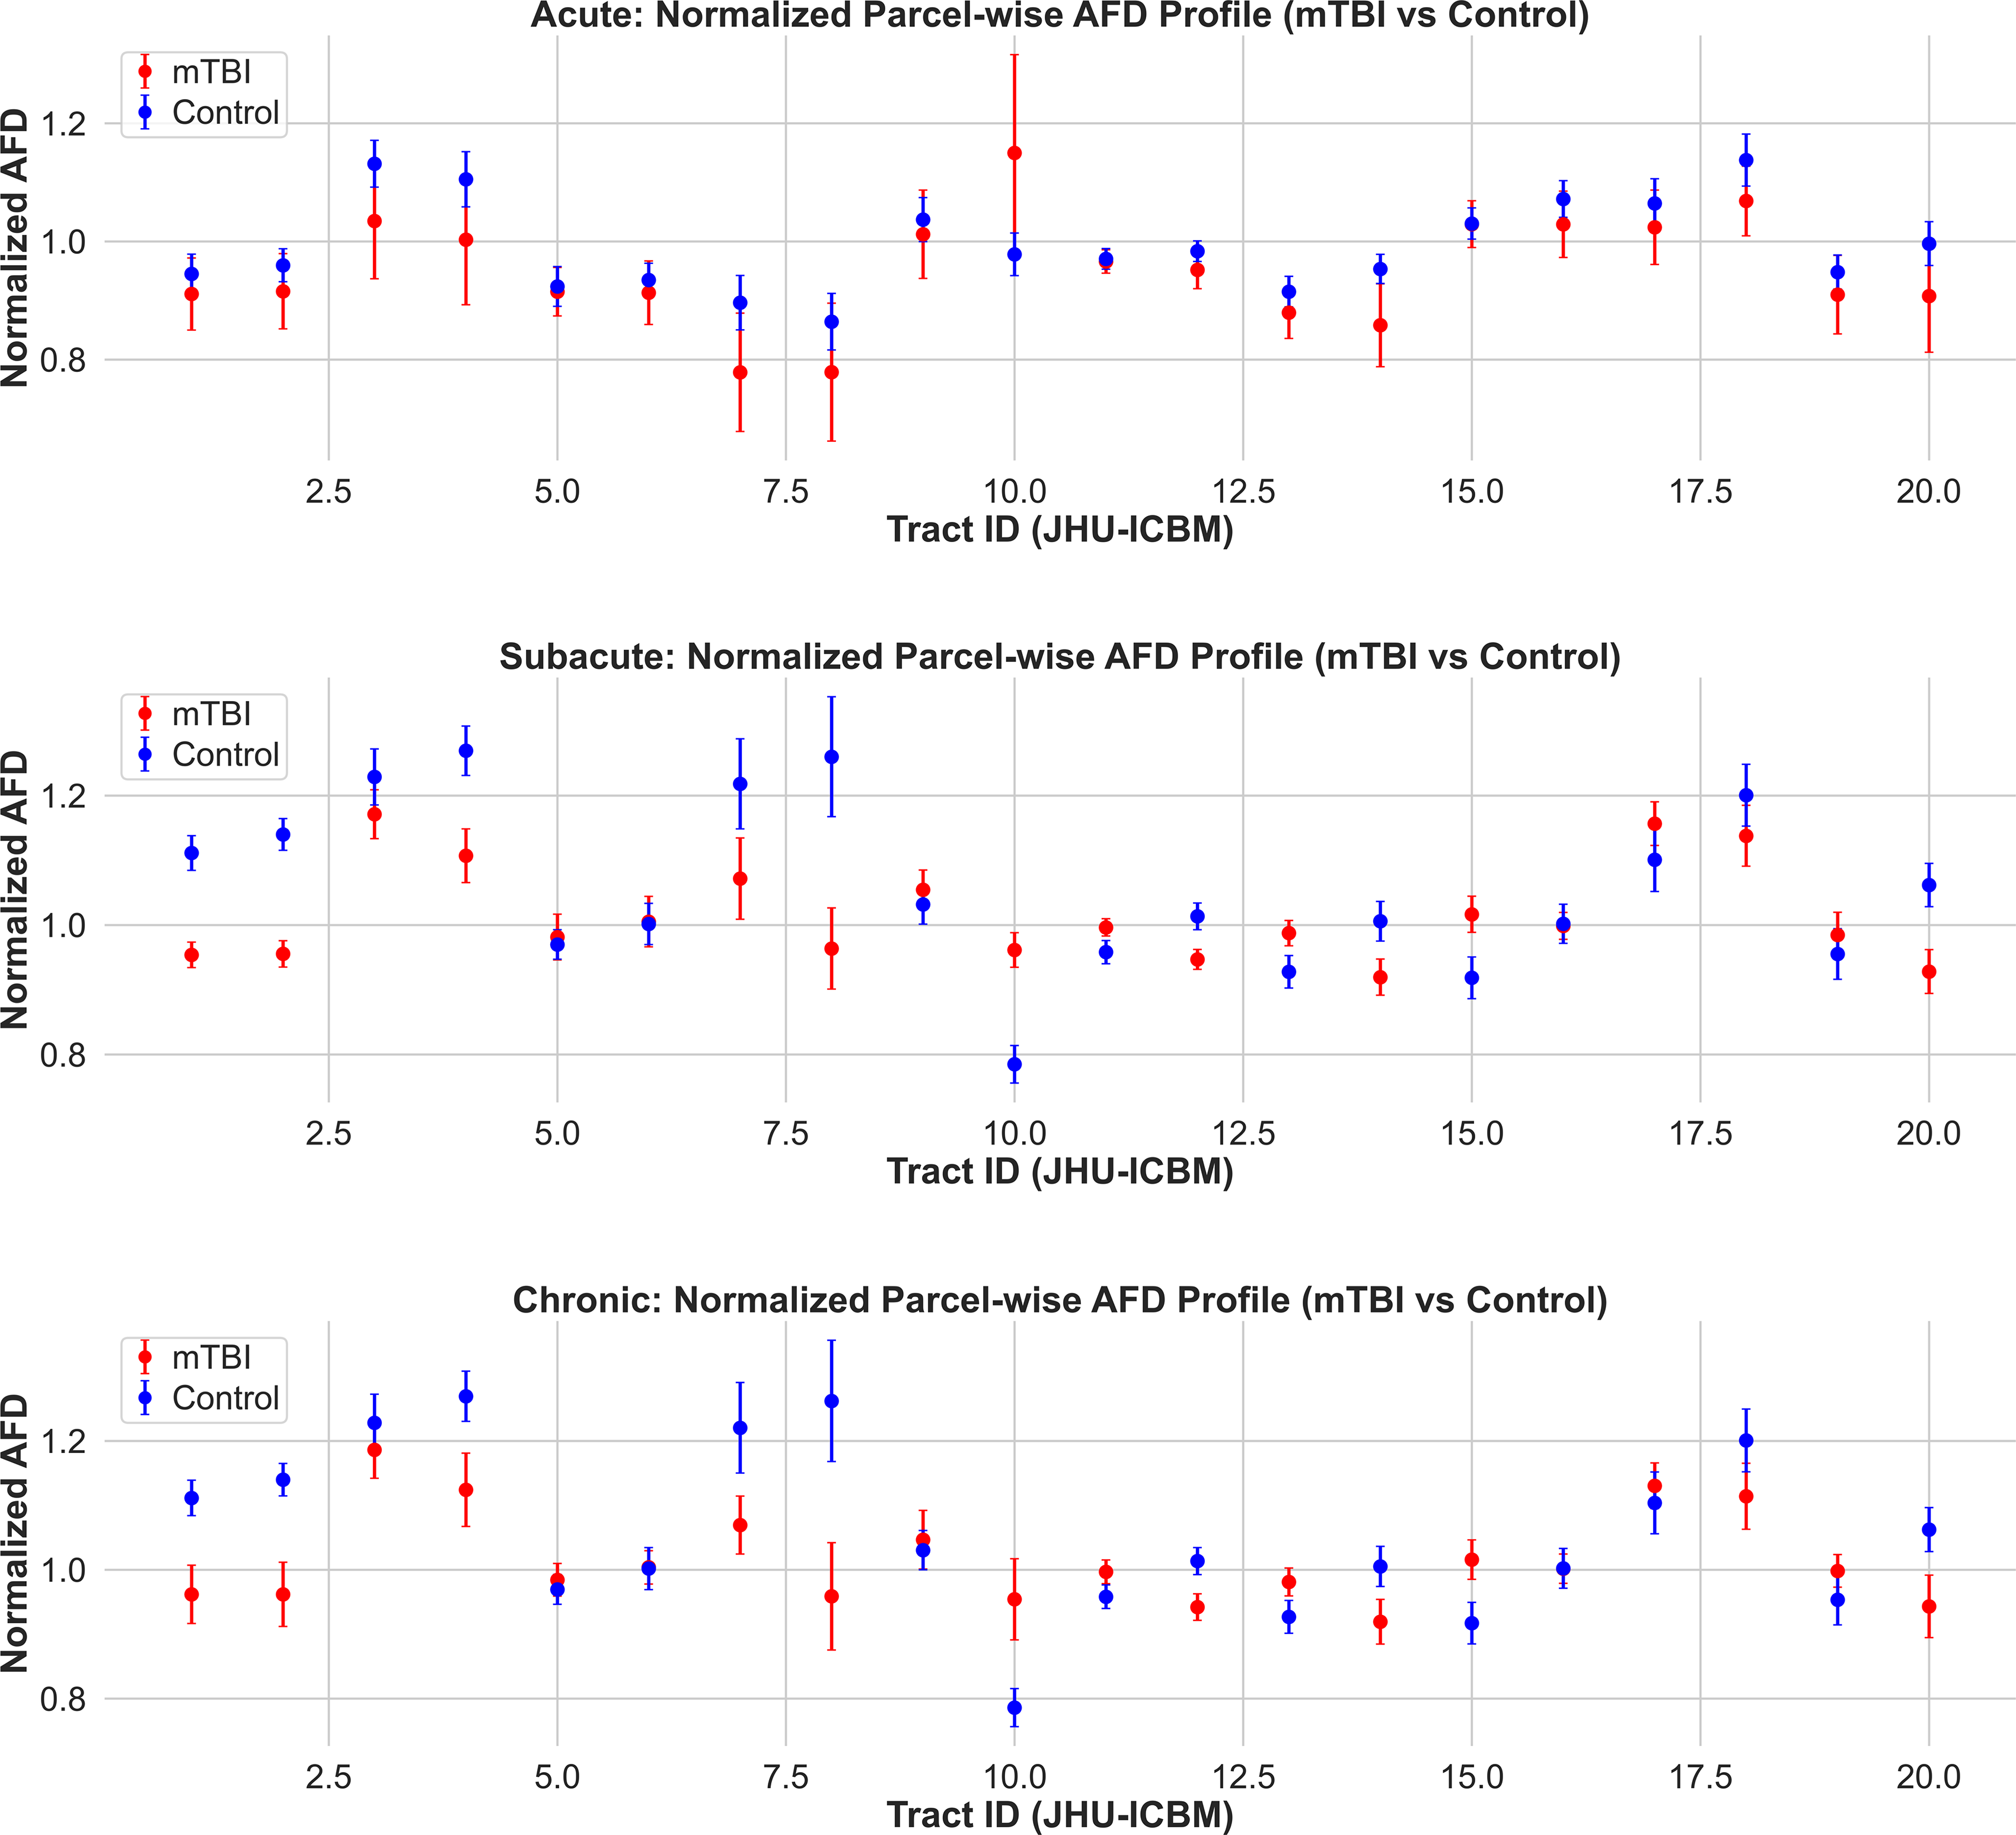
Normalized apparent fiber density (AFD) profiles across white matter tracts in mTBI and control groups. Mean ± SD of parcel-wise normalized AFD values are shown for acute (top), subacute (middle), and chronic (bottom) cohorts. Tracts are defined according to the JHU ICBM white matter atlas. In the subacute and chronic phases, several tracts show clear group separation, with reduced AFD in mTBI participants relative to controls. No such differences are evident in the acute phase. These findings support the emergence and persistence of white matter microstructural abnormalities detectable by AFD beyond the immediate postinjury period. mTBI, mild traumatic brain injury.
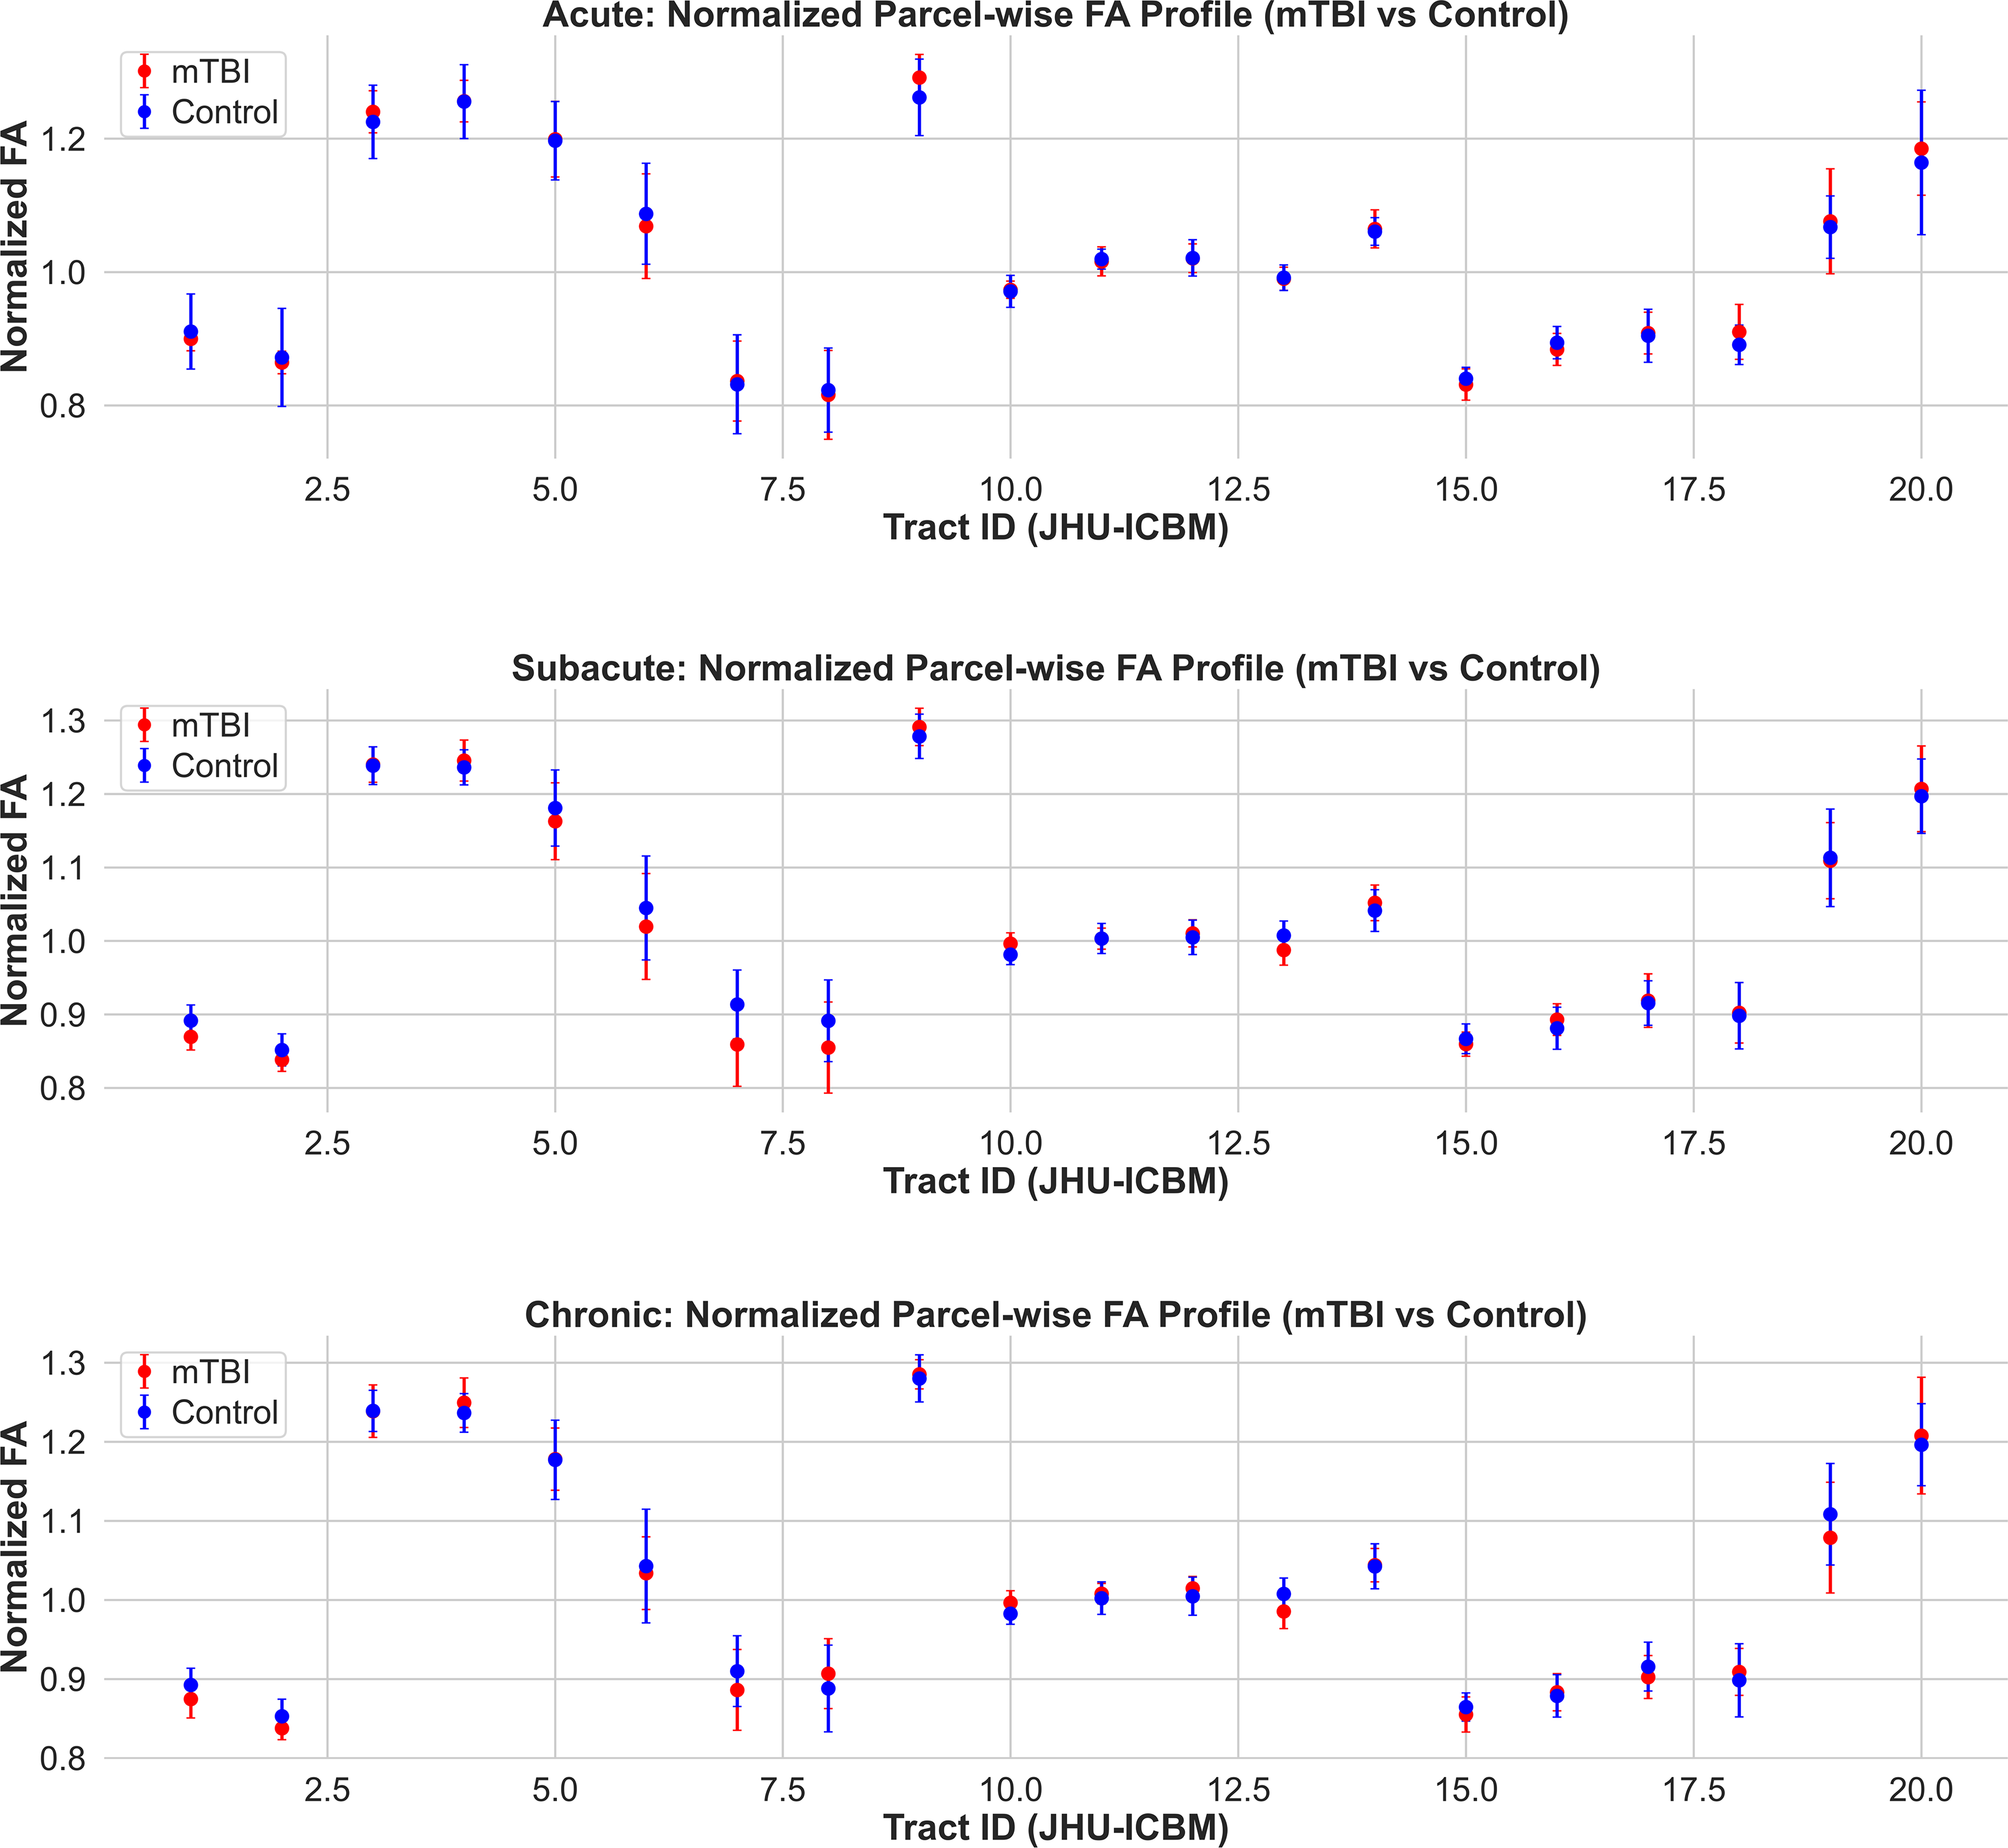
Normalized fractional anisotropy (FA) profiles across white matter tracts in mTBI and control groups. Mean ± SD of parcel-wise normalized FA values are shown for acute (top), subacute (middle), and chronic (bottom) cohorts. Tracts are defined according to the JHU ICBM white matter atlas. Across all timepoints, FA values show minimal or no separation between mTBI and control groups, in contrast to the AFD profiles. These findings highlight the limited sensitivity of FA to detect white matter microstructural changes associated with mTBI. AFD, apparent fiber density; mTBI, mild traumatic brain injury.
Discussion
We began with the premise that the brain’s solid-phase microarchitecture—including neural and glial soma, axons, dendritic arbors, glial cytoskeleton, perineuronal net, and other extracellular-matrix scaffolds, and even the fine microvascular framework now visible in high-resolution histology–MRI concordance maps 23 —should shape both (1) its mechanical stiffness, measured by MRE, (2) its AFD, measured by diffusion MRI. From this premise, we set two a priori objectives: (1) establish that AFD is a biomechanically meaningful marker in the healthy brain; and (2) determine whether AFD outperforms tensor metrics for detecting and tracking gray- and white-matter injury after mild TBI and whether baseline stiffness established in healthy controls can be used to predict injury trajectories in the mTBI participants.
We found that AFD, a diffusion-MRI measure derived from CSD, is tightly coupled to the biomechanics of brain tissues and is highly sensitive to mTBI. AFD varies systematically with intrinsic stiffness, as measured by MRE. Region-level analyses across 166 AAL3 gray matter parcels demonstrated that AFD explains ∼74% of the variance in stiffness. That relation held at 30, 50, and 70 Hz stimulation during MRE (see Supplementary Fig. S1), indicating a robust, frequency-invariant link based on solid-phase microarchitecture. Importantly, this parcel-wise AFD–stiffness coupling replicated in an independent MRE cohort (MRE134; R2 = 0.72, p < 0.001; Supplementary Fig. S3), and gray matter stiffness itself showed strong cross-dataset reproducibility at both the voxelwise and parcel-wise levels (R2 = 0.99 and 0.89, respectively; Supplementary Fig. S2). These findings indicate that the observed diffusion–mechanics relationship, and the underlying stiffness gradients on which it depends, are stable across datasets and not idiosyncratic to a single sample or acquisition. We then tested whether AFD would detect changes in gray matter caused by mTBI, where traditional diffusion tensor-based approaches fail. Eleven ventral or midbrain parcels showed large AFD deficits (|d| ≥ 2.0) in the acute cohort (∼72 h), expanding to 116 parcels in the subacute phase (2 weeks to 90 days) and persisting in 106 parcels chronically (>90 days). By contrast, FA detected no gray matter effects, and MD flagged only 7–9 parcels. Finally, baseline mechanics predicted the polarity of postinjury change in AFD. When parcels were ranked by control-group stiffness, a striking split emerged in the subacute and chronic cohorts: compliant cortex (∼1.6 kPa) tended to show AFD increases, whereas the stiffest cortex (∼3.0 kPa) showed persistent AFD decreases (Welch-corrected |t| > 11, p < 10−15). In the acute phase, only the most compliant parcels were abnormal—and all exhibited reductions in AFD. In sum, AFD not only indexes the solid-phase architecture of healthy brain tissue but also reveals how that architecture governs vulnerability and recovery after mTBI, providing a biomechanically informed biomarker that outperforms conventional diffusion metrics.
Biomechanical interpretation of AFD
The observed association between AFD and tissue stiffness aligns with a poroelastic framework in which both metrics reflect aspects of the density and organization of solid-phase, diffusion-restricting compartments—such as cell bodies, dendritic arbors, glial processes, axonal bundles, and extracellular matrix.8,24–27,39 In our single-shell b = 1000 s/mm2 data, the CSD-derived AFD we use corresponds to the “total” AFD, that is, the orientation-averaged fODF amplitude within each voxel. Under these acquisition conditions, AFD is best interpreted as an amplitude-based index of the apparent density of diffusion-hindering, neurite-like tissue rather than a calibrated intra-axonal volume fraction. Within a poroelastic view of brain tissue, MRE-derived shear modulus provides a complementary, macroscopic estimate of the bulk mechanical contribution of the same solid-phase matrix. Thus, the strong correlation between regional AFD and MRE-derived stiffness suggests that both contrasts are codetermined by shared microstructural substrates, even though each is shaped by distinct measurement physics and modeling assumptions. Notably, in regions like gray matter—where anisotropy is intrinsically low and neurite orientations are highly heterogeneous—AFD remains sensitive to changes in membrane integrity and compartmental structure.20,28 Due to the sensitivity of AFD to microstructural changes, small disruptions to these compartments (e.g., increased permeability, edema, or loss of cellular coherence) can result in disproportionately large reductions in AFD. 28 Likewise, mechanical stiffness is known to vary systematically with cytoarchitecture across the brain, with MRE studies showing that cortical and subcortical stiffness profiles mirror underlying differences in neuronal and glial density, myelination, and matrix content. 32 Taken together, these parallels support the view that AFD and MRE-derived stiffness provide complementary, diffusion- and mechanics-based windows onto the same solid-phase tissue architecture in the healthy brain.
The dynamic changes observed in AFD across postinjury timepoints suggest a balance between compartmental degradation and remodeling. In the acute cohort, all 11 parcels showing large group differences (|Cohen’s d| ≥ 2.0) exhibited lower AFD in mTBI participants relative to controls, with no regions showing increased AFD. By contrast, in the subacute cohort, 116 parcels met the same threshold, with 36 regions showing increased AFD and 80 regions showing decreased AFD relative to controls. In the chronic cohort, 106 regions met the threshold, including 31 with elevated AFD and 75 with reduced AFD in mTBI. Stiffness stratification sharpened this picture: in the subacute and chronic cohorts, parcels drawn from the compliant quartile of cortex (median ≈ 1.6 kPa) tended to show AFD increases, whereas the stiffest parcels (median ≈ 3.0 kPa) showed persistent AFD decreases. These findings suggest that early injury is dominated by loss of structural compartments, while later phases reflect a mix of persistent loss and localized remodeling or overcompensation, potentially including the emergence of new solid-phase structures (e.g., glial scars, ECM reorganization). We therefore interpret AFD as a diffusion-MRI signal that is organized by, and likely sensitive to, the same solid-phase architecture that determines shear stiffness. However, because MRE was not acquired in our mTBI cohort, the hypothesis that AFD can serve as a quantitative proxy for stiffness in the pathological state remains to be tested directly in future multimodal studies. In practice, our mTBI results support an alternative, more conservative framing where baseline stiffness stratifies gray matter vulnerability and organizes the pattern of AFD change after injury, rather than implying a simple one-to-one mapping between AFD and shear stiffness in the pathological state.
Gray matter microstructural changes in mTBI
In this study, we demonstrated that mild TBI causes measurable microstructural alterations in gray matter (GM) that are detectable with advanced diffusion MRI. Using AFD mapping, we found robust reductions across numerous cortical and subcortical regions at acute, subacute, and chronic postinjury stages—even in brain areas where traditional FA differences were negligible. Prior DTI studies of mTBI have largely focused on white matter injury and reported minimal or inconsistent GM abnormalities.11,22 While isolated reports have described transient increases in cortical FA—possibly reflecting acute edema or gliosis in patients with persistent symptoms11,14—such findings have not been consistently reproduced using standard tensor-based approaches. Our results overcome this limitation by leveraging AFD to reveal widespread GM microstructural abnormalities and provide evidence that mTBI involves not only diffuse axonal injury in white matter but also affects cortical and deep GM compartments.
Interpretation in context of mTBI pathophysiology
Ommaya and Thibault (1994)—whose primate inertial-loading experiments helped establish rotationally induced diffuse axonal injury as a core mechanism in severe TBI—distilled more than three decades of work on impact head injury. In that review, they advanced a “centripetal” theory of concussion, in which mechanically induced strains begin in cortical and neurovascular elements at the brain surface and, with increasing injury severity, propagate inward to deep white matter and brainstem structures. 3 They explicitly noted that available histological techniques were biased toward axonal pathology and “do not allow us to exclude lesions to neural components other than the axon,” including neuronal membranes, synapses, and vascular and subcellular elements, and emphasized that the precise sequence of neurovascular and cellular events in concussion remained unknown and needed further study. 3 Consistent with this centripetal view, finite-element models and physical surrogates consistently show strain amplification in the cortex,40,41 while in vivo deformation and MRE-based strain mapping studies report increased strain near the cortical surface relative to deeper brain regions.42–44 Yet, despite this convergence on cortical strain concentration, there remains a striking dearth of in vivo evidence directly implicating GM pathology in concussion. If we take the prevailing theoretical framework seriously—namely, that strain and strain rate are key mechanical fields driving tissue damage 45 —then regions predicted to experience high strain should exhibit correspondingly greater microstructural vulnerability. Demonstrating this link, particularly in the cortex, requires imaging markers that are both sensitive to GM microarchitecture and interpretable within a biomechanical, solid-phase framework. As such, our AFD–MRE findings begin to fill this gap.
To that end, the pattern of AFD changes observed provides insight into the nature of GM injury in concussion. We found that AFD in acute mTBI was reduced prominently in regions such as the orbitofrontal cortex, inferior temporal and fusiform gyri, ventral tegmental area (midbrain), and cerebellar lobules—many of which reside at anatomical interfaces susceptible to mechanical strain during head trauma (e.g., basal frontal and temporal surfaces). 42 By the subacute phase (weeks postinjury), the extent of GM involvement had broadened considerably, affecting widespread cortical, limbic, and subcortical areas. This diffuse subacute impact suggests that secondary injury processes (e.g., neuroinflammation, Wallerian degeneration, synaptic loss) may evolve over days to weeks postconcussion, leading to more widespread microstructural disruption before partial recovery ensues. In the chronic phase (>3 months), our data showed a contraction of affected regions—essentially a subset of those seen in subacute—indicating that many early abnormalities either resolved or fell below detection thresholds over time. Only a few areas (notably the fusiform gyrus, parts of the cerebellum, and the VTA) remained with large AFD deficits chronically, implying that some GM damage persists long term, while other changes are transient. This temporal profile is broadly consistent with known pathophysiological dynamics of mild TBI. Immediately after injury, cytotoxic edema and reactive astrogliosis can cause transient diffusion changes (even increases in anisotropy) in cortical GM. 11 Advanced diffusion analyses of acute sports-related concussion have indeed reported increases in fiber density and cross-sectional area in affected white matter tracts, consistent with acute swelling, which normalize within about 1–2 weeks. 46 Our finding that GM AFD abnormalities become progressively more pronounced and then partially resolve by chronic stages suggests a similar resolution of acute diffuse edema or inflammation in the cortex. However, the persistence of AFD deficits in select regions months after injury indicates lasting structural damage—for example, loss or pruning of neuronal processes or prolonged glial scarring—that does not fully recover. This interpretation is supported by preclinical evidence: animal models of mild TBI show that injured GM undergoes axonal degeneration and gliosis (increased cellularity), which can be detected with diffusion MRI and confirmed histologically. 47 Thus, a reduction in AFD likely reflects a net loss or disruption of aligned neurites (dendrites and axons) in the cortex and subcortex, as opposed to the more temporary diffusivity shifts caused by reversible edema. In sum, the application of AFD has allowed us to capture both the transient and enduring components of GM changes in mTBI—a nuanced view that traditional DTI could not provide. These data represent the first in vivo evidence that AFD has the potential to measure temporally dynamic changes in tissue architecture following mTBI.
Clinical relevance and implications
Detecting microstructural GM damage in concussion is not only of technical interest but carries important clinical implications. Concussive trauma can lead to a constellation of persistent postconcussive symptoms (PPCS)—including cognitive deficits, memory problems, mood disturbances, headaches, and balance issues—even in the absence of abnormalities on conventional MRI. Our findings offer a potential substrate for these symptoms by revealing objective GM changes that align with known symptom-generating brain regions. A recent meta-analysis of structural MRI studies in mild TBI found significant GM volume loss in widespread regions, including the frontal and temporal lobes, cingulate cortex, thalami, and cerebellum. These regions play key roles in attention, balance, memory, executive function, and emotional regulation, and their impairment has been linked to post-traumatic cognitive and behavioral difficulties. For example, frontal and temporal lobe atrophy in mTBI correlates with deficits in attention, working memory, and cognitive flexibility, while thalamic atrophy has been associated with chronic post-traumatic headaches and motor coordination problems.48,49 Likewise, injury to limbic structures (such as the hippocampus and amygdala) can contribute to memory disturbances and neuropsychiatric symptoms like anxiety or depression after concussion. 49 The present study’s evidence of microstructural disruption in these same networks strengthens the link between diffuse GM injury and the symptoms observed in some mTBI patients. In particular, the ventral tegmental area and cerebellar regions that remained abnormal at the chronic timepoint are noteworthy, as they participate in arousal/reward circuits and sensorimotor integration, respectively50,51—functions that, when perturbed, could underlie lingering fatigue, motivational changes, or balance deficits. Our findings reveal that GM microstructural abnormalities are detectable within 72 h postinjury, with significant AFD reductions already present in regions situated along the inferior surfaces of the brain, adjacent to the skull base. These early changes likely reflect cytotoxic processes such as edema, axonal beading, or astroglial reactivity—as such, AFD’s sensitivity in cases where symptoms are immediate but conventional imaging appears normal has important clinical implications. More broadly, our results also help to validate the experience of patients with PCS by providing a biological correlate: we show that even in mild TBI cases that appear “normal” on standard scans, there are quantifiable microstructural injuries in the brain’s GM that likely contribute to ongoing symptoms. Historically, roughly 10–15% of mTBI patients develop persistent postconcussive syndrome (symptoms lasting >6 months), and this condition has been characterized by a frustrating lack of objective findings on clinical imaging. 1 By using advanced diffusion metrics like AFD, clinicians may be able to uncover otherwise occult GM abnormalities in these patients, offering an objective marker of injury that correlates with their symptomatology. This has implications for diagnosis—potentially reducing underdiagnosis or dismissal of PCS as purely psychosomatic—and may also guide therapy (for instance, targeting cognitive rehabilitation to the affected neural circuits).
Limitations and future directions
While this study establishes the added value of AFD in detecting GM injury, several limitations warrant consideration. First, our analysis was cross-sectional at discrete postinjury intervals, and imaging modalities (diffusion, MRE) were acquired in different datasets; thus, individual trajectories of GM stiffness, recovery, or degeneration could not be tracked. More importantly, we cannot make any claims about the linkage between the AFD in these regions and resolved/persistent symptoms. Future longitudinal, multimodal imaging studies are needed to confirm how GM AFD metrics evolve within the same patients over time and to determine whether early AFD changes predict long-term outcomes. Second, we did not directly correlate the diffusion abnormalities with clinical measures in this study. Establishing links between regional AFD reductions and specific cognitive or behavioral symptoms (e.g., executive dysfunction, memory loss, mood changes) will be an important next step to strengthen the clinical interpretability of this biomarker. Additionally, the pathological underpinnings of altered AFD in GM remain to be elucidated. AFD is influenced by multiple microstructural factors, and a reduction or increase in AFD could reflect a combination of biological factors, including edema and gliosis, which is outside the scope of this work. Correlative neuroimaging-histopathology studies or the use of complementary modalities (such as PET imaging of glial activation or myelin-sensitive MRI sequences) could help disentangle these possibilities. It is encouraging that animal studies have confirmed axonal injury and gliosis in the cortex following mild TBI, 47 supporting the notion that the AFD changes we observe have a pathological basis. Nonetheless, caution is needed in extrapolating the fODF-based metrics directly to specific pathological features without such validation.
Another important limitation is that the effective spatial resolution of the MRE-derived stiffness maps is lower than that of the diffusion-derived AFD maps. While the displacement data are acquired at 1.5 mm isotropic resolution, the NLI inversion is performed on overlapping finite-element subzones (19.6 mm3, in the implementation used for these publically available data) spanning a radius of neighboring voxels, as described in prior work and common with MRE material property estimation.29,30,32 Thus, each stiffness estimate represents a mesoscale average rather than a property local to individual voxels. This subzone strategy improves the stability of the inverse problem but necessarily smooths fine-scale mechanical heterogeneity. As a result, any true millimeter-scale AFD–stiffness correspondence would be expected to be attenuated, and observed associations will be driven primarily by regional gradients rather than fine-scale colocalization. Thus, our AFD–stiffness associations should be interpreted as a correlation between diffusion microstructure and regional (mesoscale) mechanical properties rather than millimeter-scale stiffness variations.
A further consideration is that the diffusion and MRE data used to link AFD and stiffness were acquired in independent healthy cohorts on different scanners, and the replication analyses leverage a third MRE cohort (MRE134). Although all datasets were registered to a common 1 mm MNI152 template and analyzed in the same AAL3 atlas space, and both MRE cohorts were reconstructed with the same NLI-based pipeline, differences in scanner hardware, acquisition parameters, and cohort demographics, and scan artifacts (signal-to-noise, motion artifacts, etc.) may influence the absolute magnitude of AFD and stiffness. Accordingly, our cross-modal and cross-dataset correlations should be interpreted as evidence for reproducible spatial patterns—a consistent ordering of regional AFD and stiffness across the brain—rather than as subject-level coupling or strict equivalence across cohorts. As any such mismatches would be expected to attenuate the observed correlations, the strong parcel-wise and voxelwise agreement we report likely provides a conservative estimate of the robustness of the diffusion–mechanics relationship.
A final limitation concerns the sample size and cohort composition. While our findings were robust across independent timepoints and show internally consistent spatial patterns, the sample sizes within each postinjury group were modest, potentially limiting their generalizability. Replication in larger, more diverse populations—including older adults and individuals with varied injury mechanisms—will be critical to confirm the reproducibility of these effects and to better understand how demographic and injury-related factors modulate GM AFD changes.
Transparency, Rigor, and Reproducibility
All MRI analyses were conducted to maintain independence between voxel definition and hypothesis testing, and regions of interest were based on a widely used atlas of codified anatomical regions to minimize bias. Data acquisition protocols were standardized and designed to be feasible for all participants. Quality control procedures, including the use of phantom-based checks, were implemented to ensure consistent MR signal quality over time. We used publicly available MRE data and will make the mTBI data available to other researchers upon request, contingent upon meeting the appropriate IRB requirements. Analyses employed widely validated OpenSource tools (e.g., FSL, ANTs, FreeSurfer, and Dipy), and any custom code used in the analysis is OpenSource and available on HiradLab GITHUB to promote transparency and reproducibility.
Although sex imbalance in the acute mTBI cohort was a limitation due to the use of preexisting datasets, future studies will aim for more balanced representation. All steps were documented to support reproducibility, and data from this study will be made available upon request in compliance with journal policies. Together, these measures ensure a high level of rigor and reproducibility in the presented findings.
Data Materials and Availability
All data needed to evaluate the conclusions in the paper are present in the article and/or the Supplementary Materials. The authors are happy to share the deidentified and defaced mTBI data with other scientists. The MRE data are public data and described in Ref. 36
Authors’ Contributions
A.A.H.: Led conception and design, analysis and interpretation, data collection, data curation, writing the article, and critical revision. S.P.M.: Contributed to analysis and interpretation, data collection, critical revision, approval of the article, and agreement to be accountable. A.V.: Contributed to analysis and interpretation, data collection, and critical revision. A.A.A.: Contributed to analysis and interpretation, data curation, writing the article, and critical revision. D.M.: Contributed to analysis and interpretation, writing the article, and critical revision. B.Z.M.: Contributed to analysis and interpretation, writing the article, and critical revision.
Footnotes
Acknowledgments
The authors are grateful to Dr. Jeff Bazarian and Kian Merchant for their assistance in supporting IRB oversight for the healthy control diffusion MR data used to reference the mTBI diffusion MR data.
Author Disclosure Statement
A.A.H. and B.Z.M. hold IP (US12178591B2), which describes a system for predicting injury from head hits and TBI. B.Z.M. holds IP US 12,437,878 B2, which describes a data processing system for generating predictions of cognitive outcome in patients, and cofounder and Chief Science Officer of MindTrace Technologies Inc., which licenses US 12,437,878 B2 from Carnegie Mellon University.
Funding Information
Preparation of this article was supported, in part, by NIH Grants R01NS089069 and R01EY02853 to B.Z.M. and from the Chuck Noll Foundation to BZM and AH.
Supplemental Material
Supplemental Material
Supplemental Material
Supplemental Material
Supplemental Material
Supplemental Material
Supplemental Material
Supplemental Material
Supplemental Material
Supplemental Material
Supplemental Material
Abbreviations Used
References
Supplementary Material
Please find the following supplemental material available below.
For Open Access articles published under a Creative Commons License, all supplemental material carries the same license as the article it is associated with.
For non-Open Access articles published, all supplemental material carries a non-exclusive license, and permission requests for re-use of supplemental material or any part of supplemental material shall be sent directly to the copyright owner as specified in the copyright notice associated with the article.