
Abstract
An increasingly common concern for policy makers interested in public health in the United States is population aging and the associated high prevalence of chronic conditions and impairments. One of the more common health outcomes associated with aging is the decline and/or loss of vision, which has the potential to influence drastically the health and well-being of older adults. It is estimated that up to a quarter of individuals older than 75 report some form of vision loss (Horowitz, Brennan, & Reinhardt, 2005), and a disproportionate percentage of people who are blind or visually impaired are older than 60 (Lighthouse International, 2010).
Visual impairments in late life have been associated with a range of health outcomes. Most directly, visual impairment can reduce the well-being of older people by making it more difficult to perform activities which may be taken for granted earlier in life, such as driving or working at a job. Perhaps not surprisingly, visual decline in old age has been shown to be a strong predictor of declining ability to perform activities of daily living (ADLs; Branch, Horowitz, & Carr, 1989; Horowitz, 1994; Tinetti, Allore, Araujo, & Seeman, 2005). For example, in a study of institutionalized older adults, Horowitz (1994) assessed the effects of a clinical measure of distance acuity on capacity in daily tasks related to mobility, transferring, bathing, and eating and reported vision loss to be a significant contributor to dependence in these activities. Similarly, Branch et al. (1989) compared disability outcomes of community dwelling older adults based on differences in self-reported visual function. Those with visual impairments experienced decreased ability to perform ADLs as well as social activities, compared with older adults with normal vision. Most recently, Tinetti et al. (2005) demonstrated the independent contributions of five potentially modifiable impairments, including clinically evaluated near visual acuity, and found vision impairment to predict decline in home management skills (such as doing house work, home repairs or yard work, and using public transportation) but not social and productive activities (such as attending events, going on trips, or visiting museums or art galleries) in the 3-year follow-up.
Nevertheless, disability associated with vision impairments is seldom attributable to vision loss alone. Older people with visual impairments often experience dynamic losses across multiple systems in addition to, or in conjunction with, their sensory decline that can affect daily task performance. Vision impairment has been associated with biological risk (Steinman & Vasunilashorn, 2011), increased morbidity (Crews & Campbell, 2004), self-rated health (Wang, Mitchell, & Smith, 2000), mortality (Laforge, Spector, & Sternberg, 1992; McCarty, Nanjan, & Taylor, 2001; Wang, Mitchell, Simpson, Cumming, & Smith, 2001), and secondary health events, including hip fractures (Felson et al., 1989) and falls (Steinman, Pynoos, & Nguyen, 2009). The epidemiological model of the disability process, originally described by Nagi (1965, 1976) and refined by Verbrugge and Jette (1994), is helpful in illustrating how disability may result from the cumulative impact of multiple health factors. The model consists of four main stages that progress from risk factors (e.g., biological indicators) to pathology and impairments to result in loss of functioning, and, finally, difficulty in the performance both of routine and discretional daily life activities, or disability (see Figure 1).
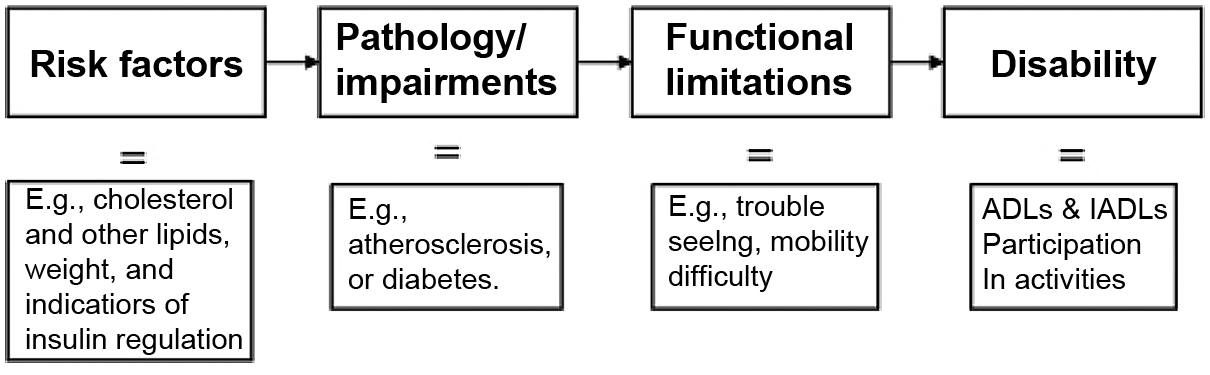
Disability process model adapted from Nagi (1965) depicting a theoretical relationship between health and disability
The purpose of this study was to examine the contribution of self-reported vision impairment to reporting of disability by older persons. Unlike prior studies that examine this issue, we are able to control for other health indicators that incorporate all stages of Nagi’s (1965, 1976) disability process (i.e., biological risk factors, pathologies, and functional limitations). With respect to these factors, we hypothesized the following:
Hypothesis 1: The effects of self-reported vision loss would be reduced or eliminated when other contributors to the disability process were taken into consideration.
Method
Variables representing three health factors in the disability process were selected for analyses from five cycles (1999-2008) of the National Health and Nutrition Examination Survey (NHANES IV). The nationally representative study uses a complex sampling design in which counties are the primary sampling unit. NHANES oversamples racial minorities and persons who are 60 years and older to improve statistical power in analyses of these groups. Cross sectional data are collected biennially to form a continuous data set, which when weighted, is representative of the noninstitutionalized American population of persons aged 2 and older. In the current study, when cases from five cycles were combined, and an inclusion criterion of age 65 or older was applied, a weighted sample of 6,550 cases was available for analyses.
Analyses
Analyses for this study were conducted using Statistical Analysis Software (SAS), Version 9.2 for Windows. All analyses were modified to adjust for survey design and selection effects of the complex sampling methods employed by NHANES. Analyses conducted for this study were based on the five most recent cycles of NHANES. In models where subsamples were used (e.g., when variables collected during the medical exam component were added to models), appropriate weights, adjusted for pooling across survey years, were used to account for survey nonresponse and to assure that the sample remained nationally representative (Centers for Disease Control, 2010).
Basic descriptive statistics were calculated for selected sociodemographic variables, vision acuity, and disability outcomes. For disability variables, percentages representing the proportion of individuals who experienced dependence or difficulty with activities were computed for each vision category. A Wald χ2 statistic was computed, and probabilities were reported to determine statistically significant differences between vision groups.
Finally ordinal logistic regressions were conducted to determine the effect of self-reported vision on daily living activity impairment. The purpose of these analyses was to estimate odds ratios (ORs) and 95% confidence intervals (CI) to reflect the likelihood of reporting negative disability outcomes by persons with self-rated poor and fair vision relative to persons with good or better self-reported vision. For each disability variable, four models were computed and are described in detail below.
Independent Variables
Sociodemographic measures
In each analysis, five sociodemographic characteristics of participants were controlled, including age, gender, race, marital/partner status, and education. Age was analyzed as a continuous variable. Gender, race, and marital status were coded into indicator variables with “male,” “White,” and “married/partnered” as reference categories, respectively. Education was coded as an ordered categorical variable composed of three levels—less than a high school diploma, graduated from high school or the equivalent (e.g., completion of GED requirements), and greater than a high school education.
Self-reported vision
In addition to the sociodemographic variables, a self-reported measure of general visual functioning was included as a key explanatory independent variable. During the interview section of NHANES, respondents were asked to rate their present eyesight with glasses or contact lenses if she or he used them. Respondents could rate their vision as excellent, good, fair, poor, or very poor. Participants could also refuse to answer the item or state that she or he did not know about the general condition of her or his eyesight. This item was recoded into three indicator variables—respondents who said that their vision was poor or very poor made up one group, whereas those who rated their eyesight as fair made up a second group and participants who rated their vision as good or excellent made up a third group, which served as a reference category in analyses. Respondents who refused to answer the item or who did not know about the condition of their eyesight were coded as missing data.
Model covariates
In addition to sociodemographic and self-reported vision variables, covariates representing health factors within Nagi’s (1965, 1976) theoretical pathway to disability were added successively in four models. First, the effects of visual impairment on each disability variable were assessed controlling only for sociodemographic control variables. A second model included variables representing biological risk; a third model added self-reported pathology/impairment; and a fourth model controlled variables assessing self-rated mobility/functioning, along with the other covariates. Variables were controlled in this manner to assess the relative contribution of each preceding health factor, with respect to dependent variables representing disability.
Biological indicators
Dichotomous variables were computed based on clinically defined at-risk levels for six biological markers. Biomarkers included systolic and diastolic blood pressure, glycated hemoglobin, two extremes of body mass index (BMI; underweight and obese), and C-Reactive Protein (CRP). Cut-points for some biomarkers remain debated relative to their use in the older adult population (e.g., proposed BMI cut-points used for older adults); however, the high and low biomarker cut-points used here have also been used in other studies of older adults (Crimmins et al., 2005; Steinman & Vasunilashorn, 2011) and have been associated with multiple outcomes, including disability and mortality (Adams et al., 2006; Alley & Chang, 2007).
Pathology/impairments
A combination of NHANES items from various sections of the questionnaire were used to derive six covariates representing pathological conditions commonly experienced by older people. Within the medical conditions section of the NHANES questionnaire, participants were asked whether a doctor had ever told them that they had arthritis, congestive heart failure, coronary heart disease, angina pectoris, heart attack, stroke, emphysema, chronic bronchitis, or cancer. In response to these items, participants could state that they had or had not been told by a doctor that they had each condition. A single variable representing heart problems was created and coded in the positive direction (has heart problem = 1) if respondents confirmed that a doctor had told them they had any one of the four heart problems probed. Similarly, a variable representing respiratory problems was created and coded positively if the respondent said that he or she had been told by a doctor that they had emphysema or chronic bronchitis. Finally, within the diabetes section of the questionnaire, participants were asked whether a doctor had ever told them that they have diabetes or sugar diabetes. Participants could state that they had or had not been told by a doctor that they had diabetes or that their status with respect to blood sugar was bordering on high-risk levels for diabetes. Those who stated that they were bordering on high-risk levels for diabetes were categorized with those who stated that they had been told that they had diabetes. Participants who refused to answer or who stated that they did not know were coded as missing data.
Functional limitations
Covariates representing functional limitations were quantified using measures of physical mobility and functioning found in NHANES. Participants were asked whether, due to a health problem, they had difficulty performing 10 functional activities including walking a quarter mile, walking up 10 steps, stooping, crouching or kneeling, lifting or carrying, walking between rooms on the same floor, standing up from an armless chair, standing for about 2 hr, sitting for long periods, reaching up over head, and grasping small objects. Respondents could report having no difficulty, having some difficulty, having much difficulty, that they were unable to do the activities, or that they did not do the activities. These functional items were recoded into polytomous ordered categorical variables, with respondents reporting some or much difficulty grouped together, and those reporting inability grouped together. Participants who reported no difficulty were included as a third group to serve as a reference category in ordinal logistic analyses. Those who said that they did not do the activities were coded as missing data.
Dependent Variables
Disability
Nine dependent variables representing the disability dimension of Nagi’s (1965, 1976) model were selected from the physical functioning section of the NHANES questionnaire. Items were classified within this particular dimension of health if they assessed difficulty performing specific activities in age-appropriate domains of life. In the case of older adults, age-appropriate activities typically include traditional ADLs and instrumental activities of daily living (IADLs); however, in this study, other activities that reflected the individual’s ability to participate in social activities and to go out into social situations were also analyzed. Participants were asked whether, due to a health problem, they had difficulty managing money; doing house chores; preparing meals; getting in and out of bed; using fork, knife, or drinking from a cup; dressing themselves; going out to movies; attending a social event; and performing leisure activities at home. To each of these items, respondents could report having no difficulty, having some difficulty, having much difficulty, that they were unable to do the activity, or that they did not do the activity. Disability items were recoded into polytomous ordered categorical variables, with respondents who reported some or much difficulty grouped together and those reporting inability grouped together. Participants who reported no difficulty were included to serve as a reference category in ordinal logistic regression analyses. Those who said that they did not do the activities were coded as missing data.
Results
Table 1 displays unadjusted percentages and means of selected sociodemographic variables by self-reported vision status. Overall, more than three quarters of the sample reported having good or better vision, whereas nearly 18% reported fair vision and 7% self-reported their vision as poor. The mean age of the entire sample was 74.7 years (standard error of the mean [SEM] = 0.13). On average, participants who reported poor vision were older (M = 77.3; SEM = 0.33) than those with fair vision (M = 75.8; SEM = 0.21) and those with good vision (M = 74.2; SEM = 0.14). The majority (58%) of the sample was female, and proportions of female participants were greater in poor (66%) and fair (62%) vision categories, compared with participants with good self-reported vision (58%). The vast majority of the sample was White (83%), whereas 8% were Black, 6% were non-White Hispanic, and 3% reported some other race. Disproportionately low percentages of those who reported having good vision were Black and Hispanic (7% and 5%, respectively).
Unadjusted Descriptive Statistics for Sociodemographic Variables by Self-Reported Vision Status (NHANES IV, 1999-2008, Weighted)
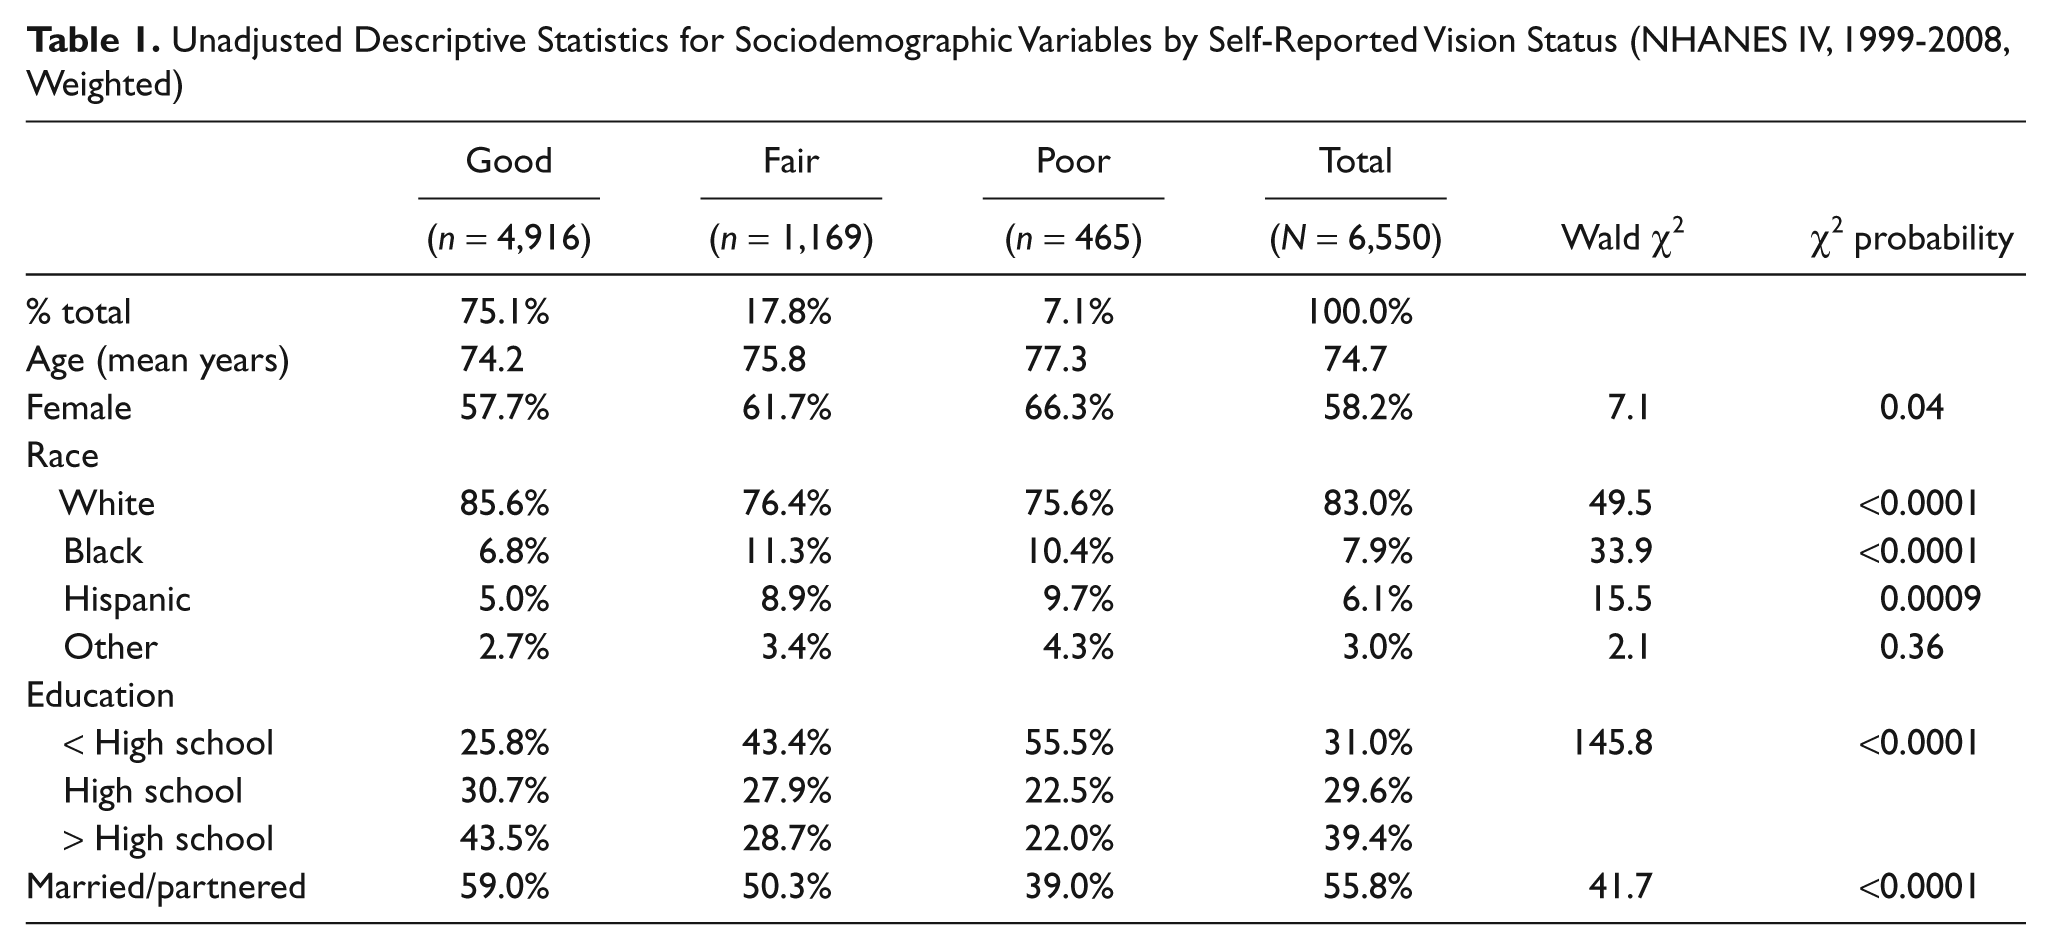
The majority (69%) of the sample reported having attained a high school diploma or more education, although only 45% of those with poor vision, and 57% with fair vision had attained as much education, compared with 74% with good vision. Finally, the majority of participants (56%) reported being married or partnered. Among the vision categories, those with poor vision were the least likely to report being married or partnered (39%); only 50% of participants with fair vision reported being married or partnered compared with 59% with good vision.
Table 2 shows unadjusted percentages of persons in each self-reported vision category who reported any difficulty with or being unable to perform nine daily-living activities representing the disability dimension of health. Significant differences in proportions of persons with difficulty were found for each activity, between persons with self-reported poor vision and those with good vision; however, the largest difference in proportions were found for dressing (31.7% and 9.6%, respectively), getting in and out of bed (32.1% and 10.4%, respectively), and activities related to doing chores around the house (38.2% and 17.1%, respectively). Other areas with large differences in proportions reporting difficulty included going to movies/events, attending social events, and doing leisure activities at home. With respect to dependence, the largest differences in proportions of persons reporting inability were for attending social events. Whereas 30.8% of older persons with poor vision reported this disability, only 2.8% of persons with good vision and 4.3% overall reported being unable to attend social events. Other activities with relatively large differences between groups included doing chores around the house and going to movies/events.
Unadjusted Descriptive Statistics for Self-Reported Daily Living Activity Indicators by Self-Reported Vision Status (NHANES IV, 1999-2008, Weighted)
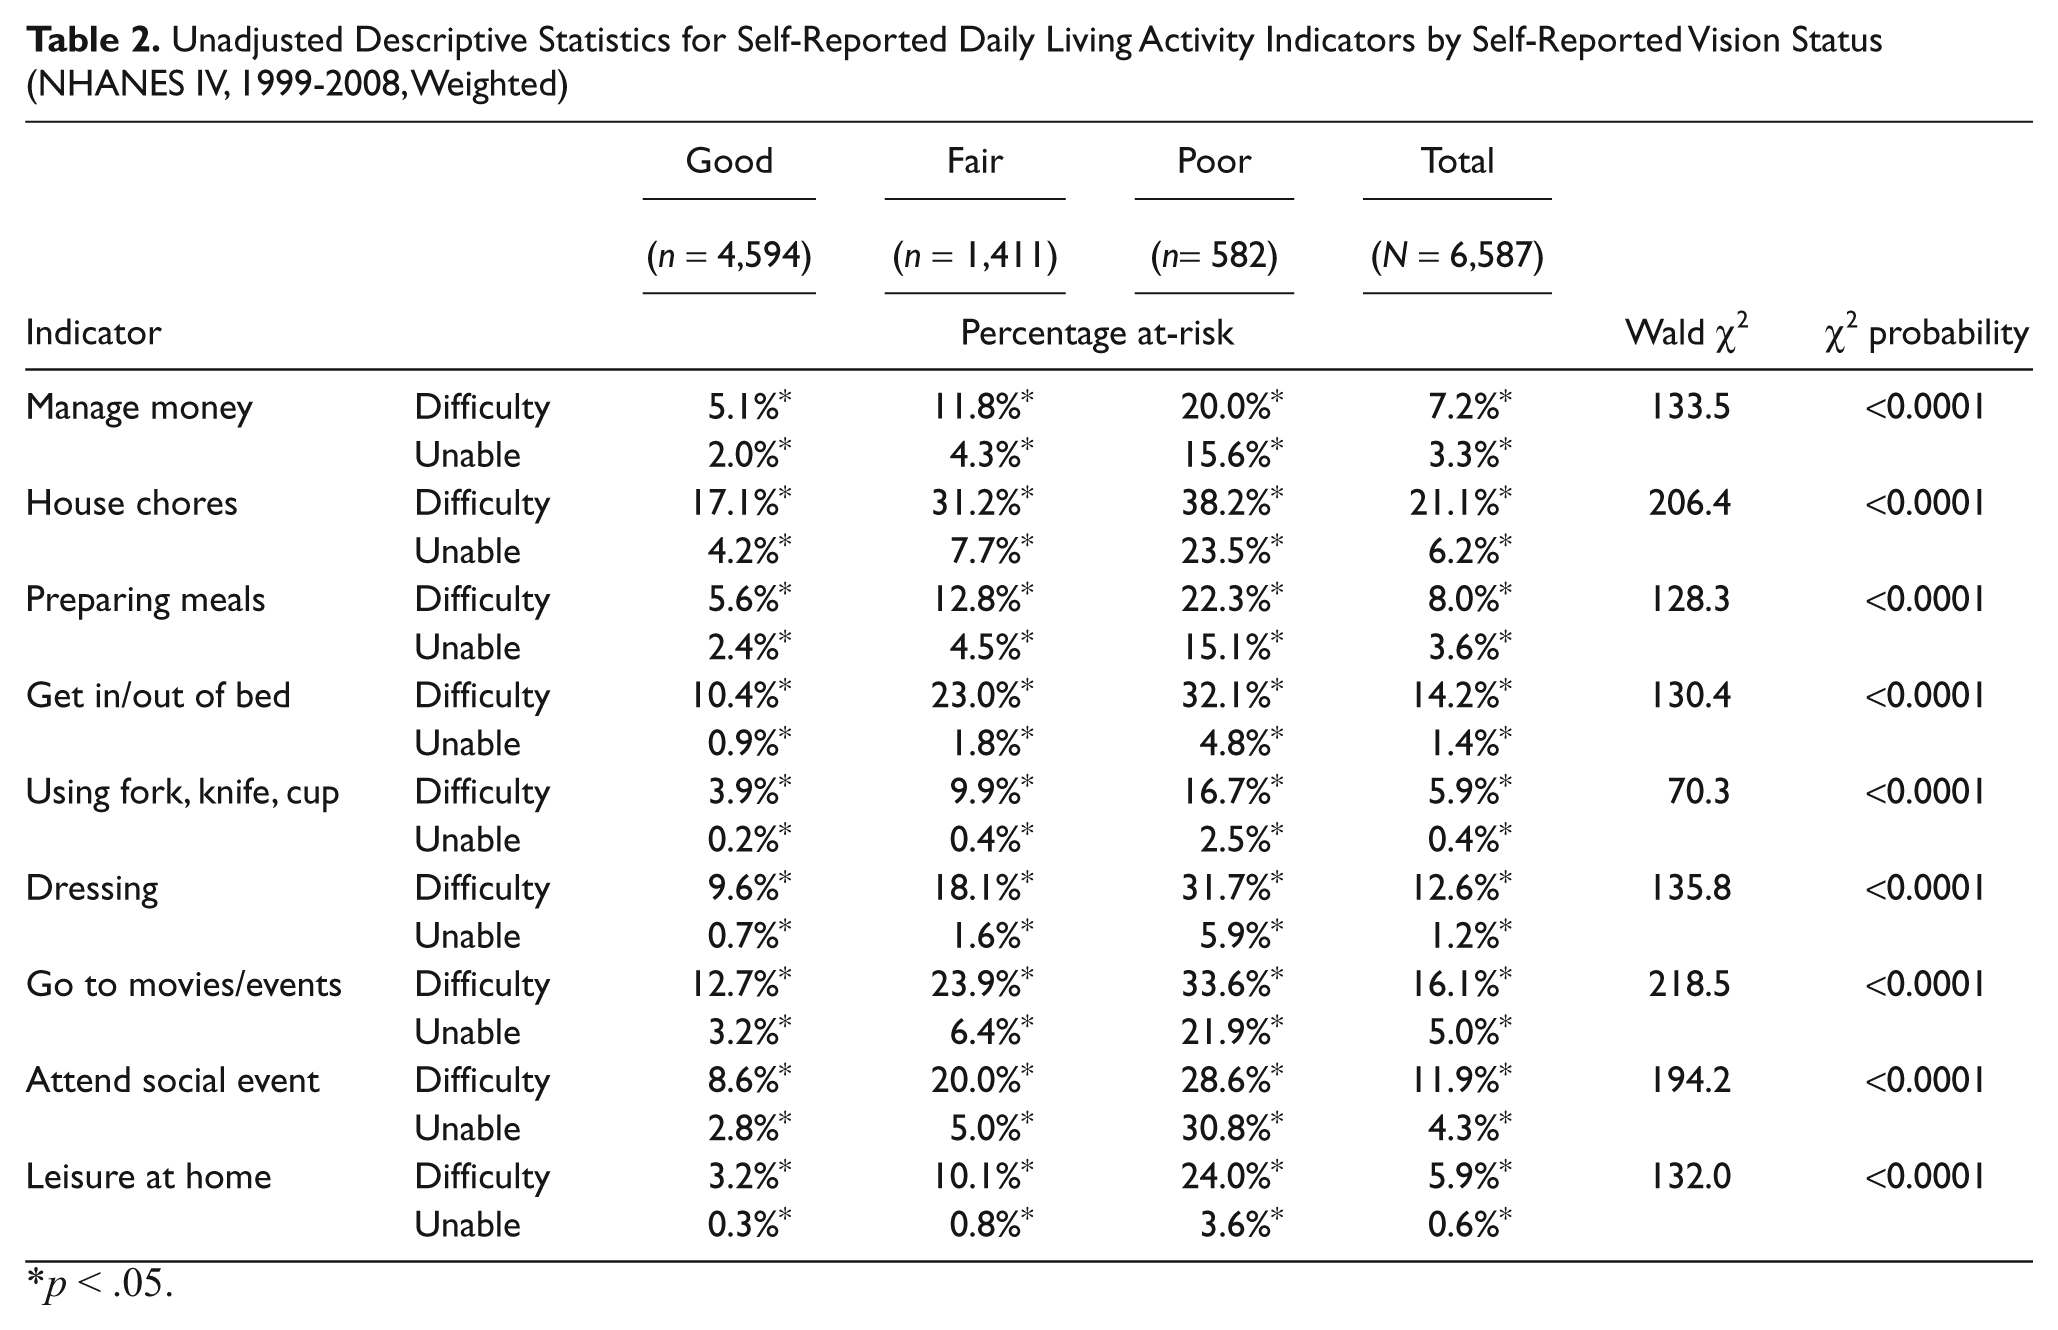
p < .05.
In Table 3, odds ratios and 95% confidence intervals are displayed for each daily-living activity by fair and poor vision groups. Four models are depicted in the table. Model 1 shows odds ratios with controls for sociodemographic covariates. Model 2 includes controls for biological risk variables. In Model 3, pathological conditions are added. Finally, in Model 4, variables from all previous health factor categories are controlled, including functioning covariates.
Ordinal Logistic Regression Models Testing the Effect of Self-Reported Vision Status on Self-Reported Difficulty in Daily Living Activities (NHANES IV, 1999-2008, Weighted)
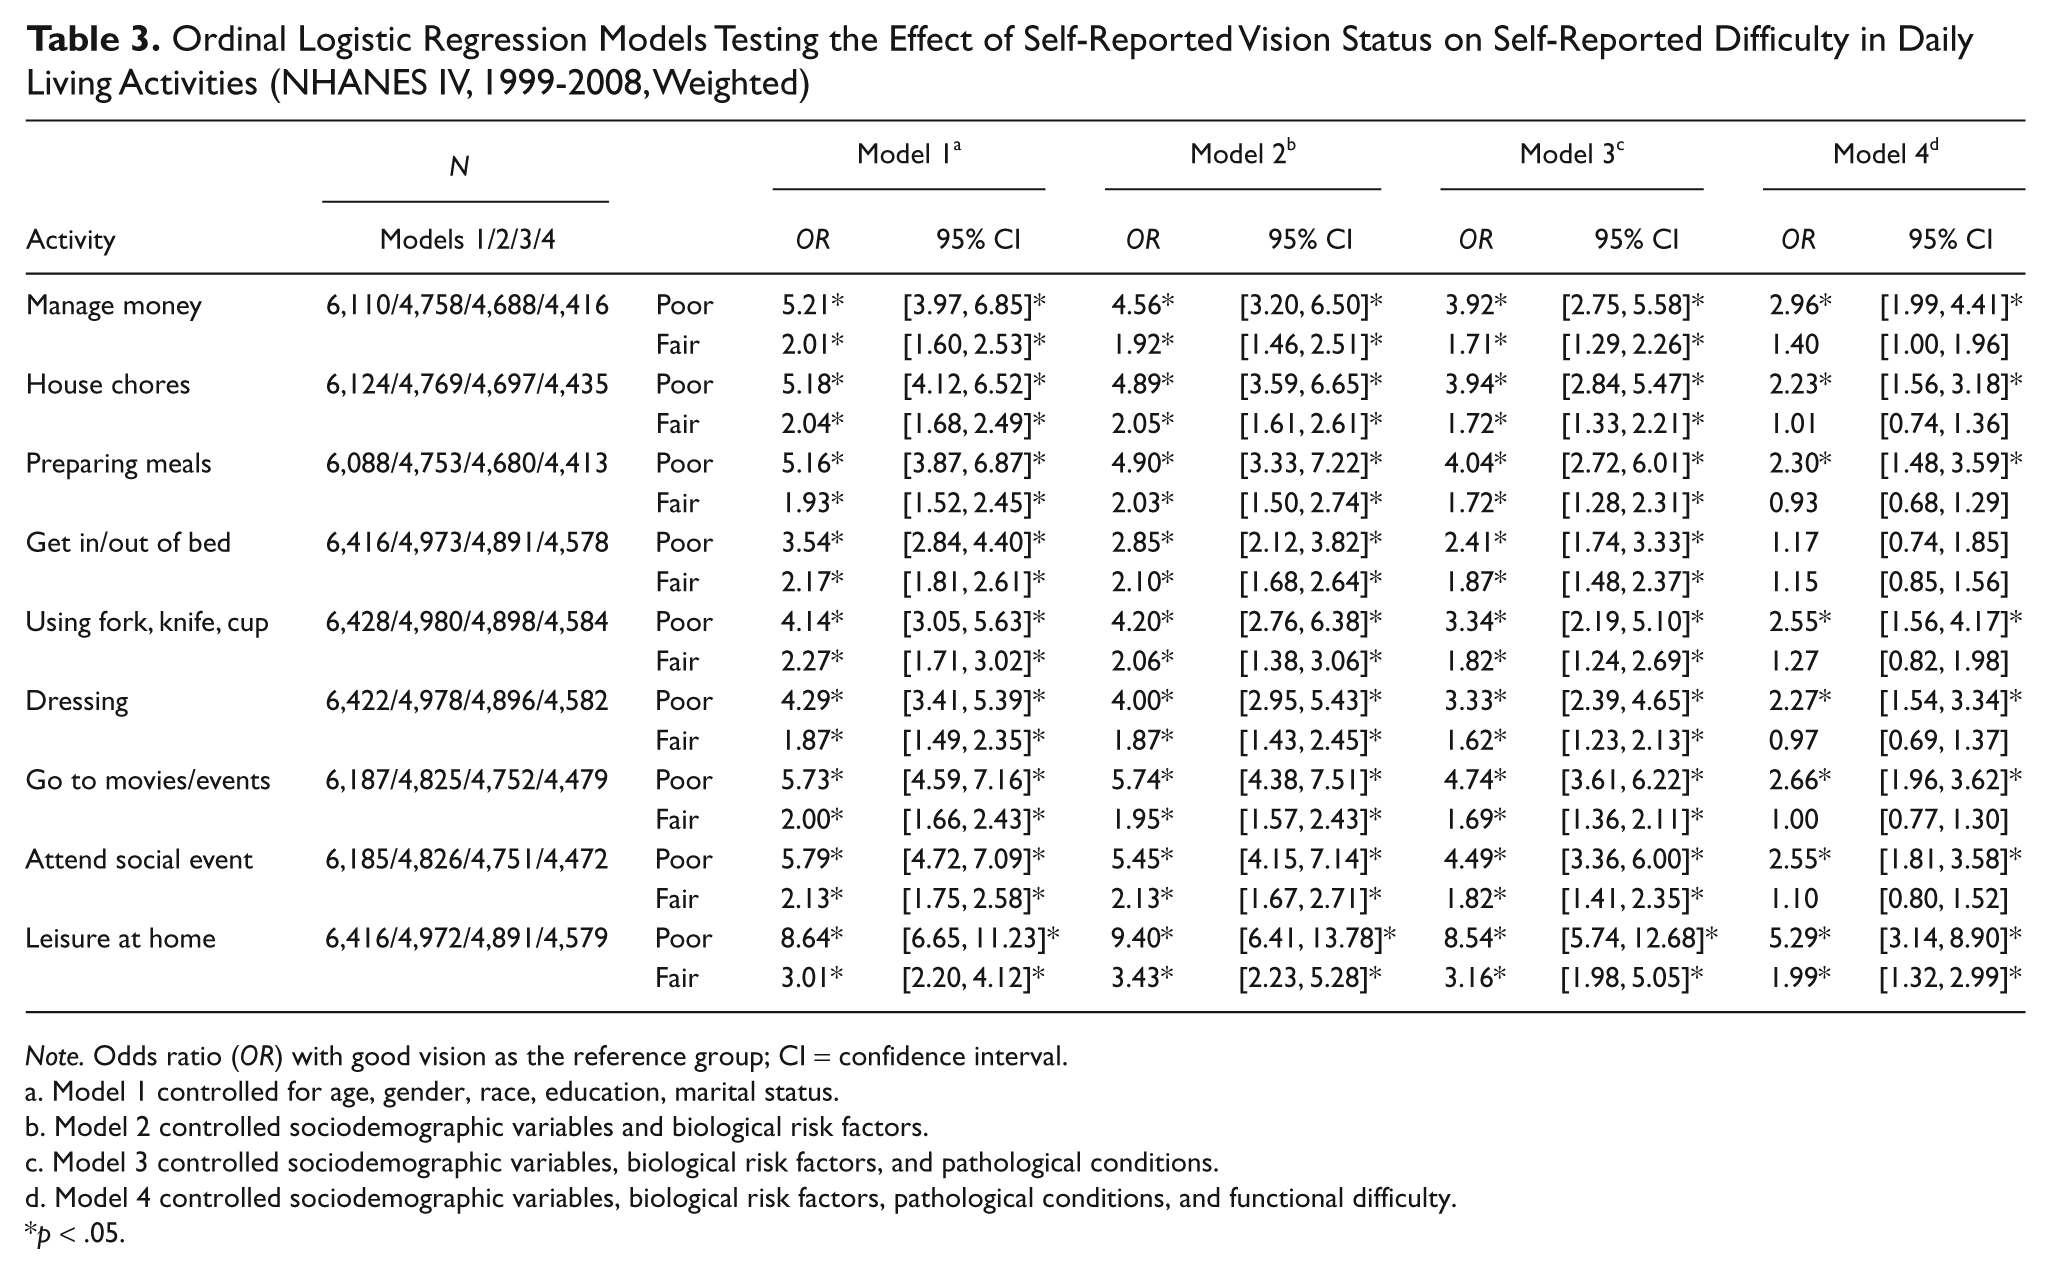
Note. Odds ratio (OR) with good vision as the reference group; CI = confidence interval.
Model 1 controlled for age, gender, race, education, marital status.
Model 2 controlled sociodemographic variables and biological risk factors.
Model 3 controlled sociodemographic variables, biological risk factors, and pathological conditions.
Model 4 controlled sociodemographic variables, biological risk factors, pathological conditions, and functional difficulty.
p < .05.
The general tendency across models was for the effects of self-reported vision impairment on each disability measure to be reduced, as controls for other health dimensions in the disability model were added. For instance, when just sociodemographic variables were controlled (Model 1), reporting fair vision was positively associated with the tendency to report greater levels of disability. Compared with older persons reporting good vision, those with fair vision were about twice as likely to move to the next highest category of disability in each measure. The largest differences in Model 1 for persons reporting fair vision were found for getting in/out of bed (OR = 2.17; 95% CI [1.81, 2.61]); using a fork, knife, or cup (OR = 2.27; 95% CI [1.71, 3.02]); and doing leisure activities at home (OR = 3.01; 95% CI [2.20, 4.12]). By comparison, in Model 4, the effects of vision on daily activities had largely been eliminated after controlling for all other covariates. For older individuals who reported fair vision, this pattern held in eight out of nine of the activities assessed. The only exception was doing leisure activities at home which remained statistically significant (OR = 1.99; 95% CI [1.32, 2.99]); however, compared with Model 1, this effect was also reduced.
A similar pattern was found for persons who reported poor vision. Initially, when only sociodemographic variables were controlled (Model 1) reporting poor vision was positively associated with greater levels of disability. Compared with older persons reporting good vision, those with poor vision were between three and nine times more likely to move to the next highest category of disability in the disability measures. The biggest differences were found for going to movies/events (OR = 5.73; 95% CI [4.59, 7.16]), attending social events (OR = 5.79; 95% CI [4.72, 7.09]), and doing leisure activities at home (OR = 8.64; 95% CI [6.65, 11.23]). When covariates from all other health dimensions were included in Model 4, the effects of poor vision in reporting greater disability were reduced across all activities assessed. In the case of getting in/out of bed, the effects of self reported poor vision were completely eliminated. Nevertheless, older persons who reported poor vision were still more than twice as likely as their counterparts with good or better vision to move to the next highest level of disability in going to movies and events (OR = 2.51; 95% CI [1.74, 3.62]) and managing money (OR = 2.66; 95% CI [1.96, 3.62]) and more than five times more likely to have greater disability in performing leisure activities at home (OR = 5.29; 95% CI [3.14, 8.90]).
Discussion
Whereas it may often be assumed that vision loss, when experienced later in life, is always highly disabling with respect to daily living activities, results of this study suggest that effects of vision loss operate differentially, depending on many other health factors that could preclude vision in predicting disability. In eight out of nine analyses of persons who reported having fair vision, the effects of self-reported vision loss in predicting the inability to perform daily living activities and to participate in activities were eliminated when other health factors were controlled. Furthermore, the item for which fair vision did predict disability—doing leisure activities at home (such as reading, watching TV, and sewing)—could be characterized as highly visual in nature and would most likely be negatively affected if vision were to decline in old age. Therefore, our results point to the potential for even moderate vision loss to influence the quality of life of persons by impeding recreational activities that older adults may value. Vision rehabilitation protocols should continue to emphasize available techniques and technologies developed to accommodate this important area of functioning.
Similarly, among older persons who reported poor vision, the statistical effects of vision impairment were reduced or eliminated when other health dimensions were controlled. In contrast to longitudinal results reported by Tinetti et al. (2005), in which near vision impairment did not predict the frequency of participation in social and productive activities (such as attending events or going on trips), the self-reported measure of vision used in the current study continued to have a strong influence on similar activities, including managing money, attending movies and social events, and doing leisure activities at home. These contrasting results are likely due to differences in methods between studies. The longitudinal analyses used by Tinetti et al. (2005) controlled for baseline values of relevant disability outcomes; thus, a follow-up measure would detect an effect only if performance became worse during the study period.
Although we believe our findings to reflect accurately the associations between self-reported vision and disability, several important limitations should be noted. First, the use of cross-sectional data was limiting in the current study because it did not provide the opportunity to assess the effects of health dimensions in the temporal order that was implicitly hypothesized. Whereas, one could argue that the analytic approach used was conservative in that all possible confounders were considered in the analysis, it is also possible that these models are overcontrolled in that some factors which are direct or indirect consequences of impairment have been adjusted for in the model. The relationship between vision and health is complicated because it is often difficult to determine directionality of relationships—that is, to sort out the extent to which vision loss may cause changes in biomarkers that often precede chronic diseases, functional loss, and disability versus the extent to which health dimensions lead linearly and unidirectionally to disability. These factors can be examined using longitudinal but not cross-sectional data.
The second limitation of this study involves the potential for nonresponse bias of participants included in Models 2 through 4, where subsamples were used. Although cases were selected randomly for participation from the sample at large, it is possible that results reported in these analyses could be influenced if those with vision impairment were less likely to report to the physical examination where biological data were collected. In fact, proportions of visually impaired cases were slightly lower in analyses that controlled biological markers, though differences were not statistically significant. Nevertheless, associations reported above could be even stronger or weaker if these, possibly more frail individuals, were included in the analyses. We hypothesized that the influence of vision loss on disability would be diminished if health factors preceding disability were held constant. This hypothesis was largely supported by our analyses. Therefore, results of this study suggest that the most effective vision rehabilitation interventions for older adults who are blind or visually impaired would need to address problems associated with multiple health factors. Services and programs designed for older adults in general as well as those that target services to the population of older persons with visual impairments can benefit by an increasing awareness of how certain health conditions may be experienced differently by older persons who are visually impaired. To deal most effectively with the problem of disability associated with visual impairment requires improved access to an array of services and service providers. By taking into consideration disparities in health factors that older adults with visual impairments often face, services can be tailored to address health issues that, otherwise, may lead to further functional decline and loss of independence.
Agencies that provide vision rehabilitation services to older adults, including state/federal older blind independent living programs, could achieve more comprehensive services by establishing stronger network connections with other agencies that also serve older people in the medical and long-term care sectors (Steinman & Moore, 2007). Given projections of a growing number of older individuals with age-related vision impairments, it is clear that practitioners across numerous fields who are interested in fostering independence, and thus facilitating community living among older adults, will need to become more aware of issues related to medical, functional, as well as rehabilitative aspects of blindness and visual impairment, especially as they relate to disability.
Footnotes
Acknowledgements
The authors wish to extend their appreciation to Jon Pynoos, Susan Enguidanos, and James Gauderman for their comments on earlier drafts of this manuscript.
The authors declared no potential conflicts of interest with respect to the research, authorship, and/or publication of this article.
The authors disclosed receipt of the following financial support for the research, authorship, and/or publication of this article: Work on this manuscript was completed with support from training grants provided by the National Institute on Aging (No. 5T32AG0037), and the Agency for Healthcare Research and Quality (5T32HS000011), as well as the Archstone Foundation.