
Abstract
Introduction
There is growing evidence that physical functioning not only characterizes physical capability, but also acts as a marker of current and future health. Thus, functional limitations and poor physical performance have been shown to be predictive of mortality (Guralnik & Ferrucci 2003; Cooper, Kuh, & Hardy, 2010) and other adverse health and aging outcomes (Cooper et al., 2010; Cooper, Kuh, et al., 2011). This evidence is based on systematic reviews among older populations, using self-reported functional limitations and tests on grip strength, walking speed, balance and chair rise (Cooper et al., 2010; Cooper, Kuh, et al., 2011; Guralnik & Ferrucci, 2003).
Although functional limitations measured by both physical tests and self-reports are highly relevant at older ages (Melzer, Lan, Tom, Deeg, & Guralnik, 2004), there has been little attention on the development of functional limitations prior to older age (Gardener, Huppert, Guralnik, & Melzer, 2006) and on gender differences in the early stages of functional limitations (Cooper, Hardy, et al., 2011). In addition, little is known about variations by gender and socioeconomic position in more vigorous physical functions tests. Vigorous physical function tests refer to muscle strength in central parts of the body (Holmstrom, Moritz, & Andersson, 1992), explosive power, measured with jump height used to evaluate functional capacity among older people (Holsgaard, Caserotti, Puggaard, & Aagaard, 2007) and reaction time reflecting the coordination between brain and muscles (Versavel et al., 1997). These measures might capture functional limitations at an earlier stage in the disablement process compared with other more widely used measures of self-reported or performance-based measures of physical function applied in older age groups.
Measuring levels of physical functions in populations in midlife may provide a possibility to capture individuals who are at risk of onset of disability in later life, and in whom intervention might be effective. If it is possible to identify groups of people in midlife who are more vulnerable for functional decline, it may also be possible to target these groups with preventive interventions and slow down or postpone the onset of early aging processes in midlife. As a result, more people may be able to extend more years of healthy aging into older ages. Assessment of vigorous physical functions in middle-aged populations may also reduce selective drop-out of these tests due to poor health, which may limit greater numbers of older adults to complete such tests. Early onset of functional decline is a heavy social and economic burden to the individual as well as to the family and society. Several studies have shown associations between socioeconomic position and self-reported physical function in old age and in midlife among men and women (Nilsson, Avlund, & Lund, 2011a, 2011b). Older women and those of lower socioeconomic position consistently constitute a larger portion of the disabled population than older men or those of higher socioeconomic position. A recent study showed that disability in old age may begin early in midlife, especially for women from manual occupation households, indicating a social gradient (Murray et al., 2011). Low socioeconomic position has been associated with lower physical performance in old age with respect to walking speed (Brunner et al., 2009). Further, socioeconomic position during the life course has shown strong impacts on midlife physical performance measured as standing balance, and chair rise (Strand, Cooper, Hardy, Kuh, & Guralnik, 2011), and on slower walking speed in old age, though with mixed results for balance ability (Birnie, Martin, et al., 2011). Moreover, Mohd and colleagues found that for older individuals, wealth is more predictive for grip strength than is education, occupation, and income measured earlier in life (Mohd Hairi, Mackenbach, Andersen-Ranberg, & Avendano, 2010).
Only few studies among older people have analyzed the associations of socioeconomic position with physical functions covering measures of muscle strength and power (for review, see Guralnik & Ferrucci, 2003). Muscle strength and power are more related to vigorous physical functions and more relevant for people at work compared with measuring restrictions in basic physical and mental functions among older people as described in the pathway of progression in physical performance from disease to disability (Guralnik & Ferrucci, 2003; Birnie, Cooper, et al., 2011). Complaints in working life often are related to muscle endurance, fatigue, and recovery after sustained isometric efforts (shoulder abduction and torso extension; Guo, Tanaka, Halperin, & Cameron, 1999). It is also well known that older individuals have substantially lower muscle strength, for example, older persons (age 55-65 years) have weaker isometric work capacity (trunk extension and flexion) compared with younger persons (18-25 years). Older individuals also exhibit lower muscular strength, longer endurance time, and slower development of local muscle fatigue (Yassierli, Nussbaum, Iridiastadi, & Wojcik, 2007). However, less is known about social class differences in more vigorous physical functioning in these age groups.
The overall objective was to analyze (a) gender differences and social class gradients in physical functions and (b) to study whether the social class gradients in physical functions in midlife differed between men and women. We used traditional physical performance measures (standing balance, chair rise, handgrip strength, and reaction time). To capture a broad spectrum of age-related changes in physical functions in a working population, we also added measures related to vigorous physical functioning (sagittal flexibility, jump height, and body muscle [trunk extension and flexion]).
Materials and Method
Eligible cohort members were 17,937 persons living in the Eastern parts of Denmark who were invited to participate in the CAMB study (7,750 from the Metropolit Study; 4,906 from the Danish Longitudinal Study on Work, Unemployment, and Health; 5,282 from the Copenhagen Perinatal Study). In total, 7,190 (40%) of the invited persons answered the postal questionnaire and 5,575 (31%) participated in all parts of the study (for details, see Avlund et al., 2014). Participants took part in a health examination and physical performance tests at the National Research Centre for the Working Environment from 2009 to 2011. They completed a baseline questionnaire including questions on social class, leisure time physical activity, and lifestyle, gave blood samples, underwent a clinical examination (height, weight, body fat, blood pressure, lung function), and physical performance tests (test for reaction time, standing balance, sagittal flexibility, jump height), ability (chair rise), and muscle strength and power (trunk extension and flexion, and handgrip strength). For safety reasons, participants with high BP (>160/100) did not perform the physical performance tests that required high physical exertion and thereby risked an additional rise in BP. Exclusion criteria for each specific physical performance test were blind participants regarding reaction time, dizziness regarding standing balance; disc herniation and extensive pain in low back regarding test for flexibility; disc herniation and extensive pain in hip, knee, and ankle regarding test for jump height; high blood pressure (BP; i.e., systolic blood pressure [SBP] > 160 mmhg and/or diastolic blood pressure [DBP] > 100 mmhg) regarding chair rise and test for trunk extension and flexion in up-right position. In total, 5,564 participated in physical performance testing. All participants provided informed consent. The study protocol was approved by the local ethics committee (No: H-A-2008-126) and the Danish Data Protection Agency (No: 2008-41-2938).
Measuring Physical Functions
Minimum reaction time was measured by pushing a button when light appeared. Participants were asked to press the button as quickly as possible, with the best of five attempts serving as minimum reaction time. For the minimum balance area, test participants were asked to carry out three one-legged stands lasting 30 s (Moir, 2008; Street, McMillan, Board, Rasmussen, & Heneghan, 2001). The stand was performed wearing earmuffs and with eyes open, on the dominant foot with the big toe of the nondominant foot leaning against the medial malleolus of the dominant foot. The participant was instructed to look directly ahead at a small light placed approximately 2 m from the force platform at eye height. The best time of three attempts was used. Jump height was measured 3 to 5 times during a two-legged counter-movement jump as described by Moir (2008) and Street et al. (2001). The best attempt was used. Sagittal flexibility was measured during maximal trunk flexion with straight legs as fingertip-to-toe distance (Gauvin, Riddle, & Rothstein, 1990). Functional lower limb capacity was measured as a maximal number of chair rises performed during a 30-s chair rise test (Ritchie, Trost, Brown, & Armit, 2005). The test was performed using a chair (height 45 cm) in which the seat was provided with a mechanical contact wired to the computer. Maximum trunk abdominal muscle strength (flexion) and back muscle strength (extension) were measured 3 to 5 times during a maximal voluntary isometric contraction (MVC; Jorgensen, Ektor-Andersen, Sjogaard, Holtermann, & Sogaard, 2011). The best attempt was used. Maximum handgrip strength was measured with a dynamometer (model G100, Biometrics Ltd, Newport, UK) wired to the computers signal conditioning interface enabling automatically recording of the grip strength force (Jones, Rikli, & Beam, 1999; Rikli & Jones, 1999). The best attempt of three to five attempts was used. All subjects completed the tests in the same order, that is, reaction time, balance, sagittal flexibility, chair rise ability, jump height, handgrip strength, abdominal and back muscles strength. If a participant was unable to perform a physical performance test, the value was set to missing. For more details on the technical equipment of the physical performance tests, see the appendix
Occupational Social Class
We used occupation-based indicators of socioeconomic position to classify social class. Occupation-based indicators of socioeconomic position reflect a relationship between material resources and health as well as social standing and may as such relate health outcomes to certain privileges and better opportunities in life (Christensen et al., 2014). Social class was classified by occupation and coded into Social Classes I-VI and two supplementary groups, according to the standards of the Danish occupational social class classification and described by Christensen et al. (Christensen et al., 2014). According to this classification, Social Classes I-V encompass economically active individuals ranging from professional occupation in Social Class I to unskilled occupation in Social Class V. Social Class VI represents people on transfer income, including sickness benefits and disability pension. Eighty-one participants did not respond to the item of occupation and were excluded. For the present study, we included economically active individuals (Social Class I-V) and individuals on transfer income (Social Class VI). Eight individuals who were economically active but without sufficient job information (Group 7) and a total of 29 students and housewives (Group 8) were also excluded from further analysis. In total, 118 participants were excluded and the total number of participants in the present study was 5,446.
Covariates
Gender and age were assessed at enrollment from personal ID-numbers given to all Danish citizens at birth. The following determinants of disability were included: BMI, smoking status, and leisure time physical activity (Strand, Mishra, Kuh, Guralnik, & Patel, 2011; Krokstad, Johnsen, & Westin, 2002; Hardy et al., 2013). Body weight was measured with light clothes and without socks and shoes. Height was measured without shoes, heels together and buttock, shoulders and head touching the vertical surface on a standardized wall mounted height board. BMI was calculated from the individual’s weight divided by the square of the height expressed in kg/m2. We asked if participants were smokers or nonsmokers (former and never smokers). Leisure time physical activity was assessed with the item: How many hours a week are you physically active? The respondents were asked to include “sport, physical training, house- and garden work, walks and bicycle rides including between home and work.” Response categories were none, approx 0.5 hr, 1 to 2 hr, 3 to 4 hr, 5 to 6 hr, and more than 7 hr per week. Leisure time physical activity was categorized as 1 to 2 hr or less versus and 3 to 4 hr or more.
Statistical Analysis
To analyze differences in physical functions between men and women, for social gradient in physical performance and the interaction between gender and social class on physical performance, we used a generalized linear model (GLM). Outcome variables of these models included minimum reaction time (ms), minimum balance area (mm2), sagittal flexibility (cm from soles), chair rise (number in 30 s), max jump height (cm), maximum handgrip strength (kg), maximum back muscle strength (kg), and maximum abdominal muscle strength (kg). Due to nonnormal (skewed) distributions of minimum reaction time (ms) and minimum balance area, these variables were analyzed on a logarithmic scale. We adjusted for life-style-related determinants of disability by including BMI, smoking and leisure time physical activity (two levels). SPSS statistical software (version 20.0) was used.
Results
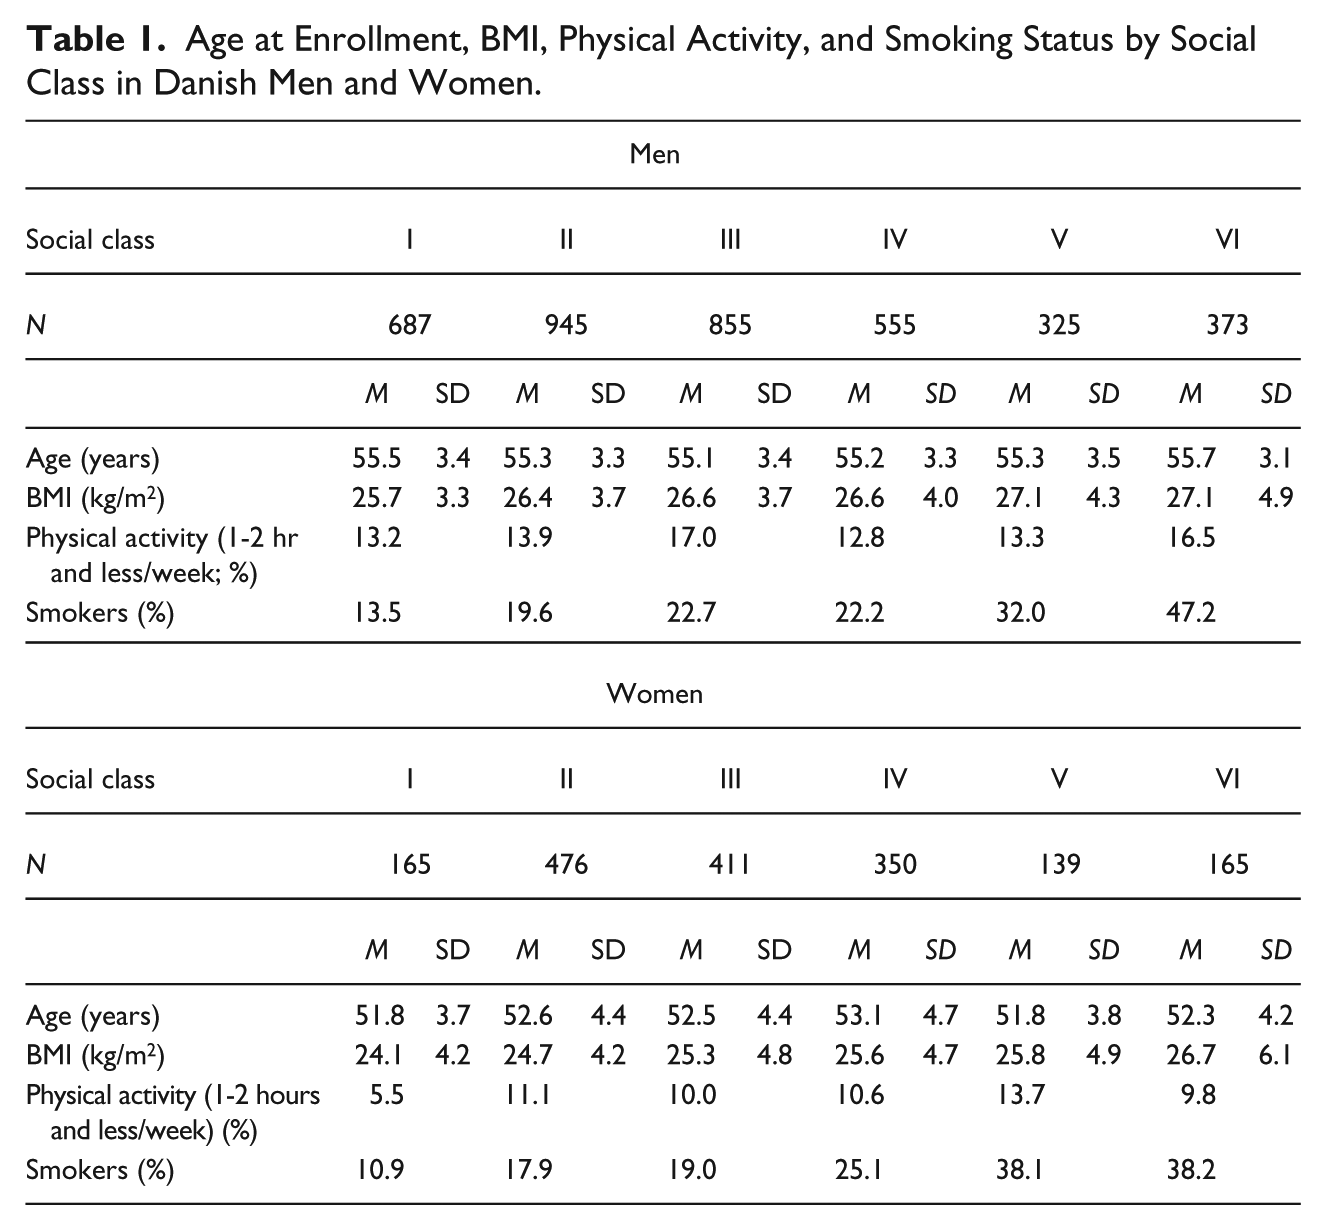
The distributions of age, BMI, percent participants physically active in leisure time 1 to 2 hr and less per week, and percent smokers by social class and gender are presented in Table 1. Men were in general less physically active in leisure time compared with women (p < .001). We observed no age differences in social class among men and women in the study group.
Age at Enrollment, BMI, Physical Activity, and Smoking Status by Social Class in Danish Men and Women.
We had valid physical performance test measures for ≥82% of the 5,575 participants. The main reason for missing data was the inability to complete a particular test during the baseline examination: reaction time (n = 5,564, participation rate [>99%]), problems with the buttons and disturbance during the test; one-legged balance tests (n = 5,347, participation rate [96%]), technical problems with estimating the balance area or unable to keep balance in one leg and cramps in the leg; sagittal flexibility (n = 4,917, participation rate [88%]), back pain, not flexible enough to reach the pin and musculoskeletal problems; jump height (n = 4,763, participation rate [85%]), incorrect jump; back muscle strength (n = 4,595 [82%]); and abdominal muscle strength (n = 4,641, participation rate [83%]), low back pain and problems straining the back; handgrip strength (n = 5,558, participation rate [99%]), due to missing fingers. For jump height and sagittal flexibility, more than 15% did not perform the test. Hence, we tested if participants were healthier than nonparticipants in these two tests using lung disease as it was the most prevalent disease among the participants. We found that the nonparticipating men had more lung diseases (p = .032) than those who completed the tests. This was not seen among women (p = .153) for sagittal flexibility. For jump height test, we saw the same picture (women: p = .084; men ≤ .001).
Gender Differences in Physical Performance
Men had significantly better reaction time (−9.9 ms), higher number of chair rises (+0.7), higher jump height (+7.6), better back muscle strength (+25.1 kg), abdominal muscle strength (+25.0 kg), and handgrip strength (+18.4 kg) compared with women. In comparison, women had better balance (−314 mm2), and had greater sagittal flexibility (+8.7 cm). Unadjusted values for physical performance tests and tests for gender differences are presented in Table 2.
Physical Performance Among Middle-Aged Danish Men and Women.
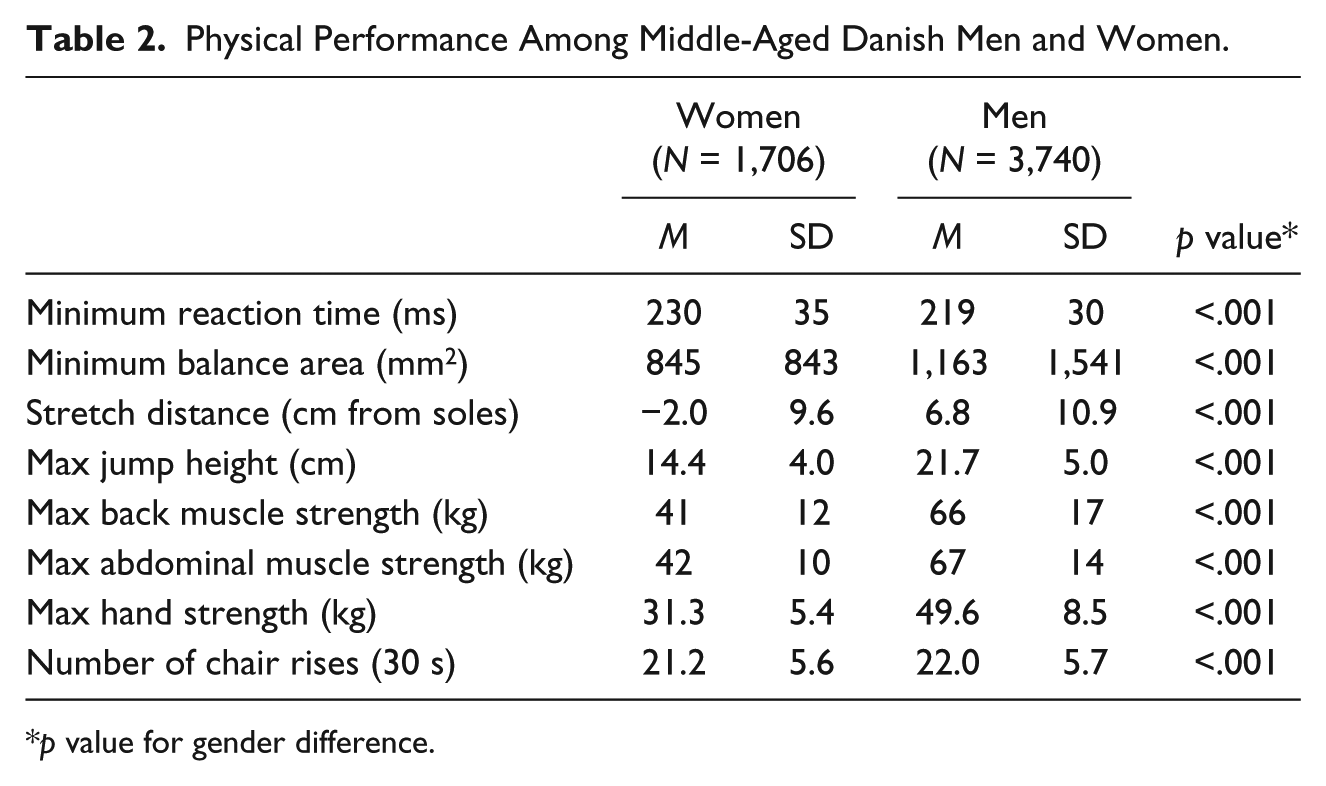
p value for gender difference.
Social Class Differences in Physical Performance
We found no interaction between gender and social class gradient in any of the physical performance tests (p values > .23). Thus, data for men and women were combined for the analysis of social gradients in physical performance tests. Table 3 presents the unadjusted values for Social Class I and adjusted differences in physical performance for Social Class II to VI using Social I as the reference. The overall pattern showed social gradients in all physical performance tests. In the more commonly used physical performance tests, we found higher reaction time and lower balance, handgrip strength and chair rise from Social Class I to VI. We also found social gradients in the more strenuous physical performance tests, with lower sagittal flexibility, jump height, and back and abdominal muscle strength from Social Class I to VI. Social class differences remained after adjusting for BMI, age, and leisure time physical activity. Even though we observed that smoking was associated with both social class and physical performance, adjustment for smoking did not affect the association between social class and physical performance.
Differences in Physical Performance Among Middle-Aged Danish Men and Women in Social Class I vs. Social Class II-VI.
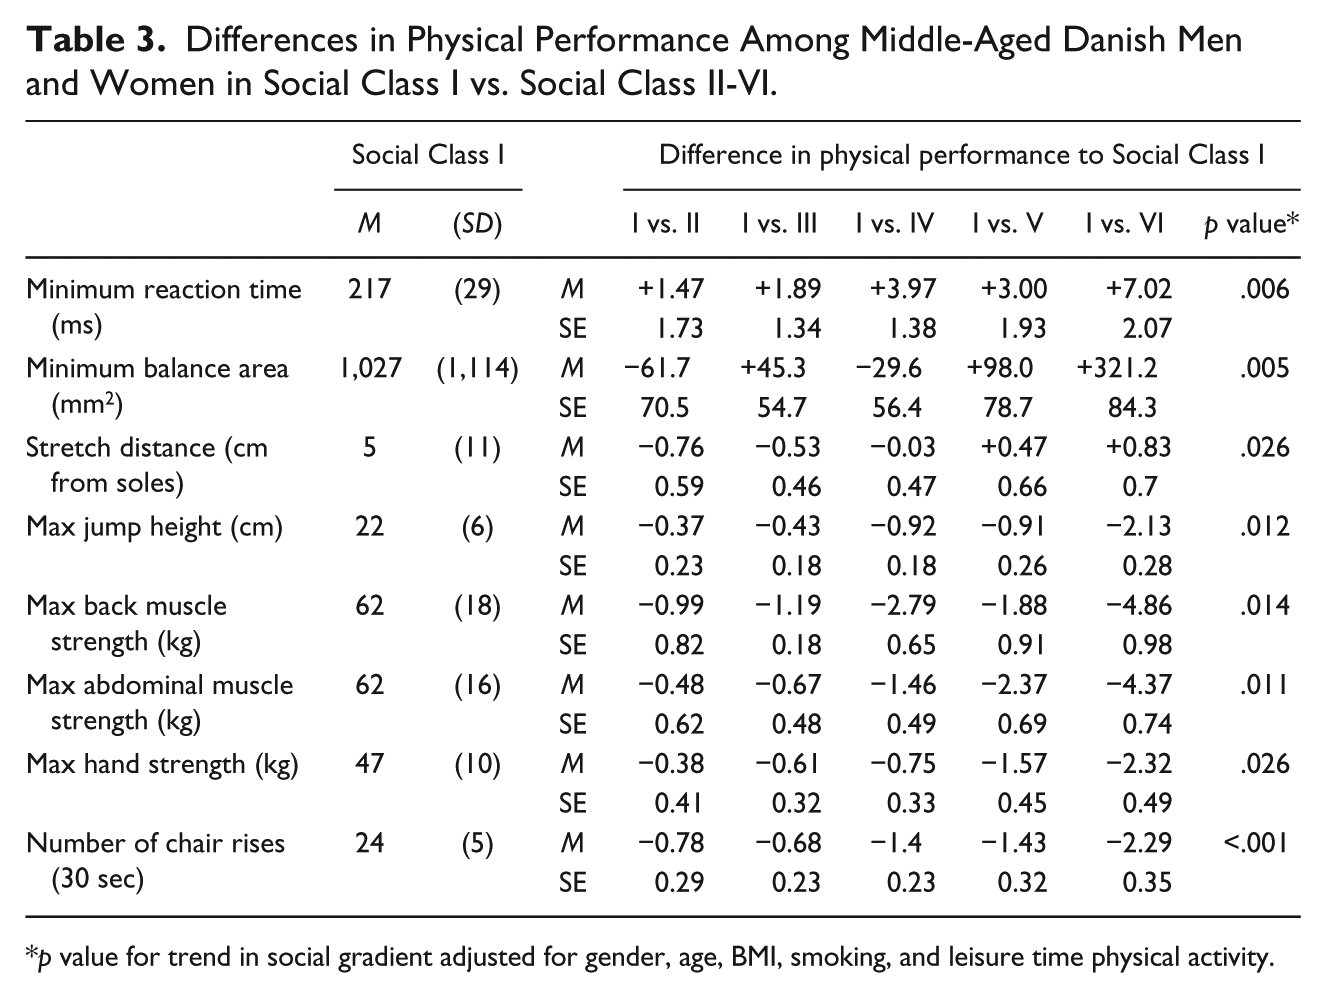
p value for trend in social gradient adjusted for gender, age, BMI, smoking, and leisure time physical activity.
Discussion
In accordance with other studies (Pan et al., 2009; Cooper, Hardy, et al., 2011), we showed that men performed better than women in both the traditionally used physical performance measures and in most measures related to vigorous physical functioning (muscle strength and muscle power), whereas women had better sagittal flexibility and were better at keeping balance on one leg than men. This underscores that it may be important to have a special focus on gender differences in interventions aiming at preventing functional decline in later life. Our results suggest that preventive interventions should have a specific focus on training of muscle strength and muscle power in women and on sagittal flexibility and balance training in men. It is possible that this type of training already in midlife may postpone functional decline later in life, so that more people experience a healthy aging in later life.
Another main finding was the large social class gradients in physical performance in middle-aged men and women. We found a social class gradient in measures, which reflect muscle strength in central parts of the body, explosive power, and reaction time reflecting the coordination between brain and muscles. This adds to findings from other studies that showed social inequality in balance and chair rise (Strand, Cooper, et al., 2011). We did not find an interaction between social class and gender for any of the physical tests. This indicated that the social class gradients in physical tests were similar among men and women.
Occupational social class as measured in the present study represents the major structural link between education and income. Educational attainment is important in determining what kinds of jobs are obtainable, and job type predicts the level of income. Further, occupational social class reflects a general social standing, for example, certain privileges and better opportunities in life. Occupational social class in midlife may thus be seen as an accumulated measure of social conditions throughout life. It is an important finding to see such clear social gradients in these measures of objectively measured physical performance, on factors which are highly relevant for the aging process. For a middle-aged population, still economically active it might be relevant to differentiate between types of functions. Managing physical labor might demand more physical capacity than doing the common mobility activities and other activities of daily living usually assessed in older populations. Therefore, it is relevant to supplement the physical performance measures from the assessments of walking speed, standing balance, handgrip strength, and chair rise test commonly used among older people (Guralnik & Ferrucci, 2003), with more demanding tasks such as jump height, flexibility and muscle-strength and -power of the trunk. Apart from being essential to activities of daily living, flexibility, strength and power of the trunk are essential to prevent work-related injuries and back-problems and to reduce the risk of subsequent mobility limitations and disability (Granacher, LaCroix, Muehlbauer, Roettger, & Gollhofer, 2013).
One possible explanation for the strong social gradients in physical performance in late midlife could be that regular leisure time physical activity is more prevalent among individuals with high socioeconomic position compared to individuals with low socioeconomic position (Pan et al., 2009; Popham & Mitchell, 2006). A recent Danish study showed that low vigorous physical activity in childhood tracks through adolescence, but also that tracking into adulthood only occurs among individuals with low socioeconomic position in childhood (Suppli et al., 2012). Also, a study by Cleland, Ball, Magnussen, Dwyer, and Venn (2009) showed that persistent high socioeconomic position was associated with an increase in physical activity from childhood to adulthood (Cleland et al., 2009). Thus, it is likely that some tracking of physical activity will be seen in all socioeconomic groups and that the tracking patterns may differ between individuals with different socioeconomic positions.
In this study, we assessed BMI, physical activity, and smoking as underlying explanations for the association between social class and the physical performance measures, which in addition to use of alcohol all have been shown to be common determinants of self-reported mobility limitations in midlife (Kuh, Bassey, Butterworth, Hardy, & Wadsworth, 2005; LaCroix, Guralnik, Berkman, Wallace, & Satterfield, 1993; Stuck et al., 1999), to be socially unequally distributed (Koster, Bosma, Broese van Groenou, et al., 2006), and also to be well-known risk factors for diseases of high prevalence in midlife. Health behaviors and BMI have been shown to explain some of the association between socioeconomic position and self-reported mobility limitations in midlife (Clark, Stump, & Wolinsky, 1998; Sainio, Martelin, Koskinen, & Heliovaara, 2007; Nilsson et al., 2011b). However, adjustment for BMI and smoking did not change social class differences substantially in specific physical functions. Furthermore, chronic conditions may explain some of these associations. However, as study participants were excluded from the physical performance test in the presence of health-related contra-indications, we do not believe that chronic conditions would be a major explanatory factor, but might indeed be an explanatory factor for poor physical function in the working population as a whole. Additional factors have been suggested as explanatory factors for social inequality in self-reported mobility limitations, such as high level of inflammatory markers (Koster et al., 2005), psychosocial factors (e.g. social relations, self-efficacy), work-related factors and stress (House et al., 1994; Koster, Bosma, Penninx, et al., 2006; Martikainen, Stansfeld, Hemingway, & Marmot, 1999; Sainio et al., 2007), and use of medical care (Krasnik, Hansen, Keiding, & Sawitz, 1997). In a previous study showing a social gradient in self-reported mobility limitations in midlife, measures of physical exposures in the working environment and psychosocial work environment did not explain the social gradient (Nilsson et al., 2011a).
There are both strengths and limitations of our study. Performing objective measures of physical performance in a large heterogeneous sample of adults in late midlife strengthens the validity of our results. Unknown selection bias may have confounded our results, for example, people with certain health behaviors may find it more or less attracting to participate in physical performance tests. Hence, selections may result in an underestimation of the association between SES and physical performance. The women in our study were 3 years younger than the men, which should be considered when comparing physical performance between men and women. Further, we observed more smokers in the lower social classes. Smoking was associated with both social class and physical performance, but adjustment for smoking did not affect the association between social class and physical performance. An analysis of nonrespondents versus respondents revealed that the respondents in the physical performance tests were more likely to have a job, and less like to be on transfer income and being pensioner (Avlund et al., 2014).
In conclusion, this study covers a broader range of physical functions with the inclusion of trunk muscle strength and power. These muscle strength and power measures are highly relevant for physical performance at work and may therefore be relevant to include when assessing physical performance in a working population. We found gender differences and social class gradients for all the physical performance tests. We did not find the social gradient in physical performance to differ between men and women. Including measures of vigorous physical functioning may add to the existing knowledge on development of functional limitations and poorer aging-related health trajectories later in life.
Footnotes
Appendix
Acknowledgements
The authors thank the staff at Department of Public Health and the National Research Center for the Working Environment who undertook the data collection. Further thanks to Merete Osler, Erik Lykke Mortensen, Nils-Erik Fiehn, Helle Bruunsgaard, and Poul Holm-Pedersen who initiated and established CAMB from 2009 to 2011 together with Åse Marie Hansen, Rikke Lund, and Kirsten Avlund. The authors acknowledge the crucial role of the initiators and steering groups of the Metropolit Cohort, The Copenhagen Perinatal Cohort, and The Danish Longitudinal Study on Work Unemployment and Health.
Declaration of Conflicting Interests
The authors declared no potential conflicts of interest with respect to the research, authorship, and/or publication of this article.
Funding
The authors disclosed receipt of the following financial support for the research, authorship, and/or publication of this article: The CAMB study has been supported by a generous grant from the VELUX FOUNDATION in Denmark.