
Abstract
Introduction
As China experiences rapid population aging, the prevalence of disability is also rising considerably (Zheng et al., 2011). Older persons with disability often require and use more health care services than their counterparts and thus put a heavy pressure on the system that provides and finances these services (Dejong et al., 2002; Mitra, Findley, & Sambamoorthi, 2009). However, our knowledge of the disease pattern of the disability burden among the elderly population in China remains limited, which impedes the ability to develop effective policies to prevent disability.
Only a few studies have tried to decompose the disability burden into diseases in the elderly populations (Jagger, Goyder, Clarke, Brouard, & Arthur, 2003; Jagger et al., 2007; Klijs, Nusselder, Looman, & Mackenbach, 2011; Laditka & Laditka, 2006; Mathers, 1999; Peres, Jagger, Matthews, & Mrc, 2008; Reynolds, Haley, & Kozlenko, 2008). And, almost all the studies are focused on developed countries, for example, Australia (Mathers, 1999), the Netherlands (Klijs et al., 2011), the United Kingdom (Jagger et al., 2003; Jagger et al., 2007; Peres et al., 2008), and the United States (Reynolds et al., 2008). Previous research has identified musculoskeletal and circulatory diseases as two of the most important causes of disability burden (Jagger et al., 2007; Klijs et al., 2011; Mathers, 1999). Sensory organ disorders and injuries are also reported to be influential factors (Jagger et al., 2007; Mathers, 1999). In addition, some individual diseases like arthritis (Jagger et al., 2007; Klijs et al., 2011), diabetes (Jagger et al., 2003; Jagger et al., 2007; Laditka & Laditka, 2006), depression (Peres et al., 2008; Reynolds et al., 2008), and stroke (Jagger et al., 2007; Klijs et al., 2011; Mathers, 1999) also exhibit significant impact on disability.
China, as a developing country, is at a different stage of the epidemiologic transition compared with developed countries (Omran, 2005; Yang et al., 2008), which means the conclusions drawn from these countries may not reflect the situation in China. Although the Global Burden of Disease (GBD) Study provided country-specific estimates of disability-adjusted life years (DALYs) for China, this measure is based on years of life lost from premature death and years of life lived in less than full health, but not the actual presence of physical or mental disabilities (World Health Organization [WHO], 2008). Therefore, there is still an unaddressed need to explore the disease pattern in disability burden in the context of China.
In addition, dealing with the issues of comorbidity in disability, especially among older people, is one of the core methodological problems in assessing the impact of diseases on the disability burden (Jagger & Robine, 2011; Mathers, 2003). The earliest methods attributed all of a person’s disability to one main health problem and assumed that disability could be eliminated with the elimination of the main health problem (Colvez & Blanchet, 1983; Mathers, 1999). This actually overestimates the impact of major health conditions and underestimates the impact of other diseases (Mathers, 2003). In an attempt to deal with this problem, Nusselder and colleagues used a multiple logistic regression model to control for comorbidity (Nusselder, van der Velden, van Sonsbeek, Lenior, & van den Bos, 1996). All potential health problems and age categories are initially included in the regression model and then the diseases of interest are deleted from the model. The difference between the fitted total disability prevalence and cause-deleted disability prevalence is regarded as the impact of eliminated diseases (Nusselder et al., 1996). The drawback of this method is that the impact of diseases depends on the order of elimination, that is, the other diseases still present in model after elimination. The third method is to use multistate life tables in such analyses (Jagger et al., 2003; Jagger et al., 2007; Peres et al., 2008; Reynolds et al., 2008). Through estimating the additional disability-free years gained in persons free of conditions such as stroke and arthritis at baseline, researchers assess the impact of health problems on the disability burden (Jagger & Robine, 2011). However, the number of covariates included in multistate life tables is generally limited in such studies, which makes it difficult to incorporate all the comorbidity simultaneously. Recently, an attribution method based on a multivariate additive regression model has been developed (Nusselder & Looman, 2004). With this approach, it is possible to partition the disability burden into additive contributions of diseases taking into account the presence of comorbidity (Nusselder & Looman, 2004).
Using the attribution tool and the Sullivan method, this study will analyze the contributions of diseases to the burden of disability among the elderly population in China. The analyses will be conducted at both the disease group level, which is useful for depicting the whole pattern of disease in the disability burden, and the individual disease level, which can help better define health policy priorities.
Method
Data
The Second China National Sample Survey on Disability (The 2006 China Disability Survey) was carried out in all province-level administrative units of mainland China. This survey was approved by the Chinese State Council, and Chinese citizens have the obligation to participate in this national survey. All respondents provided informed consent. Within each provincial stratum, strategies combining a four-stage sampling method and a probability proportional to size cluster sampling method were used to derive a nationally representative sample, excluding the institutionalized population. The final survey interviewed 2,526,145 respondents from 734 counties (5,964 communities) and included 1.9‰ of the total non-institutionalized population in China (Zheng et al., 2011). During the survey, strict quality control measures were implemented at each step; after the survey, to assess data quality, 99 sampled communities were selected randomly for re-enumeration, which showed that the omission rates in the total population and in the disabled population were 1.31‰ and 1.12‰, respectively (Office of Second China National Sample Survey on Disability [CSSD Office] & Institute of Population Research at Peking University [IPR], 2008). Moreover, the distributions of demographic characteristics (e.g., age and sex) were compared for the 2006 China Disability Survey and 1% National Population Sample Survey in 2005, which found no significant difference, leading to the conclusion that the 2006 China Disability Survey data are nationally representative and reliable (CSSD Office & IPR, 2008; Leading Group of the Second China National Sample Survey on Disability & National Bureau of Statistics of China, 2006).
This study focused on adults aged 60 years and above (N = 354,859), including 171,903 males and 182,956 females. Based on the sampling strategy, sample weights were computed and applied in all analyses. There were no missing data in the variables of interest.
Measurements
Disability
Consistent with the disability definition adopted in approving Chinese disability certificate, which is one of the qualifying criteria for a disability allowance and other preferential policies for the disabled (China Disabled Persons’ Federation, 2008), we defined a disabled person as someone who suffered from one or more abnormalities in anatomical structure or the loss of a certain organ or function (either psychological or physiological), and lost (totally or in part) the ability to perform an activity in the normal way. During the survey, there were two steps to confirm a person as having a disability. First, trained field interviewers used a questionnaire to ask respondents whether they or their family members had functioning difficulties as a result of visual, hearing, speech, physical, intellectual, and mental impairments. The persons who had such difficulties were suspected of being disabled. Second, these potentially disabled persons were taken to trained physicians for further screening and confirmation. Based on medical examinations on body function and structure, activity, and participation, physicians made the final diagnosis and assessment of disability according to the operational definition of disability, which is described in CSSD Office (2007). In analysis, the presence of disability is dichotomous (1 = yes, 0 = no).
Judgment and coding of disability causes
Using a questionnaire that is specially designed for disabled persons, doctors made professional judgments in choosing up to two causes for each confirmed disability. Totally, there were 103 potential disability causes included. If a doctor specified a cause(s) not listed in the questionnaire, they would choose the option of “other causes”; if a doctor could not determine any causes for the disability, they would choose the option of “unknown causes.” About 90% of disabilities were assigned specified diseases as causes, which provided a more reliable basis for attribution analyses than data that rely on self-reported health conditions.
According to the 10th version of the International Classification of Diseases (ICD-10; WHO, 2011), we coded the original cause options into 15 disease groups. During this stage, six disease groups were dropped because of their low prevalence (range = 0.04%-1.19%). The nine disease groups included in final analyses were certain infectious and parasitic diseases (infectious); mental and behavioral disorders (mental); diseases of eye and adnexa (eye); diseases of ear and mastoid process (ear); diseases of circulatory system (circulatory); diseases of musculoskeletal system and connective tissue (musculoskeletal); complications of pregnancy, childbirth, and puerperium (CPCP); injury and poisoning; and other. Injury and poisoning was the combination of “injury, poisoning, and certain other consequences of external causes” and “external causes of morbidity and mortality,” which are the 19th and 20th chapters in ICD-10, respectively; the disease group “other” referred to “other causes,” “unknown causes,” and causes that could not be included in any single disease group.
In addition, we also aimed to examine the impact of individual diseases on disability. At the individual disease level, when cause options in the questionnaire had corresponding individual disease categories in the ICD-10, they were coded according to the ICD-10; otherwise, the original cause options were used. To maintain consistency with disease group analyses, the six disease groups excluded from group disease analyses were also dropped in individual disease analyses. The individual diseases in the final analyses were presbycusis, cataracts, cerebrovascular disease, osteoarthritis, unclassified injury, otitis media, retinopathy, and keratopathy; all the remaining causes were coded into “other.”
Analyses
We used the attribution tool developed by Nusselder and colleagues (European Health Expectancy Monitoring Unit, 2010; Nusselder & Looman, 2004), which takes into account the fact that persons who do not report a disease may be disabled (this risk is referred to as “background”) and that persons can have more than one disease (comorbidity; Klijs et al., 2011). Subsequently, we applied the Sullivan method to obtain life expectancy with disability (LED) by disease.
Prevalence of disability by disease
Four assumptions were made to estimate the disability prevalence by disease from cross-sectional data: (a) the distribution of disability by disease is explained entirely by diseases identified during the survey plus the background risk; (b) this distribution is proportional to the risk distribution of becoming disabled in the time-period preceding the survey; (c) all persons of a given age are exposed to the same background disability risk; and (d) the diseases and background risk act as independently competing factors (European Health Expectancy Monitoring Unit, 2010; Nusselder & Looman, 2004). The multivariate additive regression model, the core of the attribution tool, is specified as follows:
where
Then, to estimate the disability prevalence by diseases, we combined the disease-specific rates of disability (
LED by disease
LED by disease was computed using the Sullivan method, which can provide unbiased and consistent estimations of disability-free life expectancy and LED under stationarity assumptions (Imai & Soneji, 2007). The mortality data were primarily from the National Bureau of Statistics of China (2007) and the infant mortality rate was from the United Nations Population Division (2011). The life table was adjusted according to the west model life table by Coale, Demeny, and Vaughan (1983), which has proven to be suitable for adjusting life tables of China (You & Zheng, 2005).
Results
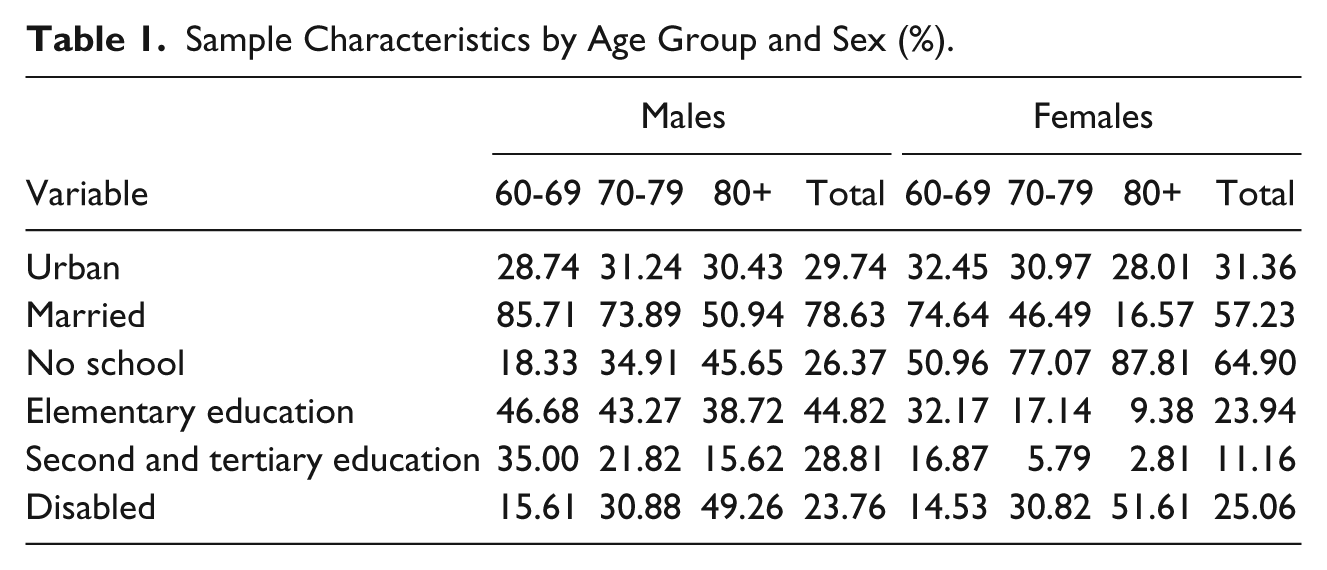
About 30% of older persons lived in urban areas. As people age, fewer were married or had ever attended school, especially among the female elderly; however, more people were disabled, with 50% of the oldest-old (i.e., people aged 80 and above) being disabled (Table 1).
Sample Characteristics by Age Group and Sex (%).
At the disease group level, the five leading causes of disabilities were ear, eye, circulatory and musculoskeletal diseases, injury, and poisoning (Table 2). Sensory organ disorders including ear and eye diseases took a much higher toll than others, and accounted for 55% of disabilities among all elderly persons and for 67% among the oldest-old. Gender disparities also existed in the influence of disease groups on the disability burden, for example, the prevalence of disability due to injury and poisoning among males aged 60 to 69 was almost twice that among females. Furthermore, the relative importance of disease groups for LED was consistent with that for the prevalence of disability. For example, almost 60% of the LED at age 60 in males and females was caused by sensory organ disorders (Table 2 and Figure 1).
The Attribution Results of Disability Prevalence by Disease Group (%) and the LED at Age 60 (LED60) by Disease Group (Years).
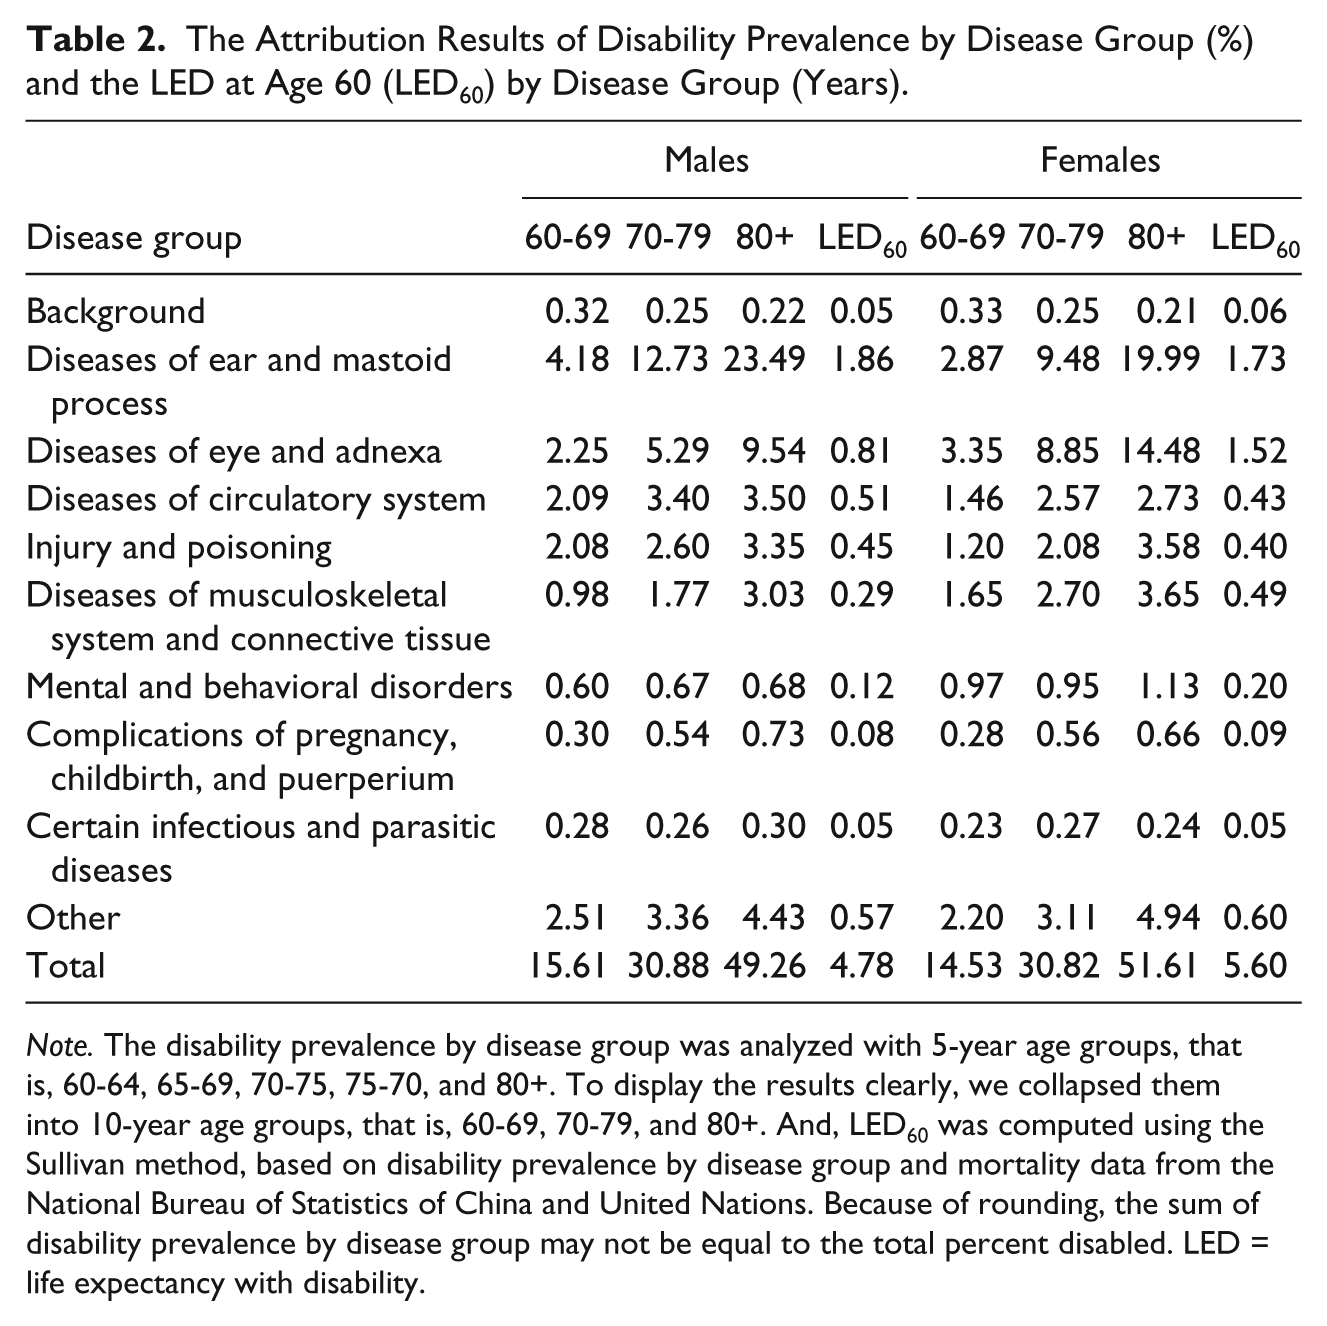
Note. The disability prevalence by disease group was analyzed with 5-year age groups, that is, 60-64, 65-69, 70-75, 75-70, and 80+. To display the results clearly, we collapsed them into 10-year age groups, that is, 60-69, 70-79, and 80+. And, LED60 was computed using the Sullivan method, based on disability prevalence by disease group and mortality data from the National Bureau of Statistics of China and United Nations. Because of rounding, the sum of disability prevalence by disease group may not be equal to the total percent disabled. LED = life expectancy with disability.
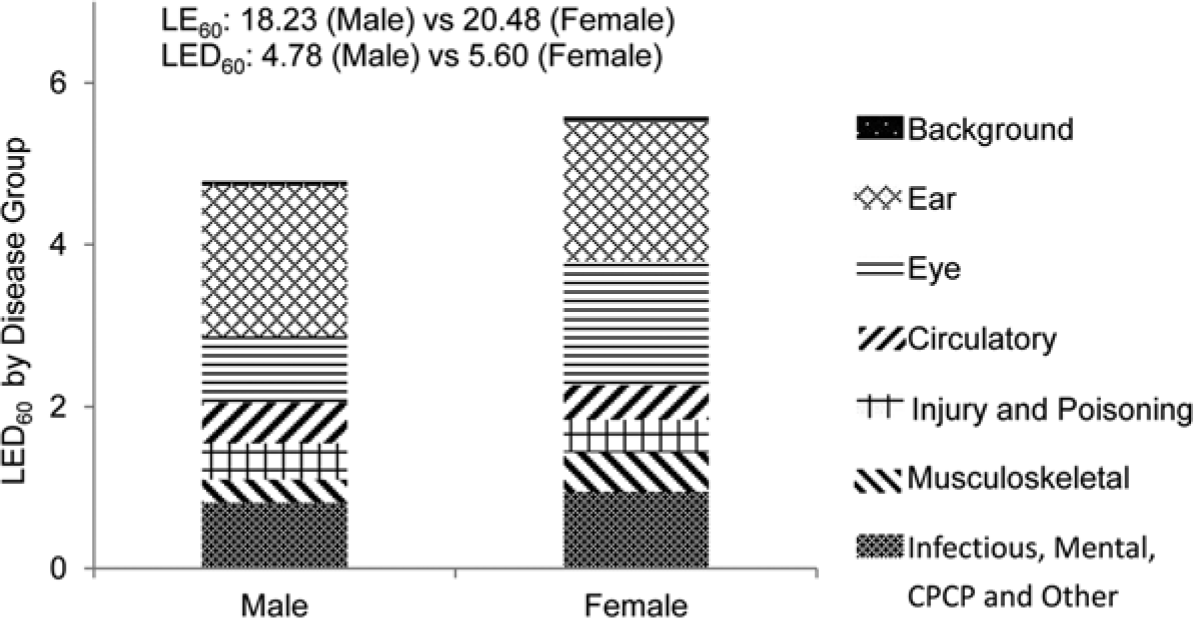
LED at age 60 (LED60) by disease group (years).
At individual disease level, presbycusis was the most significant disabling disease and its influence increased with age (Table 3). About 3% of males aged 60 to 69 were disabled due to presbycusis, or age-related hearing loss, and the percentage increased to 22% among the oldest-old. The five leading individual diseases including presbycusis, cataracts, cerebrovascular diseases, osteoarthritis, and unclassified injury accounted for 64% of disabilities (males: 61%; females: 66%). The distribution of LED by individual disease was similar to that of disability prevalence. For example, of the LED at age 60 (males: 4.78 years; females: 5.60 years), around 65% was caused by the five leading individual diseases (males: 64%; females: 67%; Table 3 and Figure 2).
The Attribution Results of Disability Prevalence by Individual Disease (%) and the LED at Age 60 (LED60) by Individual Disease (Years).
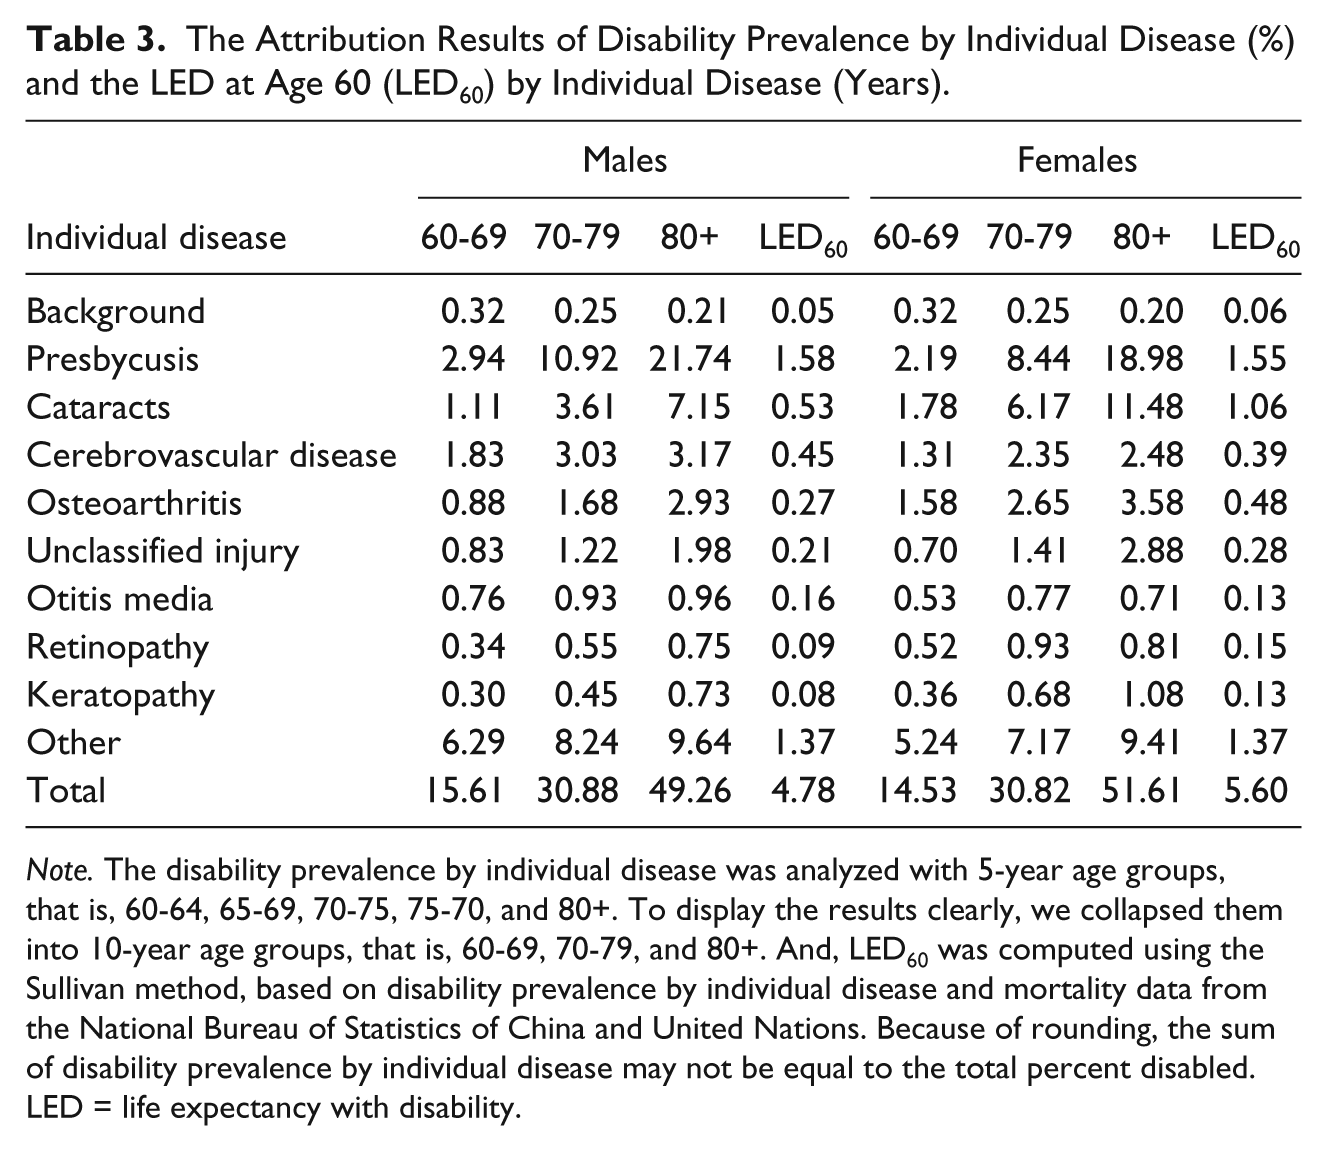
Note. The disability prevalence by individual disease was analyzed with 5-year age groups, that is, 60-64, 65-69, 70-75, 75-70, and 80+. To display the results clearly, we collapsed them into 10-year age groups, that is, 60-69, 70-79, and 80+. And, LED60 was computed using the Sullivan method, based on disability prevalence by individual disease and mortality data from the National Bureau of Statistics of China and United Nations. Because of rounding, the sum of disability prevalence by individual disease may not be equal to the total percent disabled. LED = life expectancy with disability.
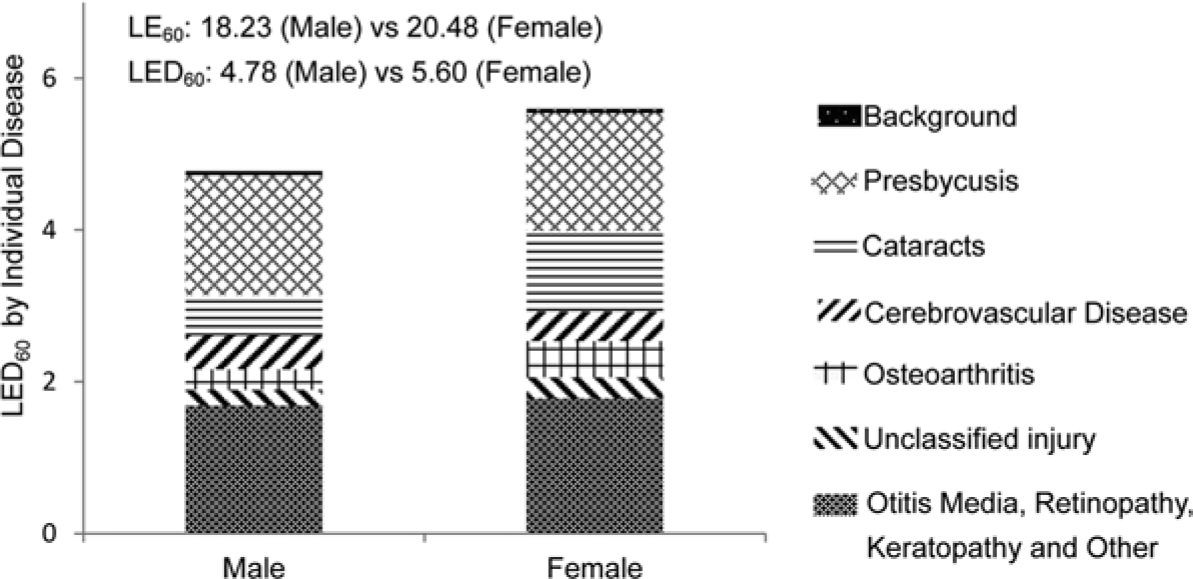
LED at age 60 (LED60) by individual disease (years).
Discussion
To our knowledge, this is the first study that attributes the disability burden among the elderly Chinese population to diseases in terms of both disability prevalence and LED. The results suggest that chronic disease groups including ear, eye, circulatory and musculoskeletal diseases, and injury and poisoning are the predominant contributors to the disability burden among older persons in China. And, five individual diseases including presbycusis, cataracts, cerebrovascular disease, osteoarthritis, and unclassified injury were highlighted for their significant influence on the burden of disability, which provides an evidence support for the priorities of health policy.
Sensory diseases accounted for more than a half of the disability burden among older persons in China. Five out of the eight most important individual diseases, that is, presbycusis, cataracts, otitis media, retinopathy, and keratopathy were sensory organ disorders. Sensory diseases are excluded in some research on other countries, for example, Nusselder and Looman (2004) and Klijs et al. (2011), thus, their importance is sometimes neglected. Our findings, that is, the significant contribution of sensory diseases to disability among elderly people in China, are consistent with evidence (Mathers, 1999; WHO, 2008). The approach to measurement of moderate or severe disability in the GBD study is close to the disability definition in this study (WHO, 2008). According to the GBD study, among the elderly people in low- and middle-income countries, eye diseases (e.g., refractive errors, cataracts, macular degeneration, glaucoma) and ear diseases (e.g., hearing loss) were the most important diseases for moderate or severe disability, much more important than musculoskeletal, circulatory, or mental diseases (WHO, 2008). And, a study on disability among Australian older persons also reported that sensory and nervous diseases were among the most influential disabling diseases (Mathers, 1999). Not all studies come to the same conclusions. For example, Jagger et al. (2007) found that visual and hearing impairments exhibited only minor influence on disability-free life expectancy in later life. These different conclusions may have a number of sources. First, the importance of diseases as causes of mortality and disability are different (Colvez & Blanchet, 1983). Some diseases are fatal but not very disabling, for example, cancer; some are non-fatal but disabling, for example, presbycusis (Mathers, 1999; Nusselder et al., 1996). The multistate life table used by Jagger et al. (2007) analyzes the impact on both disability and mortality; however, the attribution method we used only considers the impact of diseases on disability. Second, different definitions of disability were used across studies. The measurement of disability by Jagger and colleagues (2007) was based on the ability to perform activities of daily living/instrumental activities of daily living (ADL/IADL) functions, whereas this article defined disability primarily as impairments that caused difficulty in functioning (Jagger & Robine, 2011; Zheng et al., 2011). Third, the United Kingdom and China are at different epidemiologic stages (Omran, 2005; Yang et al., 2008), where older persons are probably confronted with different disease patterns of disability (WHO, 2008).
The importance of circulatory and musculoskeletal diseases has been repeatedly reported in previous studies (Jagger et al., 2007; Klijs et al., 2011; Mathers, 1999). And, cerebrovascular diseases and osteoarthritis were among the five most important individual diseases for disability burden in China. Gender differences also existed in the disease contributions to the disability burden. A nationally representative survey conducted in China shows that men are more likely to be hospitalized because of prevalent fatal diseases (e.g., circulatory diseases and cancer), and women were more likely to be hospitalized because of non-fatal chronic diseases (e.g., eye and musculoskeletal diseases); such sex differences are especially obvious among older persons (Center for Health Statistics and Information of China Ministry of Health, 2009). Consistent with these results, this article found musculoskeletal disease was more important among women than men and circulatory diseases had a higher impact among men than women (Klijs et al., 2011; Mathers, 1999).
In line with a previous study by Mathers (1999), injuries and poisoning exhibit significant influences on the disability burden. In addition to the previously observed higher mortality from injury or poisoning among males than females (Jiang et al., 2011; Rebholz et al., 2011), this study indicated a similar difference in disability. For example, the prevalence of disability caused by injury and poisoning among males was almost double that among females at age 60 to 69. The gender disparities may result from the higher possibility of males being injured from, for example, workplace accidents and traffic crashes. An epidemiology survey conducted in Shandong province (China) reported the injury incidence rate among males was 1.5 times as high as that among females (Ma, Guo, Xu, Zhang, & Jia, 2008).
Mental diseases, infectious diseases, and CPCP contributed a relatively small part to the disability of the Chinese elderly population. The contribution of mental diseases to LED60 ranked sixth among all the diseases in this analysis. However, Phillips et al. (2009) reported that the adjusted 1-month prevalence of any mental disorder was 17.5% (95% confidence interval [CI] = [16.6, 18.5]) in an epidemiological survey conducted in four provinces in China. Zheng et al. (2011) also reported a significant increase in the prevalence of mental disability during 1987-2006 in China. Therefore, although its influence on disability is lower than sensory, circulatory, and musculoskeletal diseases, and injuries and poisoning, the importance of mental diseases cannot be overlooked. In addition, previous studies have showed that infectious diseases and CPCP exhibited only a small influence on mortality in contemporary China (Chen, 2008; Yang et al., 2008). Our results showed that these two kinds of diseases also had only a small contribution to disability among older people in China.
One significant difference between this study and others using the same attribution tool (Klijs et al., 2011; Nusselder & Looman, 2004) is the small contribution of the background factors. According to Nusselder and Looman (2004), the background effect represents the disability that cannot be attributed to the diseases included in the current model. The small contribution of the background factors in this article indicates that the disability among Chinese older persons was very well-mapped to diseases or injuries. One important reason for this is that doctors employed by the 2006 China Disability Survey assigned potential causes for disability during the survey (CSSD Office, 2007), whereas other investigations do not use data with direct assignment. This approach resulted in less disability unassigned to causes.
Generally, the disease pattern of the disability burden in this article mirrors the health status in current China. In the past, because of public health intervention, better hygiene and sanitation, improved access to medical care, and elevated social and living standards, the predominant causes of mortality have shifted from infectious diseases and maternal and perinatal conditions to chronic diseases and injury (Yang et al., 2008). Myers, Lamb, and Agree (2003) argued that there is a disability transition accompanying the epidemiologic transition. In later stages of the epidemiologic transition, the underlying causes of disablement change from those attributable to communicable diseases to those resulting from non-communicable diseases (Myers et al., 2003), as indicated in the present study. Moreover, the life course perspective is also useful for understanding the current disease pattern in the disability burden. The subjects we studied were born before the foundation of the People’s Republic of China. Most of them grew up in a disadvantaged environment, which included wars and famines and went through adulthood or middle age in the period of reform, opening-up, and modernization. One sign of the life course influences is that otitis media, a disease mainly occurring among children (Monasta et al., 2012), which is still a significant contributor to disability among the elderly population. Besides, health risk factors that dramatically increase with economic development show their potential impact on disability. For example, the significant contribution of cerebrovascular disease to the disability burden partly results from the dietary changes and the higher prevalence of physical inactivity, smoking, hypertension, and obesity (WHO, 2009; Yang et al., 2008).
This article has the following limitations. First, the 2006 China Disability Survey used a unique approach to measuring disability. Zheng et al. (2011) indicated that the prevalence of disability prevalence would be higher if the survey measured disability in terms of ADL and IADL, instead of the more narrowly defined impairments confirmed by a physician’s examination. Furthermore, as only conditions related to disabilities were recorded, the prevalence of diseases or injuries was also influenced by the definition of disability. The significant difference in measurement makes it impossible to compare results on prevalence between the 2006 China Disability Survey and other surveys. Thus, we cannot assume the results found here would be the same if the definition of disability differed. Second, although the survey employed experienced physicians and respondents provided information to facilitate their judgment of the causes of disability, a potential bias could exist in the distribution of disabling conditions reported. Unfortunately, we do not know the degree or direction of such potential bias. Third, the prevalence of diseases was lower than usual because only disabling conditions were recorded and we had to drop the diseases with lower prevalence in the analyses. Moreover, the survey did not incorporate some potential causes of disability, such as respiratory diseases (Mathers, 1999) and diabetes (Jagger et al., 2003; Jagger et al., 2007; Laditka & Laditka, 2006). This may lead to overestimate the impact of some of the diseases included in the current models. Fourth, the measurement of disability was primarily based on impairment (Jagger & Robine, 2011; Zheng et al., 2011), which limits the comparability with other studies (Jagger et al., 2003; Jagger et al., 2007; Klijs et al., 2011; Laditka & Laditka, 2006; Peres et al., 2008). But, the disability definition in this study is meaningful in China as it is the same as that used for the Chinese disability certificate (China Disabled Persons’ Federation, 2008). Finally, this article used the attribution tool recently developed by Nusselder and colleagues (European Health Expectancy Monitoring Unit, 2010), which has been applied in only a couple of studies at this point (Klijs et al., 2011; Nusselder & Looman, 2004). Despite its advantages (Nusselder & Looman, 2004), this method has some limitations. For example, conditions with very low prevalence cannot be included in the analyses; disability is mapped to single causes and interactions between causes are not taken into account (European Health Expectancy Monitoring Unit, 2010). Additional use of the method in more settings will continue to clarify its strengths and weaknesses.
This study underscores the contributions of chronic diseases and injuries, especially the sensory organ disorders, to the disability burden. Identifying the most disabling individual diseases, that is, presbycusis, cataracts, cerebrovascular diseases, osteoarthritis, and unclassified injury, provides an evidence basis for disability prevention policy. As many of these problems may result from poor treatment early in life or a lack of well-established treatment like cataract surgery or even corrective lenses, these causes of disability may be remediated in coming generations. As these diseases account for around two thirds of disabilities, postponement or elimination of their occurrence is expected to bring substantial reduction in the disability burden among the elderly population in China, which could also lead to an absolute compression of morbidity (Mathers, 2003). Further study should include more common chronic diseases such as hypertension and diabetes to produce a more comprehensive and accurate assessment on disease pattern in the burden of disability.
Footnotes
Appendix
Acknowledgements
The authors would like to thank the members of the USC/UCLA Center on Biodemography and Population Health (CBPH) at the University of Southern California. They provided suggestions on preparing the draft. We especially appreciate the help of Aaron Hagedorn and Aïda Solé-Auró, who gave us valuable advice on revising the manuscript.
Authors’ Note
He Chen and Haochen Wang performed the analyses. He Chen drafted the article. All authors contributed to the development of the key ideas of the article and were involved in revising the manuscript. Xiaoying Zheng managed the study throughout the work. All authors approved the final manuscript.
Declaration of Conflicting Interests
The authors declared no potential conflicts of interest with respect to the research, authorship, and/or publication of this article.
Funding
The authors disclosed receipt of the following financial support for the research, authorship, and/or publication of this article: This study was funded by the National “973” project on Population and Health (2007CB5119001), National Yang Zi Scholar Program, 211 and the 985 project of Peking University (20020903), the Cai Zhai Scholarship of Peking University (CZ201115), and the China Disabled Person’s Federation.