
Abstract
Keywords
Research on gender differences in self-rated health (SRH) among middle-aged and older adults generally shows worse SRH among females (Arber & Ginn, 1993) or a female disadvantage that decreases or disappears at older ages (Case & Paxson, 2005; Gorman & Read, 2006; McCullough & Laurenceau, 2004; Ross & Bird, 1994; Verbrugge, 1985; Walters, McDonough, & Strohschein, 2002). Several studies have shown no gender difference in SRH among older adults (Gold, Malmberg, McClearn, Pedersen, & Berg, 2002; Leinonen, Heikkinen, & Jylha, 1998; Macintyre, Hunt, & Sweeting, 1996; Prus & Gee, 2003). Read and Gorman (2010) suggested that at younger ages, ideals of masculinity result in men being less likely to think they are sick, to seek medical treatment, and to report poor health. At the same time, social circumstances and stressors experienced by females make them feel worse about their health. While most research has documented a female disadvantage that closes with age, a few studies found that males rate their health worse than females (Lahelma, Martikainen, Rahkonen, & Silventoinen, 1999; Lahelma, Arber, Martikainen, Rahkonen, & Silventoinen, 2001; Marks, 1996; Wolinsky et al., 2008). Arber and Cooper (1999) suggested that results which fail to find worse SRH among females provide evidence of a “new paradox”: a lack of gender difference despite higher levels of disability among females. While disability is an important factor linked to SRH (Case & Paxson, 2005), a number of additional factors may explain gender differences.
Although qualitative methods have been used to examine differences in how males and females understand their own health (Benyamini, Blumstein, Lusky, & Modan, 2003; Idler, Hudson, & Leventhal, 1999), these methods do not always assess how social location contributes to SRH. Because there are gender differences in these factors, a complete understanding of gender differences in SRH should take into account factors beyond what people perceive as important when rating their own health. Furthermore, as Macintyre and colleagues (1996) recommended, it is necessary to periodically re-examine gender differences in health. This is especially important as new methodologies are available to better understand the complexity of gender differences in SRH. We build on past research in several important ways. First, we examined both the differential exposure and the differential vulnerability explanations of gender differences in health. Although studies have done this (Chen, Chang, & Yang, 2008; Denton, Prus, & Walters, 2004; Walters et al., 2002), they have not focused on the SRH of older adults. Focusing on late middle-aged and older adults is important given the likelihood of role transitions and changes in health.
Second, we used data that span 12 years from the Health and Retirement Study (HRS) to estimate trajectories of SRH using latent growth curve models. As Wolinsky and colleagues (2008) noted, few studies have been done to understand SRH changes over time. Most studies that have specifically examined gender differences in SRH use cross-sectional or pooled data (Arber & Cooper, 1999; Arber & Ginn, 1993; Case & Paxson, 2005; Gold et al., 2002; Gorman & Read, 2006; Lahelma, Arber, Martikainen, Rahkonen, & Silventoinen, 2001; Molarius & Janson, 2002; Prus & Gee, 2003; Ross & Bird, 1994; Walters et al., 2002). Not only does longitudinal analysis permit us to differentiate baseline SRH from change in SRH over time, but we can also differentiate the predictors of baseline SRH from the predictors of change in SRH.
Finally, this research included a comprehensive set of covariates, including marital and employment status transitions, onset of chronic conditions, and physical health factors. Some previous studies excluded important health conditions or included only a total count of health conditions (Arber & Cooper, 1999; Gorman & Read, 2006; Prus & Gee, 2003) while others focused exclusively on physical health factors (Case & Paxson, 2005; Gold et al., 2002; Hoeymans, Neskins, Kromhout, & van den Bos, 1999; Molarius & Janson, 2002) not taking into account structural factors.
Explanations for Gender Differences in Health
Two predominant explanations have been used to understand gender differences in health (Chen et al., 2008; Denton et al., 2004; Read & Gorman, 2010). According to the differential exposure explanation, gender differences in health exist because males and females have differential risks of illness and injury due to differential work and leisure activities, lifestyle and health habits, stress and other psychosocial factors, and other social surroundings (McDonough & Walters, 2001; Rieker & Bird, 2000). Gender inequities in health result from a stratification system that differentially allots opportunities to men and women. These opportunities and roles affect exposure to health risks and their access to resources. In contrast, the differential vulnerability explanation suggests that the responses to lifestyles, roles, and activities differ for men and women (Rieker & Bird, 2000; Walters et al., 2002). The social and cultural beliefs regarding roles and activities vary, so that occupational factors have traditionally been more important for men, whereas family and home factors have been more important for women (Matthews, Manor, & Power, 1999). Whereas the differential exposure explanation examines gender differences in the predictors of health, the differential vulnerability explanation examines responses to the predictors of health for males and females.
When examining how differential exposure accounts for gender differences in SRH among a Taiwanese sample, Chen and colleagues (2008) found the gender gap cannot be explained by differences in socioeconomic resources, health behaviors, or psychosocial or variables but other research shows the relationship can be explained by these factors (Denton et al., 2004; Read & Gorman, 2006). Several studies emphasized the importance of social structural factors in mediating the relationship between gender and SRH (Gorman & Read, 2006; Lahelma et al., 2001; Ross & Bird, 1994). Other research emphasized the mediating impact of health factors such as disability, functional health, and chronic conditions on the relationship between gender and SRH (Case & Paxson, 2005; Jylha, Guralnik, Ferrucci, Jokela, & Heikkinen, 1998).
When examining SRH separately for males and females, Denton and Walters (1999) found that social structural factors such as income, education, and labor force activity were more important predictors for females, whereas behavioral factors such as smoking and alcohol consumption were more important for males. However, there is often not a clear distinction in the importance of sets of factors between males and females. Prus and Gee (2003) found that education was a stronger predictor of SRH for males and income was a stronger predictor of SRH for females, while Luo and Waite (2005) found the opposite. The results regarding social support have also been mixed with results showing that social support is positively related to SRH for females only (Prus & Gee, 2003), significant for males and females but more so for females (Denton & Walters, 1999), and significant for males only (Ferlander & Makinen, 2009).
The methods used to study gender differences in SRH and the findings from these studies have varied widely. Better methods are available that would contribute to a comprehensive understanding of gender differences in SRH among middle-aged and older adults. Using these methods, we examined the following questions: (a) How do the trajectories of SRH vary by gender among middle-aged and older adults? (b) How do gender differences in social structural, behavioral, and health status factors mediate the relationship between gender and SRH? (c) and Do social structural, behavioral, and health status factors have a differential impact on SRH among males and females?
Method
The data used in this analysis came from the RAND version of the HRS (RAND, 2007). The HRS is a U.S. nationally representative panel study sponsored by the National Institute on Aging and coordinated by the Institute for Survey Research at the University of Michigan. The original wave of the data was collected in 1992 and sampled 12,652 people in 7,608 households born from 1931 to 1941 and their spouses. Data were collected throughout the 48 contiguous states using a multistage area probability sampling design and include an oversample of Blacks, Hispanics, and residents of Florida. Face-to-face, in-home interviews were conducted at baseline and follow-up telephone interviews occurred every second year with proxy exit-interviews after death. The initial sample did not cover the institutionalized population, but those present in the first wave that enter institutions are followed (n = 213). This analysis included respondents and spouses only if they were age-eligible for the sample (born from 1931 to 1941). Excluding those for whom core interviews were not obtained (n = 381) and those who were not age-eligible for the sample (n = 2,924) resulted in a sample size of 9,749.
Measures
SRH is more comprehensive than other measures of health, and combines acute, chronic, fatal, and non-fatal disease with general feelings of physical and mental health. SRH is a reliable and valid measure of health status and is highly correlated with chronic conditions, disability, and mortality (Benyamini & Idler, 1999; Idler & Benyamini, 1997). For this analysis, SRH came from a question in which respondents were asked to rate their own health. Values ranged from 1 for poor health to 5 for excellent health. Although many studies collapse SRH into a dichotomous measure (Arber & Cooper, 1999; Chen et al., 2008; Macintyre et al., 1996; Matthews et al., 1999), Manor, Matthews, and Power (2000) found that doing so is not justified and results in a loss of information about changes in SRH. We treated SRH as a continuous measure similar to other research on SRH (Bird & Fremont, 1991; Chen et al., 2008; Denton et al., 2004; Denton & Walters, 1999; Gorman & Read, 2006; McCullough & Laurenceau, 2004; McDonough & Walters, 2001; Prus & Gee, 2003; Ross & Bird, 1994; Sacker, Clarke, Wiggins, & Bartley, 2005).
Social structural factors
Gender was coded 0 for males and 1 for females . Age at baseline was a continuous variable. Race and ethnicity were dummy variables with non-Hispanic White (reference group), non-Hispanic Black, Hispanic, and other non-Hispanic as categories. Marital status was coded as a dummy variable with the following four categories: married (reference group), separated or divorced, widowed, and partnered or never married. Employment status indicated whether the respondent was currently working full-time (reference group), working part-time, or not working (unemployed, retired, disabled, or not in the labor force). Because changes in marital status and employment status have been linked to health (Williams & Umberson, 2004), variables were coded to indicate if the respondent experienced a change in marital status or employment status between Waves 1 and 7. Occupation indicated the occupation which the respondent held the longest in his or her lifetime and was coded into the following three categories: managerial, professional, or technical support (reference group); sales, clerical, or service; and mechanic, operator, or agricultural. It was taken from the respondent’s initial interview, or if missing, from the next wave for which information was available.
Education was coded as a continuous variable indicating number of years of school completed. Household income was total household income during the last calendar year and was logged to correct for the skewed distribution. Because change in income is important in understanding variation in health trajectories (Kim & Durden, 2007), household income was included as a time-varying covariate. Income measured at each wave up until Wave 6 was used to create latent variables for the intercept and slope. The income intercept represented income at Wave 1 and was used to predict the intercept and slope of SRH, whereas the income slope represented change in income over time and was used to predict the slope. Net wealth was net household assets minus debt and was also logged. Household wealth was transformed by taking the absolute value of the negative values and obtaining the natural log of those values. These values were then reassigned as negative values and combined with the natural log of the positive values to produce both negative and positive natural logged values.
This analysis included two indicators of social support from Wave 3 (1998). Although questions on social support were asked before 1998, the questions were only asked of the primary respondent. The first measure of social support was a variable indicating presence of relatives or friends in the neighborhood or facility where the respondent lives. The second measure of social support indicated how often in the past year the respondent had contact (in person, by phone, or mail) with each child, with the respondent’s parents, and how often they get together with neighbors. It included five categories with 0 indicating no contact (reference group) and the other categories based on quartiles of the distribution.
Behavioral health factors
Smoking behavior was coded into never smoked (reference group), former smoker, and current smoker. Alcohol consumption indicated if the respondent did not drink (reference group), drank less than three drinks per day on average, or drank three or more drinks per day on average when they drink. Body mass index (BMI) was measured as weight/height2 and categorized as normal weight (BMI of 18.5-24.4, reference group), underweight (<18.5), overweight (24.5-29.4), or obese (>29.4). Physical activity indicated if a respondent participated in vigorous activity (sports, heavy housework, or physical labor) 3 or more times per week.
Health status factors
Because males and females differ in the types of conditions and illnesses they experience, using an additive indicator of conditions the respondent has been diagnosed with masks the impact specific conditions have on SRH. Thus, the following conditions were included separately: hypertension; diabetes or high blood sugar; cancer or malignant tumor of any kind except skin cancer; chronic lung disease except asthma; heart attack, coronary heart disease, angina, congestive heart failure, or other heart problems; stroke or transient ischemic attack (TIA); and arthritis or rheumatism. There was also a variable indicating whether the respondent experienced the onset of any of these health conditions since the previous interview.
To assess childhood health, the respondents were asked to describe their health while growing up, from birth to age 16. It was coded 0 for poor or fair and 1 for good, very good, or excellent childhood health. To assess functional limitations, respondents were asked if they had difficulty with the following tasks: walking several blocks, walking one block, sitting for 2 hr, getting up from a chair after sitting for long periods, climbing several flights of stairs without resting, climbing one flight of stairs without resting, lifting or carrying more than 10 lbs, stooping, kneeling, or crouching, reaching arms above shoulder level, pushing or pulling large objects, and picking up a dime from the table. Answers were coded 0 for no limitation and 1 for limitation and were combined into an additive index with values ranging from 0 to 11.
Depressive symptoms were measured with a shortened version of the Center for Epidemiological Studies Depression Scale (CES-D). Respondents were asked if the following were true for much of the time in the week prior to the interview: they felt depressed, felt that everything he or she did was an effort, sleep was restless, could not get going, felt lonely, felt sad, enjoyed life, and was happy. The CES-D score was the sum of the responses after reversing coding the two positive items. Accordingly, the measure ranged from 0 to 8 with the higher score indicating more negative feelings in the past week. Self-rated eyesight was coded from 1 to 6, with 1 indicating the respondent is legally blind, 2 indicating poor eyesight, and 6 indicating excellent eyesight. Self-rated hearing is coded from 1 to 5, with 1 indicating poor hearing and 5 indicating excellent hearing.
SRH was taken from Waves 2 to 7 (1994-2004). All other predictors came from Wave 1 (1992) with the exception of functional limitations and depressive symptoms (1994), social support (1996), childhood health (1998), and change in employment status, change in marital status, onset of health conditions, and income (all measured from Waves 1 to 7).
Analysis
Growth curve analysis was used to estimate trajectories of SRH by using data from more than two time points to model change over time (Duncan, Duncan, Strycker, Li, & Alpert, 1999). Parameters were estimated for the average initial level (intercept) and average rate of change (slope), as well as for variances. The variance of the intercept identifies variability in the latent intercept across individuals, whereas the variance of the slope identifies variability in the latent slope across individuals. The covariance measures the degree of dependence between initial levels of SRH and change in SRH over time. Aggregating the effects of the covariates across the intercept and slope masks the details of how the covariates actually relate to SRH. Therefore, an important part of the analysis differentiates the predictors of initial status from the predictors of change. Analysis was done in Mplus (Muthén & Muthén, 2010). Person-level weights and the stratification variable were used to adjust for the complex sampling design. Estimation was accomplished using Full Information Maximum Likelihood (MLR estimator), which deals with missing data in the outcome by using all information that is available for each case. Because initial SRH can affect change in SRH differently for males and females, we controlled for differences in the intercept of SRH.
We first examined the unconditional growth curves of SRH. We then tested the differential exposure hypothesis by examining the mediating effects of covariates on the relationship between gender and SRH. Following von Soest and Hagtvet (2011), we proceeded with the mediation analysis by first examining whether gender was related to SRH (c′). We then tested to see if gender was related to the mediating variables (a). Next, we tested if the mediating variables were related to SRH (b) and examined how the relationship between gender and SRH changed when the mediators were included in the model. According to the mediation model, the total effect (c) between gender and SRH can be decomposed into the direct effect of gender on SRH (c′) and the indirect effect through the mediating variables. This mediating effect (c − c′) is equal to the product of a × b. We obtained an estimate of the indirect effect which showed if each covariate functioned as a mediator. Mediation occurs when the relationship between gender and SRH disappears or is reduced. Model 1 showed the relationship between gender and SRH and Models 2 through 4 included the sets of mediating variables. After the mediation analysis, we examined differential vulnerability with multiple group models, which allowed us to examine the relationship between the covariates and SRH for males and females separately. In both analyses, the intercept can be interpreted as the average SRH at baseline and the slope can be interpreted as the rate of change in SRH over time. We finished the analysis by examining sample mortality.
Results
Descriptive statistics are presented in Table 1. The mean of SRH declines for both males and females, but there is not a significant gender difference in average SRH at baseline. However, analysis which deciphers average initial SRH from rate of change may reveal gender differences that are not apparent when restricting gender comparisons to within each wave.
Weighted Descriptive Statistics by Gender (HRS 1992-2004).
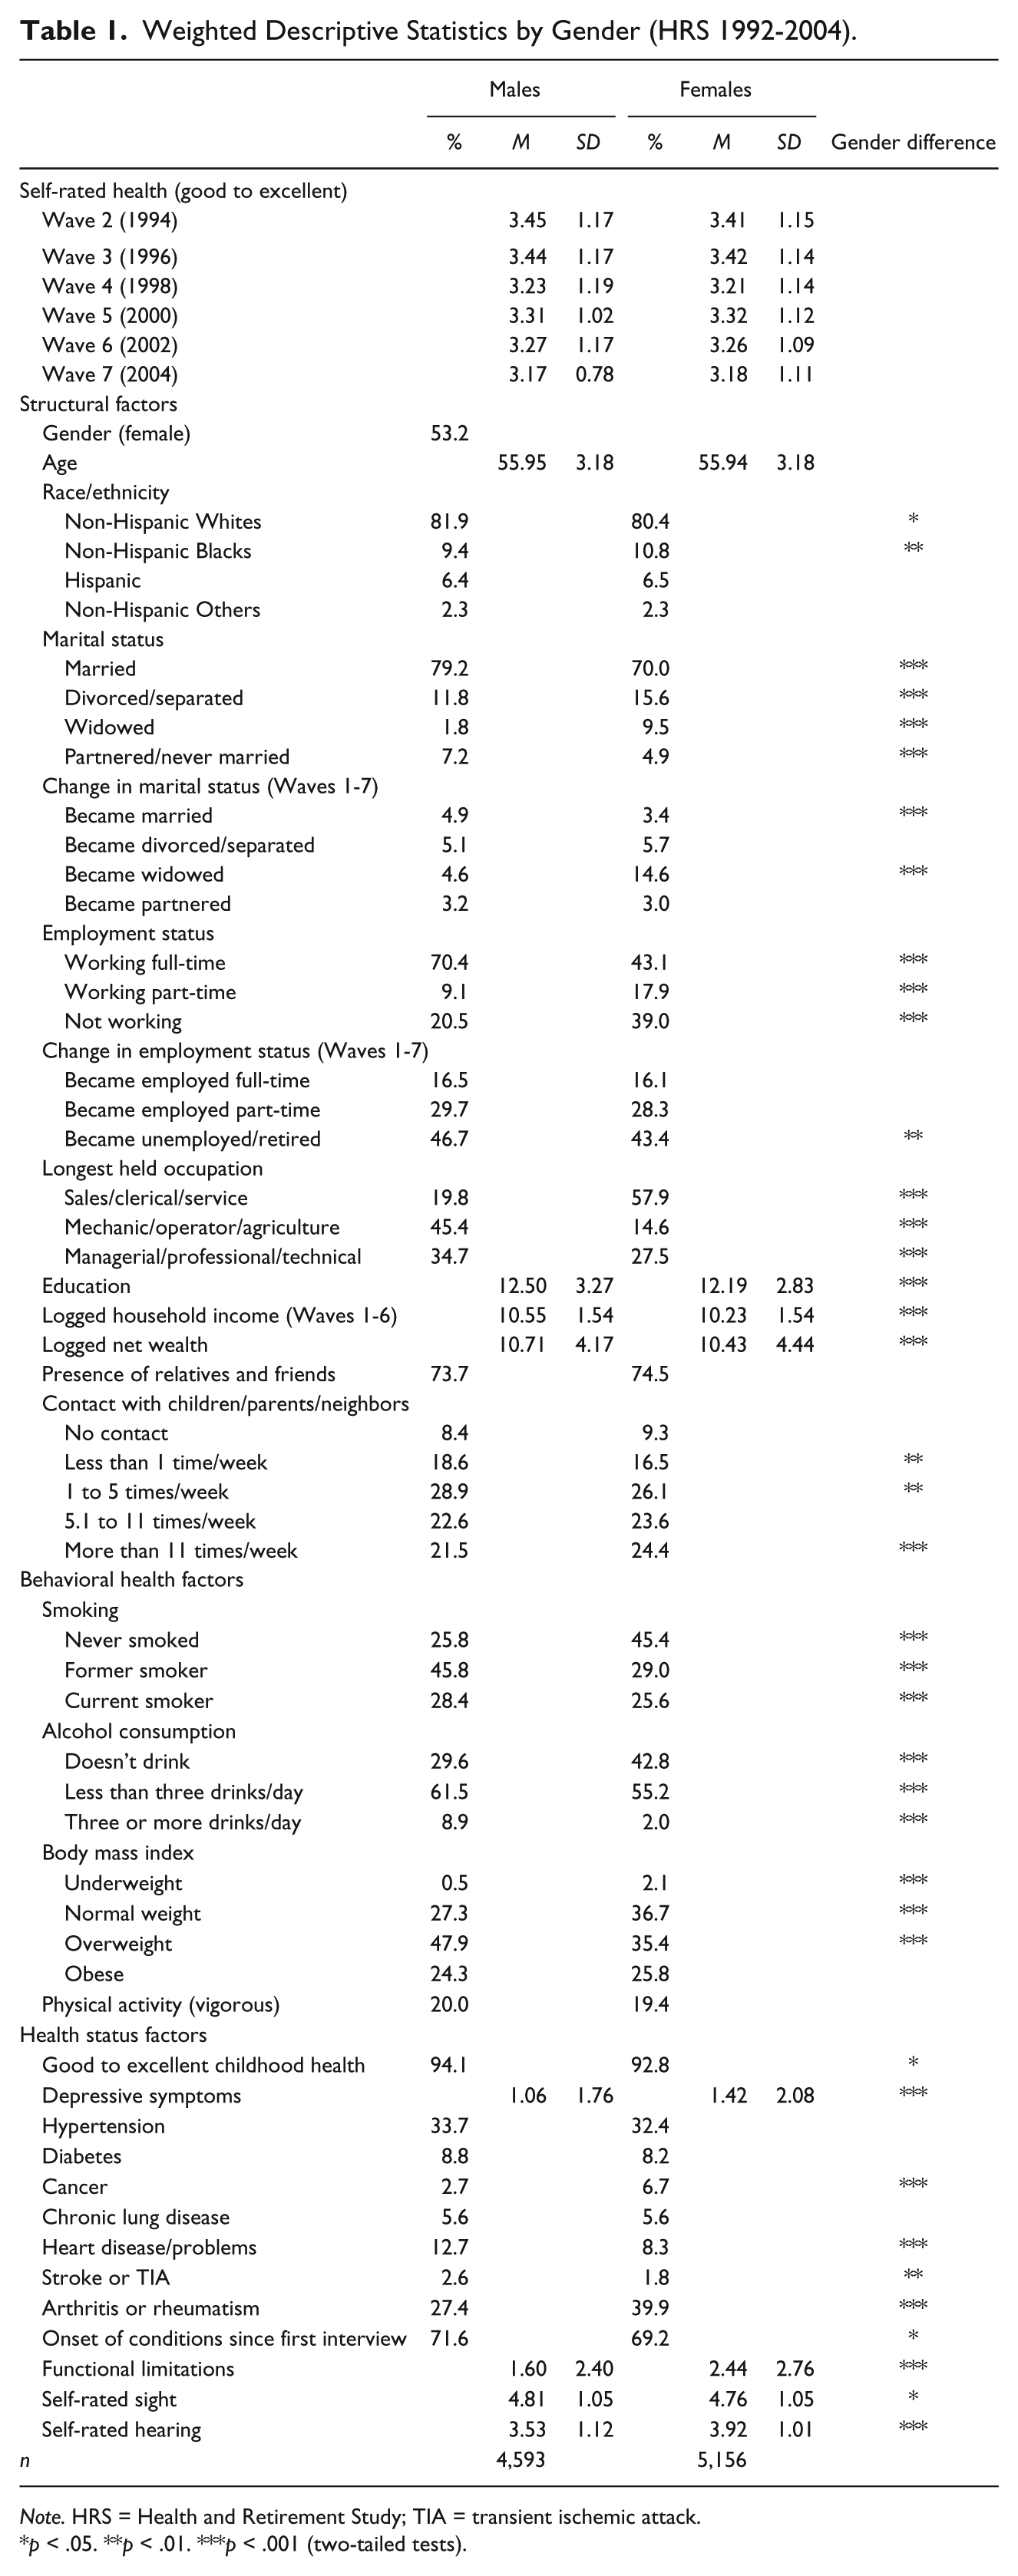
Note. HRS = Health and Retirement Study; TIA = transient ischemic attack.
p < .05. **p < .01. ***p < .001 (two-tailed tests).
The Gender Gap in SRH: Differential Exposure
Results from unconditional growth curve models indicate that the average initial SRH is between good and very good (Mi = 3.423; p < .001). Average SRH declines over time (Ms = −0.068; p < .001). We also find significant variation in SRH at baseline (var i = .967; p < .001) and significant variation in the rate of change over time (var s = .015; p < .001). The slope and intercept are negatively correlated (cov = −.037, p < .001) indicating those with better SRH at baseline have a steeper decline in SRH over time. This may occur because those with worse SRH have less room for decline compared with those with better SRH at baseline.
Table 2 presents the results from the mediation analysis. When only gender is included as a predictor (Model 1), there is no significant gender difference in SRH at baseline, but there is a significant gender difference in the slope. Females have a positive change in SRH with logged SRH declining faster for males. Although there is no gender difference in SRH at baseline, males rate their health worse compared with females over time. When adjusting for the social structural factors (Model 2), the gender difference in the rate of change is diminished while a gender difference in baseline SRH appears. Females have better SRH at baseline compared with males and have a slower decline in SRH over time. There is a negative relationship between transition to not working and change in SRH over time, indicating that those who experience transitions to retirement or unemployment have a steeper decline in SRH. The indirect effect is statistically significant, meaning gender differences in the transition to not working partially account for the gender difference in the rate of change in SRH. Interestingly, those who experience widowhood have a positive change in SRH compared with those who have not. Perhaps those who have experienced widowhood rate their health in comparison with their spouses who have recently died, and thus they perceive their own health as better than those who have not recently been widowed. However, the indirect effect for transition to widowhood is not significant, indicating that transition to widowhood does not act as a mediator. The parameters for the indirect effects also show significant suppressor effects. The significant indirect effects for working part-time, income, education, and wealth indicate that these factors contribute to an increase in gender differences in SRH at baseline. Females are more likely to not be employed, which is negatively related to SRH, whereas males have higher income, wealth, and education, which are positively related to SRH at baseline. Thus, gender differences in employment status and socioeconomic status prevent females from having better SRH at baseline at the same time that differences in transitions to not working account for the steeper decline in SRH among males.
Parameter Estimates for Growth Curve Models of Self-Rated Health.
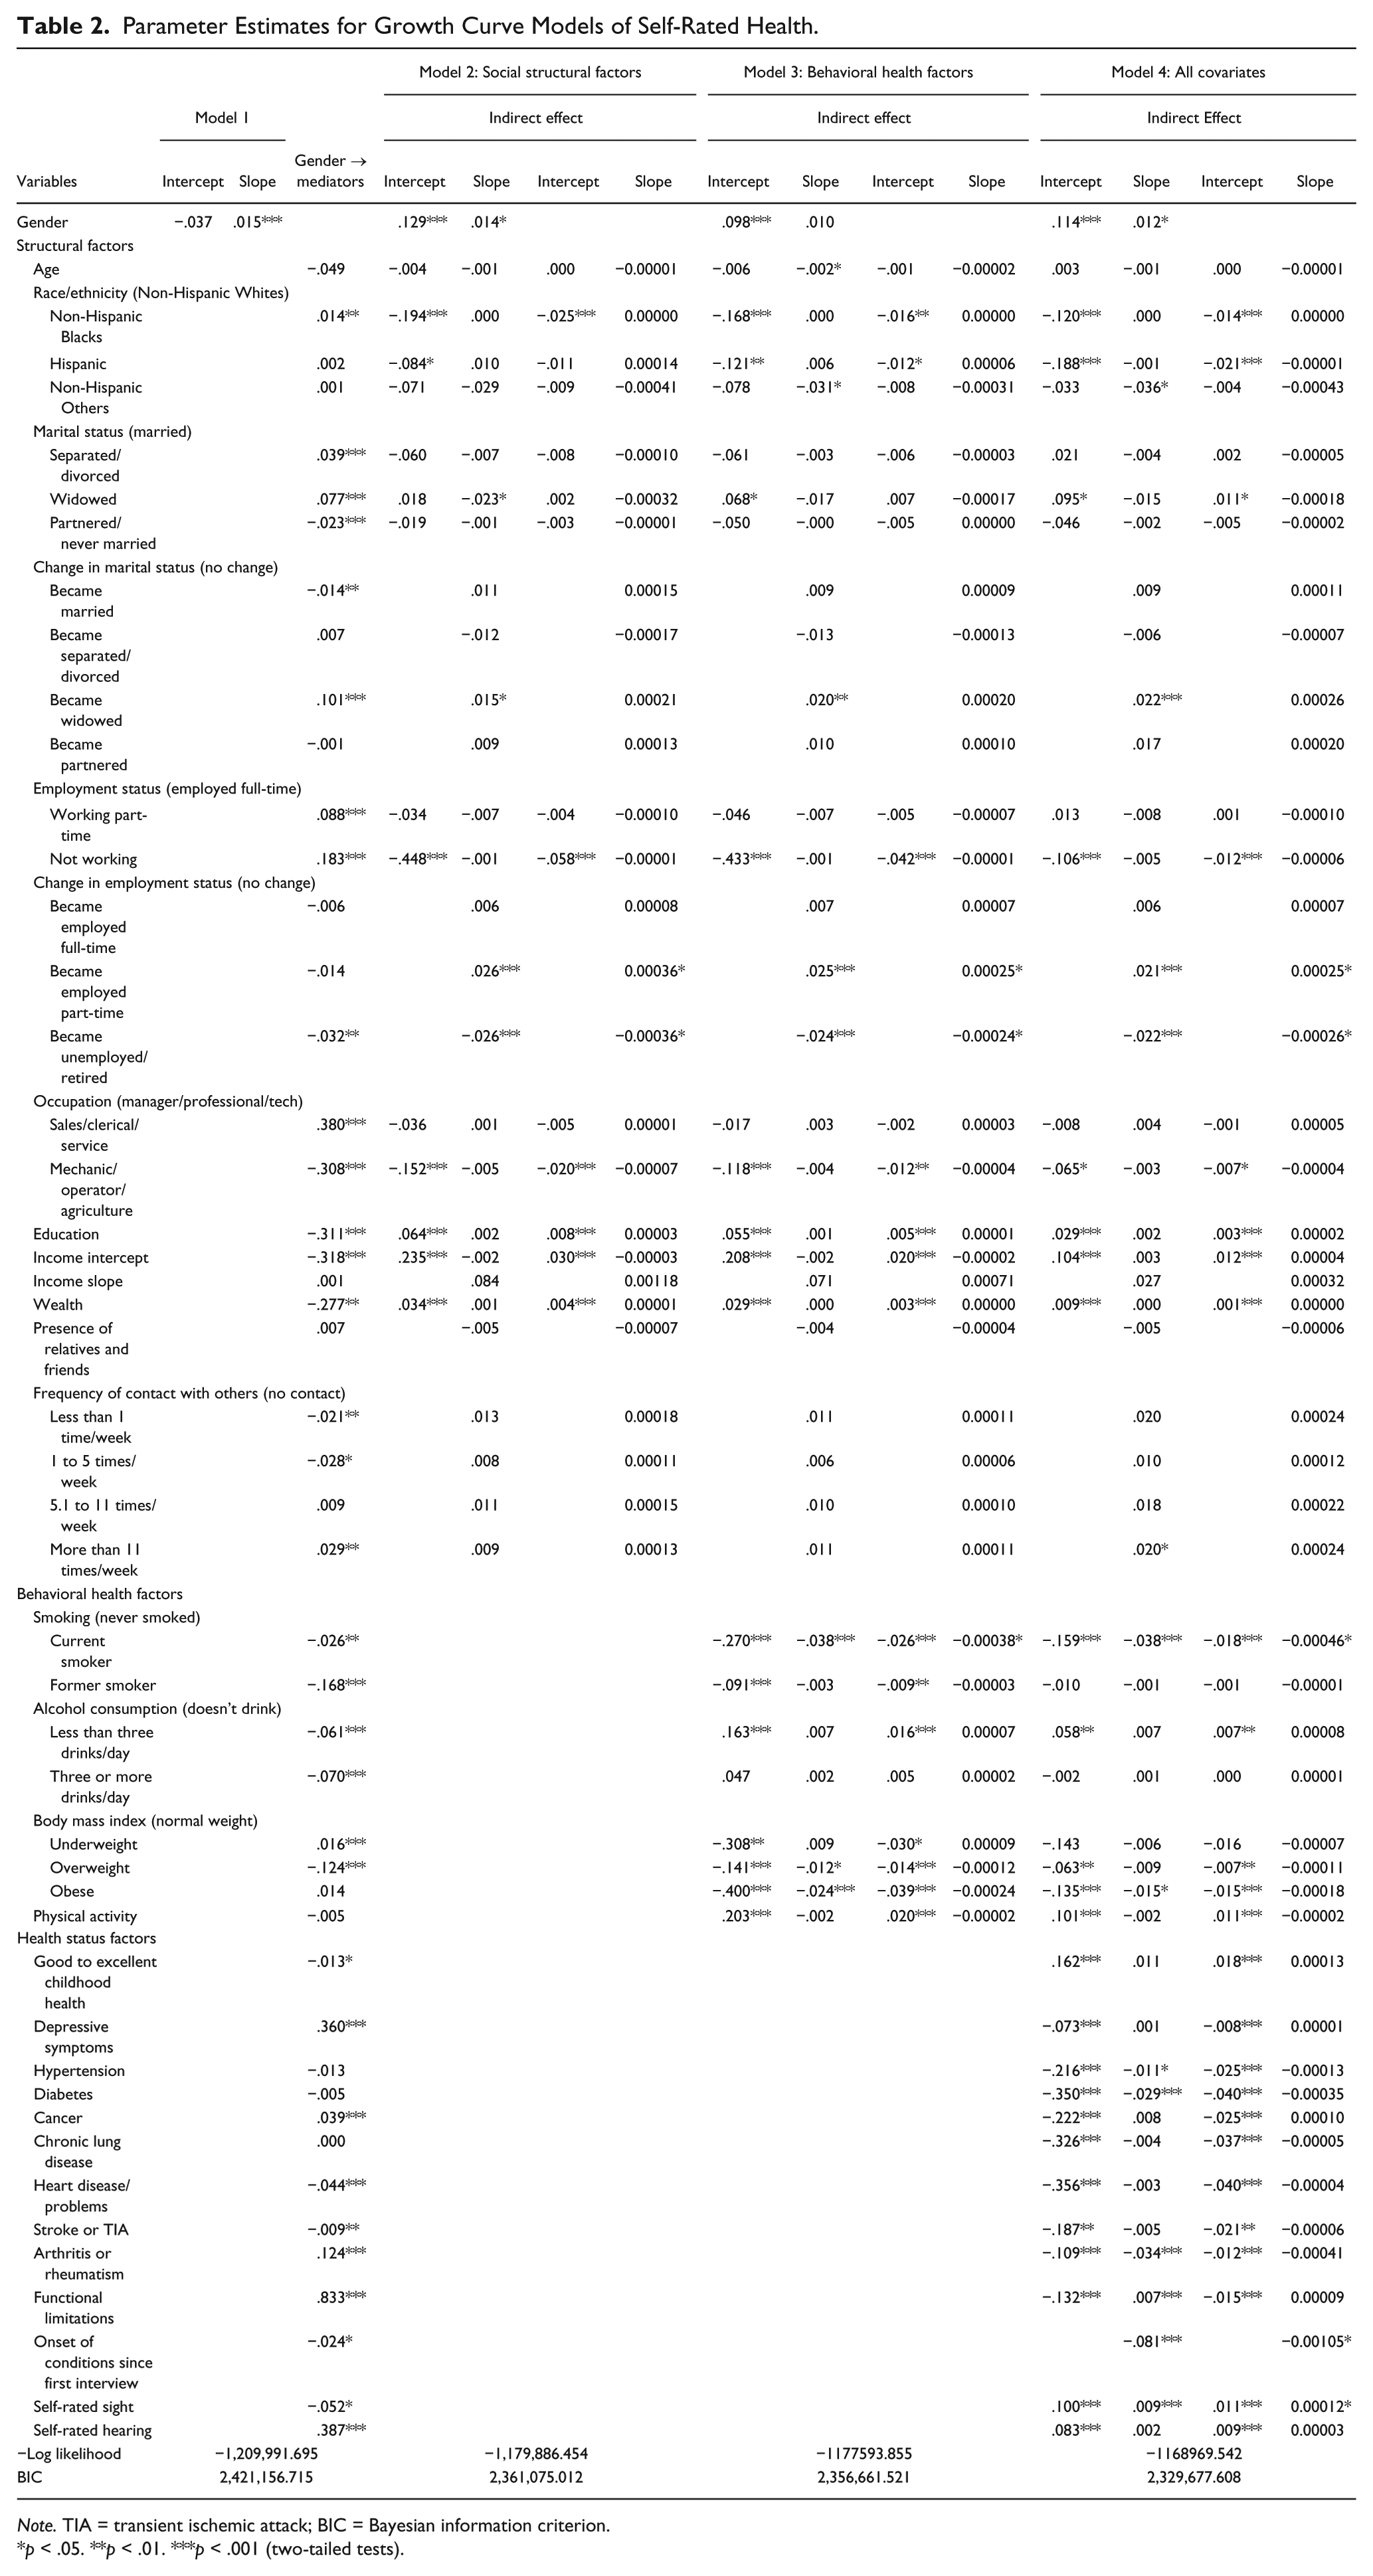
Note. TIA = transient ischemic attack; BIC = Bayesian information criterion.
p < .05. **p < .01. ***p < .001 (two-tailed tests).
Analysis examining the mediating effects of the behavioral health factors is presented in Model 3. Females have better SRH at baseline, but the gender difference in the rate of change in SRH disappears indicating mediation between gender and the slope of SRH. Current smoking status as well as transition to not working as in Model 2 also function as mediators. Overweight BMI, which is more common among males, is negatively related to the change in SRH over time but the indirect effect is not significant. Behavioral health factors that work as suppressors of gender differences in SRH at baseline include underweight BMI and moderate drinking, in addition to those factors that were significant in Model 2. Underweight BMI, which is more common among females, is negatively related to SRH at baseline, so if males and females were similarly underweight, females would have better SRH at baseline. Moreover, they would have better SRH at baseline if they consumed less than three alcoholic drinks per day as males do.
Although the relationship between gender and change in SRH disappears when accounting for differences in smoking and employment transitions in Model 3, the female advantage in the slope reappears when including the health status factors in Model 4. Specifically, arthritis or rheumatism act as suppressors, so that females have a positive change in SRH over time despite the mediating effects of employment transitions, smoking status, and the onset of health conditions, which are negatively related to changes in SRH. While overweight BMI is no longer related to changes in SRH, frequency of contact with children, parents, or neighbors becomes significantly related to changes in SRH when adjusting for health status factors. Those who have no contact with others have a steeper decline in SRH compared with those with frequent contact with others, although it does not function as a mediator.
Health factors that function to suppress the relationship between gender and SRH at baseline include childhood health, depressive symptoms, cancer, arthritis or rheumatism, functional limitations, or eyesight. Males are more likely to report good childhood health and better eyesight, which are positively related to SRH at baseline, whereas females are more likely to report depressive symptoms, cancer, arthritis or rheumatism, and functional limitations, which are negatively related to SRH at baseline. While the indirect effects of not working, education, income, wealth, and moderate drinking continue to be significant, underweight BMI is no longer related to SRH at baseline when controlling for the other health factors.
Additional factors related to SRH at baseline and for which there are significant indirect effects include employment as a mechanic, operator, or in an agricultural occupation, current smoking status, overweight BMI, heart disease, stroke, and hearing. It would be plausible that men would report better health when adjusting for differences in these factors. Results do not demonstrate this, instead showing better SRH among females when controlling for differences in social structural, behavioral, and health status factors.
In summary, gender differences in transitions to not working, smoking status, and onset of health conditions explain why males have a faster decline in SRH. However, were it not for gender differences in employment status, education, income, wealth, alcohol consumption, childhood health, depressive symptoms, cancer, arthritis/rheumatism, functional limitations, and eyesight females would report better SRH at baseline and over time.
The gender gap in SRH: Differential vulnerability
Results from unconditional multiple group models indicate that average baseline SRH is 3.437 (p < .000) for males and 3.402 (p < .000) for females. The rate of change in SRH among males is −.076 (p < .000), while among females it is −.060 (p < .000). While analysis testing gender difference in the intercepts and means indicates no significant gender difference at baseline, there is a significant gender difference in the rate of change over time. This confirms the gender difference shown in the unconditional models above.
Table 3 presents the parameter estimates from the multiple group analysis examining the differential vulnerability hypothesis. Because there are very few cases of underweight males, it is not possible to include underweight BMI in the multiple group models. Highlighted coefficients in Table 3 represent significant differences across gender. While there are several covariates that are significantly related to SRH among males and females, only age, being Hispanic, smoking, overweight BMI, physical activity, and eyesight differentially affect males and females. Interestingly, age is positively related to SRH at baseline among females. Smoking is negatively related to SRH at baseline for males and females, with males who currently smoke having worse SRH than females who currently smoke. Overweight BMI is negatively related to SRH at baseline among females only and vigorous physical activity is positively related to SRH at baseline among males only. While eyesight is positively related to SRH for males and females, the relationship is stronger among males than females.
Parameter Estimates for Growth Curve Models of SRH for Males and Females.
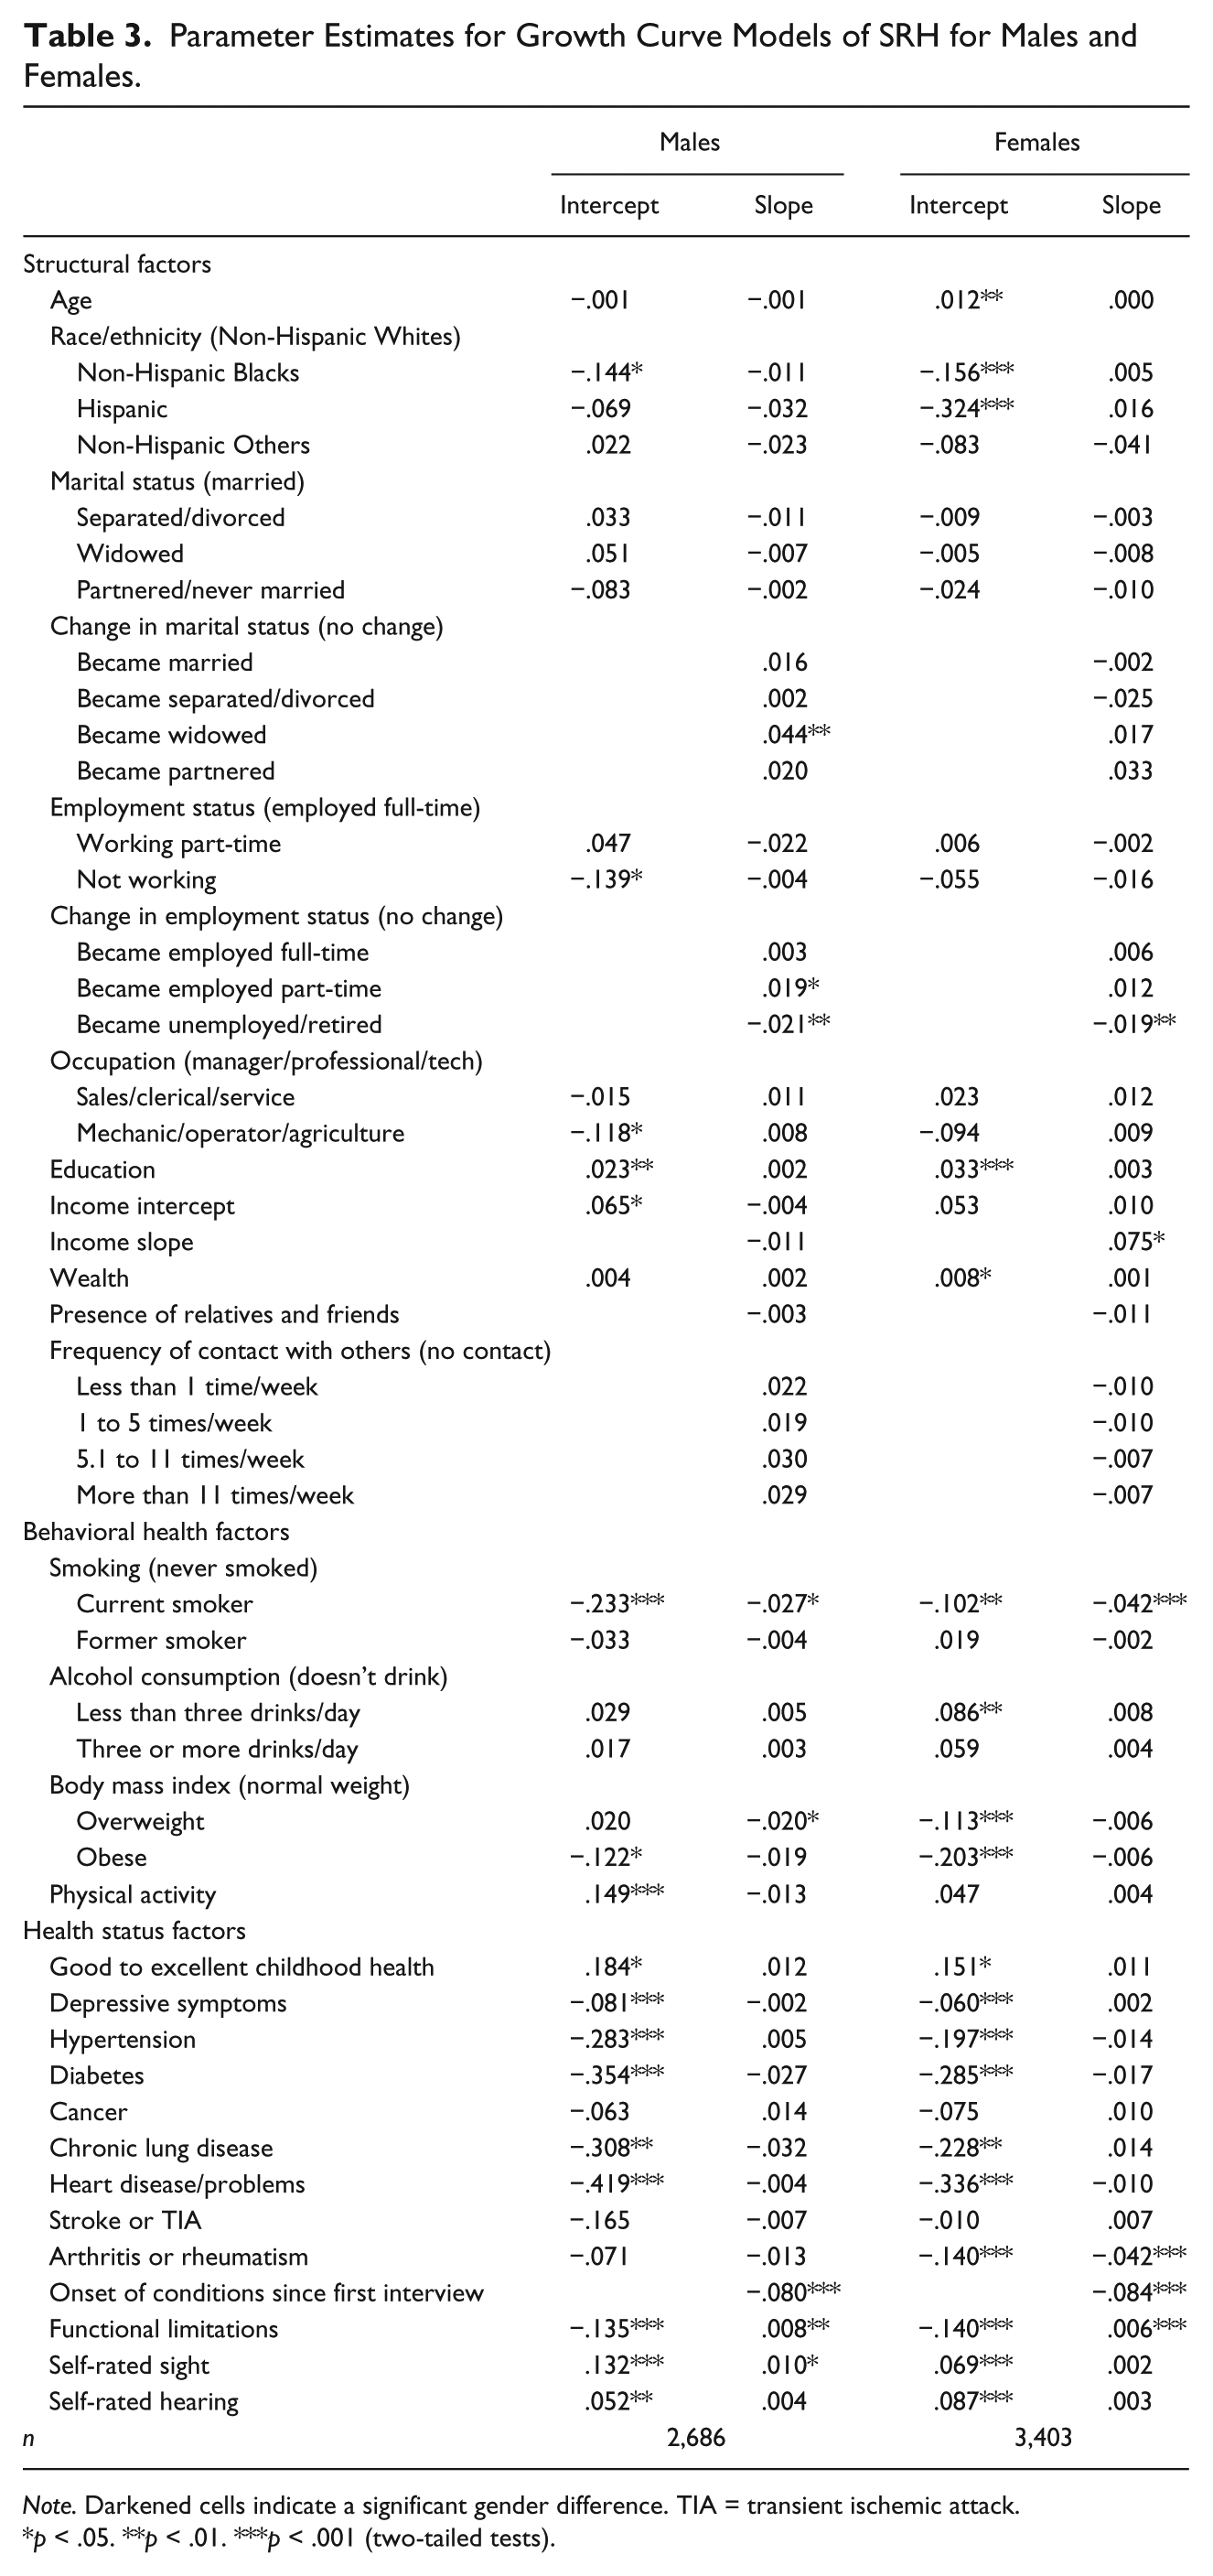
Note. Darkened cells indicate a significant gender difference. TIA = transient ischemic attack.
p < .05. **p < .01. ***p < .001 (two-tailed tests).
Among the covariates which differentially affect males and females, only current smoking status and eyesight are significant in the mediating models. Current smoking status functions as a mediator partially accounting for the steeper decline in SRH among males, while eyesight functions as a suppressor preventing females from having better SRH at baseline and over time. Because there are few statistically significant gender differences in these models, there is little support for the differential vulnerability explanation. These models do, however, provide evidence that differences in eyesight and smoking status among males and females and differences in the impact of eyesight and smoking are important predictors of gender differences in SRH.
Sample attrition
It is well established that data loss due to attrition or death is a problem in longitudinal analysis. Analysis can show how those who participated in all waves of the data differed from those who did not. First, when comparing respondents with non-respondents, both alive and dead, results (not shown) revealed significant differences in SRH, with non-respondents rating their health worse at each wave for which they participated. However, similar to respondents, there was not a significant gender difference in SRH among living non-respondents or dead non-respondents. Next, a binary outcome variable measure was created by assigning a 0 to those who participated in all waves and a 1 to participants who dropped out at any wave. Using growth curve models, the binary variable was regressed on the intercept and slope of SRH in unconditional models and models with all covariates. Findings suggest that compared with those respondents who participated in all waves, those who were lost to follow-up had significantly lower SRH at baseline and a significantly steeper decline in SRH over time. Results were the same when examining the differences for males and females separately in multiple group models. Analysis with all covariates revealed that the differences in SRH at baseline and SRH over time remain among non-respondents compared with respondents. When comparing the analysis with the mediating models, the relationship between gender and SRH remained, although the indirect effect of eyesight on the slope of SRH was no longer significant. Our analysis likely overestimates SRH because those respondents who participated in all waves of the data have better SRH than those lost to attrition or death, and because males have higher mortality during follow-up, we may underestimate the gender difference in SRH.
Discussion
Most research conducted in the last decade on gender differences in SRH among older adults found that females report worse SRH compared with males or that the female disadvantage is reduced or disappears at older ages. Our results provide no evidence of worse SRH among females. In fact, there is evidence of a female advantage with the rate of change in SRH declining faster for males. Initially, this seems to provide evidence of a paradox; females have better SRH compared with males despite higher levels of other health conditions and limitations (Arber & Cooper, 1999). However, what seems like a paradox seems less so when you consider males are more likely to transition to unemployment or retirement, smoke, and experience the onset of chronic conditions as they age. In addition to a female advantage in the rate of change in SRH over time, our results indicate that they would also have better SRH at baseline were it not for gender differences in employment status, socioeconomic status, childhood health, moderate drinking, depressive symptoms, cancer, arthritis, functional limitations, and eyesight.
Although gender roles are changing and gender disparities in education and income are closing among younger cohorts, our results show that SRH among middle and older adults is related to a stratification system that disadvantages females in terms of socioeconomic status and health. However, the male disadvantage also stems from transitions in employment status and the onset of health conditions, which are more likely experienced during middle and late adulthood. As people age, events such as retirement and unemployment increasingly influence assessments of health (Pinquart, 2001). While most people start smoking at younger ages, transitioning to unemployment or retirement or experiencing the onset of health conditions are more likely to occur during late-middle and older ages. Because these are more commonly experienced by males, it is not surprising that other studies have found that females have worse SRH at younger ages. Interestingly, the gender difference in the change in SRH over time disappears when adjusting for gender differences in smoking, but then reappears when controlling for the health status factors. Females are more likely to experience arthritis and have worse eyesight, which negatively affects ratings of health. Despite past research which shows a weakening relationship between SRH and measures of objective physical health with age among the oldest old (French, Sargent-Cox, & Luszcz, 2012; Pinquart, 2001), physical health factors continue to affect SRH among this age group.
Results demonstrate that gender disparities in SRH trajectories result primarily from differential exposure rather than from the differential impact of the predictors. In the multiple group models, only the impacts of age, smoking, overweight BMI, physical activity, and eyesight on SRH were significantly different for males and females. The lack of gender differences in the impact of the covariates on SRH contrasts with previous research emphasizing the differential impact of various predictors among males and females (Denton & Walters, 1999). Moreover, there is no clear pattern regarding the contribution of sets of predictors to SRH for males or females in this analysis. Several among each set of predictors included in the analysis were significantly related to SRH for males and females. Instead, our research provides evidence that differential exposure to the conditions and roles that influence health are more important for understanding gender differences in SRH.
Results from the descriptive analysis show that SRH declines with age and over time, which is consistent with past research (Arber & Ginn, 1993; Denton & Walters, 1999; McDonough, Sacker, & Wiggins, 2005; Pinquart, 2001). However, when including age as a covariate in the mediating models, it is not a significant predictor of SRH, which is consistent with previous research showing that age is not directly related to SRH but is indirectly related through other factors that change with age (Hoeymans et al., 1999). Interestingly, there is a positive and significant relationship between age and SRH at baseline among females when adjusting for the other covariates. Females may adapt to deterioration in health, regard decline in health as a normal part of the aging process, or compare themselves with peers with worse health. Other research has also shown that when controlling for other factors, SRH remains stable (Perruccio, Badley, Hogg-Johnson, & Davis, 2010) or improves with age (Jylha, 2009; Leinonen, Heikkinen, & Jylha, 2001).
There are limitations of this research. First, exposure to stress has been linked to SRH and other chronic health conditions (McDonough & Walters, 2001). Although marital and employment status transitions and the onset of health conditions are included in the analysis, they are not direct measures of stress and do not assess the various types of stress one can experience. It would be beneficial to include specific indicators of stress and strain, as well as more information on life events. Second, this study does not differentiate cohort and age-related changes in SRH. Cohort differences may partially explain why results from research examining gender and SRH have been inconsistent. Respondents born from 1931 to 1941 experienced life differently from both previous generations and following generations. While previous research shows that older cohorts generally have worse SRH than younger cohorts (Liang et al., 2010; Pinquart, 2001), future research should compare cohorts to isolate the impact of gender differences in structural, behavioral, and health factors specific to particular cohorts. Finally, we are unable to eliminate the possibility of reverse causality. Although we lagged variables when possible, the potential exists for SRH to affect the covariates included in the analysis. For example, because changes in employment status are taking place at the same time as changes in SRH, it is possible that changes in SRH influenced employment status.
This research contributes to the current literature on gender differences in health in several important ways. First, we examine gender differences in SRH by examining baseline SRH and change in the rate of SRH over time among middle age and older adults, and consider how changes in marital transitions, employment transitions, and onset of health conditions contribute to gender differences in health. Change in employment status and onset of health conditions are important predictors of SRH, so consideration of important life transitions contributes more to our knowledge of SRH than research that only considers employment status and health conditions at baseline. Second, we consider both the differential exposure and differential vulnerability explanations of gender disparities in health. We found little evidence that men and women are differentially vulnerable to the determinants of SRH, which contrasts with previous research that examines both explanations (Chen et al., 2008; Denton et al., 2004). Instead, our analysis shows that differential exposure is more useful when examining gender differences in SRH.
Finally, and contrary to results from previous research, our results show that older females have better SRH over time compared with older males, and would have even better SRH were it not for differences in socioeconomic status, employment status, drinking behavior, childhood health, distress, arthritis, functional limitations, and eyesight. Instead of examining why a female disadvantage disappears over time or with age, our results suggest that researchers should instead be asking why, when differences in a variety of structural, behavioral, and health factors are adjusted for, would females have better SRH compared with males. This advantage may reflect differences, some biological, not captured by the factors included in our analysis (Read & Gorman, 2010). Research on gender differences in the cognitive bases used to assess health may also shed light on the female advantage (Benyamini, Leventhal, & Leventhal, 2003; Jylha et al., 1998). Gender differences in self-reports of health may reflect gender differences in the meaning, interpretation, and awareness of health and illness. With a better understanding of gender differences in SRH, we can focus on the conditions and factors that would improve SRH for males and females.
Footnotes
Declaration of Conflicting Interests
The authors declared no potential conflicts of interest with respect to the research, authorship, and/or publication of this article.
Funding
The authors received no financial support for the research, authorship, and/or publication of this article.