
Abstract
Introduction
With increasing longevity, societies face a new challenge in terms of the quality of old age. One of the major topics in discussions and empiric research on this theme is “successful aging,” a concept used as early as the beginning of the 1960s. Havighurst (1961) and Neugarten (1972) emphasized the role of social and psychological dimensions such as maintenance of activity, life satisfaction, positive self-concept, and ability to adapt as major elements of successful aging, while Rowe and Kahn (1997) defined it as absence of disease and disability, maintained physical and mental functioning, and active engagement with life. Since then, researchers have discussed whether “success” in aging should be understood in absolute measures or as a relative advantage within one’s own age group and whether it should best be measured by external criteria set by researchers or mainly defined and evaluated by old people themselves. Most often, successful aging has been operationalized in terms of physical, cognitive, or functional status (Depp & Jeste, 2006; Phelan & Larson, 2002; Strawbridge, Cohen, Shema, & Kaplan, 1996), and in many papers on successful aging, only one dimension or one single indicator has been used. Recent discussions, again, have emphasized multidimensional approaches and the role of social engagement and adaptation, creating the potential to age “successfully” even with chronic disease and other health problems (Pruchno & Wilson-Genderson, 2012; Young, Frick, & Phelan, 2009).
Very old people—nonagenarians and centenarians—constitute a special group in research on successful aging. They obviously meet one important criterion of success, longevity; but studies with representative population samples show that in medical terms, they can hardly be regarded as healthy (Andersen-Ranberg, Schroll, & Jeune, 2001; Tiainen, Luukkaala, Hervonen, & Jylhä, 2013). In the Georgian Centenarian Study (Cho, Martin, & Poon, 2012), 15% of octogenarians but none of the centenarians were considered “successful” according to the Rowe and Kahn (1997) criteria, but when subjective health, perceived economic status, and happiness were considered as an alternative model, 62% of octogenarians and 48% of centenarians were successful.
In our earlier work, we have examined the prevalence of and factors associated with successful aging in a representative population sample of nonagenarians (Nosraty, Sarkeala, Hervonen, & Jylhä, 2012). Following Rowe and Kahn (1997) and Young et al. (2009), we defined successful aging as consisting of physical, psychological, and social components. We constructed six different models as different combinations of variables describing these components. The prevalence varied from 1.6% in the most demanding model (which required, for example, the absence of all diseases and full independence in functioning) to 18.3% (in the model that allowed diseases other than dementia and did not include the psychological component [PsC]; Nosraty et al., 2012). The aim of this study was to investigate whether successful aging, a descriptor of a good quality of life, also predicts the length of future life in very old people. Over the past two or three decades, the probability of surviving until the age of 90 and life expectancy at the age of 90 have both increased rapidly. It is fair to say that today’s nonagenarians not only have a past but also a future. Survivors aged 90 or older are not a homogeneous group even in respect to mortality, and it is not clear whether their mortality and survival are predicted by the same indicators as younger age groups. It has been suggested that mortality in this age group is a stochastic process rather than being predicted by specific risk factors (Poon et al., 2000). Other studies, however, have revealed that mortality at the age of 90 or above is predicted by health and physical functioning (Allard, Robine, & Henon, 2000; Martelin, Koskinen, & Valkonen, 1998; Nybo et al., 2003; Tiainen et al., 2013), self-rated health (Vuorisalmi, Luukkaala, Hervonen, & Jylhä, 2011), comorbidity (Formiga et al., 2011), and cognitive functioning (Negash et al., 2011), which are known to be associated with mortality in younger old age and are usually understood as components of successful aging.
Less is known about the role of social and psychological factors. Yasuda et al. (1997) and Sun and Liu (2006) found that, among people aged 80 and above in China, both solitary and social activities were associated with lower mortality, and the effect of customary solitary activities such as doing housework and gardening, or reading newspapers and watching TV, remained significant even when physical and cognitive status and physical exercise were controlled for. The role of social contacts is more controversial. Yasuda et al. (1997) found that contacts with children, friends, and group organizations were associated with lower mortality among women aged 75 years or above. In a Swedish study with people aged 77 or older, both contacts with friends and solitary activities predicted lower mortality, but after controlling for health and education, only solitary activities remained significant (Lennartsson & Silverstein, 2001). For social contacts or social activity, we found no studies focusing especially on nonagenarians or centenarians.
There are also hardly any studies that investigate the role of multidimensional successful aging in connection with mortality in very old people. If we take the importance of the multidimensional character of “success” seriously, assuming that different dimensions together produce something greater than their parts, and that different dimensions can compensate for each other in producing a good old age, better understanding is needed about the role of multidimensional successful aging in the survival of long-lived persons. In this study, we investigated the association of successful aging (represented by four different models) and its physical, social, and psychological components with mortality at 4 years (1,461 days) and 7 years (2,525 days) among nonagenarians.
Data and Method
Data Sources
The Vitality 90+ study is a population-based multidisciplinary research program on nonagenarians in the city of Tampere, Finland (Jylhä, Enroth, & Luukkaala, 2013; Jylhä & Hervonen, 1999). In this program, mailed surveys were carried out with all community-dwelling people aged 90+ in 1996 and 1998 and with all people aged 90+, irrespective of where they lived, on four occasions since 2001. The present study used the data from the mailed surveys in 2001 and 2003. Names, addresses, and places of residence of the target population were drawn from the Tampere City Population Register. Dates of death were received from the Finnish Population Register on the basis of unique personal identity code of each inhabitant in Finland. Informed consent was obtained from all respondents or their legal representatives. The research protocol was approved by the City of Tampere Ethics Committee.
Participants
For this study, data from two Vitality 90+ cross-sectional mailed surveys (2001 and 2003) were combined to increase the number of participants. In the original surveys, the number of participants was 892 in 2001 and 963 in 2003; the response rates were 79% and 86%, respectively. The questionnaires were identical in both years. As all the inhabitants of Tampere aged 90 or over were included in each study year, there were 485 participants who answered the questionnaire both in 2001 and 2003. To avoid duplication, the participants were included in the present analysis only in the year when they entered the study. This resulted in 1,370 participants, and this is the sample analyzed in this study.
Due to the high rate of physical and mental health problems in the oldest group, not all participants were able to answer the questions themselves, and proxy respondents were needed. Altogether 21.3% of the questionnaires were answered by the proxies: 6.7% were answered by family members or other relatives, 14.1% by staff at nursing homes or hospitals, and 0.5% by home care staff. An additional 6% received help with reading the questions or recording the answers, but the participants chose the answers themselves; they were therefore included in the self-response group.
Measures of Successful Aging
Our indicator of successful aging included three components: physical, psychological, and social. The components were the same as in our earlier study (Nosraty et al., 2012), but as not all the variables used were available in the 2001 and 2003 data, the physical dimension and the psychological dimension are not exactly identical with the earlier cross-sectional study.
Physical component
Two elements, diseases and functioning, were considered for measuring the physical component (PhC). The participants were asked whether they had been told by the doctor that they had a heart problem, stroke, circulatory problems in the brain, diabetes, arthritis, Parkinson’s disease, hip fracture, or dementia or memory problems. For functional ability, the participants were asked whether they were able to move about indoors, walk 400 m, use stairs, get into and out of bed, and dress and undress. The response options were (1) yes, without difficulty; (2) yes, with difficulty; (3) only with help; and (4) not at all; and those measures were categorized as independent (1+2) and dependent (3+4). Moving about indoors, getting in and out of bed, and dressing and undressing were considered less demanding activities than walking 400 m and using stairs.
We constructed four different alternatives for the PhC as follows:
Psychological component
The PsC was measured by three variables. Participants were asked whether the doctor had told them that they had depression or depressive feelings (yes/no). Self-rated health was the second variable included in the PsC. Self-rated health represents an individual’s subjective perception of his or her overall health. The cognitive process of selection of information and interpretation of meanings has a strong psychological dimension, reflecting the psychological characteristics and disposition of the individual (Huisman & Deeg, 2010; Jylhä, 2009). Several studies imply that with higher age, the association of self-rated health with disease and functioning weakens and the importance of the psychological factors increase (Galenkamp et al., 2013). Therefore, it is justified to include self-rated health in the PsC of successful aging. For the analyses, self-rated health was categorized as good (very good or fairly good or average) or poor (fairly poor or poor). The participants were also asked whether they thought it is good for people to live to be 100 years old (yes/no). This was used as an indirect measure of their satisfaction and zest for life, as a direct question was considered potentially sensitive.
As self-rated health and the opinion about living up to 100 invited genuinely subjective evaluations without a defined standard, we did not accept proxy answers for these questions. In cases of proxy respondents (21.3%), the answers for these two questions were coded as missing.
However, we did not want to exclude these cases from the mortality analysis, as this would mean losing the most frail participants and result in misleading findings. We therefore coded the missing values (proxy respondents) for these two questions as “not successful” if these participants did not meet the criteria of “success” in either the social component (SC) or the PhC, because they would in any case be categorized as “non-successful” agers. We constructed two versions of the PsC, one including the variable on the willingness to live up to 100 and another without it. Thus, in the two different versions of the PsCs, “success” was defined as follows:
Social component
For the SC, two questions were considered: the frequency of meetings with children (six categories from today or yesterday to several years ago) and the frequency of talking on the phone with family members or friends (six categories from today or yesterday to several years ago). More than one quarter (26.2%) of the respondents had no children. If these participants had had telephone contacts during the past week, we included them in the same category as people who had had contacts with children. In the SC, “success” was defined as having met one’s children and having talked on the phone with family members or friends during the past 2 weeks.
Models of Successful Aging
For our analyses, we constructed four models of successful aging combining the three dimensions, following the criteria used in Rowe and Kahn (1997) and Young et al. (2009). As there is no ideal model for measuring successful aging, we defined four alternative criteria for “success.” All of the models included PhC, PsC, and SC, but they varied in detail.
All these models followed same lines of theoretical thinking, including the same three components, but the variables describing these three components differed to some extent, reflecting the different levels of criteria for successful aging. The main difference between the first three models was in the PhC, which was the most demanding in Model 1 and the least demanding in Model 3. In Model 4, the PsC differed from the others in that it did not include agreement with the statement that it is good to live to be 100. Among the 1,370 participants, the number of “successful agers” varied, with 30 in Model 1, 70 in Model 2, 90 in Model 3, and 385 in Model 4. The frequency was lower for models that included more demanding criteria for success and higher for those where the demands were lower.
Analysis
Frequencies and percentage of variables in each model of successful aging at baseline are reported for men and women and for the whole sample. Survival among successful and non-successful agers in the 4- and 7-year follow-up periods was compared using the chi-square test. Cox proportional hazard models adjusted for age and gender were applied to explore the association of successful aging and its components with mortality. Hazard ratios (HR) with 95% confidence intervals (CI) were calculated. The confidence interval or P (CI/P) value function was used to evaluate the quantitative measurement of data graphically for significance testing (Rothman, Johnson, & Sugano, 1999) in Model 1.
Sensitivity analysis was used to assess whether the inclusion of proxy respondents with the PsC coded as missing influenced the result of the Cox proportional hazard analysis compared with models where proxy respondents were excluded. We found that the replacement did not essentially change the association of the successful aging models or PsC with mortality. All analyses were performed using SPSS 19 statistical software.
Results
Most of the participants (91.6%) were 90 to 94 years old. While the age range of the participants was 90 to 106, median age was 91. One fifth of participants were men. Proxy responses were obtained from 21.3% of the participants. More than half of the participants lived in a private home, men more often than women. Mortality was high (Table 1): Survival after 4 years was 36.4% (32.6% of men and 37.4% of women) and after 7 years, it was 16.1% (12.7% of men and 17% of women).
Frequency (%) of Three Components of Successful Aging and Four Different Models of Successful Aging in Men and Women.
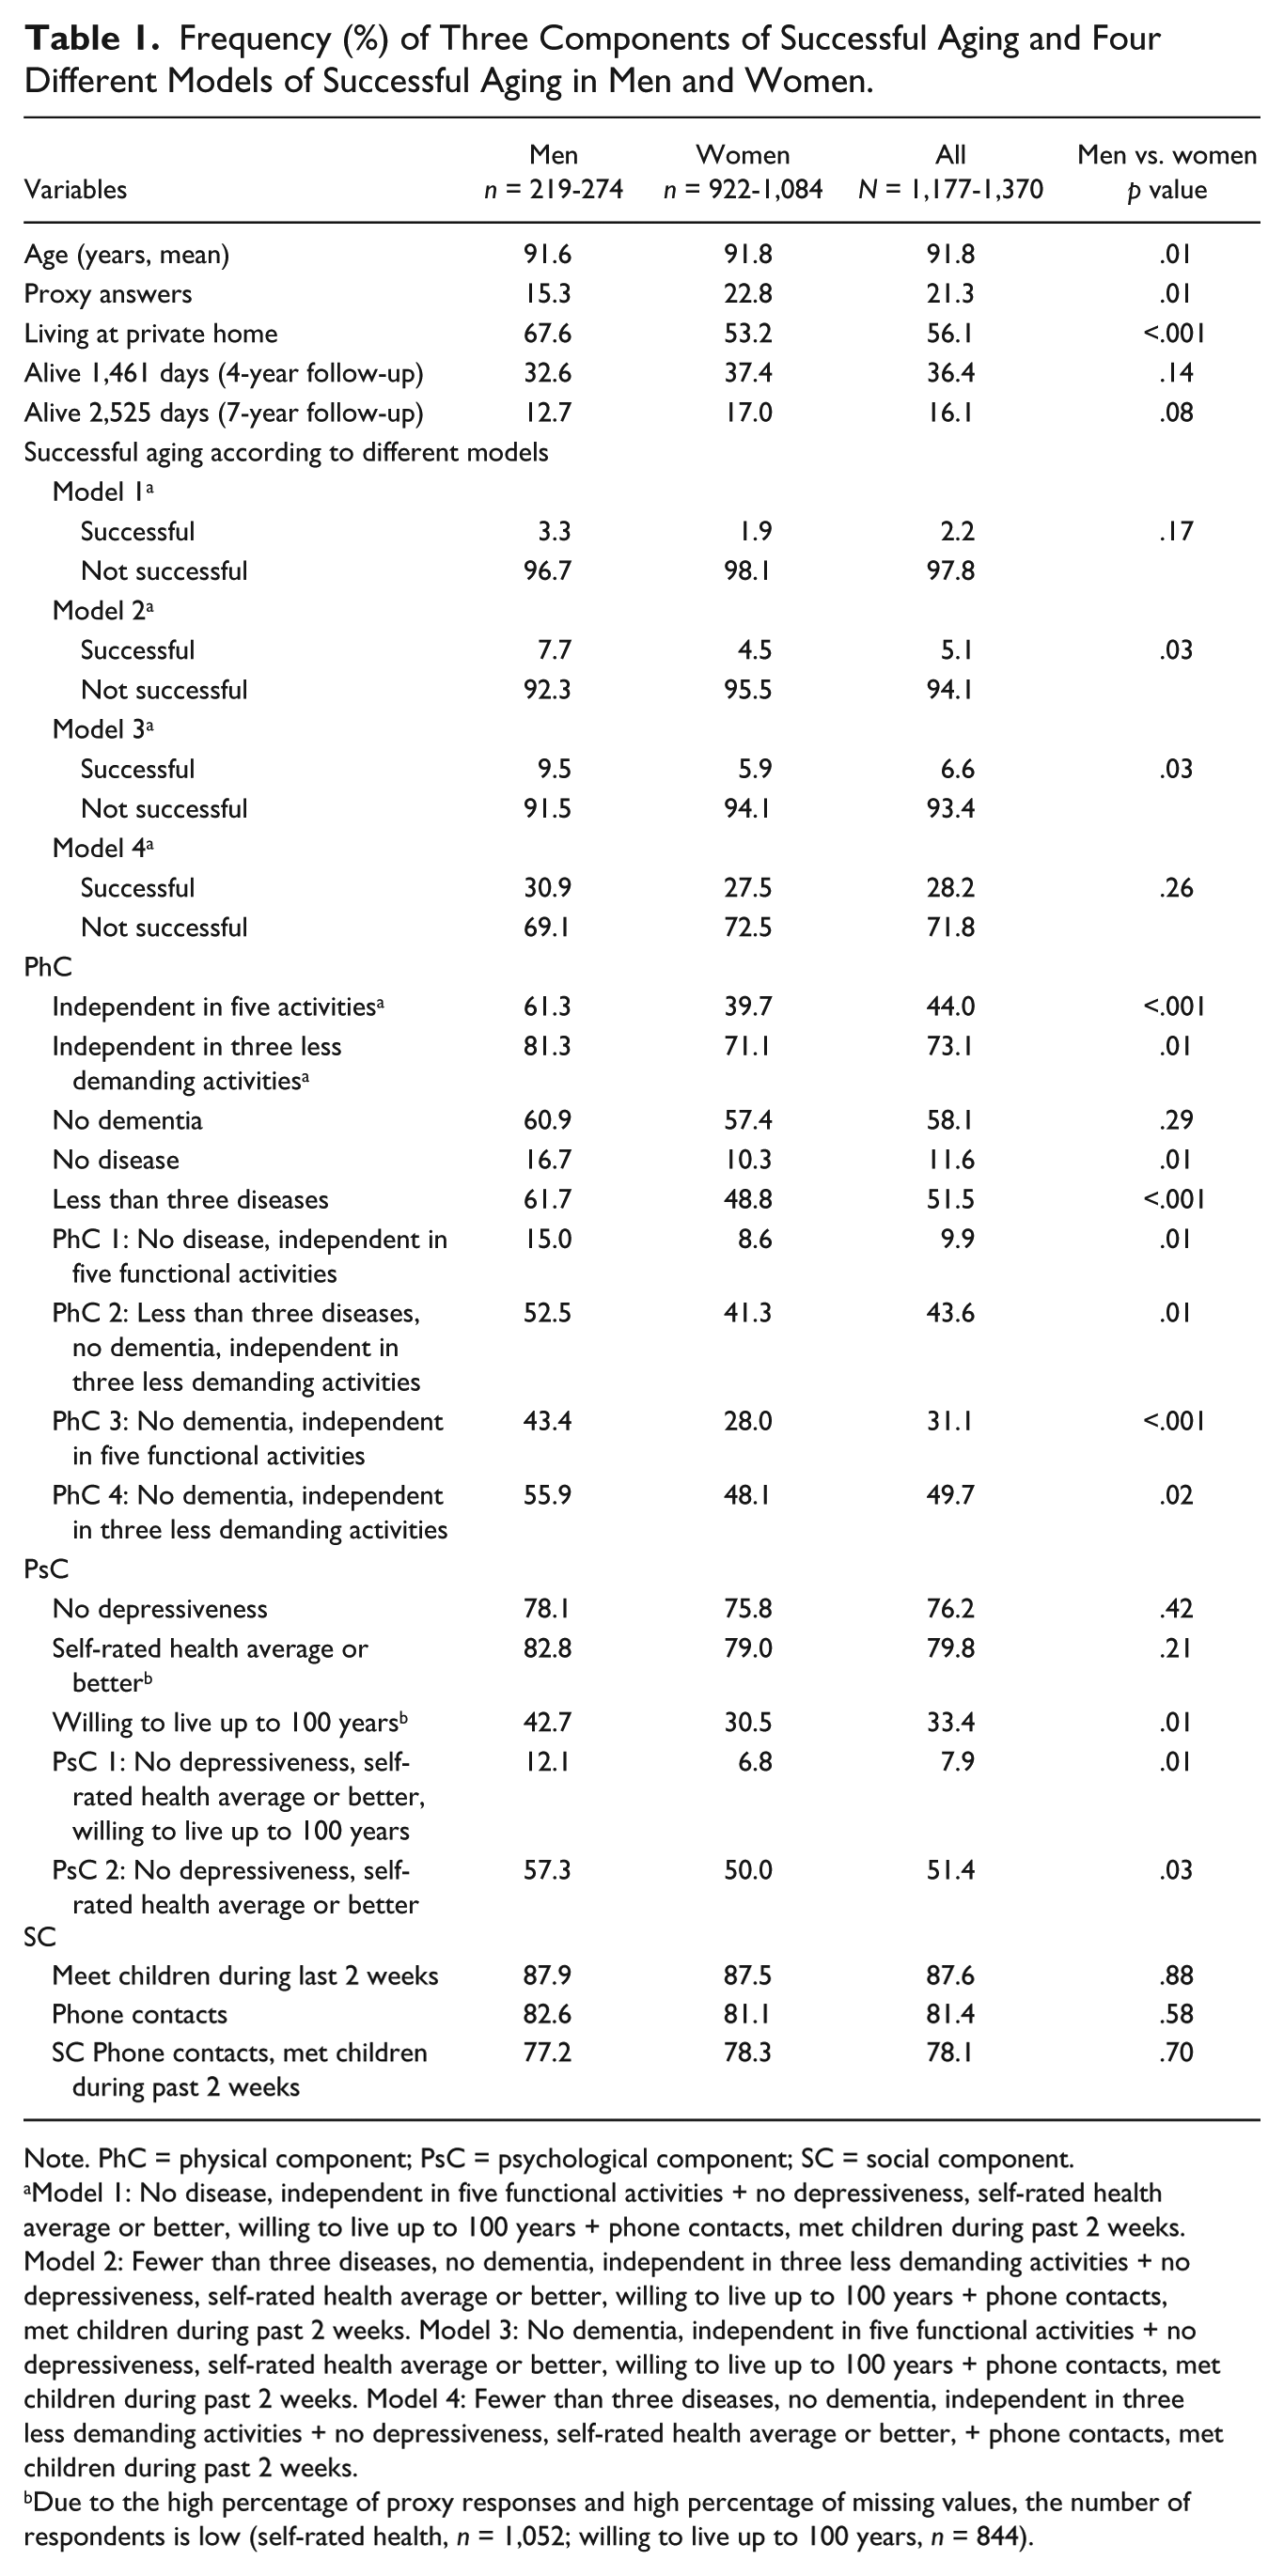
Note. PhC = physical component; PsC = psychological component; SC = social component.
Model 1: No disease, independent in five functional activities + no depressiveness, self-rated health average or better, willing to live up to 100 years + phone contacts, met children during past 2 weeks. Model 2: Fewer than three diseases, no dementia, independent in three less demanding activities + no depressiveness, self-rated health average or better, willing to live up to 100 years + phone contacts, met children during past 2 weeks. Model 3: No dementia, independent in five functional activities + no depressiveness, self-rated health average or better, willing to live up to 100 years + phone contacts, met children during past 2 weeks. Model 4: Fewer than three diseases, no dementia, independent in three less demanding activities + no depressiveness, self-rated health average or better, + phone contacts, met children during past 2 weeks.
Due to the high percentage of proxy responses and high percentage of missing values, the number of respondents is low (self-rated health, n = 1,052; willing to live up to 100 years, n = 844).
The percentage and frequency of successful aging according to four models and components of successful aging in men and women are shown in Table 1. The prevalence of successful aging varied according to model. Of the 1,370 participants, 2.2% (n = 30) were successful agers according to Model 1 (the most demanding model) and 28.2% (n = 385) according to Model 4. Successful aging was more common in men than women in all models, and differences were significant for Models 2 and 3. The success rate according to PhC varied from 9.9% to 49.7%. The success rate was higher for social than for the two versions of PsCs (78.1% compared with 25.4% and 51.4%). Both PhC and PsC showed higher success for men than women.
Table 2 presents the percentage of survivors in the successful and non-successful groups after 4 years and 7 years. At the 4-year follow-up, the percentage of survivors was higher for successful than for non-successful agers of both genders according to all models; the difference was significant in the total group and for women in Models 2 to 4, and for men in Model 4. At the 7-year follow-up, the same pattern was seen—higher survival for successful agers than non-successful agers—but the difference was significant only for the total group and for the women in Model 4. Regarding the components of successful aging, in the total group and in women, all the components were predictive of mortality in both follow-ups. In men, PhCs 2 and 3 and PsC 2 predicted mortality in both follow-ups, but PsC 1 was not significant in either follow-ups. The other components showed at least a borderline association in the shorter follow-up but not in the longer follow-up.
Percentage of Survivors at 4- and 7-Years Follow-Up According to Each Model of Successful Aging and Their Components in Both Genders Separately and for All Participants Together.
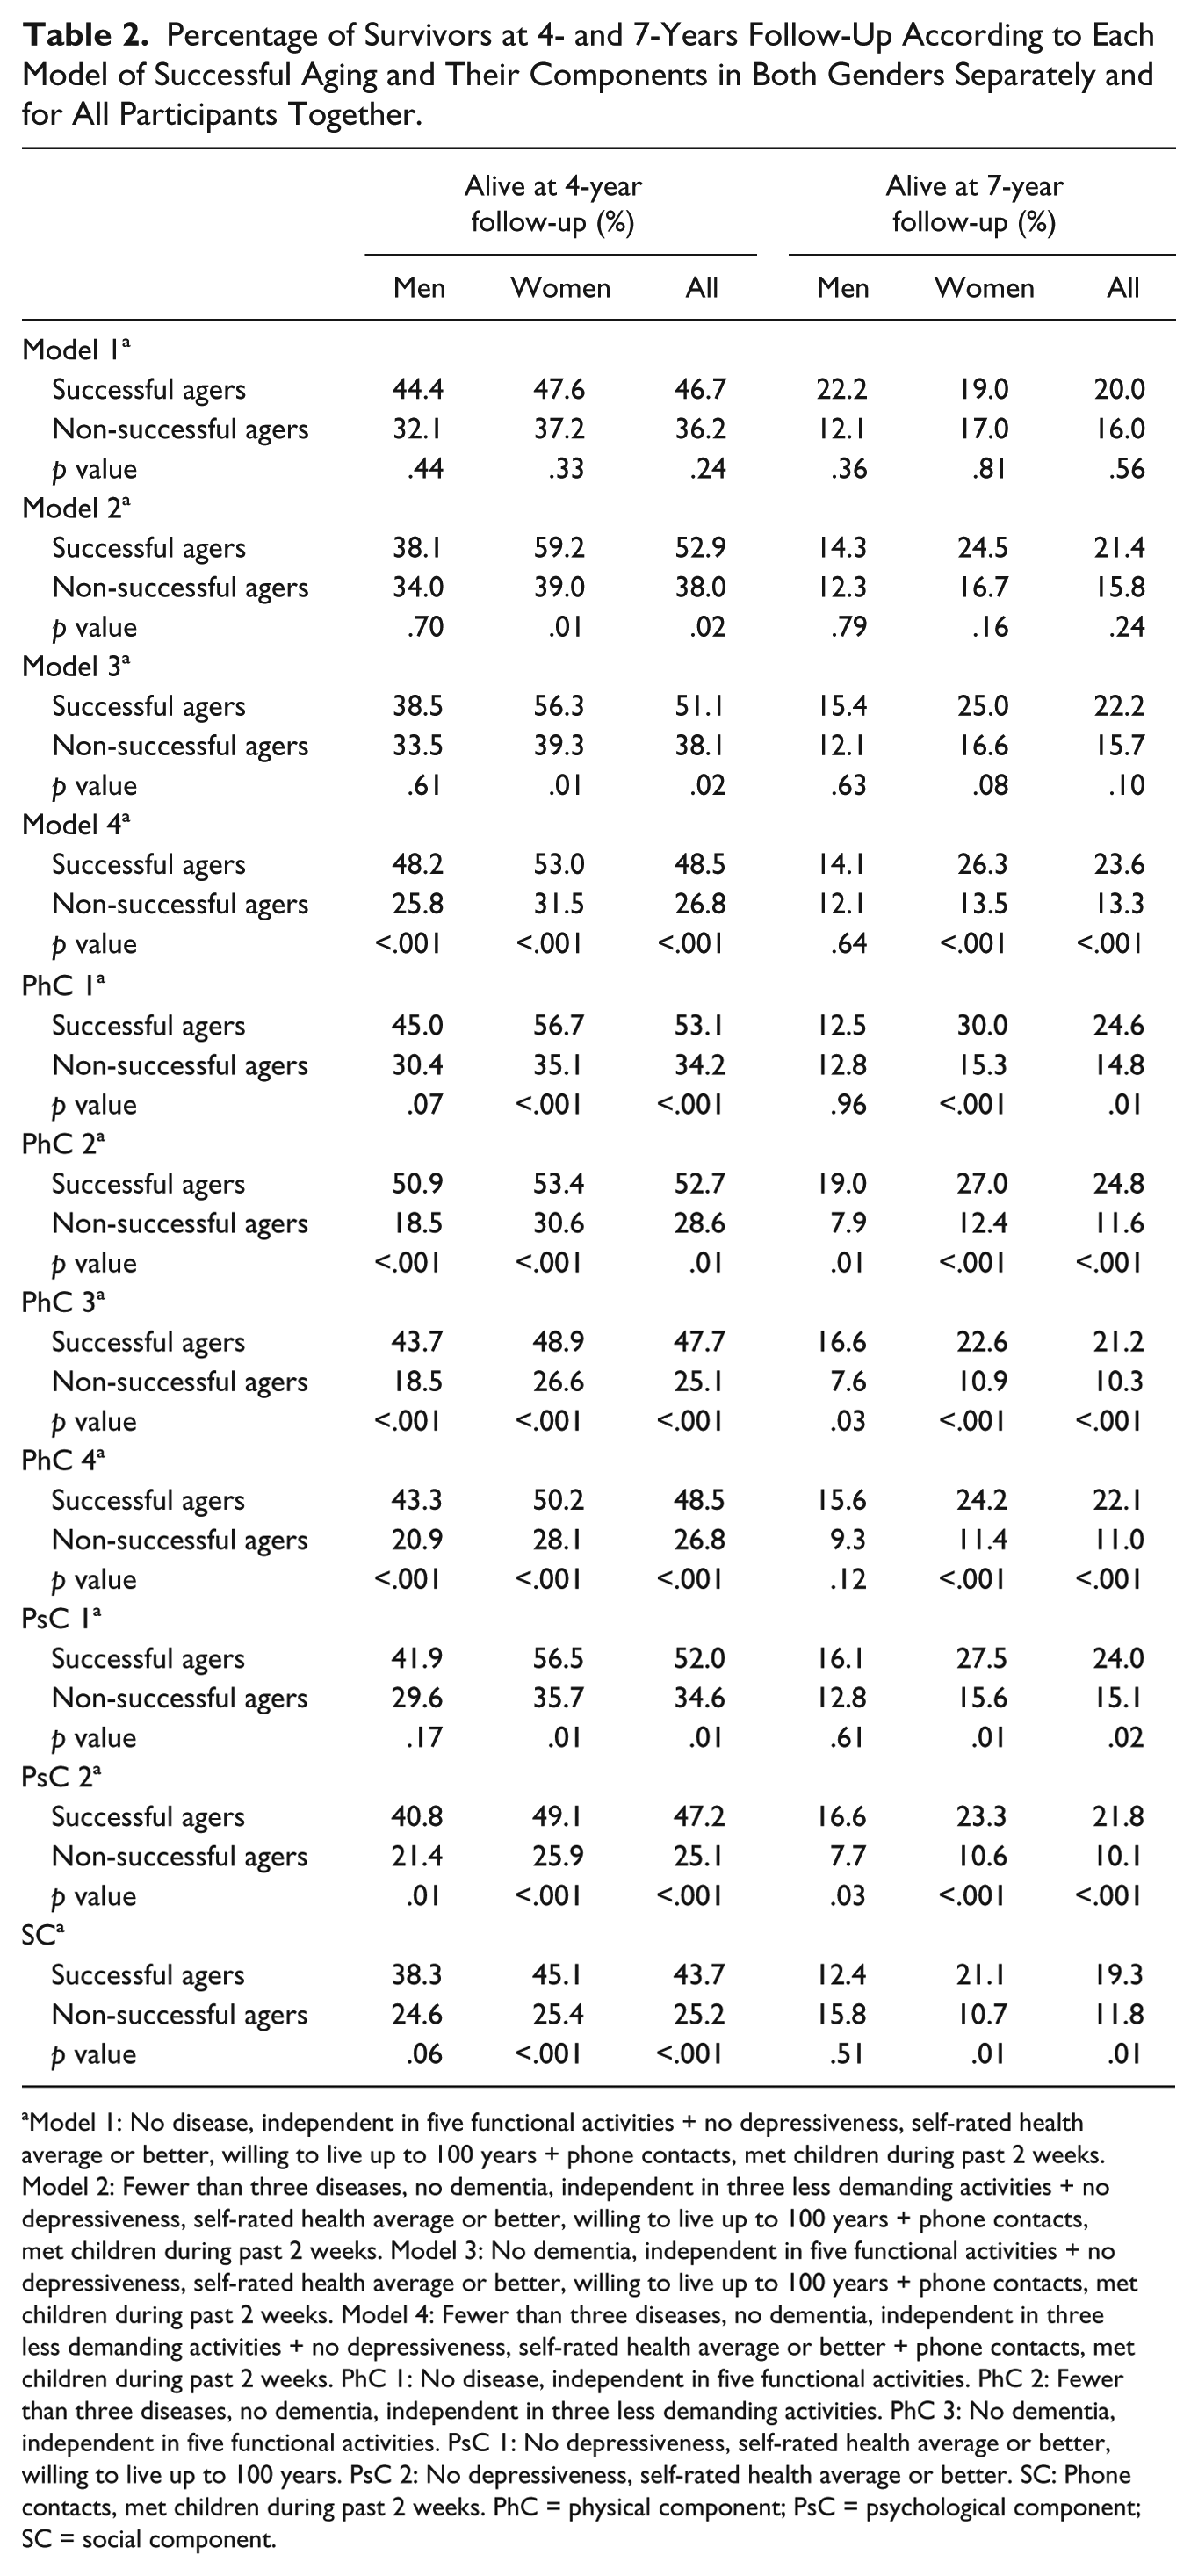
Model 1: No disease, independent in five functional activities + no depressiveness, self-rated health average or better, willing to live up to 100 years + phone contacts, met children during past 2 weeks. Model 2: Fewer than three diseases, no dementia, independent in three less demanding activities + no depressiveness, self-rated health average or better, willing to live up to 100 years + phone contacts, met children during past 2 weeks. Model 3: No dementia, independent in five functional activities + no depressiveness, self-rated health average or better, willing to live up to 100 years + phone contacts, met children during past 2 weeks. Model 4: Fewer than three diseases, no dementia, independent in three less demanding activities + no depressiveness, self-rated health average or better + phone contacts, met children during past 2 weeks. PhC 1: No disease, independent in five functional activities. PhC 2: Fewer than three diseases, no dementia, independent in three less demanding activities. PhC 3: No dementia, independent in five functional activities. PsC 1: No depressiveness, self-rated health average or better, willing to live up to 100 years. PsC 2: No depressiveness, self-rated health average or better. SC: Phone contacts, met children during past 2 weeks. PhC = physical component; PsC = psychological component; SC = social component.
Cox proportional hazard models were applied to examine the association between successful aging and mortality separately for men and women, adjusted for age, and for the total sample, adjusted for age and gender (Table 3). All models of successful aging apart from Model 1 significantly predicted higher survival at both follow-ups for the total group and for women. Model 4 was the strongest predictor of survival in all groups. With Models 2 and 3, significant associations were found for women but not for men.
Adjusted Cox Proportional Hazard Analysis of Three Different Models of Successful Aging and Their Components for Both Genders and All Participants Together.
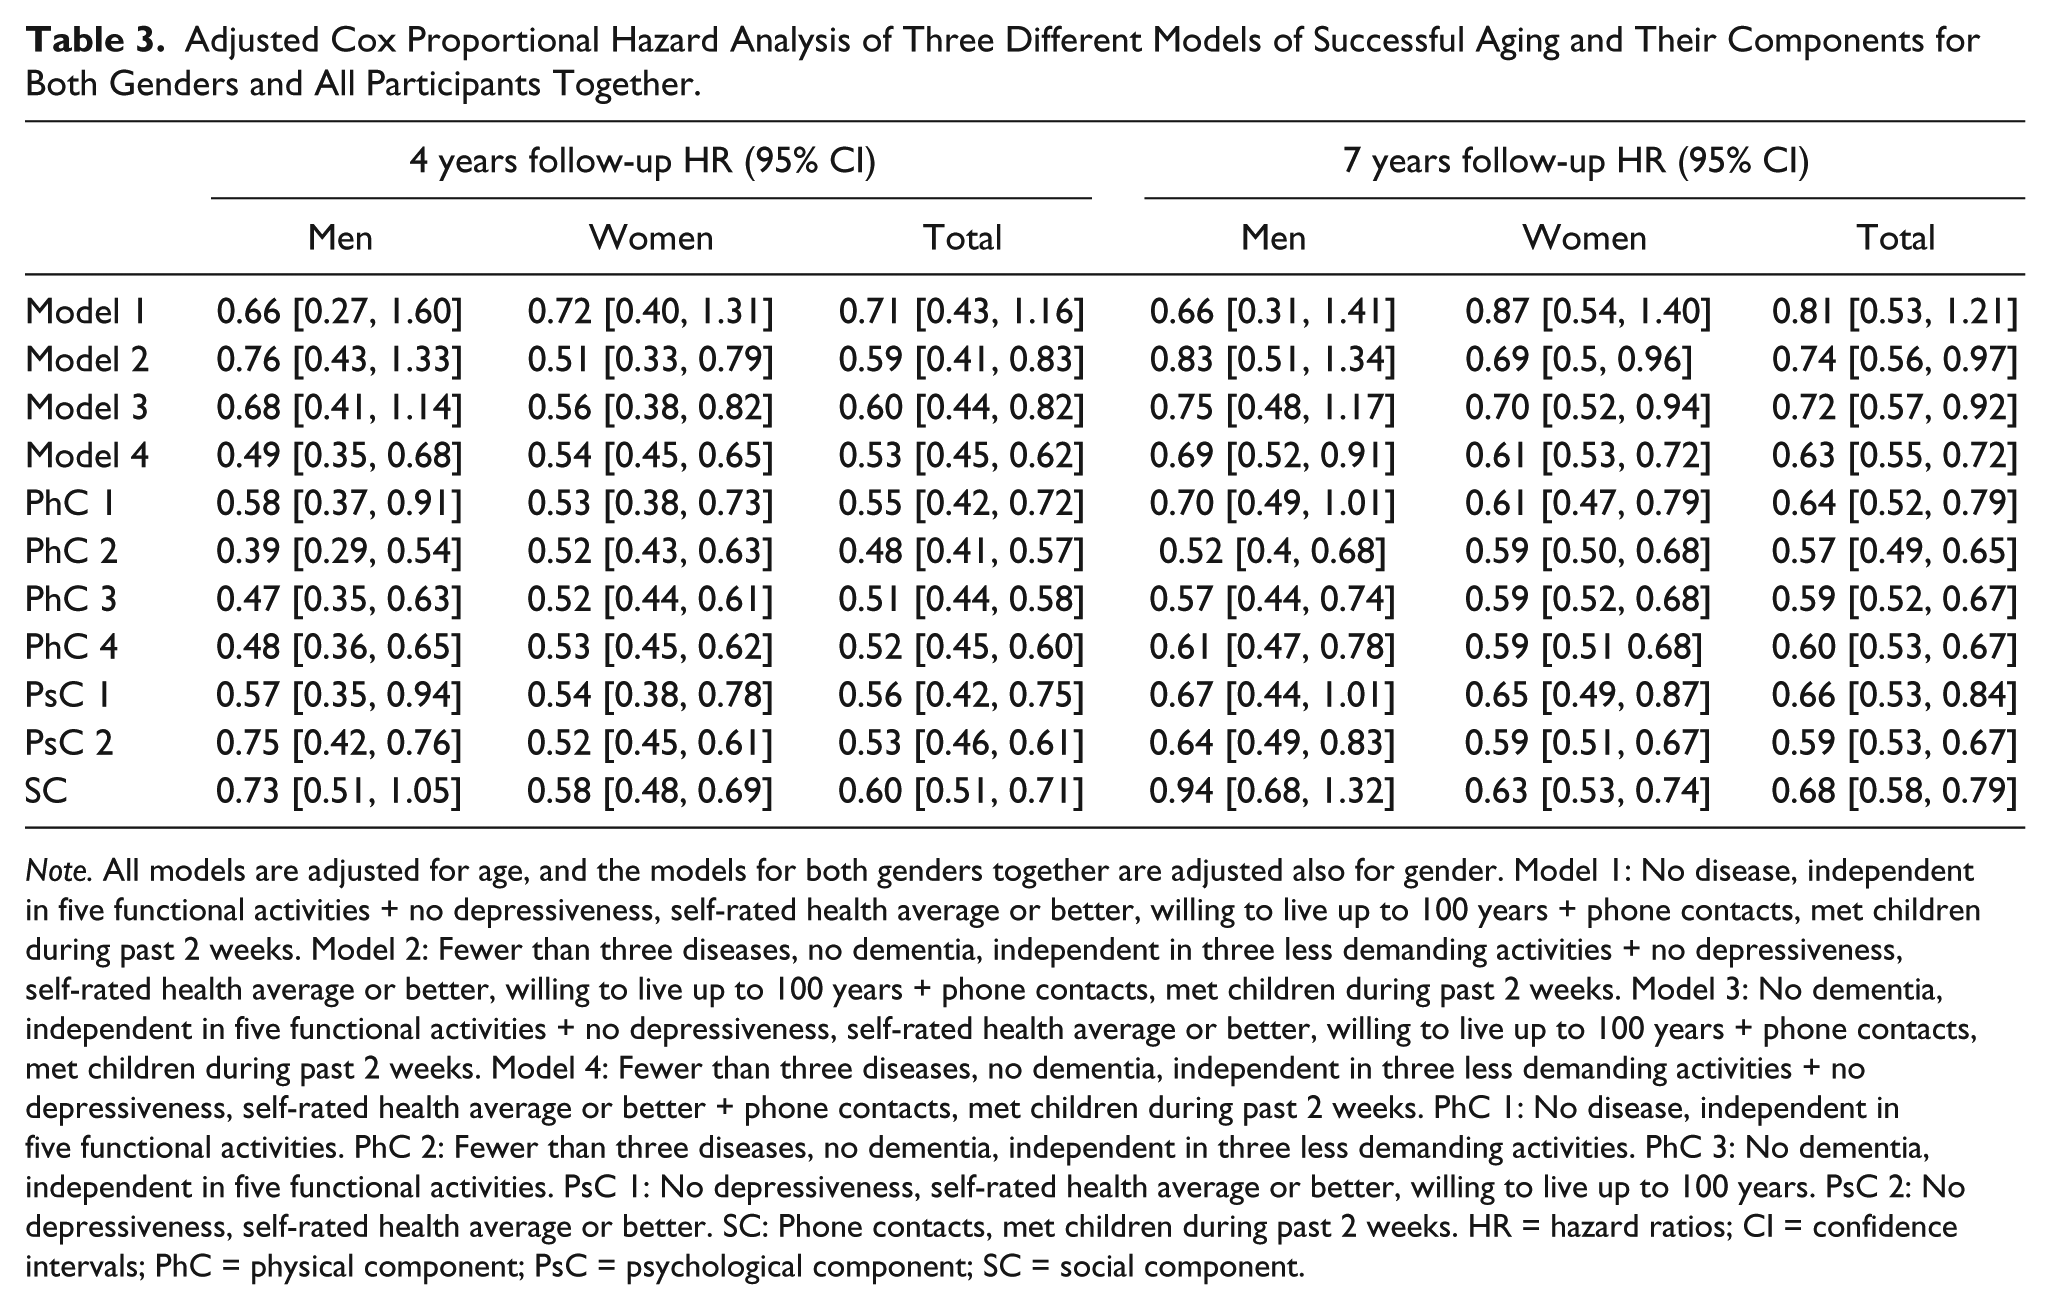
Note. All models are adjusted for age, and the models for both genders together are adjusted also for gender. Model 1: No disease, independent in five functional activities + no depressiveness, self-rated health average or better, willing to live up to 100 years + phone contacts, met children during past 2 weeks. Model 2: Fewer than three diseases, no dementia, independent in three less demanding activities + no depressiveness, self-rated health average or better, willing to live up to 100 years + phone contacts, met children during past 2 weeks. Model 3: No dementia, independent in five functional activities + no depressiveness, self-rated health average or better, willing to live up to 100 years + phone contacts, met children during past 2 weeks. Model 4: Fewer than three diseases, no dementia, independent in three less demanding activities + no depressiveness, self-rated health average or better + phone contacts, met children during past 2 weeks. PhC 1: No disease, independent in five functional activities. PhC 2: Fewer than three diseases, no dementia, independent in three less demanding activities. PhC 3: No dementia, independent in five functional activities. PsC 1: No depressiveness, self-rated health average or better, willing to live up to 100 years. PsC 2: No depressiveness, self-rated health average or better. SC: Phone contacts, met children during past 2 weeks. HR = hazard ratios; CI = confidence intervals; PhC = physical component; PsC = psychological component; SC = social component.
Success in each of the three components of successful aging—the psychological, the social, and the physical—was associated with lower mortality at the 4-year and the 7-year follow-up in the total study group and in women. In men, PsC 1, which included willingness to live up to 100, and PhC 1, which emphasized the absence of disease, were not significant predictors of mortality. The SC did not predict survival for men at either follow-up (Table 3).
Discussion
This article studies the role of successful aging in predicting mortality and survival in a representative population sample of 1,370 nonagenarians during follow-up periods of 4 and 7 years. In literature, the models of successful aging vary, but most of them include a physical or health component, a cognitive or psychological component, and a SC. In our data, we generated four models that all included the three dimensions but used different criteria for “success” in the PhC and PsC. We found that three out of the four models of successful aging were able to predict survival at both follow-ups. Only Model 1, the most demanding model where the PhC required absence of disease and independence in functioning, was not a significant predictor.
Why, then, did the people with very good health not show better survival than others? The result could be interpreted in two different ways. First, as Model 1 picks up only a very elite group for the category of “success,” a significant number of reasonably healthy and highly functioning people are relegated to the “non-successful” group. For example, according to Model 1, those who had arthritis as their only diagnosis, or those who only needed help in using stairs, belonged to the group of non-successful agers. These conditions are not likely to be fatal or to be strong predictors of mortality. Thus, the demanding criteria for “success” probably dilute the differences in mortality between the successful and non-successful group. However, the demanding Model 1 distinguished a very small group (prevalence 2.2%) which may lead to incorrect interpretation of the association between successful aging and mortality. The CI/P value function graph used by Rothman (Rothman, 2012; Rothman et al., 1999) suggests that if we had a larger sample, leading to a better precision, Model 1 would also have been a significant predictor.
The gender differences also deserve a closer look. In each model, successful aging was more common among men than among women, but for both the successful and the non-successful, survival rates were somewhat higher in women than in men. In the Cox proportional hazard models, the HR for both genders implied lower mortality for those with successful aging, but the CI indicated statistical significance for men only in Model 4. The group of men, however, was rather small, as only one fifth of participants were male, which reflects the proportion of men in the basic population.
Our research also provides evidence that each component of successful aging predicted mortality in the total population at both follow-up points. In both genders and at both follow-up times, mortality was lower for those who met the criteria of the PhC and PsC of successful aging. The association of the SC, however, was significant only for women, although it also showed borderline significance for men at the 4-year follow-up. The stronger role of social relations for women is in line with Rasulo, Christensen, and Tomassini (2005), who in a Danish study demonstrated a significant association between social relations and survival only for women. As regard the psychology component, it is worth noting that the variable showing the lowest rate of success—only 33%—was the opinion that is good to live to be 100.
A major strength of our study is that it includes all individuals aged 90 and above in Tampere, irrespective of health or type of residence, and the response rate was high. In many studies of the oldest old, the most frail and institutionalized people are excluded, which necessarily leads to over-positive findings on health and functioning. To reach a high response rate in a non-selected group of very old people, it was necessary to accept proxy responses if the participants themselves were unable to answer the questions; this was the case for 21.3% of the participants. Due to a high rate of physical and cognitive problems, inclusion of proxy answers is the only way to avoid serious bias in the favor of healthier part of the population (Gu, 2008; Kelfve, Thorslund, & Lennartsson, 2013; National Research Council, 2009; Rodgers & Herzog, 1992) and, in our case, to reach a realistic picture of “successful aging” in the oldest old. For proxy responses, answers were coded as missing to the questions on self-rated health and living up to 100 that invited individual subjective evaluation. These missing cases were coded as “non-successful” if they belonged to the “non-successful” group in the PhC and SC, and they were thus included in the mortality analysis. Our sample, as it was a combination of two consecutive surveys, includes slightly more people aged 90 to 91 and slightly fewer people aged 92 and older than in the 90+ population in Tampere at the time of these surveys, but the proportion of people aged 92 and above is very low in the population, too, and this is not likely to hamper the generalizability of our findings to the total population. A further advantage in the study is the long follow-up time.
People suffering from cognitive problems such as dementia were included in this study. For advanced dementia, the answers were received through a proxy. However, there were cases where the respondent herself or himself reported having a diagnosis of dementia or having memory problems recognized by a doctor. Potentially, on this point, the good coverage of the basic population might also constitute a weakness because of potential problems in the reliability of the data. In earlier rounds of the Vitality 90+ study, Goebeler, Jylhä, and Hervonen (2007) compared dementia reported in the questionnaire (by the person himself/herself or by a proxy) with hospital records and with death certificates. They found that if proxy respondents are used for more severe cases, self-reports are reasonably reliable for those answering for themselves. Although self-reporting is not a perfect measure of memory disorders, over-reporting seemed more frequent than under-reporting. Another question is the reliability of other information given by a person with memory problems. Earlier, Walker, Maxwell, Hogan, and Ebly (2004) showed that self-reported health (SRH) was predictive of mortality in a group with mild-to-moderate cognitive decline. In the Vitality 90+ study, the analysis did not reveal specific reliability problems in answers given personally by people with reported memory problems (Jylhä et al., 2013). Today, conditions causing memory problems are often diagnosed at an early stage, allowing the patients many more years of reasonably high functioning.
Our measures of successful aging were all based on self-reports received through mailed questionnaires. Therefore, the severity of diseases in not known, and it was not possible to use measures of cognitive status, such as Mini-Mental State Examination (MMSE). This represents a clear weakness in our study. The questionnaires include both objective indicators such as disease, and subjective indicators such as opinions about living to the age of 100. The measures available for use, however, were not perfect. Given the age of the target population, the mailed questionnaire could only include a very limited number of questions, and the data collection was not planned exclusively for the objectives of this study. The variables in the PhC were well-validated and widely used standard measures, but measures of other components were more ad hoc. For the psychology component, in addition to depression or depressiveness, self-rated health and willingness to live up to 100 were used. Self-rated health is a predictor of mortality in nonagenarians (Vuorisalmi et al., 2011) and it is considered a reliable summary measure of health status. Yet, it is known that the link between diagnosed conditions and functional status on one hand and SRH on the other hand weakens with age (Cheng, Fung, & Chan, 2007; Pinquart, 2001; Schinitiker, 2005), and toward higher age, it increasingly reflects psychological adaptation and adjustment to the present situation. For the two variables in the psychology component, missing values due to proxy respondents were replaced, but the sensitivity analyses suggested that this did not essentially influence the results. For the SC, only two variables were available, which is a clear weakness.
Measuring successful aging can provide valuable information about the present situation and well-being of the oldest old. Our study showed that successful aging, measured as a combination of three dimensions, is also a strong predictor of the length of future life even in a population that already has lived exceptionally long. The findings also imply that not only the PhC—absence of disease and high functioning—but also the PsC and SC are associated with survival. In nonagenarians and centenarians, absence of disease is rare and may not be a very useful criterion of successful aging; a more relaxed PhC criterion also proved to be a stronger predictor of survival.
In all, our study indicates that even at the age of 90 or above, successful agers also live longer. Yet it is not clear, as our findings imply, whether long survival is what very old people themselves prefer. So the association of successful aging with survival can improve our understanding of successful aging and different ways to measure it, but it should not prevent us from seeing that the focus of successful aging in very old age should be on the quality, not the quantity, of life.
Footnotes
Authors’ Note
Gerontology Research Center is a joint effort between the Universities of Jyväskylä and Tampere.
Declaration of Conflicting Interests
The authors declared no potential conflicts of interest with respect to the research, authorship, and/or publication of this article.
Funding
The authors disclosed receipt of the following financial support for the research, authorship, and/or publication of this article: This study was supported by grants from DPPH (Doctoral Programs in Public Health) and EVO Grant from Pirkanmaan sairaanhoitopiiri, TAYS to Lily Nosraty.