
Abstract
Hispanics are the fastest growing segment of the older adult population in the United States, and by 2050, they are expected to become the largest minority group of older adults in the country (Vincent & Velkoff, 2010). One of the key drivers of this increase is immigration. The older immigrant population has increased by 70% since 1990, and in 2010, almost 12% of the U.S. population aged 65 and older was born in another country (Population Reference Bureau, 2013).
Although Hispanics of immigrant origin tend to have a more favorable mortality rate than other groups, a significant proportion share a history of lifelong deprivation resulting from the processes of immigration and acculturation, and from lack of educational and occupational opportunities, inadequate access to health care, and exposure to discrimination. As a result, Hispanic immigrants reach the later years of life with substantially fewer economic resources and higher rates of chronic conditions and functional limitations than native-born counterparts and non-Hispanic Whites (R. J. Angel, 2009; J. L. Angel, Rote, Brown, Angel, & Markides, 2014; Markides & Gerst, 2011).
A long life without regard to its quality casts doubt on the ultimate benefits of longevity and calls for a better understanding of factors that promote quality in later life. Life satisfaction is an indicator of quality of life that has been associated with successful aging (R. J. Angel, 2009). Older adults with higher levels of life satisfaction have been shown to have better physical and cognitive function (Diener & Chan, 2011; St. John, Mackenzie, & Menec, 2015), fewer doctor visits (Kim, Park, Sun, Smith, & Peterson, 2014), lower risk of cognitive impairment (Boyle, Buchman, Barnes, & Bennett, 2010), and lower risk of physical decline (Ostir, Ottenbacher, & Markides, 2004).
Life satisfaction is distinct from other indicators that have been traditionally used to study the quality of life of older adults, such as depressive symptoms (Nes et al., 2012; Ostir, Markides, Black, & Goodwin, 2000), which tends to focus on deficits in emotional functioning, or health-related quality of life (Dunn et al., 2013; Moons, Budts, & De Geest, 2006), which tends to focus on perceived health status. Life satisfaction is seen as the evaluation of one’s life as a whole; it captures peoples’ contentment with their life according to their own standards (Pavot & Diener, 1993). As such, it does not pre-impose a specific set of factors thought to comprise a fulfilling life, allowing individuals to do a cognitive appraisal of what elements are important for their own quality of life.
Life satisfaction, thus, can be understood as a more comprehensive indicator of successful aging that includes these health-related components as well as other cultural, social, and economic dimensions of quality of life. This distinction may be particularly important for understanding the factors associated with quality of life of older Hispanic immigrants relative to more privileged groups of older adults, as it opens the possibility for some factors, such as social support or cultural practices, to have more relevance than others, such as functional limitations or economic insecurity.
However, despite the rapid increase of the Hispanic immigrant older adult population in the United States and the importance of understanding the factors that may contribute to their successful aging, we know very little about their life satisfaction, relative to native-born Hispanics and non-Hispanic Whites, or the factors that might be associated with such satisfaction. This article explores these issues using a large, nationally representative sample of older adults in the United States.
Disparities in the Life Satisfaction Among Older Hispanic Immigrants: Theory and Evidence
The stratification theory of well-being suggests that unequal societal structures result in differential allocation of resources to its members and that life satisfaction will be higher among those with more resources (George, 2010). The rationale is that individuals with more material and social resources would be better able to satisfy their basic needs and to protect themselves against adverse life circumstances (Johnson & Krueger, 2006). Non-Hispanic White older adults in the United States usually have more resources than their Hispanic counterparts—particularly Hispanic immigrants. Accordingly, they should be more satisfied with life than their more disadvantaged Hispanic peers.
Although there is very little research exploring this hypothesis, the few studies that do have yielded inconsistent results, and most were conducted more than a decade ago with non-representative samples of the population. For instance, a study conducted with a sample of older rural Hispanics (n = 556) and non-Hispanic Whites (n = 486) found that older Hispanics were more satisfied with their lives than their non-Hispanic White counterparts (Baxter et al., 1998). Although income was associated with the life satisfaction of both groups, education only contributed to the life satisfaction of older non-Hispanic Whites. These findings suggest that some factors associated with life satisfaction later in life behaved differently across ethnic groups. By contrast, another study of Hispanics 65 to 75 years of age from the San Francisco’s Mission District (n = 270) revealed that, relative to a national sample of non-Hispanic older adults, less than half of Hispanics in the sample were satisfied with their lives. Concerning correlates of life satisfaction, more satisfied Hispanics earned more money and had more years of education than less satisfied counterparts. Interestingly, family relations and religion were more important for the life satisfaction of older Hispanics than for non-Hispanics, again supporting the hypothesis that some resources associated with the life satisfaction of older adults behave differently across ethnic groups (Lang, Muñoz, Bernal, & Sorensen, 1982). More recently, a study compared the life satisfaction of 126 English-speaking Hispanics with that of 126 non-Hispanic Whites 50 years of age and older. Results showed that even after controlling for health and for indicators of social and emotional functioning, older Hispanics were more satisfied and that higher spirituality among Hispanics accounted for the ethnic disparities (Marquine et al., 2014)
The only study that we could locate that tested for nativity differences in life satisfaction among older Hispanics did not find significant differences between a group of older Mexican immigrants (n = 148) and native-born Mexican Americans (n = 205). Regardless of nativity, Mexicans with more economic and social resources were more satisfied with their lives. However, nativity status and years of residency in the United States were not associated with life satisfaction, suggesting that nativity disparities in life satisfaction later in life may have been confounded with disparities in economic and social factors (Cuellar, Bastida, & Braccio, 2004).
In sum, although prior research indicates that disparities might exist in the life satisfaction of older Hispanic immigrants, relative to native-born Hispanic and to non-Hispanic White counterparts, it remains unclear exactly where those disparities lie and the extent to which factors associated with life satisfaction later in life account for these differences. Although there have been studies that have looked at differences in life satisfaction among older Hispanic immigrants compared with native-born Hispanics (i.e., nativity differences among Hispanics) and there has been studies that have looked at differences in life satisfaction among older Hispanics in the United States compared with older non-Hispanic Whites in the United States (i.e., ethnicity differences), none have looked at the interaction between nativity and ethnicity, which might have contributed to the mixed findings seen in the literature
Using a nationally representative sample of adults aged 60 and older, the main purpose of this study was (a) to investigate potential disparities in the life satisfaction of older Hispanics and non-Hispanic White older adults by ethnicity and nativity and, if found, (b) to identify factors associated with such disparities. A better understanding of the factors associated with the life satisfaction of older Hispanic immigrants can assist in the development of programs that improve the quality of life of one of the most vulnerable group of older adults in the United States.
Although many potential factors may lead to disparities in life satisfaction, we follow previous literature and focus on determinants of life satisfaction in older adulthood that have received substantial empirical support: socioeconomic status (SES), health, social integration, social relationships and social support, and perceived discrimination (George, 2010; Matz-Costa, Besen, James, & Pitt-Catsouphes, 2014; Sutin, Stephan, Carretta, & Terracciano, 2015).
Method
Data and Sample
Our sample was drawn from the Health and Retirement Study (HRS). The HRS is a population-based, longitudinal survey of adults above the age of 50 in the United States. It oversamples for Hispanics and has been conducted biannually since 1992 (Sonnega et al., 2014). We use the psychosocial Leave-Behind-Questionnaire (LBQ), which was piloted in the core HRS study in 2004, but began in earnest in 2006. The LBQ surveys half of the HRS sample each biannual wave. In 2006, the first half of the HRS households was randomly selected to complete the LBQ. The other half of the HRS households completed the psychosocial LBQ in 2008. The response rate was 90%. In subsequent biannual waves, the same rotation continues with new panel members added at random to the rotation. For the purposes of this study, we created a pooled sample of all individuals who completed the LBQ in any of the four waves (2006, 2008, 2010, and 2012), using the most recent completed wave of data available. Individuals 60 years of age and older, who self-identified as Hispanic or as non-Hispanic White, were included in our final sample (N = 9,798).
Measures
Dependent variable
Life satisfaction was measured with the Satisfaction With Life Scale (SWLS; Diener, Emmons, Larsen, & Griffin, 1985). The SWLS has excellent psychometric properties and has been widely used to assess subjective well-being (Pavot & Diener, 1993). It contains five items: (a) “In most ways my life is close to ideal,” (b) “The conditions of my life are excellent,” (c) “I am satisfied with my life,” (d) “So far, I have gotten the important things I want in life,” and (e) “If I could live my life again, I would change almost nothing.” A 6-point Likert-type scale ranging from 1 (strongly disagree) to 6 (strongly agree) was used in waves from 2008-2012 and a 7-point scale with the same endpoints was used in 2006. To standardize the SWLS across the four waves included in this study, we first calculated the average score for all five items in the life satisfaction instrument, then scores were scaled to range from 0 to 1 and multiplied by 100 (e.g., if someone had a score of 6 out of a possible 7, they were scaled to a score of 86 out of 100). Cronbach’s alpha for the SWLS was .88
Independent variable
Our main variable of interest combined information on race/ethnicity and nativity status. To capture race/ethnicity, first, we created a non-Hispanic White/Hispanic of any race group variable using respondents’ answers to two questions: (a) “Do you consider yourself Hispanic or Latino?” and (b) “Do you consider yourself primarily White or Caucasian, Black or African American, American Indian, or Asian, or something else?” Next, nativity status (native/immigrant) was determined using participants’ responses to the question of whether they were born in the United States. We combined these two variables to create a three-level categorical variable: non-Hispanic Whites, native-born Hispanics of any race, and foreign-born Hispanics of any race.
Covariates
We included two demographic characteristics: age and sex. Age was measured as the age in years of the respondent at baseline. Sex was dichotomously coded as: 1 = female, 0 = male.
We measured SES with respondents’ education and wealth. Education included completed years of schooling, ranging from 0 to 17. Wealth is a standard measure in the HRS that included all economic assets of the respondent less all debt. We adjusted for the asymmetry of the wealth distribution by transforming this variable using an inverse hyperbolic sine.
Health was measured using a comprehensive indicator of functional limitations. Specifically, our measure was a count of deficits in (a) walking ½ mile (5 to 6 blocks), (b) walking around in the house, (c) getting out of a bed or chair, (d) walking up a flight of stairs (about 10 steps), (e) shopping for personal items, (f) preparing meals, (g) managing money such as paying bills, (h) using the telephone, (i) feeding oneself, (j) dressing oneself, (k) bathing oneself, (l) getting to and using the toilet, (m) lifting or carrying something as heavy as 10 pounds, (n) reaching out and above head with arms, and (o) gripping small objects with hands. Our measure is a sum of all items, ranging from 0 to 15.
Social integration included indicators of religious participation and productive engagement. Religious participation was based on the following question: “How often do you attend religious services?” with those who indicated attending at least once per month coded as 1 and all others as 0. Two indicators of productive engagement were included: volunteer work and employment. Respondents were asked if they had “spent any time in the past 12 months doing volunteer work for religious, educational, health-related or other charitable organizations.” Those who responded yes were coded as 1 and those who said no were coded as 0. In addition, individuals who reported working for pay were coded as a 1 and those who were not working were coded as 0.
We used five dichotomous indicators to measure respondent’s social networks and social support. Two of the indicators related to household composition: (a) whether co-resides with a child and (b) whether married. A third indicator measured respondents’ perceived social support by asking, “Suppose in the future, you needed help with basic personal care activities like eating or dressing. Do you have relatives or friends (besides your husband/wife/partner) who would be willing and able to help you over a long period of time?” Finally, participants’ social networks were captured using two items indicating whether or not the respondent has (a) good friends and (b) relatives living nearby.
Perceived discrimination was measured using items designed to tap into the hassles and chronic stress associated with perceived everyday discrimination (Williams, Yu, Jackson, & Anderson, 1997). Five items were included in 2006 and six items were included in the other waves. Respondents were asked how often any of the following things have happened to them: “You are treated with less courtesy or respect than other people,” “You receive poorer service than other people at restaurants or stores,” “People act as if they think you are not smart,” “People act as if they are afraid of you,” “You are threatened or harassed,” and “You receive poorer service or treatment than other people from doctors or hospitals.” Responses ranged from 1 (almost every day) to 6 (never). We created a scale by reverse coding and then averaging the scores of the five or six questions. Higher numbers indicated higher levels of discrimination. The Cronbach’s α for this scale was = .81.
Analytic Strategy
Our data analysis strategy was comprised of three steps. First, we used a one-way ANOVA to compare the correlates of life satisfaction later in life across groups. Second, we estimated ordinary least squares (OLS) regression models to examine potential disparities in life satisfaction among older Hispanic immigrants relative to their native-born Hispanic and non-Hispanic White counterparts. We used White older adults as the reference group. In Model 1, we regressed life satisfaction on the three groups. In Model 2, we adjusted for correlates of life satisfaction later in life: demographic characteristics, SES, health, social integration, social relationships and support, and perceived discrimination. Our third step tested for interaction effects between each covariate and our three groups to investigate whether correlates of life satisfaction behaved differently across groups. Significant interaction effects were tested using adjusted Wald tests, and we reported only those that were determined to be significant after adjusting for all other factors. To further examine these significant interaction effects, we calculated marginal probabilities of life satisfaction holding all other covariates in the model at their mean. We conducted analyses using Stata SE 13.
Results
Bivariate Results
Table 1 summarizes the characteristics of respondents overall and by group. On average, older Hispanic immigrants reported higher levels of life satisfaction (M = 72.23) than their native-born peers (M = 68.69) and older Whites (M = 71.14). Concerning demographic characteristics, Whites were, on average, slightly older than both groups of Hispanic elders. In addition, Hispanic immigrants had a slightly higher concentration of women in their sample. Regarding SES, White older adults had, on average, almost twice the years of schooling (12.99) than older Hispanic immigrants (7.14) and substantially more education than native-born Hispanics (10.28). In addition, they were, on average, more than twice as wealthy (10.93) as Hispanic immigrants (4.74) and substantially wealthier than native-born Hispanics (7.52). In terms of functional limitations, older Hispanic immigrants had more functional limitations (3.25), on average, than both native-born Hispanics (2.93) and older Whites (2.40).
Overall Characteristics of the Sample and Stratified by Race/Ethnicity and Immigration Status.
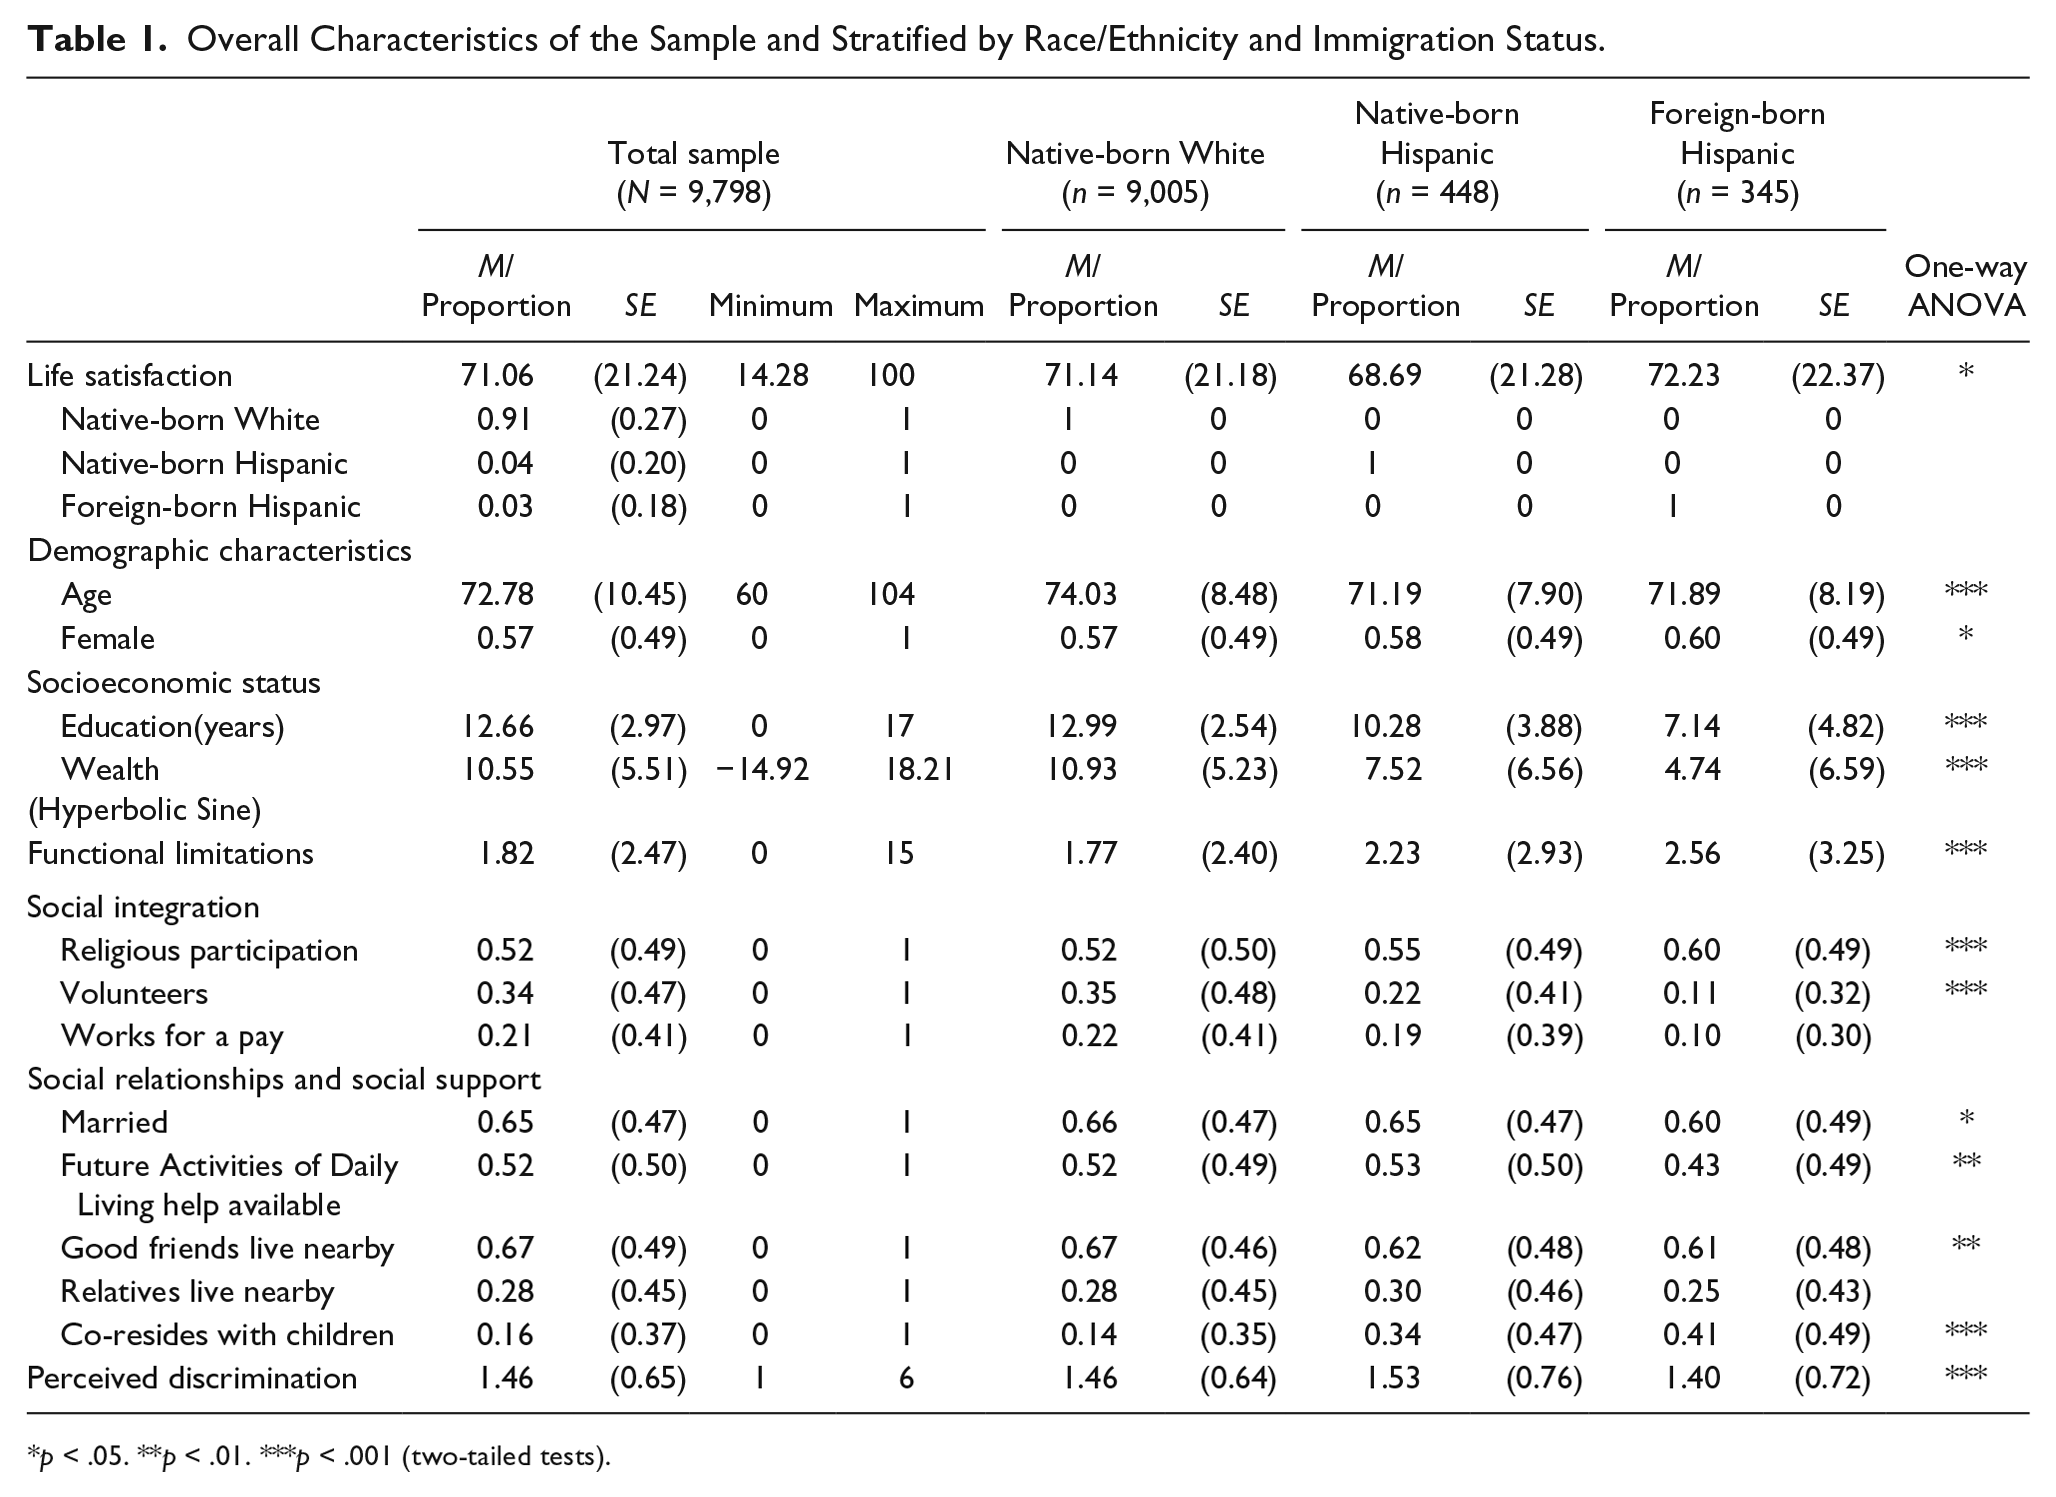
p < .05. **p < .01. ***p < .001 (two-tailed tests).
Regarding indicators of social integration, Hispanic immigrants were more likely to attend religious services (60%) than both native-born Hispanics (49%) and non-Hispanic Whites (52%). In contrast, whereas more than a third of older Whites engaged in volunteering activities, only 22% of older native-born Hispanics and 11% of older Hispanic immigrants volunteered. Groups did not differ on the likelihood of working for a pay. Concerning social relationships and social support, a slightly greater percentage of non-Hispanic White older adults were married (66%), relative to native-born Hispanics (65%) and to Hispanic immigrants (60%). In addition, only 43% of Hispanic immigrants reported they had future help available with Activities of Daily Living, relative to 53% of native-born Hispanics and to 52% of non-Hispanic Whites. Hispanic immigrants were also less likely to have good friends living nearby relative to counterparts. In contrast, they were the most likely group to co-reside with their children (49%), followed by native-born counterparts (47%) and by non-Hispanic Whites (14%). Finally, in terms of perceived discrimination, older native-born Hispanics reported the most frequent experiences of daily discrimination, whereas immigrant counterparts reported the lowest.
Multivariate Results
Table 2 presents the results from the regression models. Model 1 shows that Hispanic immigrants were more satisfied with their lives than non-Hispanic White elders whereas native-born Hispanics were less satisfied. Adjusting for correlates of life satisfaction in Model 2 eliminated differences in life satisfaction for native-born Hispanics, but not for Hispanic immigrants. Figure 1 represents this effect using adjusted predicted probabilities and shows that older Hispanic immigrants had, on average, higher levels of life satisfaction relative to their native-born Hispanic and non-Hispanic White counterparts.
OLS Models of Life Satisfaction Among Older Adults.
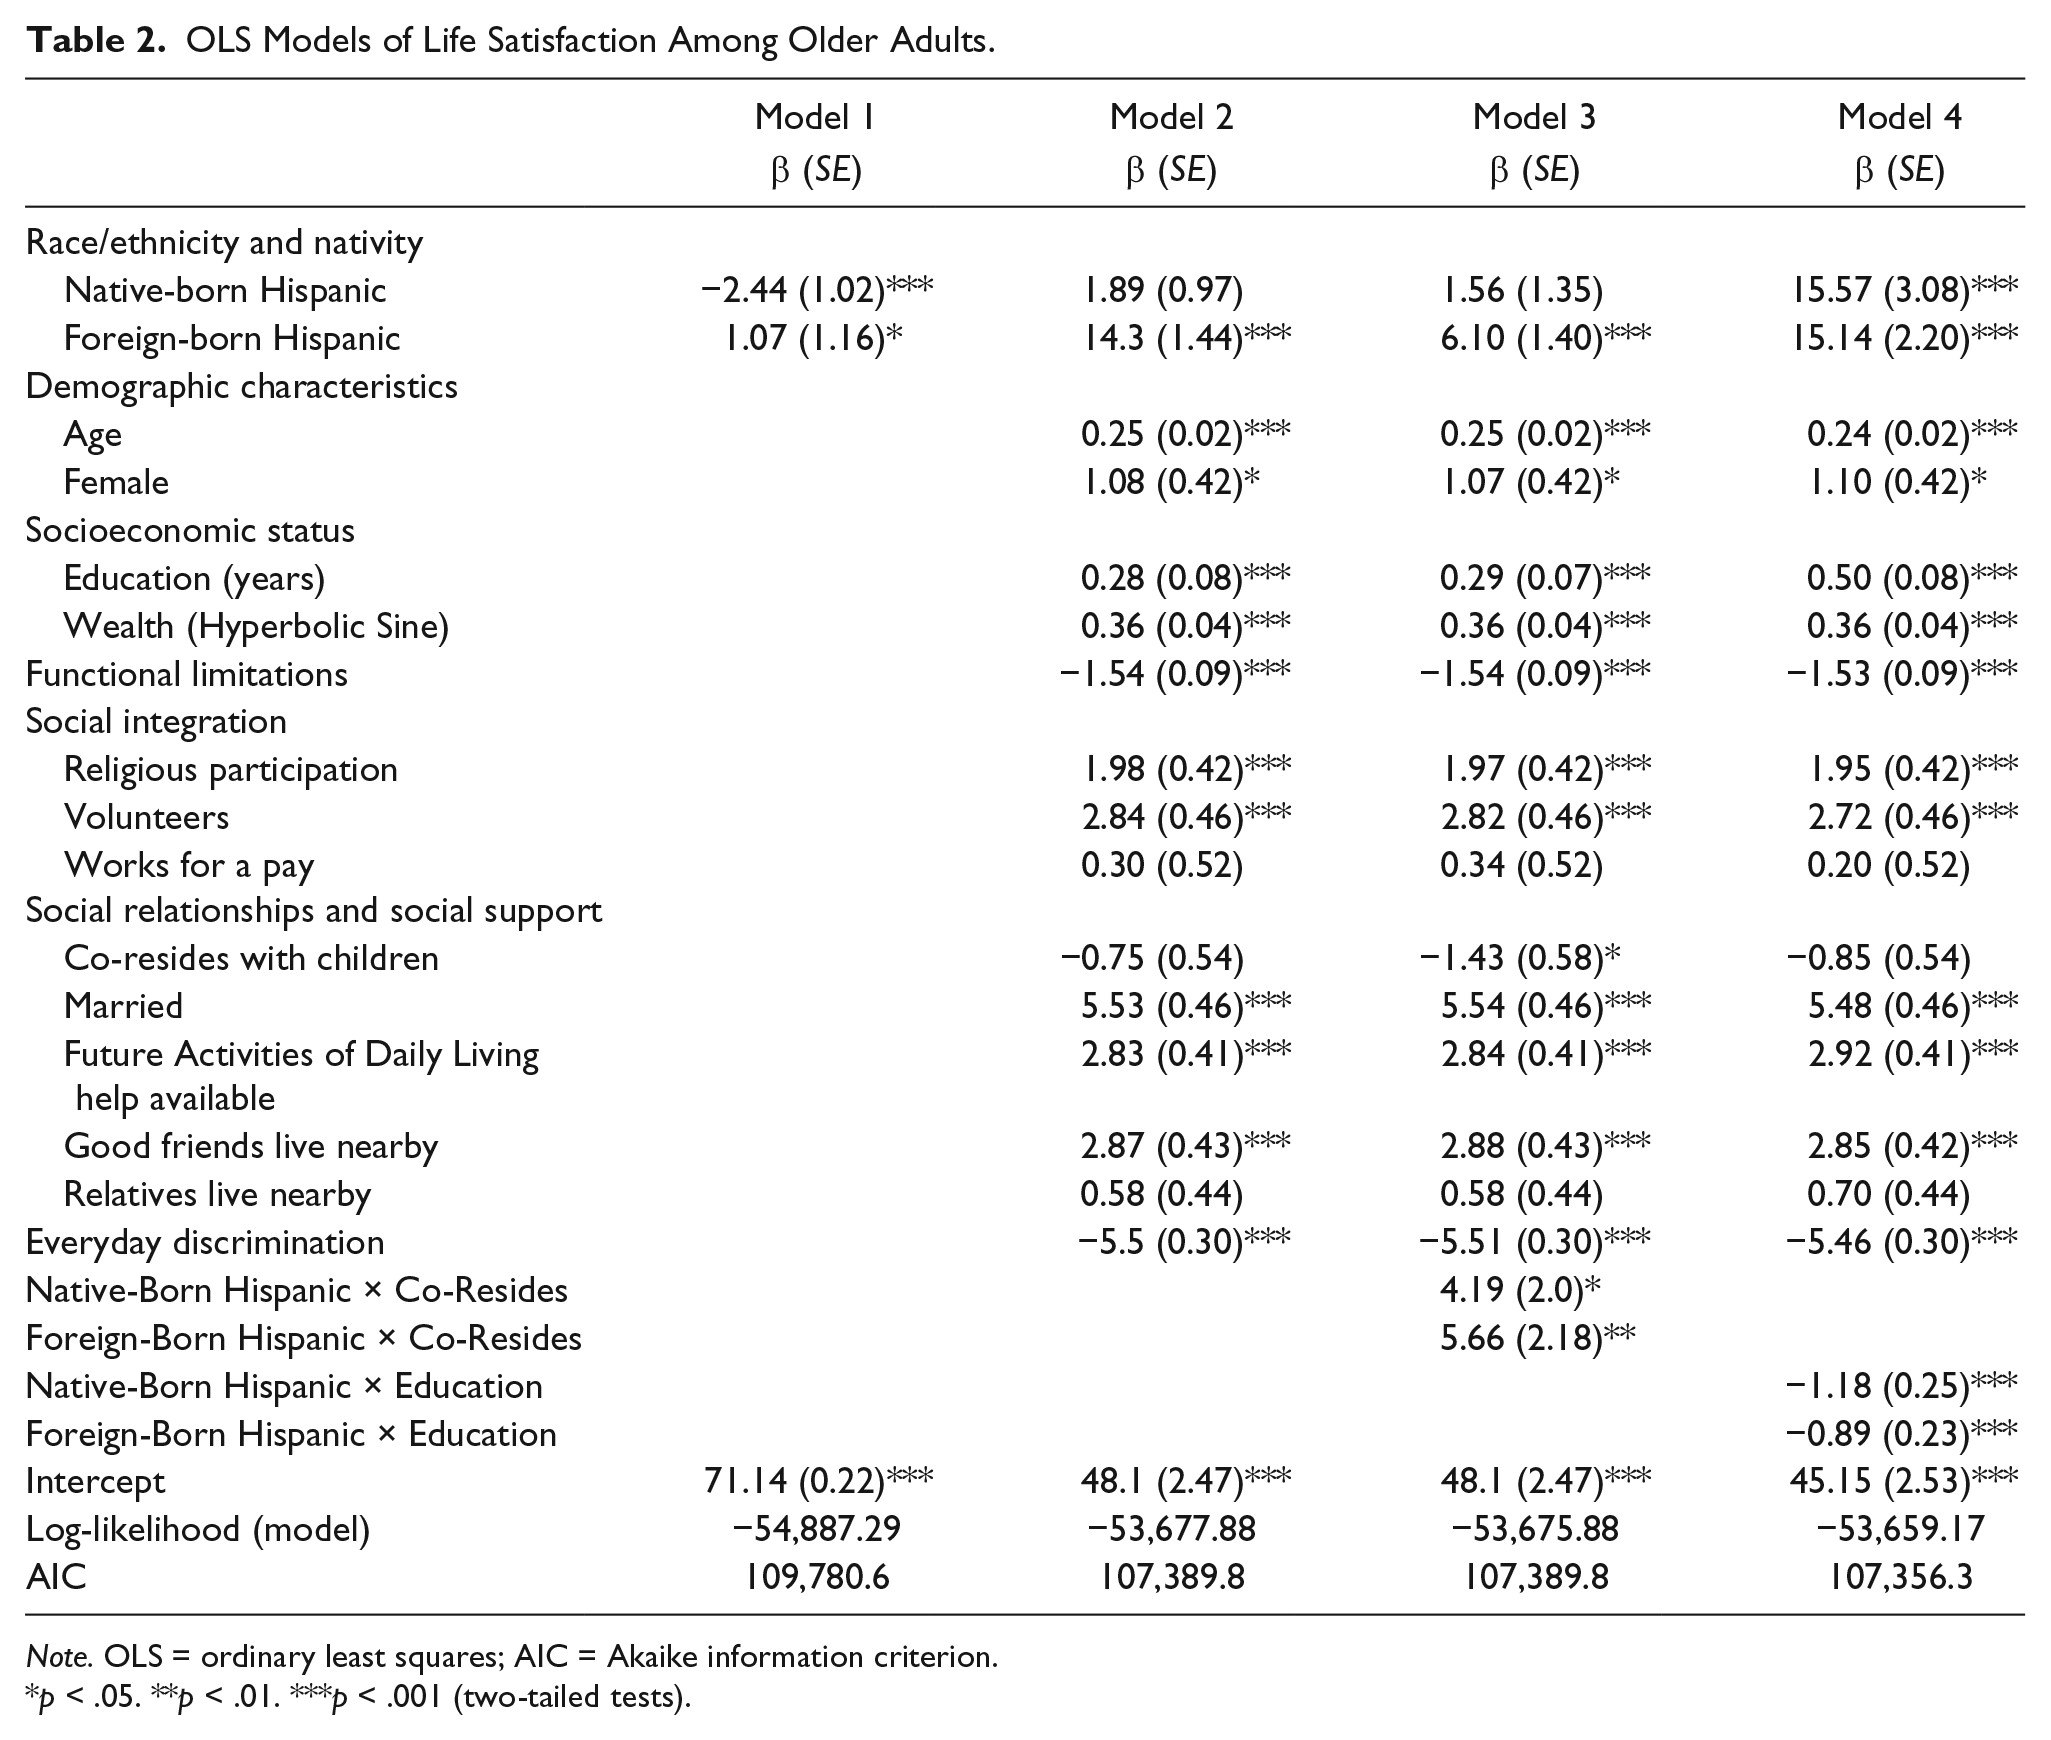
Note. OLS = ordinary least squares; AIC = Akaike information criterion.
p < .05. **p < .01. ***p < .001 (two-tailed tests).
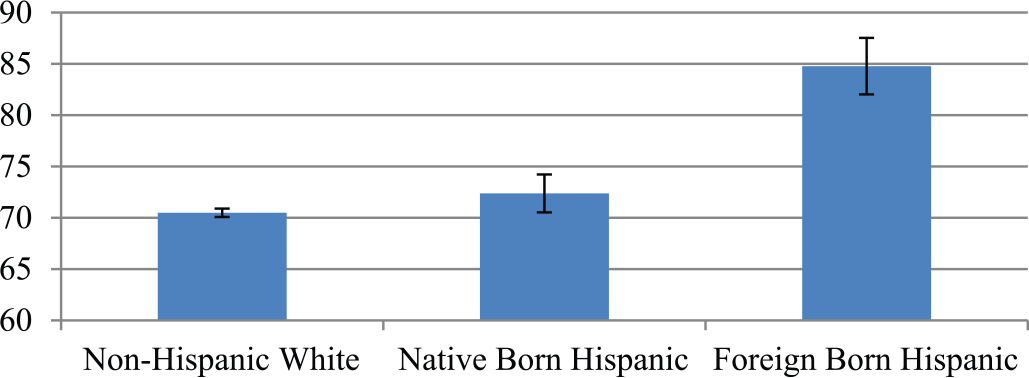
Predicted probabilities of life satisfaction.
Models 3 and 4 included significant two-way interactions between the correlates of life satisfaction and race/ethnicity/immigration status. Model 3 shows the interaction between co-residing with children and life satisfaction. Figure 2 provides the calculated adjusted predicted probabilities, showing that although co-residing with children was related to low levels of life satisfaction among non-Hispanic White older adults, it was related to greater life satisfaction for both Hispanic groups.
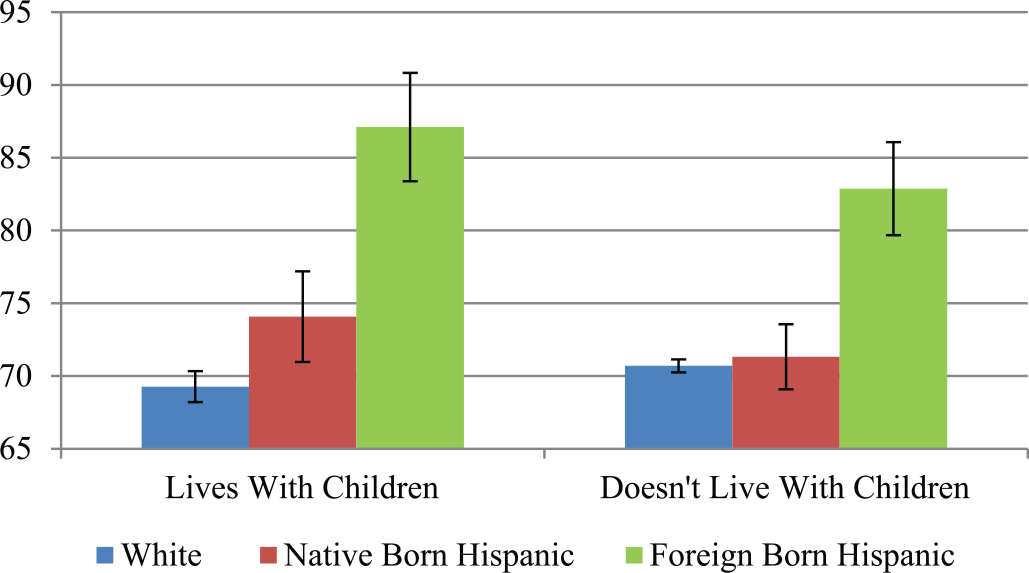
Predicted probabilities of life satisfaction by co-residing with children.
Similarly, Model 4 shows the interaction between education and life satisfaction, and Figure 3 provided the calculated adjusted predicted probabilities. Whereas non-Hispanic White older adults with higher levels of education reported greater life satisfaction, the relationship between education and life satisfaction was negative for Hispanics, especially for native-born Hispanics.
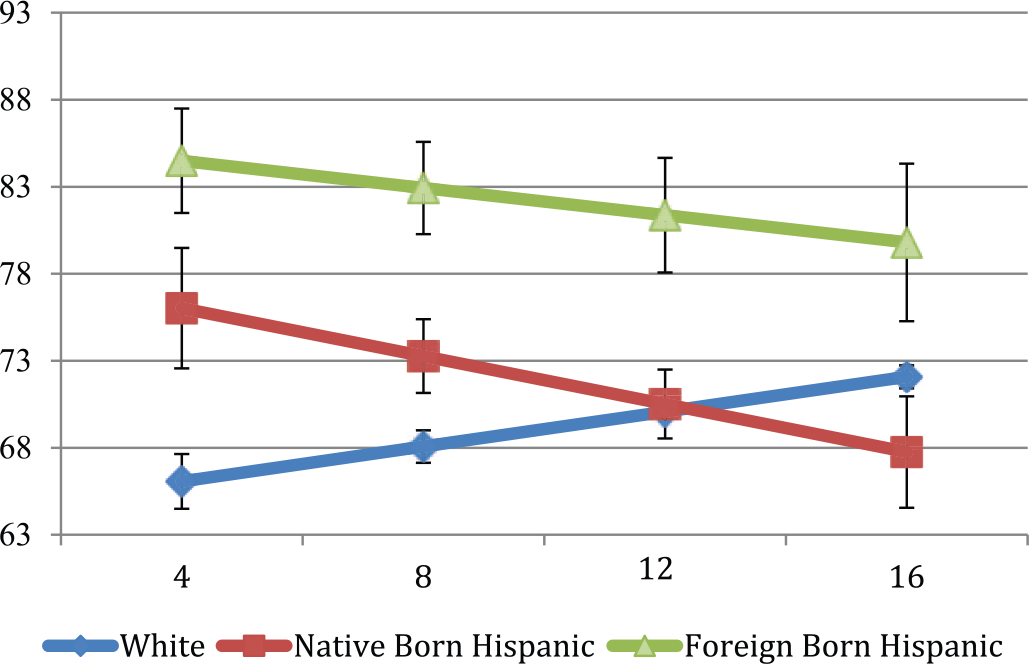
Predicted probabilities of life satisfaction by years of education.
Discussion
The main purpose of this study was to investigate potential disparities in the life satisfaction of older Hispanic immigrants, relative to their native-born Hispanic and non-Hispanic White counterparts and to identify factors associated with such disparities. We found that older Hispanic immigrants had the highest levels of life satisfaction of all groups, even after adjusting for correlates of life satisfaction. In addition, and in support of the social stratification theory of well-being, we found respondents’ SES, health status, degree of social engagement and social support, and absence of perceived discrimination to be associated with higher levels of life satisfaction.
We also found that not all correlates of life satisfaction behaved similarly across groups. Regardless of nativity, both education and co-residing with children had opposing effects on the life satisfaction of older Hispanics and non-Hispanic Whites. Although more educated, non-Hispanic Whites reported greater life satisfaction, Hispanics with more education (especially native-born) were less satisfied with their lives. This pattern is consistent with prior research (Baxter et al., 1998). One plausible explanation for the opposite relationship between education and life satisfaction between ethnic groups might stem from a discrepancy between expectations and achievement. It is conceivable that the social advancement and mobility associated with more education occurred less frequently among Hispanics than among non-Hispanic Whites in our sample. For instance, Massey and Akresh (2006) found that even after adjusting for difficulty in transferring foreign credentials, educated immigrants were less satisfied with their lives in the United States than uneducated counterparts because they had higher expectations about their post-migration life. Our results are in line with these findings. We showed that the negative relationship between education and life satisfaction was stronger for native-born Hispanics than for foreign-born Hispanics. Native-born Hispanics had, on average, more years of schooling than Hispanic immigrants. We are not aware of other studies that have examined the relationship between education and life satisfaction among older Hispanics by nativity. However, it is possible that the (dis)satisfaction associated with education among native-born Hispanics responds to a lifelong experience of facing structural barriers, such as discrimination, for socioeconomic advancement. This possibility would be supported by the fact that native-born Hispanics in our sample reported more daily experiences of discrimination than any other group, including Hispanic immigrants.
Similarly, although co-residing with children was associated with greater life satisfaction among older Hispanics, non-Hispanic Whites who lived with their children reported low levels of life satisfaction. This finding is in line with prior research that has shown that strong family support systems are associated with better health outcomes among older Hispanics (Markides, Angel, & Peek, 2013; Markides & Eschbach, 2011). Given the strong link between health and life satisfaction at older ages (Steptoe, Deaton, & Stone, 2015), this ethnic advantage might account for the positive relationship between co-residing with children and life satisfaction among older Hispanics in our sample.
Our findings are in contrast with the only other study that we could locate that examined nativity differences in life satisfaction among Hispanics. Cuellar et al. (2004) did not find significant differences in life satisfaction between a group of older Mexican immigrants and native-born Mexican Americans living in two counties on the Mexico–Texas border with a very high density of Mexican immigrants (up to 90%), significant poverty levels, limited English proficiency, and substantial daily movement across the Mexican–U.S. border. Our discrepant findings might stem from the potential lack of variation in key correlates of life satisfaction between the native-born and foreign-born populations living in the particular ethnic enclave of focus in the Cuellar et al. study, which may have made it difficult to capture the national nativity disparities between older Hispanics seen in our study.
Nevertheless, the fact that older Hispanic immigrants were the most satisfied group of older adults in our sample was counterintuitive and did not support the social stratification theory of well-being. Hispanic immigrants in our sample had the least amount of economic and social resources of all groups. They also had more functional limitations and less social support than counterparts. Our results are also in contrast with research that has shown that immigrants in the United States tend to be less satisfied with their lives than non-immigrants (Olgiati, Calvo, & Berkman, 2013) and with population-based studies in which Hispanics reported lower levels of life satisfaction than non-Hispanics (Coverdill, Lopez, & Petrie, 2011).
The higher levels of life satisfaction of Hispanic immigrants, however, are in line with the “Hispanic paradox.” The paradox originated when Markides and Coreil (1986) observed that older Mexicans in the United States had better health outcomes than non-Hispanic Whites despite their limited socioeconomic resources. Hypothesized explanations for the paradox are strong family supports, certain cultural practices, and selective migration (Markides et al., 2013). Interestingly, in terms of resources, older Hispanic immigrants in our sample were advantaged, relative to counterparts, on frequency of co-residing with children and church attendance. Resources that are aligned, respectively, with indicators of strong family support and certain cultural practices hypothesized in the paradox. Concerning selective migration, although we did not know the pre-migration levels of life satisfaction of Hispanics, there is evidence that individuals who are less satisfied with their lives are more likely to migrate than satisfied counterparts (Otrachshenko & Popova, 2014). Alternatively, our potential positive selection effect may stem from a higher mortality rate among dissatisfied older Hispanic immigrants. For instance, in a study conducted over an 8-year period to compare the well-being of older Mexican American and Anglos, deceased respondents had previously reported significantly lower levels of life satisfaction than individuals who remained in the study (Markides & Lee, 1990).
Social comparison is another mechanism that might explain the higher levels of life satisfaction of older Hispanic immigrants in the United States despite their comparative lack of resources. It is well established that the effect of resources on our life satisfaction is not absolute and depends on with whom we compare our achievements (George, 2010). We know that Hispanic immigrants in the United States compare themselves with peers from their country of origin throughout their lives (Gelatt, 2013). There is also evidence that older adults are more likely than middle-aged adults to use downward social comparisons (Gana, Alaphilippe, & Bailly, 2004). For instance, Beaumont and Kenealy (2004) found that the use of downward social comparisons was widely used among older adults, and that this strategy was positively associated with higher levels of life satisfaction. Many older Hispanics immigrants in our sample were long-term immigrants who came to the United States during their productive years. Perhaps immigrants in our sample compared their achievements later in life with those of friends and relatives from their home country, and this strategy contributed to increase their levels of satisfaction. There is evidence that immigrants tend to have higher levels of life satisfaction than stayers from their home countries (Erlinghagen, 2011). Alternatively, the high levels of life satisfaction of older Hispanics might stem from comparisons with themselves at the beginning of their migratory careers. Immigrants tend to improve economically with time in destination countries (Constant & Massey, 2005), and the high levels of life satisfaction of older adults in our sample may be related to an evaluation of their accomplishments throughout their migratory careers.
Further research is needed that explores how the life satisfaction of older Hispanic immigrants evolves with time in destination countries. We know that life satisfaction increases with age. However, it is unknown whether the pattern is similar for Hispanic immigrant and native-born individuals, or if correlates of life satisfaction might have a different effect on the life satisfaction of older Hispanic immigrants relative to native-born counterparts.
Findings from this study need to be understood in light of its limitations. First, there may be important differences within Hispanics sub-groups that we were not able to examine here due small sample sizes. In 2012, Mexicans were ranked as the largest (at 64%) Hispanic group in the United States, followed by Puerto Ricans (9.4%), Salvadorans (3.8%), Cubans (3.7%), Dominicans (3.1%), Guatemalans (2.3%), and the remaining 13.7% were people of other Hispanic or Latino origins (U.S. Census Bureau, 2014). Future research should explore variation in life satisfaction and the determinants of life satisfaction between these many sub-groups, as social and material resources accumulated over a lifetime as well as experiences of discrimination may differ among these groups.
A second limitation is that we were not able to account for variability in the timing of entry into the United States for immigrants. Only 2% of our sample had been in the United States for less than 10 years. Our immigrant sample was primarily composed of long-term U.S. immigrants who had been living in the United States for an average of 42 years. Results should be considered in light of this limitation. For instance, although Hispanics who would have came to the United States earlier in life would have had more opportunities to accumulate resources, research has shown that Mexicans who migrated during adulthood had better health outcomes than counterparts who came earlier in life (R. J. Angel, Angel, Díaz Venegas, & Bonazzo, 2010). Further research should examine how age at migration affects the life satisfaction of older Hispanic immigrants.
A third limitation is the small sample size for this analysis relative to the sample available if the entire HRS (due to the LBQ representing a subsample of the HRS sample). This limited the power of our analyses to find smaller effect sizes. Larger sample sizes for the Hispanic immigrant and native-born Hispanic groups would be preferable for the accuracy of estimates.
A fourth limitation is that we did not include other variables, such as ethnic concentration, that have been found to be associated with better health outcomes among Hispanics. For instance, Patel, Eschbach, Rudkin, Peek, and Markides (2003) found that older Mexican Americans who lived in neighborhoods with higher concentrations of co-ethnics reported better self-rated health, a variable closely related to life satisfaction in later life. Finally, the study relied on cross-sectional data. Although a longitudinal design may have permitted stronger causal inferences to be drawn about the existence of effects, sufficient longitudinal data were not available for this analysis due to reductions in sample sizes across multiple waves of HRS data. Given this, caution should be exercised in interpreting findings, and future work should look at these relationships in a longitudinal context.
Conclusion
The confluence of two of the largest demographic changes of the 21st century in the United States—population aging and the growth of the Hispanic demographic—demands our attention. An important question that we are facing as a society is, what can be done to ensure that increased life spans are met with increased quality of life among all older adults? By identifying factors that contribute to variation in life satisfaction among different groups of older adults, we come closer to being able to identify programmatic approaches to address this critical question. For instance, because co-residing with children is associated with lower life satisfaction among older non-Hispanic Whites, facilitating alternative means of obtaining filial support in later life may enhance the well-being of older adults in this group. Alternatively, for native-born Hispanics and foreign-born Hispanics, encouraging such co-residing could be beneficial, and efforts to enhance opportunities for successfully maintaining intergenerational households are warranted. The current study makes an important contribution to theory and knowledge building in this area, as it is the first to our knowledge that uses a nationally representative sample to explore disparities in life satisfaction among older Hispanic immigrants. By using a relatively large, nationally representative sample of older adults in the United States, a standard measure of life satisfaction, and adjusting for a comprehensive set of correlates known to be associated with life satisfaction in old age, we offer a cautious conclusion that there may be another Hispanic paradox at play when it comes to the life satisfaction of older adult native-born Hispanics and Hispanic immigrants relative to their non-Hispanic White peers.
Footnotes
Authors’ Note
The content is solely the responsibility of the authors and does not necessarily represent the official views of the Institute on Aging. The funder did not have any role in the study design, in the collection analysis and interpretation of data, in the writing of the report, or in the decision to submit the article for publication.
Declaration of Conflicting Interests
The authors declared no potential conflicts of interest with respect to the research, authorship, and/or publication of this article.
Funding
The authors disclosed receipt of the following financial support for the research, authorship, and/or publication of this article: An Aging Research Incentive Grant (ARIG) from the Boston College’s Institute on Aging supported research reported in this manuscript.