
Abstract
Introduction
Fatigue is an important indicator of health among older populations worldwide. It is associated with long-term functional decline (Avlund, Pedersen, & Schroll, 2003; Glynn et al., 2015), disability (Avlund, Damsgaard, Sakari-Rantala, Laukkanen, & Schroll, 2002; Avlund, Rantanen, & Schroll, 2006; Avlund, Vass, & Hendriksen, 2003; Fieo, Mortensen, Rantanen, & Avlund, 2013; Schultz-Larsen & Avlund, 2007), various health indicators (such as oral health) (Avlund, Holm-Pedersen, & Schroll, 2001; Ekmann, Petersen, Manty, Christensen, & Avlund, 2013; Manty, Ekmann, Thinggaard, Christensen, & Avlund, 2012), and mortality (Avlund, Schultz-Larsen, & Davidsen, 1998; Schultz-Larsen & Avlund, 2007). However, despite fatigue’s well-established predictive association with indicators of health among elders, the pathway from fatigue to disablement is still poorly understood, prompting a request by the National Institute of Aging for research on fatigability among older populations.
At present, fatigue is best measured using self-report. Various scales have been established and validated to assess fatigue among older populations, including the Lower Limb Tiredness Scale (Avlund et al., 2002; Avlund et al., 2006), the modified Piper Fatigue Scale (Liao & Ferrell, 2000), and the Fatigue subscale of the Short Form–36 (Bennett, Stewart, Kayser-Jones, & Glaser, 2002). More recently, the Pittsburgh Fatigability Scale for older adults was developed to better conceptualize fatigue by normalizing activities in terms of intensity and duration (Glynn et al., 2015). However, the most common form of assessment for mobility-related fatigue is the Avlund Mobility–Tiredness (Mob-T) scale. The Mob-T scale has been validated and used extensively among older populations (Avlund, Kreiner, & Schultz-Larsen, 1993; Schultz-Larsen, Avlund, & Kreiner, 1992). It is a summary scale that evaluates fatigue associated with six different mobility tasks.
Although the Mob-T score has been linked with long-term mobility decline, no study has examined the relationship between task-specific fatigue reported on individual Mob-T items and corresponding actual task performance. This is true for other scales used in the evaluation of fatigue among older adults as well, where no association between task-specific fatigue and task performance has been demonstrated. Evidence of these relationships for task-specific fatigue would lend support for their use as individual screening items within the context of clinical care or research. Knowing if an individual was experiencing fatigue with a specific functional task (i.e., walking, rising from a chair, or climbing stairs) might inform the content of rehabilitative care for older adults who have undergone hip fracture or joint replacement surgery where performance of these tasks is directly tied to treatment goals.
To address this knowledge gap, we conducted a cross-sectional analysis of baseline data collected as part of the Boston Rehabilitative Impairment Study of the Elderly (Boston RISE; Holt et al., 2013). We first aim to describe the demographic, medical, and physiologic characteristics of people who experience fatigue in three important mobility tasks (rising from a chair, walking indoors, and climbing stairs). Our second aim is to examine the factors associated with task-specific fatigue. Finally, we aim to examine the association between task-specific fatigue status and matched task performance.
Method
Study Population
Boston RISE includes 430 community-dwelling primary care patients aged 65 years or older who expressed difficulty or task modification while walking half a mile or climbing a flight of stairs. All participants live in the Boston area and speak English. Exclusion criteria included participants with a terminal disease, major surgery or myocardial infarction in the past 6 months, planned major surgery, major medical problem that would interfere with a safe testing experience, planned move from the Boston area in the next 2 years, Mini–Mental State Examination (MMSE) score <18, or very limited mobility measured as a Short Physical Performance Battery (SPPB) score <4. For this study, we used baseline data collected between 2009 and 2012.
Fatigue
Fatigue was assessed using the Mob-T scale, which examines perceived mobility tiredness in daily tasks. The scale consists of six questions that ask participants first whether or not they are able to complete a task, and if they can, then whether or not they get tired while doing it. Tasks include transferring from a chair or bed, walking indoors, getting outside, climbing two flights of stairs, walking outdoors in good weather for 30 to 60 min, and walking outdoors in poor weather for 30 to 60 min. We examined responses to three of the six Mob-T questions: transferring from a bed or chair, walking indoors, and climbing two flights of stairs. Participants who self-report inability to complete a task on the Mob-T are referred to in this article as self-reported inability to complete the task. Given the nature of the Mob-T scale, there is no corresponding fatigue data for these participants as fatigue questions were not asked of those who self-reported inability to complete a task. These three items were chosen because of their importance for daily living and because they correspond to standard performance tests included in the Boston RISE assessment.
Performance-Based Mobility Tests
We are assessing three separate performance-based mobility tests: rising from a chair, walking 4 m indoors, and climbing two flights of stairs. Transferring from a bed or chair was assessed using the timed chair stand component of the SPPB. Participants were considered to have successfully transferred from a chair if they were able to complete a single chair stand without using their arms. To complete the repeated chair stand, participants who had successfully done the single chair stand were asked to rise from a chair, with their hands crossed over their chest, five times as fast as they could safely do so. Participants were timed to the nearest 0.01 s using a stopwatch. Those who were unable to complete a single chair stand were excluded from our analysis.
Walking indoors was modeled using the 4-m walk test, which is also a component of the SPPB. The fastest gait speed of two trials was used. Participants were timed using a stopwatch to the nearest 0.01 s.
Performance while climbing two flights of stairs was assessed using the stair climb time (SCT) that was derived as part of the Stair Climb Power Test (Bean, Kiely, LaRose, Alian, & Frontera, 2007). Participants were timed while climbing a 2-m-high flight of stairs twice, using a handrail and/or cane if needed. Timing was done using a stopwatch, which was started when participants began moving and stopped when both feet reached the top step. Times were recorded to the nearest 0.01 s. The average time of the two completed trials was used for SCT. Analysis was done on all participants who completed a single stair climb. However, because the question for fatigue specifically asks about fatigue following two flights of stairs, participants who were able to complete only one flight of stairs were later excluded to see if the results changed significantly.
Adjustment Variables
Socio-demographic factors that were measured include age, body mass index (BMI), gender, and education. Education was dichotomized as completed high school (or an equivalent degree) or less and attended or completed college, graduate, or professional school.
The number of co-morbidities was assessed using the Self-Administered Co-morbidity Questionnaire, a validated scale that both assesses for common medical conditions among elderly populations and examines whether each condition necessitates treatment or limits activity (Sangha, Stucki, Liang, Fossel, & Katz, 2003). The number of co-morbidities is presented as a score from 0 to 11, with a higher score corresponding to an increased number and severity of co-morbidities.
Physical activity was measured with the Physical Activity Scale for the Elderly (PASE), a validated self-reported assessment of daily physical activity (Washburn, Smith, Jette, & Janney, 1993). The PASE is scored from 0 to 400 based on a participant’s individual level and frequency of activity in the previous 7 days, with a higher score indicating greater activity.
Depressive symptoms were assessed using the Patient Health Questionnaire–9 (PHQ-9), a subset of the PHQ focusing on depressive symptoms (Kroenke, Spitzer, & Williams, 2001). Participants who scored ≥5 on the 0 to 27 scale were classified as having depressive symptoms.
Cognitive ability was measured at baseline using the MMSE (Folstein, Folstein, & McHugh, 1975), and was scored from 0 to 30, with persons scoring less than 18 excluded from participation in the study. Higher scores indicate better cognitive functioning.
Global pain severity was assessed using the pain severity subscale of the Brief Pain Inventory (BPI; Cleeland, 1989). The subscale is the average of four pain severity ratings using a 0 to 10 numeric rating scale assessing pain at its least, worst, and on average in the past week, and current pain. Higher numbers are indicative of more pain.
Single leg strength was measured using a computerized pneumatic leg press machine (Keiser Pneumatic Leg Press; Fresno, CA) operated by trained research staff. Participants performed 6 to 12 repetitions to determine the one repetition maximum. Scores were normalized and reported as Newtons per kilogram body weight.
Analysis
Descriptive statistics were used to characterize participants at baseline according to self-reported fatigue in the three mobility tasks. Frequencies and proportions for categorical variables and mean and standard deviations for continuous variables were calculated. As 10% of values were missing for leg strength, we imputed missing values using techniques advocated by Carpenter et al. that provide strategies to address data missing at random as well as missing not at random (Carpenter, Kenward, & White, 2007). Imputed values were utilized for the remainder of the analysis.
Agreement between self-reported ability to perform specific tasks and demonstrated performance of the task was assessed using a kappa statistic (Landis & Koch, 1977), but was verified by running a Cramer’s V, Kendall’s tau-b, and phi statistic. In cases of full agreement or when only one category existed, kappa was not used, and only descriptive statistics are presented (Byrt, Bishop, & Carlin, 1993; Feinstein & Cicchetti, 1990). Confidence intervals were calculated using a “Clopper–Pearson” procedure.
Separate multivariable logistic regression models were constructed to identify factors that were most strongly associated with task-specific fatigue status. We used a manual backward elimination process as advocated for multivariable regression analyses by Sun, Shook, and Kay (1996). In our analysis, variables that were not significantly associated with fatigue status in any of the three tasks were excluded from the models. Any adjustment variable that was significantly associated with any one of the outcomes was included in all three models.
Separate multivariable linear regression models were constructed evaluating whether task-specific fatigue status was associated with the observed performance of each task (chair stand time, 4-m gait speed, and SCT). Each model was first adjusted for age and gender. We then manually performed backward elimination to remove variables not significantly associated with any of the three tasks. Our final model added leg strength to the preexisting variables. R2 values are given for each individual model. Chair stand tests for two participants were excluded because of extreme outlier values (times of 74 and 59 s, respectively, while the average was 15 s).
For all analyses, those who reported being unable to complete two flights of stairs on the Mob-T and subsequently did not report fatigue status were excluded from initial models, but were added to the “fatigued” group in a subsequent set of models to assess whether they altered the results. All model assumptions were examined and none were considered violated. An alpha level of <.05 was used to determine statistical significance.
Results
Of the 430 participants, 66 (15%) reported experiencing fatigue while transferring from a chair or bed, 70 (16%) while walking indoors, and 216 (50%) while climbing two flights of stairs (Table 1). Fifty-two (12%) reported they could not climb two flights of stairs. Age was not associated with self-reported fatigue. The characteristics that differed significantly by chair rise fatigue status include the number of co-morbidities, level of physical activity, pain severity, and leg strength. Characteristics that differed for walking fatigue include BMI, education level, number of co-morbidities, depressive symptoms, pain severity, and leg strength. Stair climb fatigue was associated with gender, BMI, level of education, number of co-morbidities, physical activity, depressive symptoms, and pain severity.
Characteristics of Participants From Boston RISE at Baseline Based on Fatigue Status (N = 430).
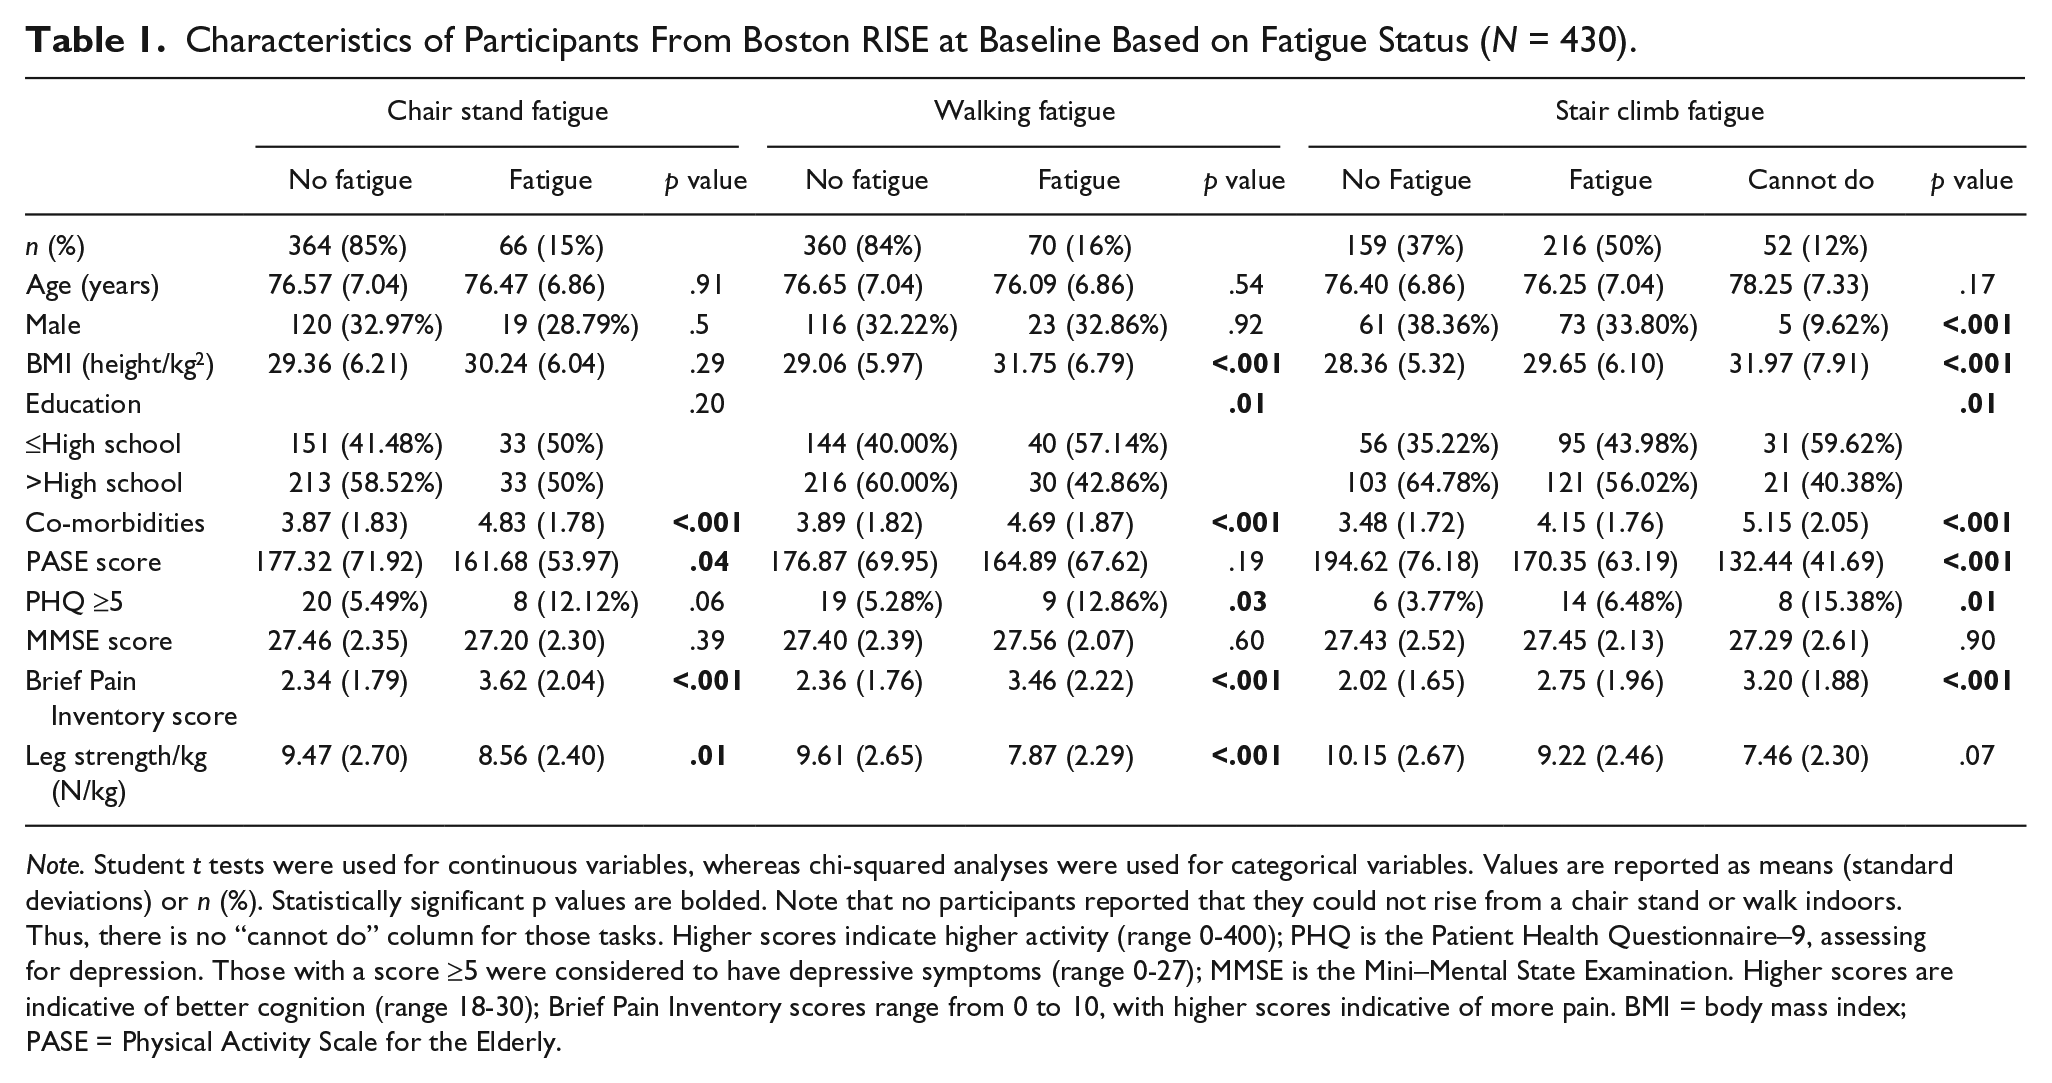
Note. Student t tests were used for continuous variables, whereas chi-squared analyses were used for categorical variables. Values are reported as means (standard deviations) or n (%). Statistically significant p values are bolded. Note that no participants reported that they could not rise from a chair stand or walk indoors. Thus, there is no “cannot do” column for those tasks. Higher scores indicate higher activity (range 0-400); PHQ is the Patient Health Questionnaire–9, assessing for depression. Those with a score ≥5 were considered to have depressive symptoms (range 0-27); MMSE is the Mini–Mental State Examination. Higher scores are indicative of better cognition (range 18-30); Brief Pain Inventory scores range from 0 to 10, with higher scores indicative of more pain. BMI = body mass index; PASE = Physical Activity Scale for the Elderly.
We evaluated the agreement between self-reported ability and performance for each of the three tasks using a kappa statistic. Agreement was fair to poor (κ = .27) between self-reported (n = 52, 12%) and observed (n = 66, 15%) inability to conduct the stair climb (data not shown). There was 100% agreement between those who felt they could walk indoors and those who were able to complete the 4-m walk test. All participants felt that they were able to complete the single chair stand, whereas not all were able to demonstrate the task. To avoid prevalence bias when reporting a kappa statistic, the Clopper–Pearson procedure was used to calculate the confidence interval for this group (Byrt et al., 1993; Feinstein & Cicchetti, 1990). There was a 96% agreement between those who felt they could and were able to complete the single chair stand (confidence interval = [94.0%, 97.9%]).
Using multivariable adjustment, we found that the number of co-morbidities and level of pain were independently associated with chair stand fatigue (Table 2). Gender, pain, and leg strength were independently associated with walking fatigue. Characteristics that were significantly associated with stair climb fatigue include the number of co-morbidities, physical activity level, pain, and leg strength. Pain severity was the only characteristic associated with all three measures of fatigue. Within a post hoc analysis, when those who self-reported they could not climb two flights of stairs on the Mob-T and thus had no data for self-reported fatigue (n = 52) were combined with the fatigue group, the results did not meaningfully change.
Separate Multivariable Logistic Regression Models Evaluating Attributes Associated With Task-Specific Fatigue Status.
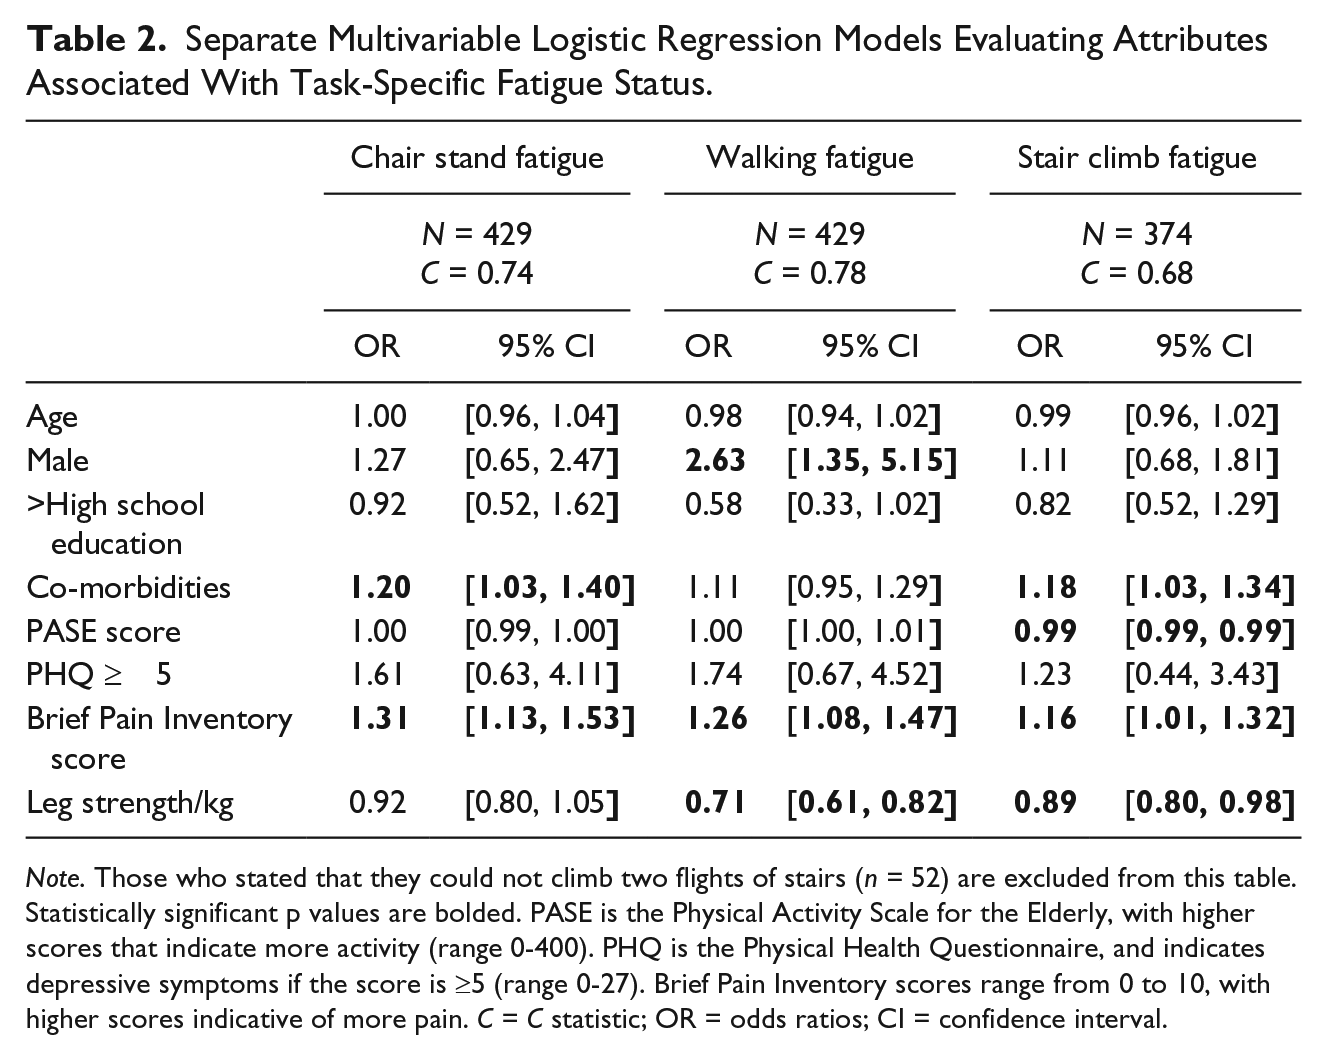
Note. Those who stated that they could not climb two flights of stairs (n = 52) are excluded from this table. Statistically significant p values are bolded. PASE is the Physical Activity Scale for the Elderly, with higher scores that indicate more activity (range 0-400). PHQ is the Physical Health Questionnaire, and indicates depressive symptoms if the score is ≥5 (range 0-27). Brief Pain Inventory scores range from 0 to 10, with higher scores indicative of more pain. C = C statistic; OR = odds ratios; CI = confidence interval.
When we examined the association between self-reported fatigue and task performance, we found that chair stand fatigue and walking fatigue were significantly associated with their corresponding physical performance tasks after adjusting for covariates (Table 3). The relationships were independent of leg strength. Stair climb fatigue was not significantly associated with SCT. This remained true when those participants who completed only one stair climb (instead of two) were excluded from the analysis (n = 38).
Separate Multivariable Linear Regression Models Evaluating Fatigue Status and Its Association With Corresponding Physical Performance Tasks.
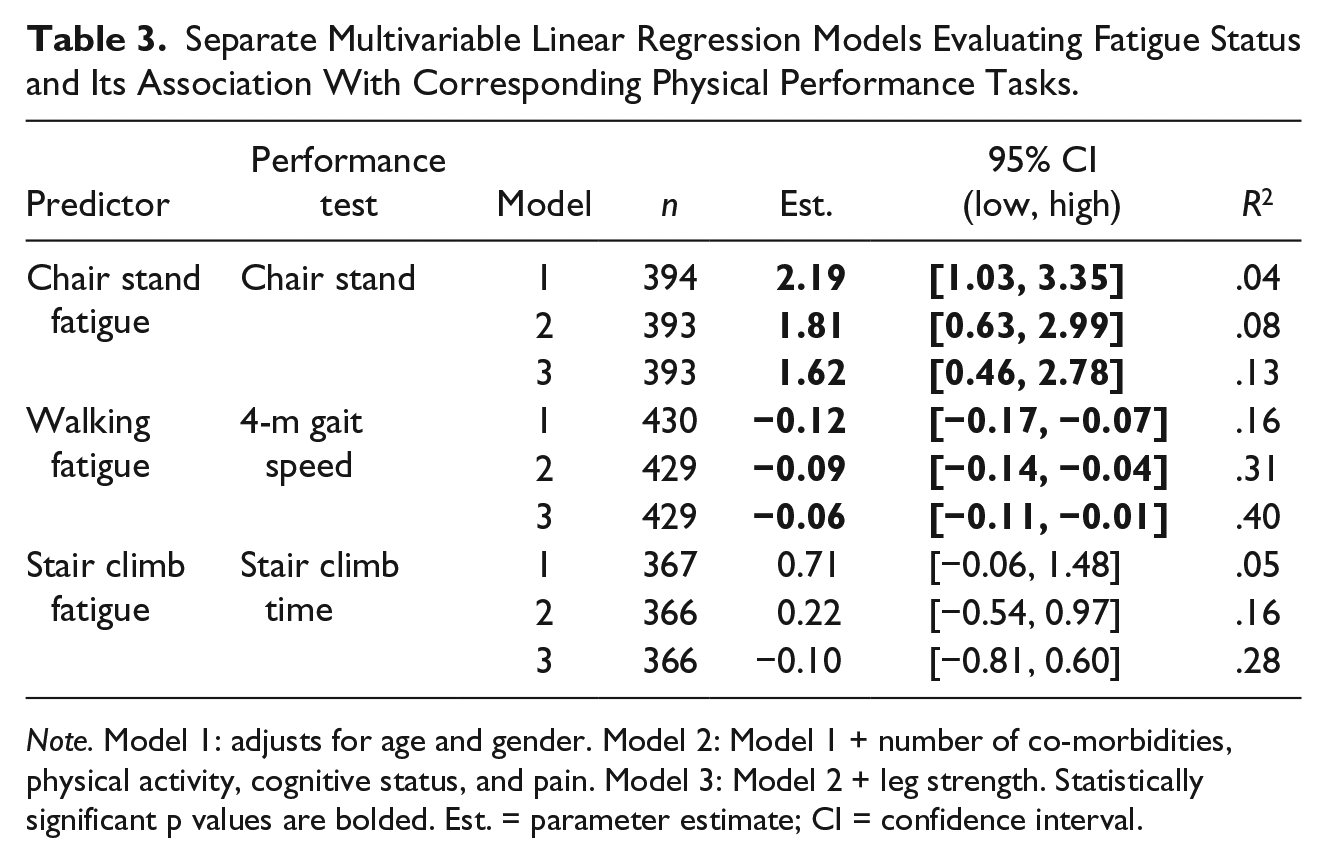
Note. Model 1: adjusts for age and gender. Model 2: Model 1 + number of co-morbidities, physical activity, cognitive status, and pain. Model 3: Model 2 + leg strength. Statistically significant p values are bolded. Est. = parameter estimate; CI = confidence interval.
Discussion
The major findings of this study are as follows: (a) Pain was the single attribute consistently associated with self-reported fatigue with chair stand, walking, and stair climb tasks; (b) task-specific fatigue was associated with task performance based on walking speed and chair stand time; and (c) stair climb fatigue as measured on the Avlund scale was not associated with stair climb task performance.
Those with more pain were significantly more likely to be fatigued in all three tasks. This finding supports previous studies that have associated fatigue with a higher burden of pain among elders (Liao & Ferrell, 2000; Manty, Ekmann, et al., 2012). Although the scales used for assessing fatigue vary across studies, the overall methods are very similar to our own. Further studies are needed to characterize the nature and direction of the relationships between pain, fatigue, and physical performance, as this study is limited by its cross-sectional design. Given these associations, however, it would be clinically relevant to understand whether interventions to improve pain management could reduce fatigue and improve function as well.
Gender was found to be associated with walking fatigue. The odds of reporting fatigue for males were 2.6 times higher than for females. This is a surprising finding as it is contrary to most studies indicating women to be more likely fatigued (Avlund, Vass, & Hendriksen, 2003; Bensing, Hulsman, & Schreurs, 1999). Walking fatigue is often associated with claudication symptoms (Suri, Rainville, Kalichman, & Katz, 2010). In our sample, the prevalence of self-reported peripheral artery disease was greater than twofold higher in men (15%) than in women (6%). This may partially account for our findings concerning gender. Also, spinal stenosis causes neurogenic claudication symptoms, and may be more common among men in our study. Unfortunately, no indicator of spinal stenosis exists among the baseline measures of Boston RISE, and consequently could not be included in our analysis. Other factors predictive of fatigue include the number of co-morbidities, physical activity, and leg strength, all of which support previous findings (Bennett et al., 2002; Liao & Ferrell, 2000; Manty, Ekmann, et al., 2012). Interestingly, leg strength was not predictive of chair stand fatigue, although this finding was marginally statistically significant. This could indicate that chair stand fatigue is more related to power or other characteristics, and merits further study.
We found that task-specific fatigue is a significant predictor of walking speed and chair stand performance. Previous studies have shown that overall fatigue was associated with poorer walking performance (Avlund et al., 2006; Liao & Ferrell, 2000; Manty, de Leon, et al., 2012) as well as chair stand tests (Silva et al., 2011). However, these studies did not evaluate individual items of the Mob-T test as we did. Our findings support the validity of the individual chair rise and walking items of the Mob-T test, and suggest that they may be useful when assessing fatigue in these specific tasks. Of note, the difference we observed in gait speed between those with and without walking fatigue exceeded the threshold for a clinically meaningful difference of ≥0.5 m/s, giving additional clinical relevance to this item of the Mob-T (Kwon et al., 2009; Perera, Mody, Woodman, & Studenski, 2006).
Despite our findings regarding chair rise and walking fatigue, no association was found between stair climb fatigue and stair climb performance in any of the multivariable models. In addition, there was poor agreement with stair climb ability when self-report was compared with observed performance. This is problematic for assessing stair climb fatigue via the Mob-T, as fatigue is only assessed if a person states he or she is able to perform the task. Based on these findings, we would conclude that the stair climb item of the Mob-T, as it is currently constructed, may be weak if utilized as an individual item and its psychometric validity within the scale overall should be further evaluated.
The limitations of this study are important to acknowledge. This is a cross-sectional study, and as such, causality cannot be inferred. Although fatigue may be representative of poor strength, it may also be representative of poor endurance. No measure of maximal or sub-maximal aerobic capacity was included within the Boston RISE study. Future studies addressing fatigue should consider both attributes as factors potentially associated with fatigue status.
Despite these limitations, this is the first investigation to evaluate individual items of the Mob-T test, and one of the first to evaluate factors associated with fatigue among older primary care patients.
Conclusion
We found that pain severity was significantly associated with self-reported fatigue status among older adults with such common mobility tasks as rising from a chair, walking indoors, and climbing stairs. Also, the chair stand and indoor walking items of the Mob-T could be considered as individual items given their association with observed physical performance on corresponding tasks.
Footnotes
Declaration of Conflicting Interests
The authors declared no potential conflicts of interest with respect to the research, authorship, and/or publication of this article.
Funding
The authors disclosed receipt of the following financial support for the research, authorship, and/or publication of this article: Boston RISE is funded by the National Institute on Aging (Grant 5 R01 AG032052-03). This study is also supported by the National Center for Research Resources, Harvard Clinical and Translational Science Center (Grant 1 UL1 RR025758-01). Perrin E. Romine receives funding from the Center for Primary Care at Harvard Medical School as well as Harvard Medical School’s Scholars in Medicine Office.