
Abstract
Introduction
The aging of the U.S. population, which has far-reaching effects on the U.S. health care system (Dall et al., 2013), demands an examination of the implementation and dissemination of evidence-based health and wellness programs targeted to older community-dwelling adults. Falling affects approximately one in three older adults annually across the globe (Yoshida, 2007), contributing to death, serious injuries, and billions of dollars in health care expenses annually (estimated to reach $30 billion by 2020 in the United States; Carroll, Slattum, & Cox, 2005; Englander, Hodson, & Terregrossa, 1996; Roudsari, Ebel, Corso, Molinari, & Koepsell, 2005; Stevens, Corso, Finkelstein, & Miller, 2006). The burden of falls among older adults necessitates a better understanding of the implementation and dissemination of successful fall prevention and management strategies, especially for underserved populations.
In resource-finite sectors, such as the aging services sector, barriers to timely widespread implementation of evidence-based health and wellness programs targeted to older community-dwelling adults are reflected by limited delivery infrastructures (Ory & Smith, 2015; Towne, Smith, Ahn, et al., 2015). These barriers can be overcome through strategic resource allocation to plan and implement evidence-based health and wellness programs based on community assets relative to identified community needs. A Matter of Balance/Volunteer Lay Leader model (AMOB) is one such evidence-based health and wellness program (also known as evidence-based programs [EBPs]) targeted to older community-dwelling adults. One of the primary aims of participation in the AMOB program is the reduction of fall-related risk factors among older adults (NCOA, n.d.-a; NCOA, n.d.-b; Ory et al., 2010; Smith, Hochhalter, Cheng, Wang, & Ory, 2011). This program focuses on a cognitive restructuring approach (Peterson, 2002; Tennstedt et al., 1998) and has been associated with a reduction in participant’s fear of falling (Tennstedt et al., 1998) and confidence in the ability to prevent falls (Healy et al., 2008; Tennstedt et al., 1998). While other EBPs targeting fall prevention exist (e.g., Stepping-on: Clemson et al., 2004; Otago: Thomas, Mackintosh, & Halbert, 2010; and Tai Chi: Voukelatos, Cumming, Lord, & Rissel, 2007), the major focus in the current study was AMOB, which remains the most widely implemented fall prevention intervention in the United States (Smith et al., 2018-a; Smith et al., 2018-b).
While some data exist about the distribution of poor health outcomes, namely, deaths related to falls or chronic disease (Corcoran et al., 2016), less is known about a broader spectrum of inpatient hospitalization hotspots (e.g., high incidence of inpatient hospitalization among older adults at multiple levels, including but not limited to counties) stratified by area-level factors (e.g., rural/urban, population density, socioeconomic status, race/ethnicity). Such data allow for enhanced intervention dissemination by precision targeting of resources based on stakeholder’s goals to reach low-resource areas with a high density of older adults.
One way to identify high-priority areas to deliver programming is to identify hotspots, or geospatial clusters, of health-related outcomes (e.g., hospitalization related to falls; Towne, Smith, Yoshikawa, & Ory, 2015) in areas with a high density of at-risk populations. A somewhat similar approach using fall-related use of medical services data has been shown to be effective in clinical interventions; however, this study was limited in scope by a narrow focus on falls, small geographic area (only select parts of Connecticut), and somewhat narrow age range (i.e., 70 and older; Tinetti et al., 2008). These approaches can serve as models to successfully identify assets (e.g., evidence-based health and wellness programs) relative to at-risk areas (e.g., high incidence of hospitalization, traditionally underserved populations). This is a critical and timely need facing the aging services sector.
The Framework for Action on the Social Determinants of Health (Solar & Irwin, 2010) posits that structural determinants of health and health-related outcomes serve as important factors that should be considered when assessing gaps in the delivery of health-related services (e.g., evidence-based health and wellness program delivery) and health-related outcomes (e.g., fall-related hospitalization Hotspots among older adults). As such, several measures of Social Determinants of Health should be used when assessing relative gaps in both access to health-related resources and the distribution of health-related outcomes. Thus, we aimed to identify geospatial correlates (including several measures related to Social Determinants of Health) of (a) areas with delivery gaps of community- and evidence-programs (EBP) targeting fall prevention among older community-dwelling adults, and (b) areas with high rates of fall-related hospitalizations—hotspots. When assessing gaps in the delivery of evidence-based fall prevention programs, we use AMOB as the sole program in analyses. The rationale for this is that an analysis from national data identified AMOB as the primary program delivered in Texas between 2014 and 2017 (Smith et al., 2018). In addition, AMOB was the most widely implemented evidence-based fall prevention program throughout the nation during the same time frame (Smith et al., 2018). Of note, this measure is not meant to imply broader gaps in the delivery of health services (e.g., clinical care), but rather an example of EBPs delivered in a community setting to community-dwelling older adults.
Design and Methods
Data
Multiple datasets were used to assess county-level (n = 254, counties in Texas) outcomes. Datasets included the Texas Inpatient Hospital Discharge (2012-2014), U.S. Census Bureau’s aggregate population data, the Area Health Resource File (2012-2013) from the Health Resources and Services Administration or HRSA, the National Center for Health Statistics (NCHS) 2013 Urban-Rural Classification Scheme data, the County Health Rankings (developed by the Robert Wood Johnson Foundation and the University of Wisconsin Population Health Institute), the AARP Livability Index, and the North American Industry Classification System (NAICS) for businesses.
In addition, a survey assessing counties where AMOB was delivered for 2012, 2013, and 2014 was conducted by researchers at Texas A&M University in association with the Texas Falls Prevention Coalition (TFPC). Area Agencies on Aging serve geospatial boundaries corresponding to county boundaries in Texas and similarly throughout the nation. These Area Agencies on Aging serve older adults in the community broadly through the aging services sector. Among many other services, Area Agencies on Aging serve a key role in the facilitation of the delivery of evidence-based health and wellness programs targeted to older community-dwelling adults. Given the role of these Area Agencies on Aging in the delivery of evidence-based health and wellness programs targeted to older community-dwelling adults, they are most likely to have information about the delivery of such programs and are considered the primary source of information about the delivery of the EBP in the current study—AMOB. Surveys assessing counties where AMOB was delivered for 2012, 2013, and 2014 were sent to all Area Agencies on Aging in Texas in 2014.
Key Outcomes of Interest
The delivery of AMOB in a county at least once during the year was a key outcome of interest. This was measured through the survey conducted by Texas A&M in partnership with the TFPC. Delivery of AMOB in a county was assessed for each year under study (2012, 2013, and 2014). Counties where AMOB was delivered were then linked using geospatial identifiers, namely County FIPS (Federal Information Processing Standards) codes, to other health-related datasets.
The presence of fall-related hospitalization hotspots was assessed based on the Texas Inpatient Hospital Discharge public use files for 2012, 2013, and 2014. Hotspots were coded as counties with rates of fall-related hospitalizations among those aged 65 and older that were higher than the upper quartile (Towne, Smith, Yoshikawa, & Ory, 2015) for each year under study (2012, 2013, and 2014). This upper level cut point has been used in past research about falls and fall-related programming (Towne, Smith, Yoshikawa, & Ory, 2015). Rates were calculated using the count of fall-related hospitalizations among those aged 65 and older (for 2012, 2013, and 2014, respectively) divided by the count of the population aged 65 and older in the county in 2012 multiplied by 100. The upper quartiles for fall-related hospitalization among those aged 65 and older were 2.08 for 2012, 2.18 for 2013, and 2.27 for 2014.
Independent Variables
We included multiple area-level characteristics in the current study. The percentage of the population aged 65 and older in 2012 was used to determine the composition of older adults relative to younger individuals in a county. This was relevant as the target population of AMOB is older adults (NCOA, n.d.-c). This variable was separated into quartiles (lower quartile: 12.2; median: 14.7; upper quartile: 18.2) to get a categorical measure of relative comparison. This variable was taken from the 2012 County Health Rankings data.
The classification of counties as Primary Care Heath Professional Shortage Areas (HPSA) in 2012 was used to measure gaps in access to primary care. This variable was classified into counties that were non-HPSAs, counties that were partial HPSAs, and counties where the entire county was classified as a HPSA. This variable was taken from the 2012-2013 Area Health Resource File. Given we were interested in mapping the distribution of health-related outcomes and health-related resources, and that HPSAs have been shown to be associated with health status (Liu, 2007), we included HPSAs to further inform relative gaps in access to care.
The classification of areas based on population density per square mile was included to assess the presence of our outcomes by relative population density. This was relevant, as Texas varies widely in population density across counties. Furthermore, population density has been shown to be associated with health-related outcomes (e.g., quality of life; Fassio, Rollero, & De Piccoli, 2013). This variable was separated into quartiles (lower quartile: 6.6; median: 21.75; upper quartile: 61.4) based on the Texas population to get a categorical measure for relative comparison. This variable was taken from the 2012-2013 Area Health Resource File.
Rurality was assessed using the 2013 National Center for Health Statistics (NCHS) Urban-Rural Classification Scheme for Counties code. Counties were classified into two main categories including metropolitan or nonmetropolitan. Within these categories, there were six subclassifications with Metropolitan separated into large central metropolitan areas, large fringe metropolitan areas, medium metropolitan areas, and small metropolitan areas, and nonmetropolitan separated into micropolitan and noncore (counties outside of both metropolitan and micropolitan designated areas). Rurality has been associated with substantial gaps in access to health-related resources (Gamm, Hutchison, Dabney, & Dorsey, 2003) and poor health-related outcomes (Gamm et al., 2003). Given access to health-related resources and health-related outcomes were of interest in the current article, we incorporated rurality as a key independent variable.
To determine whether there were racial or ethnic disparities for areas with a higher percentage of individuals from ethnic or racial minority groups, we included the percentage of the adult population that were Hispanic adults and the percentage of the population that were Black adults. The percentage of the county population that were Hispanic adults was separated into quartiles based on the Texas population in 2010. The percentage of the county population that were Black adults was also separated into quartiles based on the Texas population in 2010. For logistic regression, areas with at/below the median were collapsed into the same category to preserve cell size. Quartiles were used in both variables to provide a relative measure for comparison. These variables were taken from the 2012-2013 Area Health Resource File.
We included the percentage of the county population that were classified as meeting the criteria for poverty in 2011. This was incorporated as a measure of socioeconomic status for counties. This variable was separated into quartiles based on the 2011 Texas population by county. This variable was taken from the 2012-2013 Area Health Resource File. Furthermore, we included the AARP Livability Index to determine whether counties with higher livability were more likely to have fall programming and be less likely to have fall hotspots. The AARP Livability Index takes into consideration multiple items (i.e., housing, neighborhood, transportation, environment, health, engagement, and opportunity) providing a score for each item ranging from 0 to 100. The overall “Livability Score” is a summative score taking each item into account. Given each item may be of importance for individuals living in their community (Harrell, Lynott, & Guzman, 2014), we included this variable in analyses. The AARP Livability Index was separated in quartiles to establish a measure of relative livability in Texas (coded as < the lower quartile: 42.14; ≥ the lower quartile and < the median: 45.36; ≥ median and < the upper quartile: 47.86; and ≥ the upper quartile). Finally, we included one measure of access to home health care services (NAICS Code 621610 for Home Health Care Services), which may be used by those experiencing fall-related hospitalization. This measure included establishments primarily engaged in providing skilled nursing services in the home, along with a range of the following: personal care services; homemaker and companion services; physical therapy; medical social services; medications; medical equipment and supplies; counseling; 24-hour home care; occupation and vocational therapy; dietary and nutritional services; speech therapy; audiology; and high-tech care, such as intravenous therapy. (http://siccode.com/en/naicscodes/621610/home-health-care-services-1) This was separated into 0 to 1 providers versus 2 or more providers to establish a measure of low access relative to higher access.
Statistical Analyses
SAS 9.4 (SAS Institute Cary, NC) was used to conduct all statistical analyses. ArcGIS 10.4 (ESRI) was used to map health-related data.
Binary logistic regression (presenting unadjusted odds ratios using 95% confidence intervals) was used to model: (a) access to evidence-based fall prevention programs—defined as having an EBP (AMOB) delivered at least once during the year in a county, and (b) hotspots of fall-related hospitalization—defined as counties with high (>upper-quartile) fall-related hospitalizations among older adults (aged 65 and older). In all analyses, odds ratios are interpreted using 95% confidence intervals when testing for significant differences.
Results
Table 1 presents the distribution of AMOB by area-level characteristics. Counties where AMOB was offered at least once numbered 84 in 2012, 92 in 2013, and 90 in 2014. This represents a net increase of six counties with AMOB delivery in 2014 relative to 2012. Counties where AMOB was not offered at least once numbered 167 in 2012, 159 in 2013, and 161 in 2014. Areas with the highest number of counties where AMOB was offered at least once (i.e., only among areas where AMOB was offered) included areas with lower percentages of older adults, areas that were partial HPSAs, areas that were not designated as a fall-related hospitalization hotspot, areas with a population density above the median, and areas outside of noncore areas (counties outside of both metropolitan and micropolitan designated areas), areas with a higher percentage of Hispanic adults, areas with a higher percentage of Black adults, and areas with higher poverty rates.
Distribution of AMOB by Area-Level Characteristics.
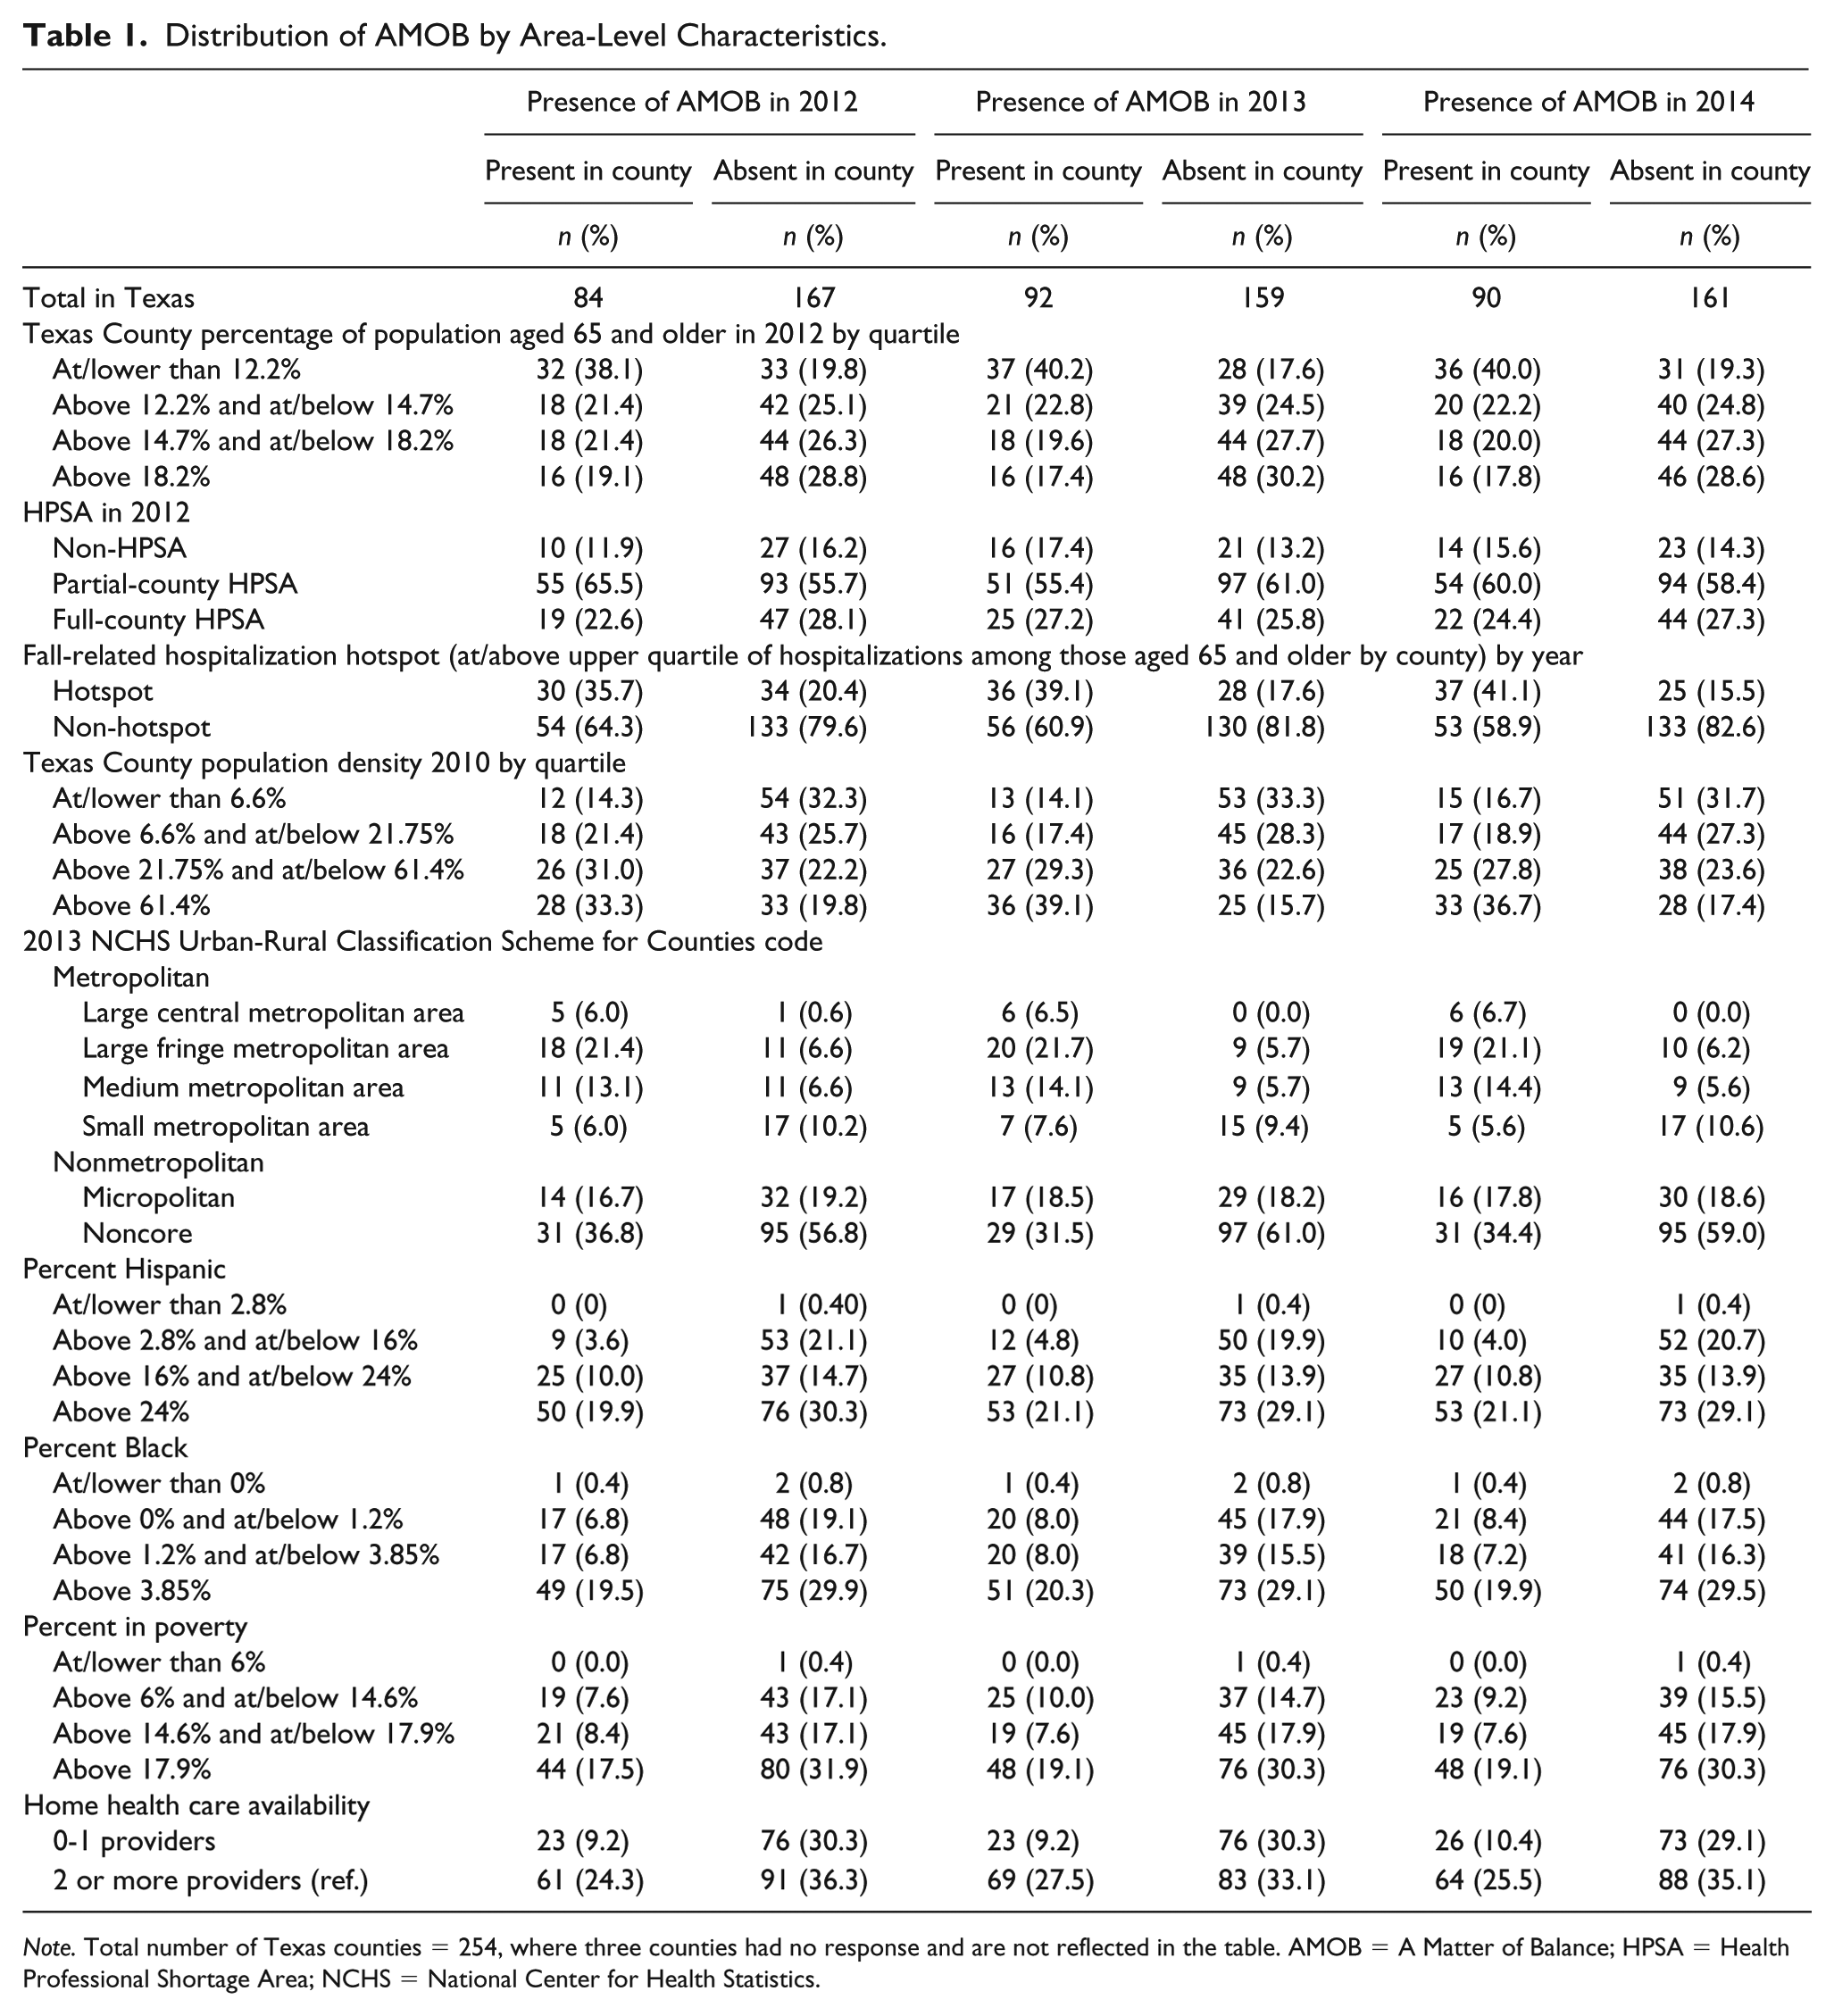
Note. Total number of Texas counties = 254, where three counties had no response and are not reflected in the table. AMOB = A Matter of Balance; HPSA = Health Professional Shortage Area; NCHS = National Center for Health Statistics.
In contrast, areas with the highest number of counties where AMOB was not offered at least once (i.e., only among areas where AMOB was not offered) included areas with higher percentages of older adults, areas that were partial HPSAs, areas that were not designated as a fall-related hospitalization hotspot, areas with a population density at/below the median, areas inside of noncore areas (counties outside of both metropolitan and micropolitan designated areas), areas with a higher percentage of Hispanic adults, areas with a higher percentage of Black adults, and areas with higher poverty rates.
Figure 1 presents a geospatial representation (map) of the distribution of AMOB for 2012 and 2014. As shown in Figure 1, the delivery of AMOB was clustered in the southeastern regions of Texas with gaps in delivery seen in the northeast, north, west, and in areas throughout the central part of the state.
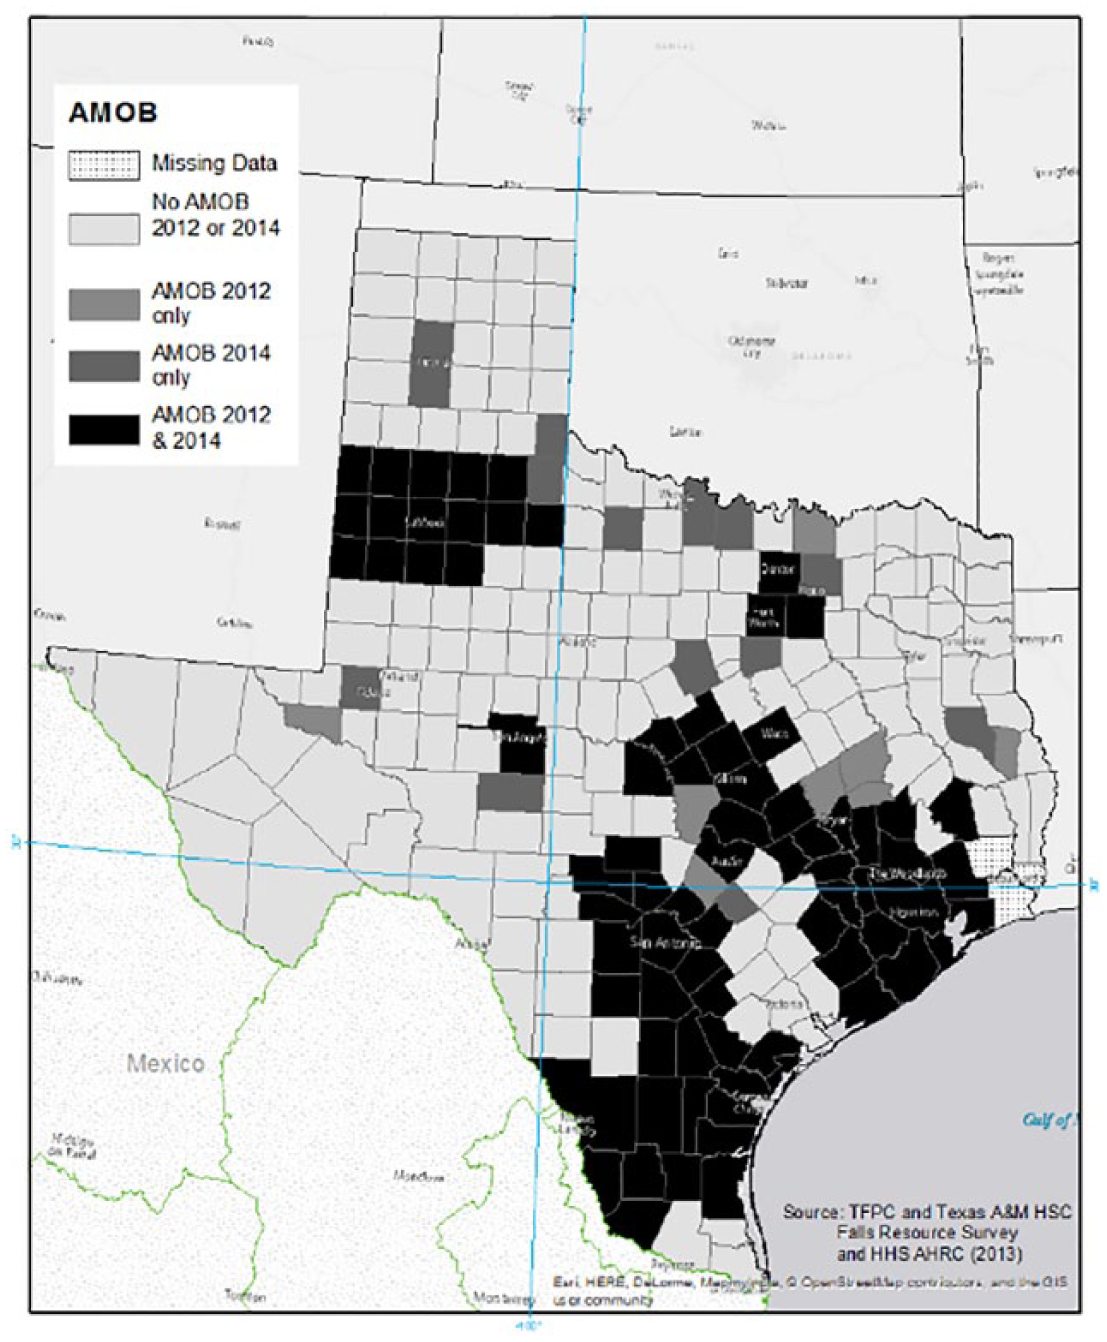
Distribution of a matter of balance in Texas by county, 2012 & 2014.
Table 2 presents the distribution fall-related hospitalization hotspots by area-level characteristics. The number of counties that were hotspots for fall-related hospitalization were relatively stable over time and numbered 64 in 2012, 64 in 2013, and 62 in 2014. Counties that were non-hotspots for fall-related hospitalization numbered 190 in 2012, 189 in 2013, and 189 in 2014. Areas with the highest number of counties designated as hotspots (i.e., only among areas designated as hotspots) included areas with lower percentages of older adults, areas that were partial HPSAs, areas with a population density above the median, areas outside of noncore areas (counties outside of both metropolitan and micropolitan designated areas), areas with a higher percentage of Hispanic adults, areas with a higher percentage of Black adults, and areas with a higher poverty rate.
Distribution of Fall-Related Hospitalization Hotspots by Area-Level Characteristics.
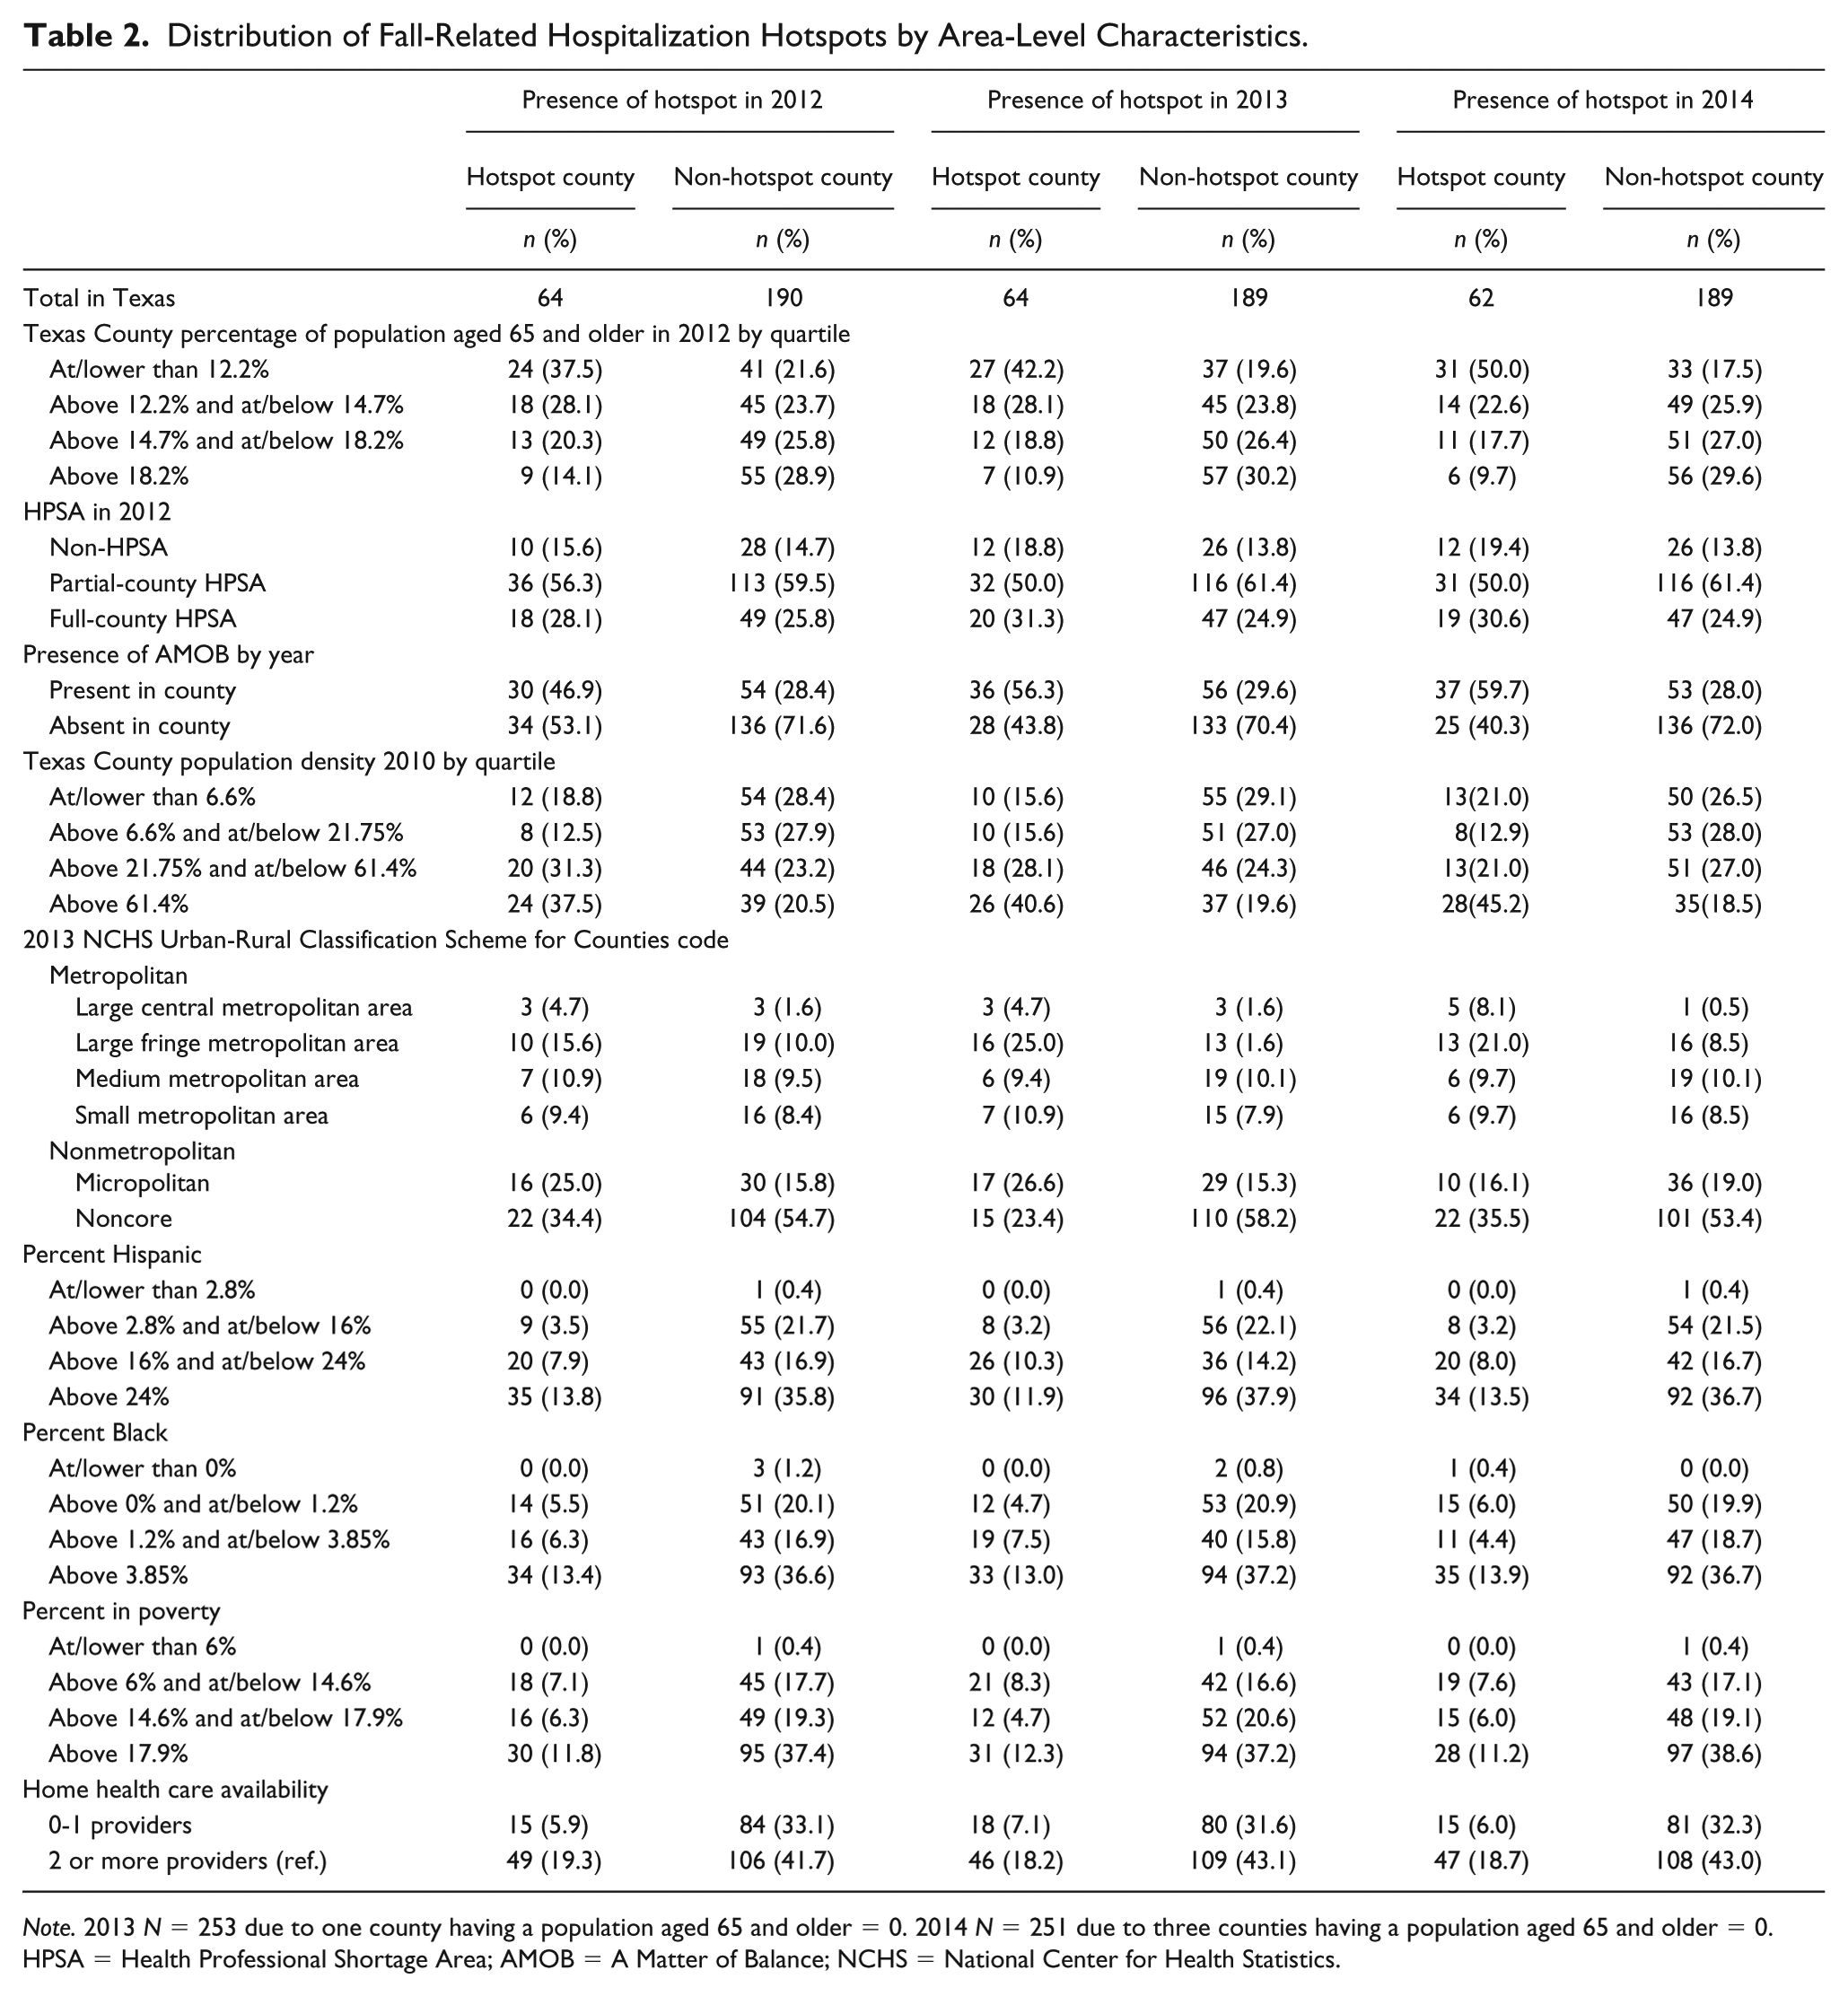
Note. 2013 N = 253 due to one county having a population aged 65 and older = 0. 2014 N = 251 due to three counties having a population aged 65 and older = 0. HPSA = Health Professional Shortage Area; AMOB = A Matter of Balance; NCHS = National Center for Health Statistics.
In contrast, areas with the highest number of counties not designated as hotspots (i.e., only among areas not designated as Hotspots) included areas with higher percentages of older adults, areas that were partial HPSAs, areas where AMOB was absent, areas with a population density at/below the median, and areas inside of noncore areas (counties outside of both metropolitan and micropolitan designated areas), areas with a higher percentage of Hispanic adults, areas with a higher percentage of Black adults, and areas with a higher poverty rate.
Figures 2 and 3 present fall-related hotspots for older adults. Clusters of fall-related hotspots were seen in the central, southern, northern, and eastern regions of the state.
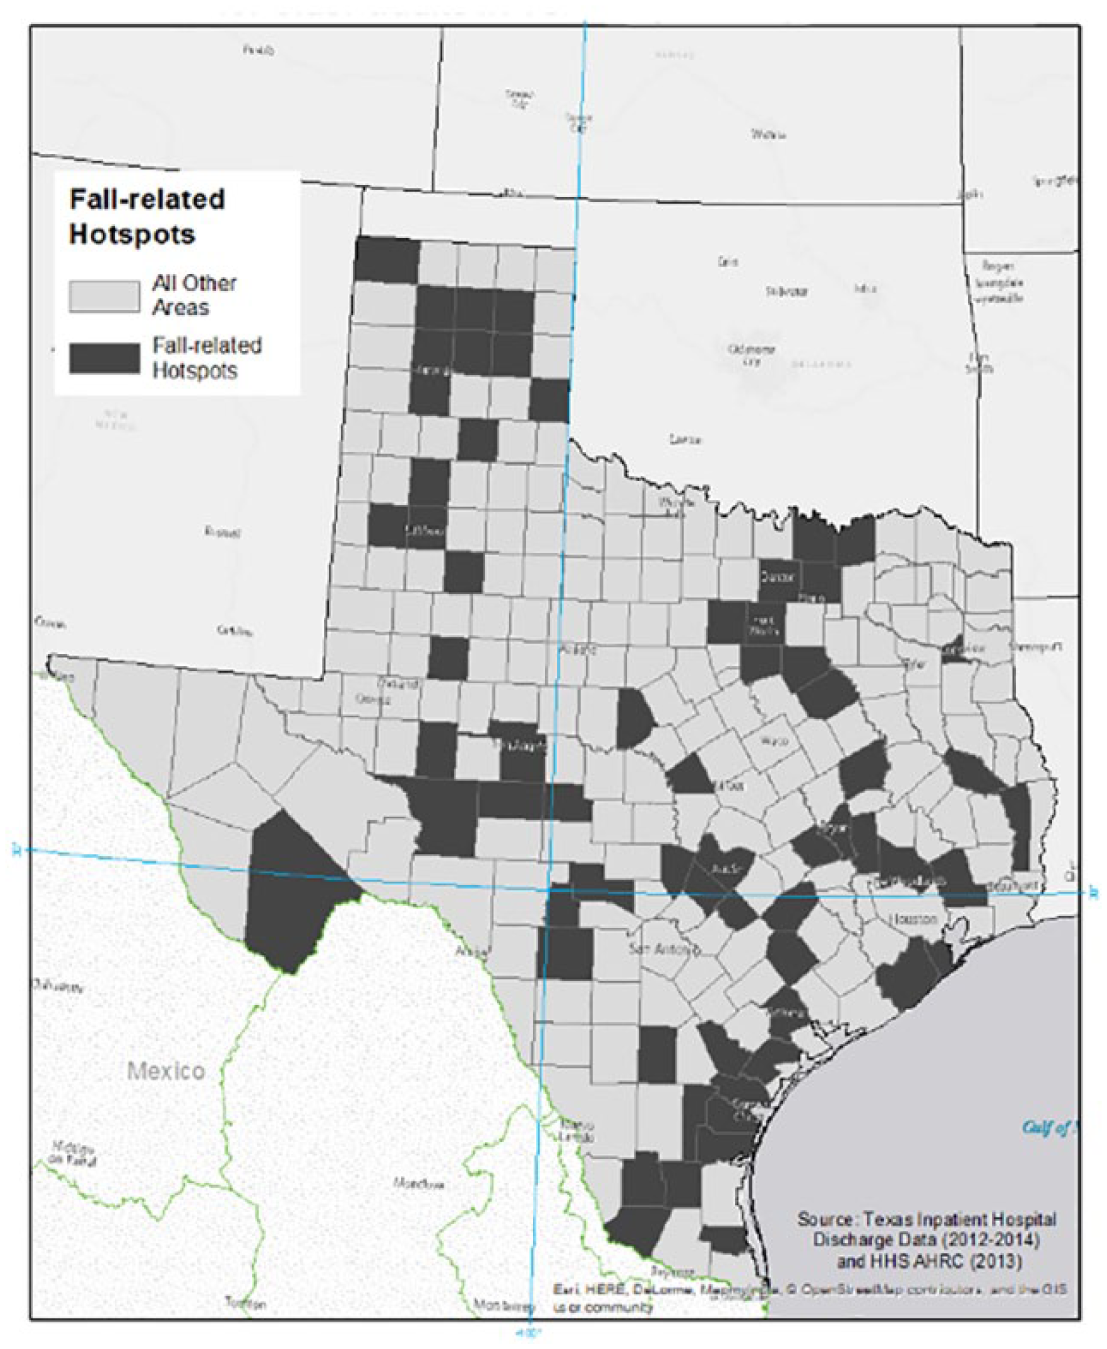
Distribution of fall-related hospitalization hotspots for older adults in Texas by county, 2012.
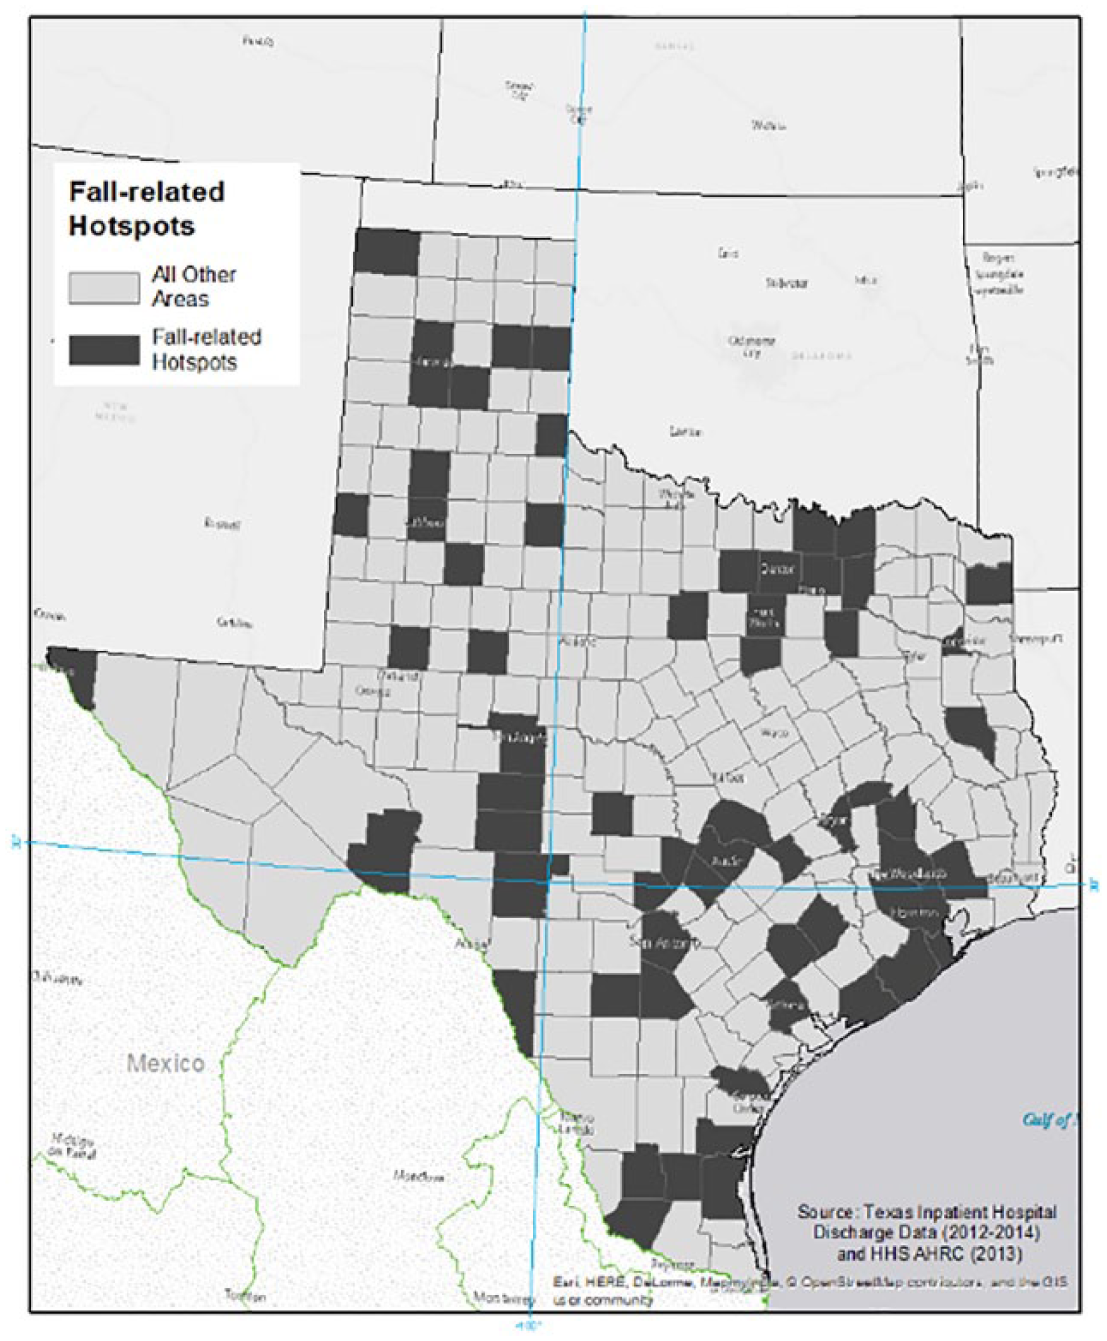
Distribution of fall-related hospitalization hotspots for older adults in Texas by county, 2014.
Table 3 presents factors associated with the absence or gaps in the delivery of AMOB in a county. Areas with the lowest percentage of older adults in a county were less likely (p < .05) to face gaps (have an absence) in the delivery of AMOB. Thus, areas with the highest concentration of older adults (versus the lowest) were more likely (p < .05) to have at least one AMOB program delivered in the county that year. Areas that were not designated as fall-related hospitalization hotspots were more likely (p < .05) to face gaps in the delivery of AMOB. Thus, areas designated as hotspots were more likely (p < .05) to have at least one AMOB program delivered in the county that year. Furthermore, areas with the lowest population density (versus the highest) were more likely (p < .05) to face gaps in the delivery of AMOB. Areas that were nonmetropolitan were more likely (p < .05) to face gaps in the delivery of AMOB. Areas with a lower percentage (at/lower than the median; above the median and at/below the upper quartile) of Hispanic adults (versus areas with the highest percentage) were less likely (p < .05) to face gaps in the delivery of AMOB. Thus, areas with a higher percentage (above the upper quartile) of Hispanic adults were more likely (p < .05) to face gaps (have an absence) in the delivery of AMOB. Furthermore, areas with 0 or 1 providers of home health care were more likely (p < .05) to face gaps in the delivery of AMOB versus areas with 2 or more providers in the county.
Factors Associated With the Absence of AMOB in a County.
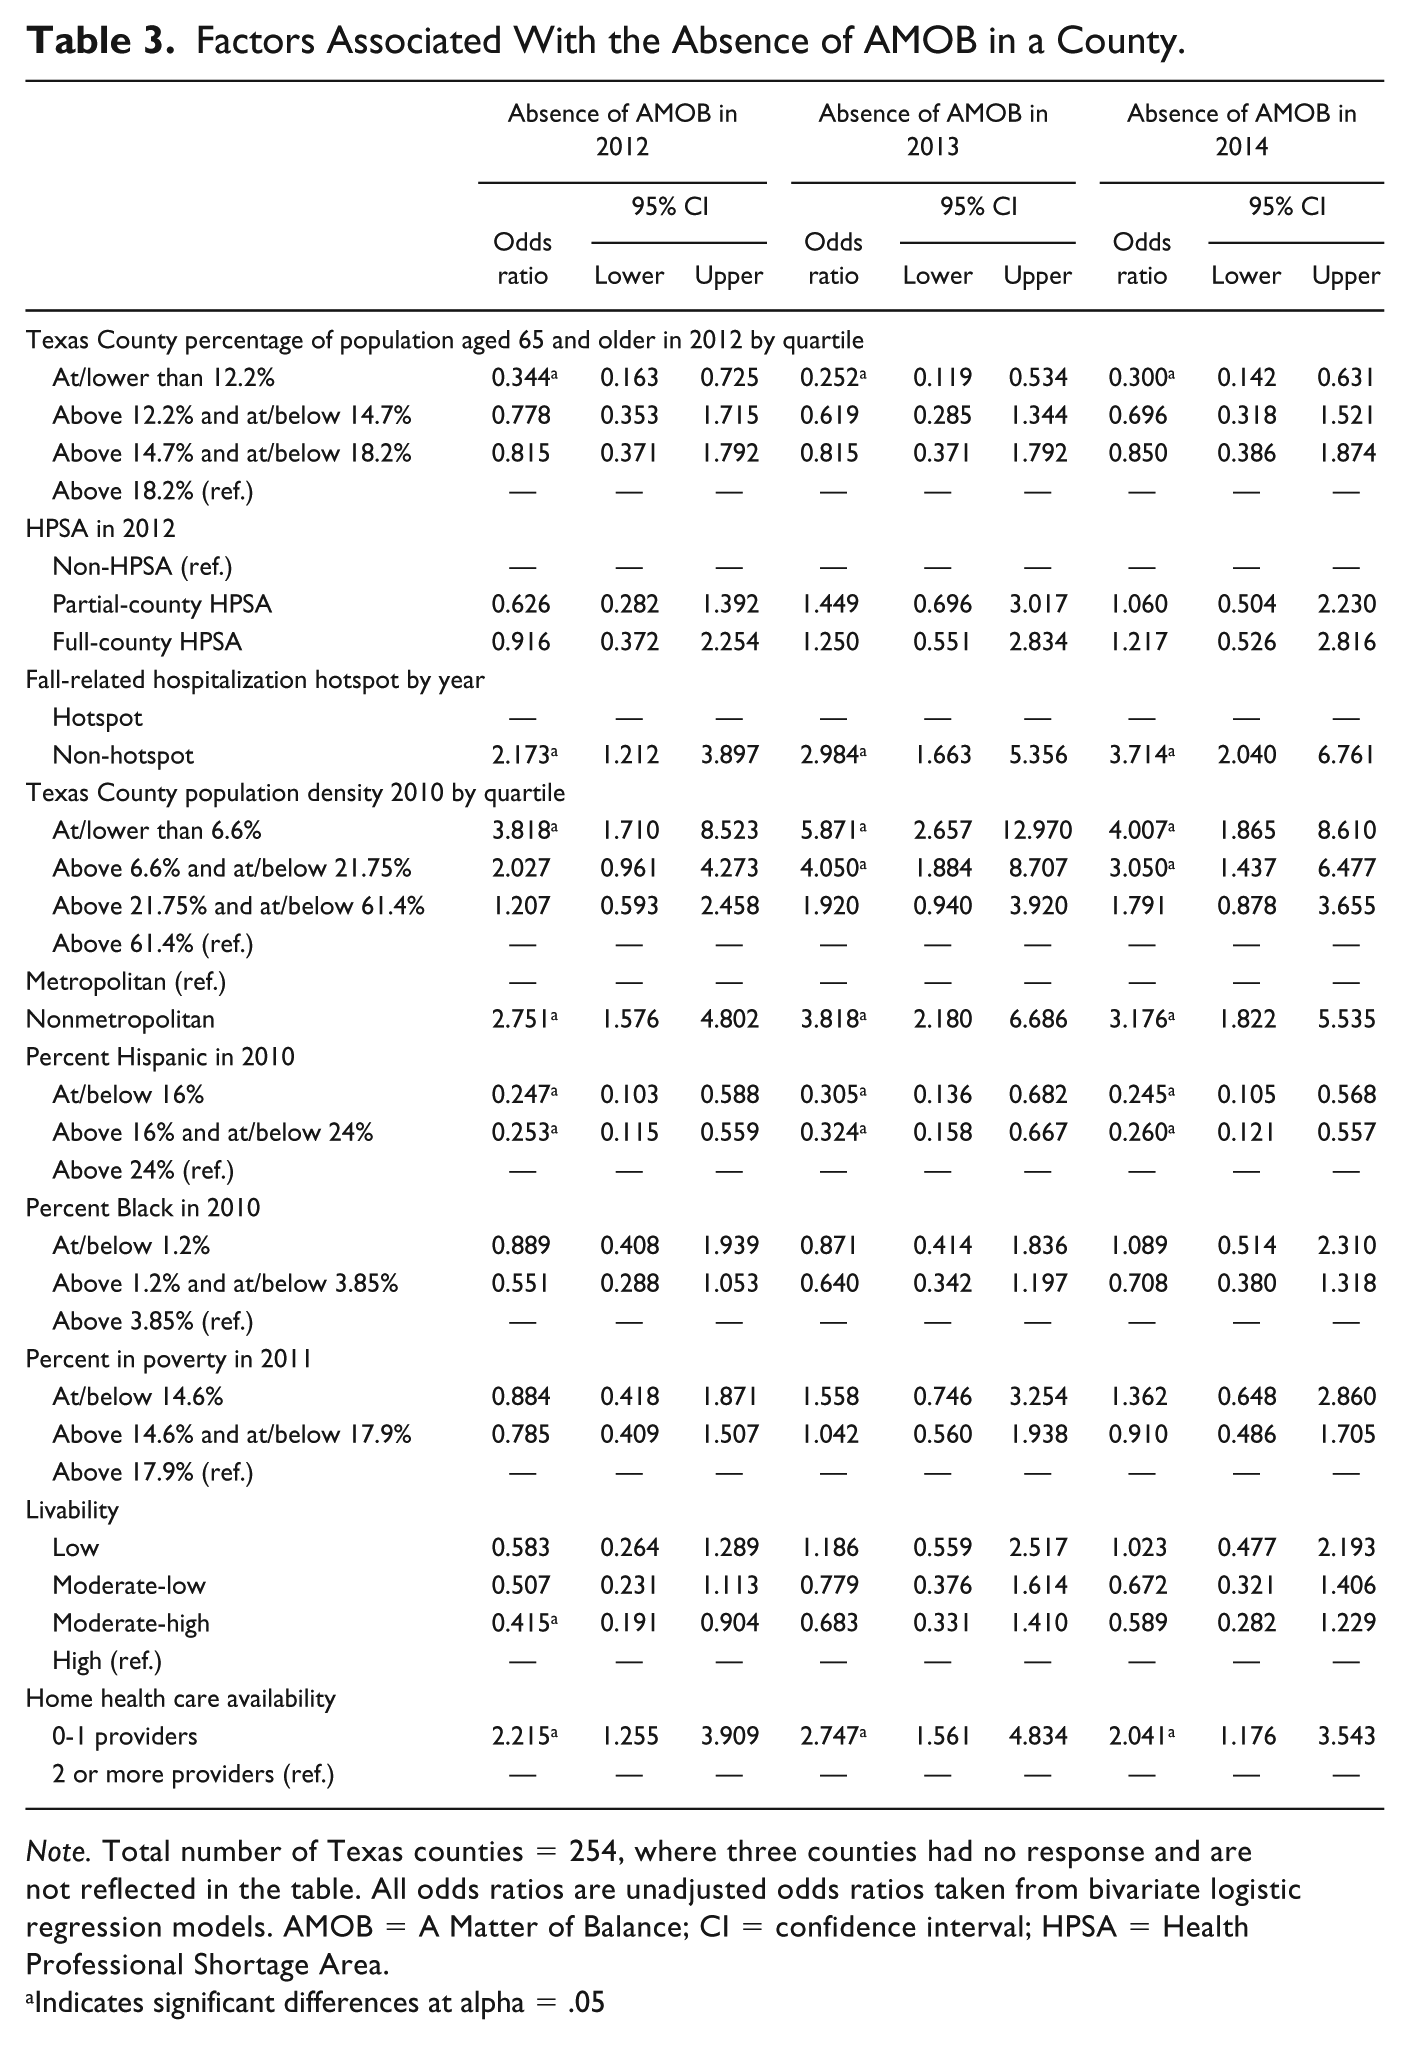
Note. Total number of Texas counties = 254, where three counties had no response and are not reflected in the table. All odds ratios are unadjusted odds ratios taken from bivariate logistic regression models. AMOB = A Matter of Balance; CI = confidence interval; HPSA = Health Professional Shortage Area.
Indicates significant differences at alpha = .05
Table 4 presents factors associated with the presence of a fall-related hospitalization hotspot in a county. Areas with the lowest percentage of older adults (at/below lower quartile) versus the highest (above the upper quartile) were more likely to be designated as fall-related hospitalization hotspots. Having AMOB delivered at least once in the county during the year (p < .05) was also associated with a greater likelihood of being designated as a fall-related hospitalization hotspot. Areas with a population density at or below the median versus the highest (above the upper quartile) were less likely (p < .05) to be designated as fall-related hospitalization hotspots. For 2012 and 2014, areas with a lower percentage (at/lower than the median) of Hispanic adults were less likely (p < .05) to be designated as fall-related hospitalization hotspots. Thus, areas with a higher percentage (above the upper quartile) of Hispanic adults were more likely (p < .05) to be designated as fall-related hospitalization hotspots.
Factors Associated With the Presence of a Fall-Related Hospitalization Hotspot in a County.
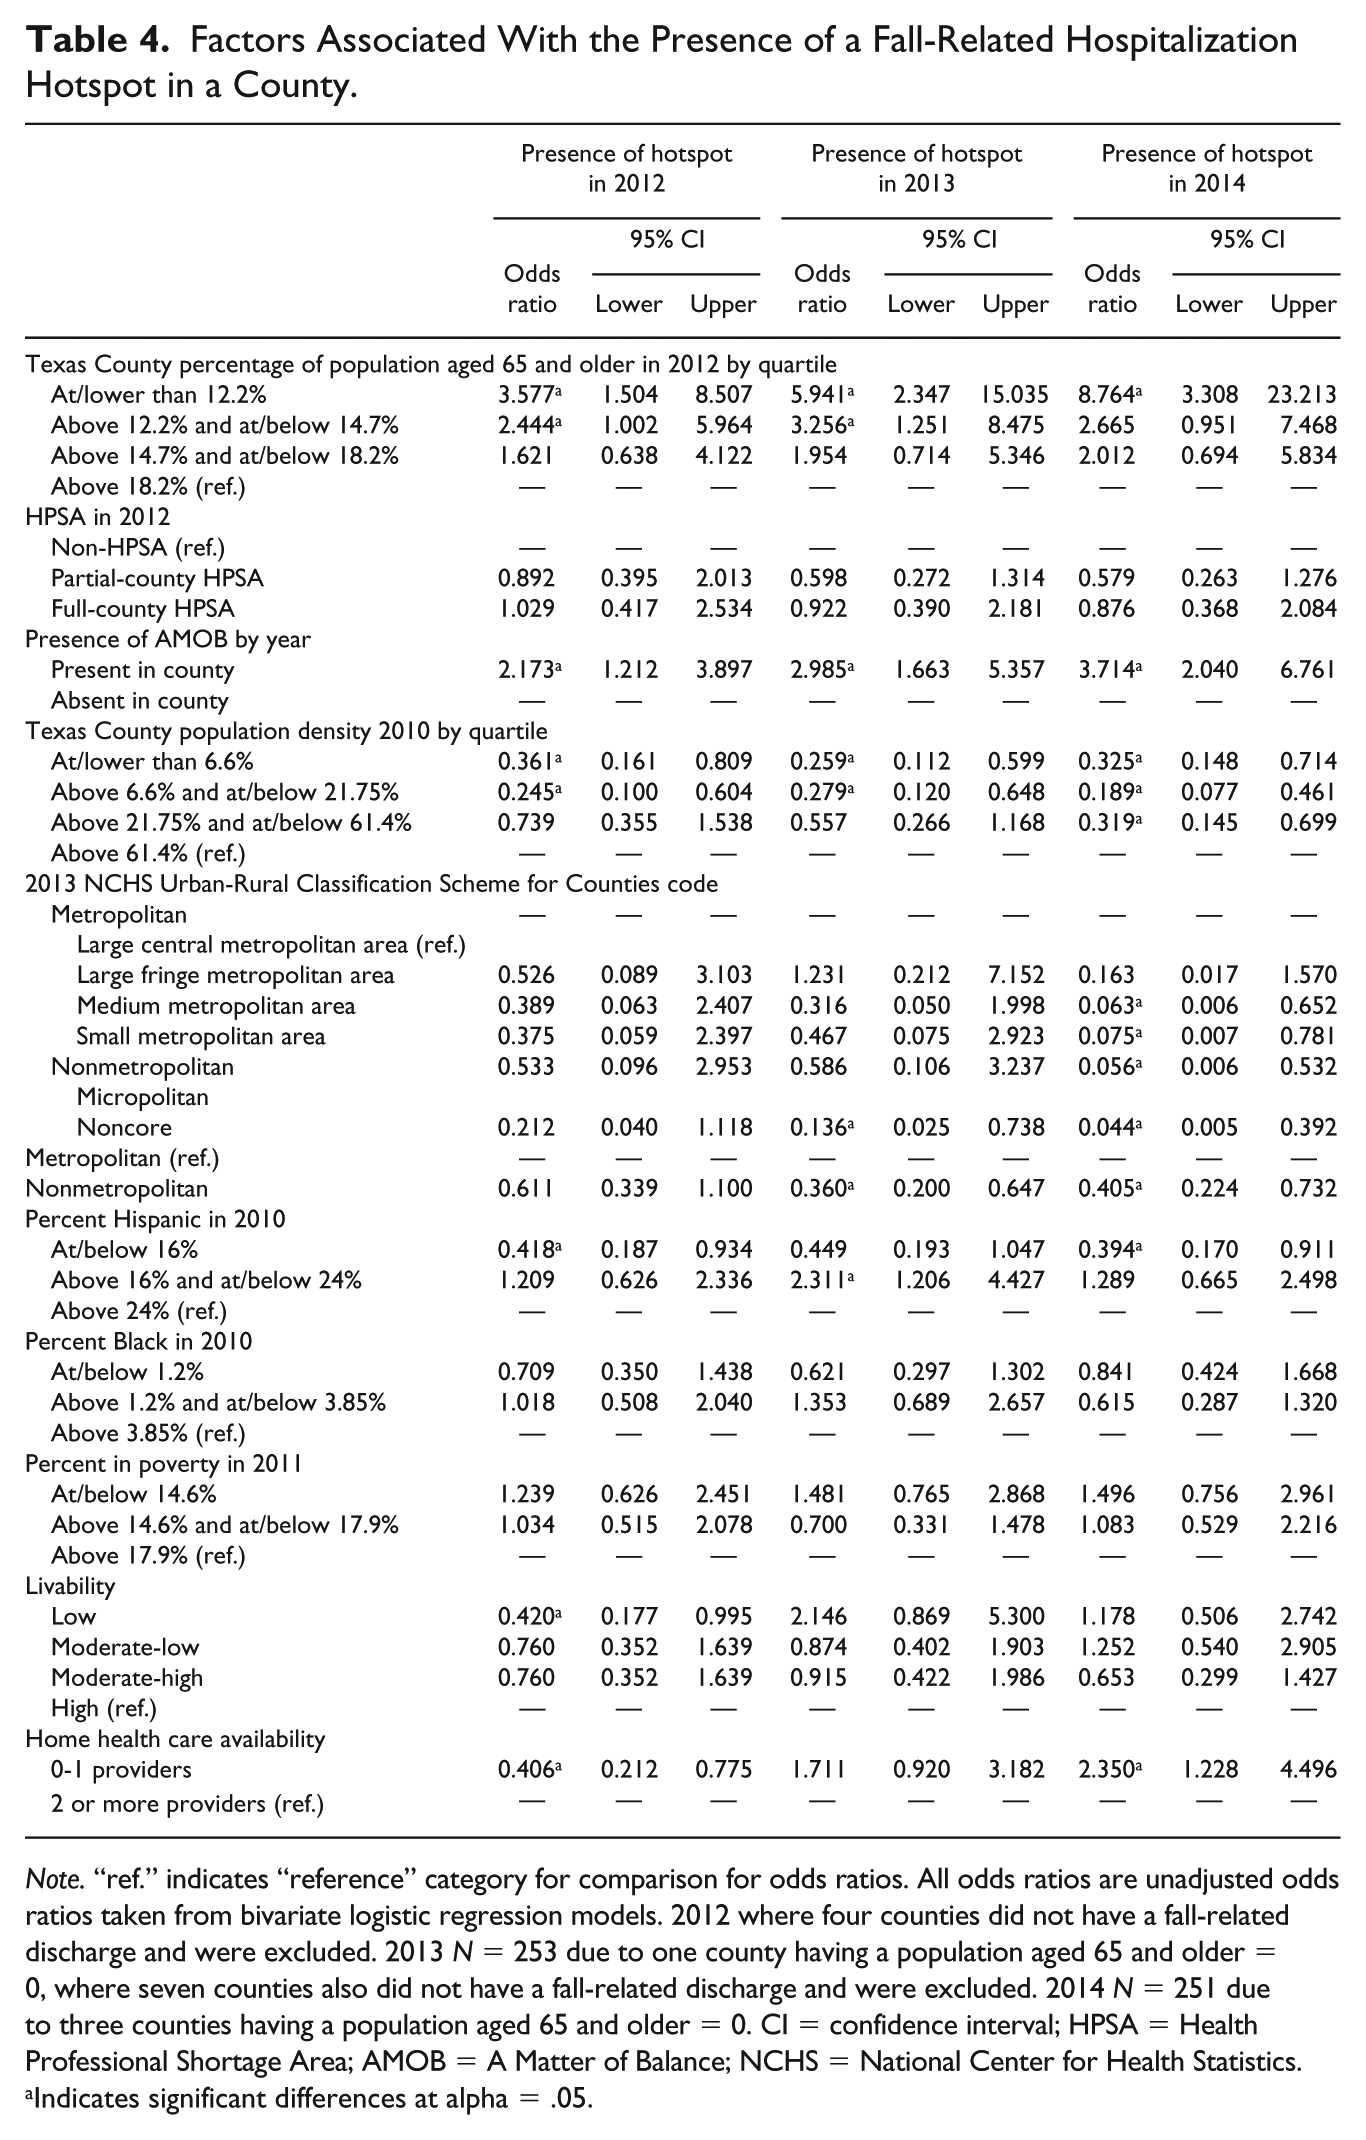
Note. “ref.” indicates “reference” category for comparison for odds ratios. All odds ratios are unadjusted odds ratios taken from bivariate logistic regression models. 2012 where four counties did not have a fall-related discharge and were excluded. 2013 N = 253 due to one county having a population aged 65 and older = 0, where seven counties also did not have a fall-related discharge and were excluded. 2014 N = 251 due to three counties having a population aged 65 and older = 0. CI = confidence interval; HPSA = Health Professional Shortage Area; AMOB = A Matter of Balance; NCHS = National Center for Health Statistics.
Indicates significant differences at alpha = .05.
Discussion
The delivery of AMOB was highly concentrated in large clusters in the southeastern part of the state, with several smaller clusters in the north. Major metropolitan areas such as Austin, Houston, San Antonio, and Dallas/Fort Worth had AMOB delivery in 2012 and 2014. There was a net gain of six additional counties covered in 2014 relative to 2012, which is considerable given counties cover large geographic areas.
Several area-level characteristics were associated with the delivery of this evidence-based health and wellness program targeted to older community-dwelling adults. The percentage of older adults in an area, the presence of fall-related hospitalization hotspots, relative population density, and relative rurality (i.e., metropolitan versus nonmetropolitan designations) were all important factors in assessing the likelihood of evidence-based health and wellness program delivery. This is similar to a previous national study assessing the delivery of multiple evidence-based health and wellness programs across the country (e.g., differences across rurality; Towne, Smith, Ahn et al., 2015). However, the more detailed state-specific analyses in the current study allows for a more tailored approach for state legislators and other key stakeholders (e.g., Area Agencies on Aging within a state, nonprofits focused on older adult health). Similar analyses of evidence-based health and wellness program delivery, albeit a single year, also provided similar findings related to gaps in access to evidence-based health and wellness programs in rural areas (Towne, Smith, Yoshikawa, & Ory, 2015), which this study builds upon.
A novel finding of our study is related to the relative disparity facing areas with a higher concentration of Hispanic adults, where we find areas with the highest concentration of Hispanic adults being more likely to face gaps (have an absence) in the delivery of AMOB. Furthermore, in 2012 and 2014 of the current study, areas with the highest concentration of Hispanic adults were more likely to be designated as fall-related hospitalization hotspots. These findings are important because evidence shows that the magnitude of health improvements among Hispanic participants exceed those of their non-Hispanic White counterparts after participating in AMOB(Smith, Ahn, Mier, Jiang, & Ory, 2012). As such, the identification of these high priority areas can inform decision makers about the benefits of expanding AMOB to reach counties with high densities of Hispanic populations to combat fall-related prevalence rates.
The number of fall-related hotspots was relatively stable across all years under study. In addition, the distribution of these hotspots was somewhat evenly dispersed, yet clear clusters were seen allowing for potential targets by stakeholders seeking to allocate resources (e.g., fall-specific programming for older adults) to at-risk areas (e.g., hotspots). Similar to program delivery, several area-level characteristics were associated with the designation of fall-related hospitalization hotspots. The percentage of the population aged 65 and older, the presence of AMOB being delivered at least once in a county in a given year, and population density were all related to the designation of an area as a fall-related hospitalization hotspot. One possible explanation of why areas with a presence of AMOB were also more likely to be hotspots for fall-related hospitalization may be that select stakeholders had already recognized the need for programming. Furthermore, the fact that areas with the lowest percent of older adults were also more likely to be areas that were fall-related hospitalization hotspots may indicate that these areas have limited infrastructure or focus on fall prevention programming, given the relatively low percentage of older adults. More research into these findings should be carried out in future studies.
Broadly, our results align with the theoretical framework of the Social Ecological Theory (McLeroy, Bibeau, Steckler, & Glanz, 1988) and the Framework for Action on the Social Determinants of Health (Solar & Irwin, 2010), in that structural determinants of health and health-related outcomes serve as important factors that should be considered when assessing gaps in the delivery of health-related services (e.g., evidence-based health and wellness program delivery) and health-related outcomes (e.g., fall-related hospitalization hotspots among older adults). These frameworks serve as a critical foundation to this and similar research. Future studies should incorporate these and similar frameworks when assessing similar factors as those used in the current study.
There was overlap with the delivery of AMOB and fall-related hospitalization hotspots in some cases. The number of individuals in a single class in a large county may not be enough to make a large enough impact in fall-related hospitalizations measured at the county level. Continued infrastructure growth, partnerships, and other support for program sustainability will be needed to make substantial and sustained changes at the population level. This and similar analyses serve as useful guidance for policy-targeted approaches to ameliorate falls and other factors influencing the quality of life of older adults. In addition, AMOB or other fall prevention programs may be offered outside of Area Agencies on Aging(Ahn, Hochhalter, Moudouni, Smith, & Ory, 2012). As such, Area Agencies on Aging should consider reaching out to partner with other potential delivery systems such as public health agencies or hospitals. Further studies should examine the effects of the delivery of AMOB programs on the prevention of fall-related hospitalization rates at the county level after several years of sustained delivery.
Limitations and Strengths
The current study measured multiple cross-sectional datasets and as such causality is not implied in the current study. That said, a major strength of the current study was the use of multiple years of data allowing for measuring trends over time. Moreover, the relatively large areas (i.e., counties) used for aggregating data in the current analyses may not allow for more detailed, subcounty (e.g., census tract or census block group), assessment of factors associated with our outcomes of interest. For example, walkability of communities was not included, as this may vary substantially within areas as large as counties. Furthermore, the designation of AMOB being delivered at least once in a county in a given year is very crude. However, we aimed to be pragmatic in limiting additional burden and paperwork (i.e., limiting questions to counties where programs were delivered versus asking more detailed information about addresses) of community-based partners throughout the state given their already burdensome reporting activities. Gathering data (i.e., surveys from Area Agencies on Aging) on such a large scale (i.e., state-wide) was challenging, yet a major resource was the ability to leverage existing relationships through the state Falls Prevention Coalition. Furthermore, ensuring the goal of the research (e.g., enabling the assessment of where potential gaps in programming might exist for future resource allocation and broadly helping older adults to better access effective programming) was clearly articulated with our state partners was crucial when gaining buy-in for their feedback. Furthermore, future studies should look at intervention capacity including the number of programs delivered across a particular timeline relative to the overall population. In addition, when assessing fall prevention interventions, AMOB is the sole program under study. As mentioned previously, AMOB was the primary fall prevention program delivered in Texas (2014-2017) and the most widely delivered fall prevention program nationally during this same time (Smith et al., 2018-a; Smith et al., 2018-b). That said, other EBPs that can be beneficial for fall prevention are available (e.g., Stepping-on: Clemson et al., 2004; Otago: Thomas et al., 2010; and Tai Chi: Voukelatos et al., 2007).
Of note, we used a single measure for fall-related hospitalization hotspots choosing the upper quartile as the cut point in the current study. There are many other ways to assess fall-related hospitalizations including, but not limited to the raw count of fall-related hospitalizations. However, this raw count is highly linked to population size and as such the most highly populated areas are also likely to have the highest numbers of fall-related hospitalizations. Hence, we decided to use a somewhat different measure of relative incidence relative to the population aged 65 and older. Furthermore, the current study does not take into account falls that led to emergency room visits (e.g., without hospital admission and subsequent discharge) or health clinic visits (e.g., primary care visits), as the data focus on hospital discharges solely. This and other limitations should be taken into consideration when evaluating the implications of the current study.
Implications
Using multiple sources of data (primarily inpatient hospitalization data based on discharges throughout states and geospatial characteristics of the population) allows for innovative, strategic, and precise hotspot identification and targeting (Towne, Smith, Yoshikawa, & Ory, 2015). Furthermore, integrating multiple datasets that can be linked to geospatial data should be used to disseminate actionable findings to key stakeholders throughout the state (e.g., the aging services sector, state legislators, community organizations). This also facilitates informing targeted evidence-based health and wellness program embedment and implementation to foster sustainable approaches to ameliorate poor health outcomes and health disparities. This study may serve as a model for other states to identify assets (e.g., evidence-based health and wellness programs) relative to at-risk areas (e.g., low-resource areas, hotspots of poor health-related outcomes, areas with high concentrations of ethnic minority adults). Finally, funding for these and similar evidence-based health and wellness programs targeted to community-dwelling older adults may be tied, in large part, to available resources (e.g., funding). Policy makers and other key stakeholders should consider the availability of funding and other sources of resource allocation relative to at-risk areas when allocating budgets and seeking additional funding sources (e.g., state or federal grants).
Conclusion
Identifying area-level factors associated with evidence-based health and wellness program delivery and/or fall-related hospitalization hotspots has practical use that can allow for immediate action (e.g., resource allocation) by policy-makers and other stakeholders. Continued efforts to monitor trends in access to evidence-based health and wellness program and the presence of hotspots in health-related outcomes are recommended in future research. In resource-finite settings, such as the aging services sector, identifying high priority areas can allow for precise allocation of limited resources. Further studies should examine the long-term effects of the delivery of AMOB programs, given as much as half of older adults who fall may suffer another fall (Tinetti & Speechley, 1989). Delivery of AMOB programs targeting the prevention of falls and by extension fall-related hospitalization should be evaluated after several years of sustained delivery to both older adults as well as their caregivers to assess broader impacts.
Footnotes
Declaration of Conflicting Interests
The authors declared no potential conflicts of interest with respect to the research, authorship, and/or publication of this article.
Funding
The authors received no financial support for the research, authorship, and/or publication of this article.