






Abstract
This study aimed to document the typology of social participation and network among older Canadians and examine their associations with health. Using 2011–2015 cross-sectional data from the Canadian Longitudinal Study on Aging, a latent profile analysis was conducted to identify patterns of social participation and network, and multinomial logistic regressions examined associations with self-rated health. Four types of social participation and networks characterized older Canadians: diverse (74.0%), childless (12.1%), restricted (9.7%), and very socially active (4.3%). Compared to the diverse group and excellent/very good health, belonging to the restricted group was associated with higher probabilities of reporting fair or poor health, both general (1.95; p < .001) and mental (2.18; p < .001). Still comparing to the diverse group and excellent/very good health, the very socially active group presented lower likelihood of reporting good general health (0.82; p = .03). These results suggest that the social participation and network are associated with health inequalities in older Canadians. Future studies should look at the role of virtual interactions in the health of older adults.
Global population ageing characterizes current demographic structure and calls for a better understanding of the social determinants of health in older adults. In 2022, about 10% of people worldwide were aged 65 and older and, by 2050, this proportion is expected to reach 16% (United Nations, 2022). Driven by low fertility rates and increasing life expectancy, the Canadian population has also recently experienced a historical demographic shift with a proportion of older inhabitants that now outnumbers children under 15 years old, respectively, 18.5 versus 16% (Statistique Canada, 2021). With such growth, the population of older Canadians is becoming increasingly diverse, for example, in terms of ethnic backgrounds (with about 30% of landed immigrants) and social connectedness, as well as health status, profiles, and trajectories (Public Health Agency of Canada, 2020). Better acknowledging older adults’ heterogeneity is necessary to develop and implement health and well-being policies and programs addressing their specific needs, including in their social participation and network.
Key Concepts and Definitions.

Despite the substantial evidence of the importance of social interactions in ageing, little is known about the heterogeneity of social networks among older adults, including among Canadians. Yet, knowledge about this heterogeneity is essential to better understand the patterns of social relationships and their contribution to health, including with situations of vulnerability or chronic disease in older adults. This gap in literature might be explained by single and inconsistent indicators of social participation and network, rather than more holistic approaches considering its complexity. Indicators are generally grouped into two categories: structural (i.e. size and frequency of interactions) and functional (i.e. perceived support).
Enabling the investigation of intertwined social network characteristics and their associations with health, a growing literature is adopting a typology approach (Fiori et al., 2020; Park et al., 2018, 2020; Sohn et al., 2017). While the number of network types varies as well as the number of indicators, this literature builds on Wenger’s seminal work (Wenger, 1989, 1991). Based on qualitative data from 30 adults aged 79 or older and living in rural United Kingdom, Wenger identified 5 social network profiles: (1) locally integrated (n = 8), (2) family-dependent (n = 6), (3) wider community focused (n = 6), (4) local self-contained (n = 5), and (5) private restricted (n = 5). In the literature, four typical networks appear relatively robust and reflected different compositions: diverse, family, friends, and restricted. The diverse network is characterized by its large size, frequent contact with family and friends, and high social participation, while family and friends networks feature a larger quantity or higher frequency of contact with one type of ties (Fiori et al., 2006, 2007). Some studies added indicators on the amount of support providers or confidants, both mostly among family or friends (Fiori et al., 2007; Li & Zhang, 2015; Park et al., 2020). In the restricted group, individuals have limited interactions with friends, family, and neighbours, both in number and frequency, and restricted social participation. The size of these types of networks varies according to characteristics of participants such as age, nationality, and place of residence (Fiori et al., 2006; Litwin & S., 2011; Park et al., 2020). For the restricted network, proportion ranges from very limited to almost half (4.7 to 40.9%) of the participants (Li & Zhang, 2015; Windsor et al., 2016).
Carried out with Canadians aged 65 to 85 (Harasemiw et al., 2017), one typology found six types of networks; diverse (25.4%), diverse with few siblings (23.6%), family friend-focused (15.5%), few children (13.9%), few friends (11.7%), and restricted (10.0%). Relying on structural indicators only (size, frequency of interactions or social participation), only face-to-face interactions were considered in this study (no virtual interactions). Between 2007 and 2016, the proportion of older Canadians using internet more than doubled (32.2 to 68.2%) (Statistiques Canada, 2020). Varying by age, this figure reached 85.0% for those aged 65 to 69 and 40.8% for 80 and over. Moreover, 48.7% of older Canadians believe that information and communication technologies help to communicate with other people often or always.
In addition, to categorize social networks, typologies are useful for verifying associations with health. Compared to the restricted group, being in the diverse network has been associated with better physical and mental health outcomes (Kim et al., 2016; Li & Zhang, 2015; Litwin & Shiovitz-Ezra, 2006; Ye & Zhang, 2019). Given the more common use of Internet among older adults, considering online interactions appears important to further understand social participation and networks and their associations with health. Online interactions have been found to be associated with older adults’ well-being through cognitive improvement and social support (Morton et al., 2018; Nimrod, 2010). Yet, their positive effects on well-being and loneliness (Office of the U.S. Surgeon General, 2023) depended on older adults’ awareness of how to use online resources (Sum et al., 2008). Moreover, how social participation and network influence situations of vulnerability and their consequences, such as poor health, remains unclear, especially when considering virtual interactions.
To shed light on the diversity of social relationships of older Canadians and their associations with health, developing a typology of social participation and networks is necessary. Coherent with a recent call for a holistic approach to social networks (Smith & Victor, 2019), such typology should use structural, that is, an objective assessment, and functional, that is, social support, actual or perceived, indicators (Holt-Lunstad, 2018). To our knowledge, no study has focused on the social participation and networks of older Canadians considering both indicators. This study thus aimed to (1) document the diversity of social participation and networks among older Canadians and (2) examine their associations with general and mental health.
Methods
Design and Participants
This study presents a secondary analysis of the 2011–2015 baseline cross-sectional cohort data of the Canadian Longitudinal Study on Aging (CLSA). CLSA aims at deepening our understanding of the ageing process through the collection and analysis of comprehensive datasets including social and health indicators (Raina et al., 2019). Based on a national and longitudinal research platform, CLSA baseline was composed of more than 50,000 adults aged 45 to 85 living in community dwellings. Participants were recruited into a Tracking (n = 21,241) and a Comprehensive cohort (n = 30,097). Exclusion criteria were residing in the three territories and some remote regions, living on federal First Nations reserves and other First Nations settlements in the provinces, being full-time members of the Canadian Armed Forces, living in institutions at time of recruitment, being unable to respond in English or French, and having cognitive impairments at time of recruitment. The present study is cross-sectional and included of participants of both Tracking and Comprehensive cohorts aged 65 years or more (n = 21,491).
Variables
Structural indicators included network size, and frequency of (i) interactions with network and (ii) social participation. Functional indicators included perceived availability of social support.
Network Size
A continuous score was created with the sum of the number of people in the respondent’s social entourage corresponding to living children, living siblings, close friends, and neighbours. A higher score indicates a greater network size.
Frequency of Interactions With Network
The frequency of respondents’ interactions was questioned as follows: When did you last get together with any [children/sibling/close friend/neighbour] who live outside of your household? The responses were coded with higher number representing the frequency of interactions (0 = never/none; 1= > 1 year; 2 = past years; 3 = past 6 months; 4 = past month; 5 = last week or two; 6 = last day or two).
Frequency of Social Participation
Social participation was measured through eight social activities: (1) family or friendship-based activities outside the household, (2) church or religious activities, (3) sports or physical activities, (4) educational and cultural activities, (5) service club or fraternal organization activities, (6) neighbourhood, community, or professional association activities, (7) volunteer or charity work, and (8) any other recreational activities involving other people. Respondents were asked: In the past 12 months, how often did you participate in [each of the eight activities]? Following previous research (Levasseur et al., 2011, 2015), we created an indicator of social participation by summing the response to each activity converted into frequency per month (‘At least once a day’: 20, ‘at least once a week’: 6, ‘at least once a month’: 2, and ‘At least once a year’: 1 and ‘never’: 0). This sum characterizes the number of community activities per month, and a higher score represents a higher frequency of social participation. Based on the present results, the instrument has good internal consistency (α = 0.85).
Perceived Availability of Social Support
The Medical Outcomes Study (MOS) social support scale (Sherbourne & Stewart, 1991) was used to assess respondents’ perceived social support availability. This scale is composed of 19 items related to four types of support: (1) tangible (e.g. someone to take you to the doctor if needed), (2) emotional (e.g. someone who shows you love and affection), (3) affectionate (e.g. someone who hugs you), and (4) positive social interaction (e.g. someone to get together with to relax). Respondents were asked: People sometimes look to others for companionship, assistance, or other types of support. How often is each of the following kinds of support available to you if you need it? Responses were coded as (1 = never; 2 = a little of the time; 3 = sometime; 4 = most of the time; 5 = all the time). An average support was calculated (1–5) with higher score representing greater availability.
Sociodemographic and Health Variables
The following sociodemographic variables were included as controls: age (continuous), sex (0 = men; 1= women), marital status (0 = married/common law; 1 = single/divorced/separated/widowed), education (0 = secondary 4 or less; 1 = secondary 5 completed), and country of birth (0 = Canada; 1 = other). Finally, self-rated general and mental health were assessed through two questions: ‘In general, would you say your health is excellent, very good, good, fair, or poor?’ and ‘In general, would you say your mental health is excellent, very good, good, fair, or poor?’
Analysis
Participants and their context were described using means and standard errors or frequencies and percentages, respectively, for continuous and categorical variables. Following statistical analyses involved two steps: a latent profile analysis (LPA), and multinomial logistic regressions of network types on health. First, an LPA was performed, that is, a modelling approach identifying homogeneous groups within a heterogeneous population (Spurk et al., 2020). Since this approach reveals unobserved heterogeneity within a population through latent classes based on probability of membership to a set of variables (Howard & Hoffman, 2018; Muthén, 2001), LPA is well suited for complex multidimensional phenomena such as social networks. Variables were treated as continuous in the LPA analysis.
To document social participation and networks among older Canadians (objective 1), classification probabilities and entropy (index ranging from 0 to 1 with > 0.8 considered as best fits) (Fonseca-Pedrero et al., 2017) were assessed, and the best fit solution was cross-validated using the split-sample analysis. Building on social network typology’s literature that presents most often 4 or 5 types of networks, the LPA was iterated from a 2-class model to a 5-class model. The higher the class membership probability, the better the discrimination between types. Following Li and colleagues’ (2020) split-sample validation analysis (Li et al., 2020), a training sample of 10,746 respondents was first randomly selected, and a validation sample was composed of the rest of the participants (10,745). Parameters from the training sample were compared against the validation one. Because classifications rarely converge to a single solution, interpretation is required by comparing the distributions of indicators and identifying differences between profiles. In this final step, a name is assigned to each group according to their characteristics.
To examine associations between social participation and network groups and health (objective 2), multinomial logistic regressions were carried out. Bivariate analyses with groups were first conducted (Model 1), followed by models controlling for sociodemographic variables (Model 2). Using CLSA analytic weights (CLSA, 2017), the LPA was carried out with the MPlus7 software (Muthén & Muthén, 1998-2010) and descriptive and inferential analyses with STATA12 software.
Results
First, a description of how the preferred solution for network types was chosen is provided. Second, each network types included in the preferred solution is described based on network variables chosen in the model. Third, sociodemographic profiles of each network type are provided.
Profiles Selections
Although all models had entropy values above 0.8, the 4-class model has the best fit (0.96) with good discrimination between groups (latent class membership probabilities from 0.99 to 0.94; Appendix 1). Among the two models with the best fit (according to fit criteria previously chosen – entropy and class membership probabilities), the 3-class had group sizes of 85.2%, 10.2%, and 4.7% of the sample, but despite including one of 4.3%, the 4-class model also identified a large clinically relevant group (12.1%; childless) – meaning it is meaningful and representative of older adults’ networks. Based on its indicator’s quality and interpretation, the 4-class model clearly distinguishes network profiles with a strong conceptual assessment of social patterns, reasonable group sizes and only 42 (0.4%) participants misclassified, which indicates stability.
Network Types
Profiles of Network Types (n = 21 491).
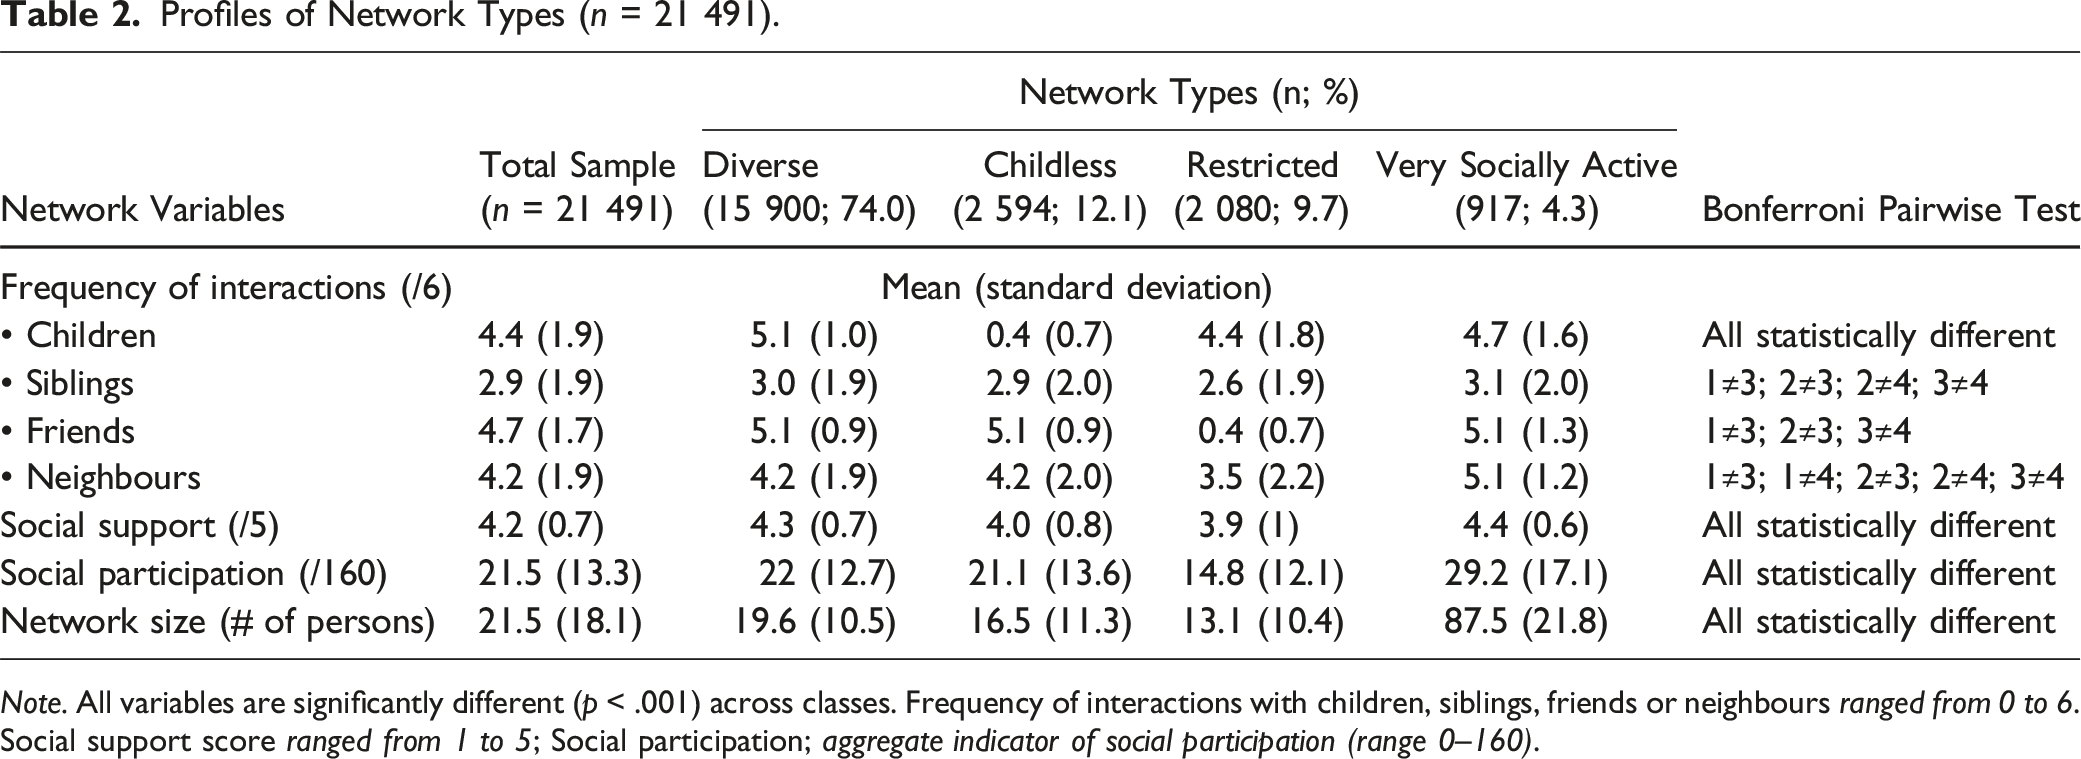
Note. All variables are significantly different (p < .001) across classes. Frequency of interactions with children, siblings, friends or neighbours ranged from 0 to 6. Social support score ranged from 1 to 5; Social participation; aggregate indicator of social participation (range 0–160).
Sociodemographic Descriptions of Network Types
Sociodemographic and Health Characteristics by Social Network Groups (n = 21 491).
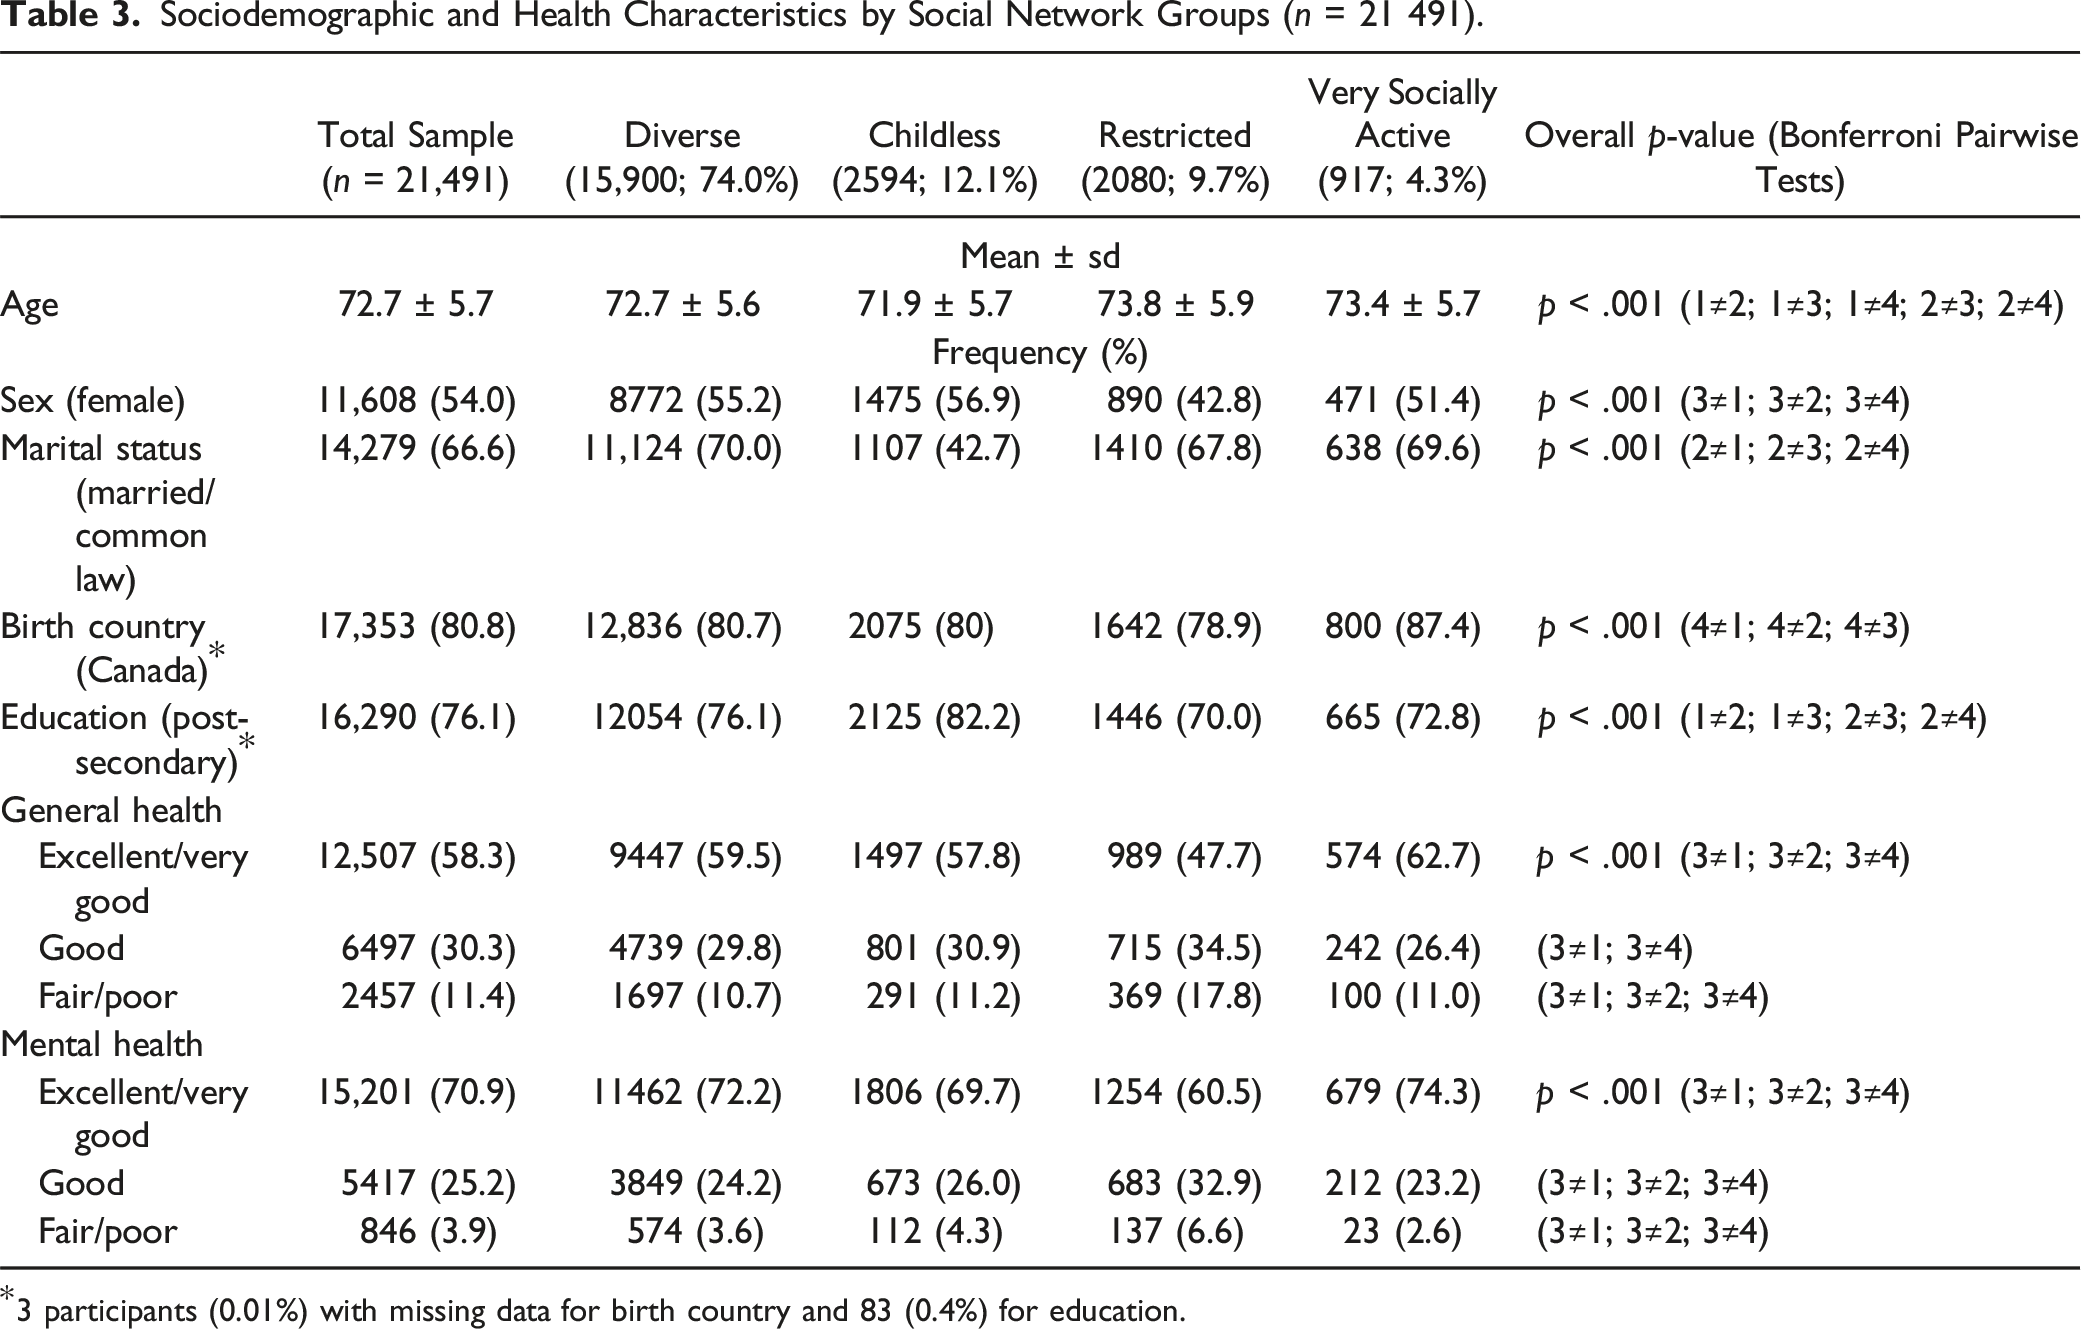
*3 participants (0.01%) with missing data for birth country and 83 (0.4%) for education.
Associations With General and Mental Health
Multinomial Logistic Regression on General Health According to Network Types (n = 21 462).
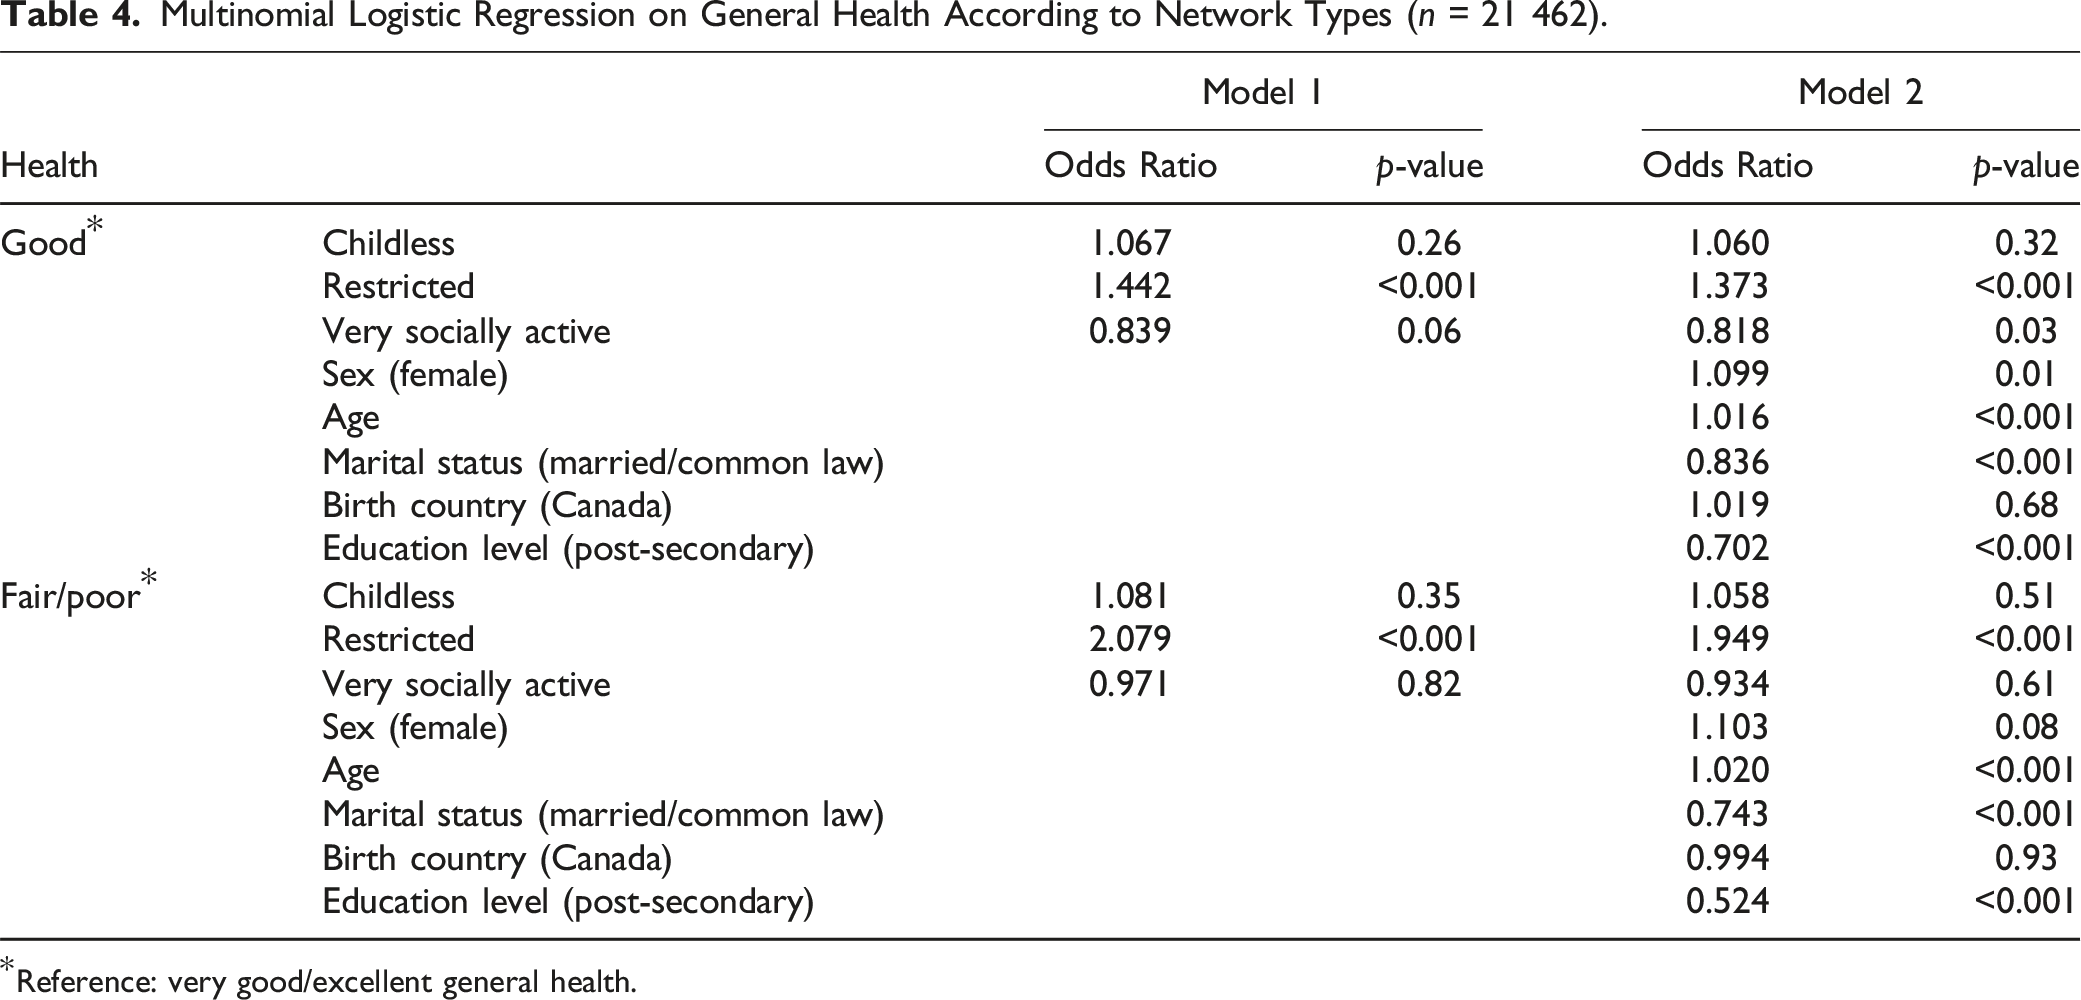
Reference: very good/excellent general health.
Multinomial Logistic Regression on Mental Health According to Network Types (n = 21 465).
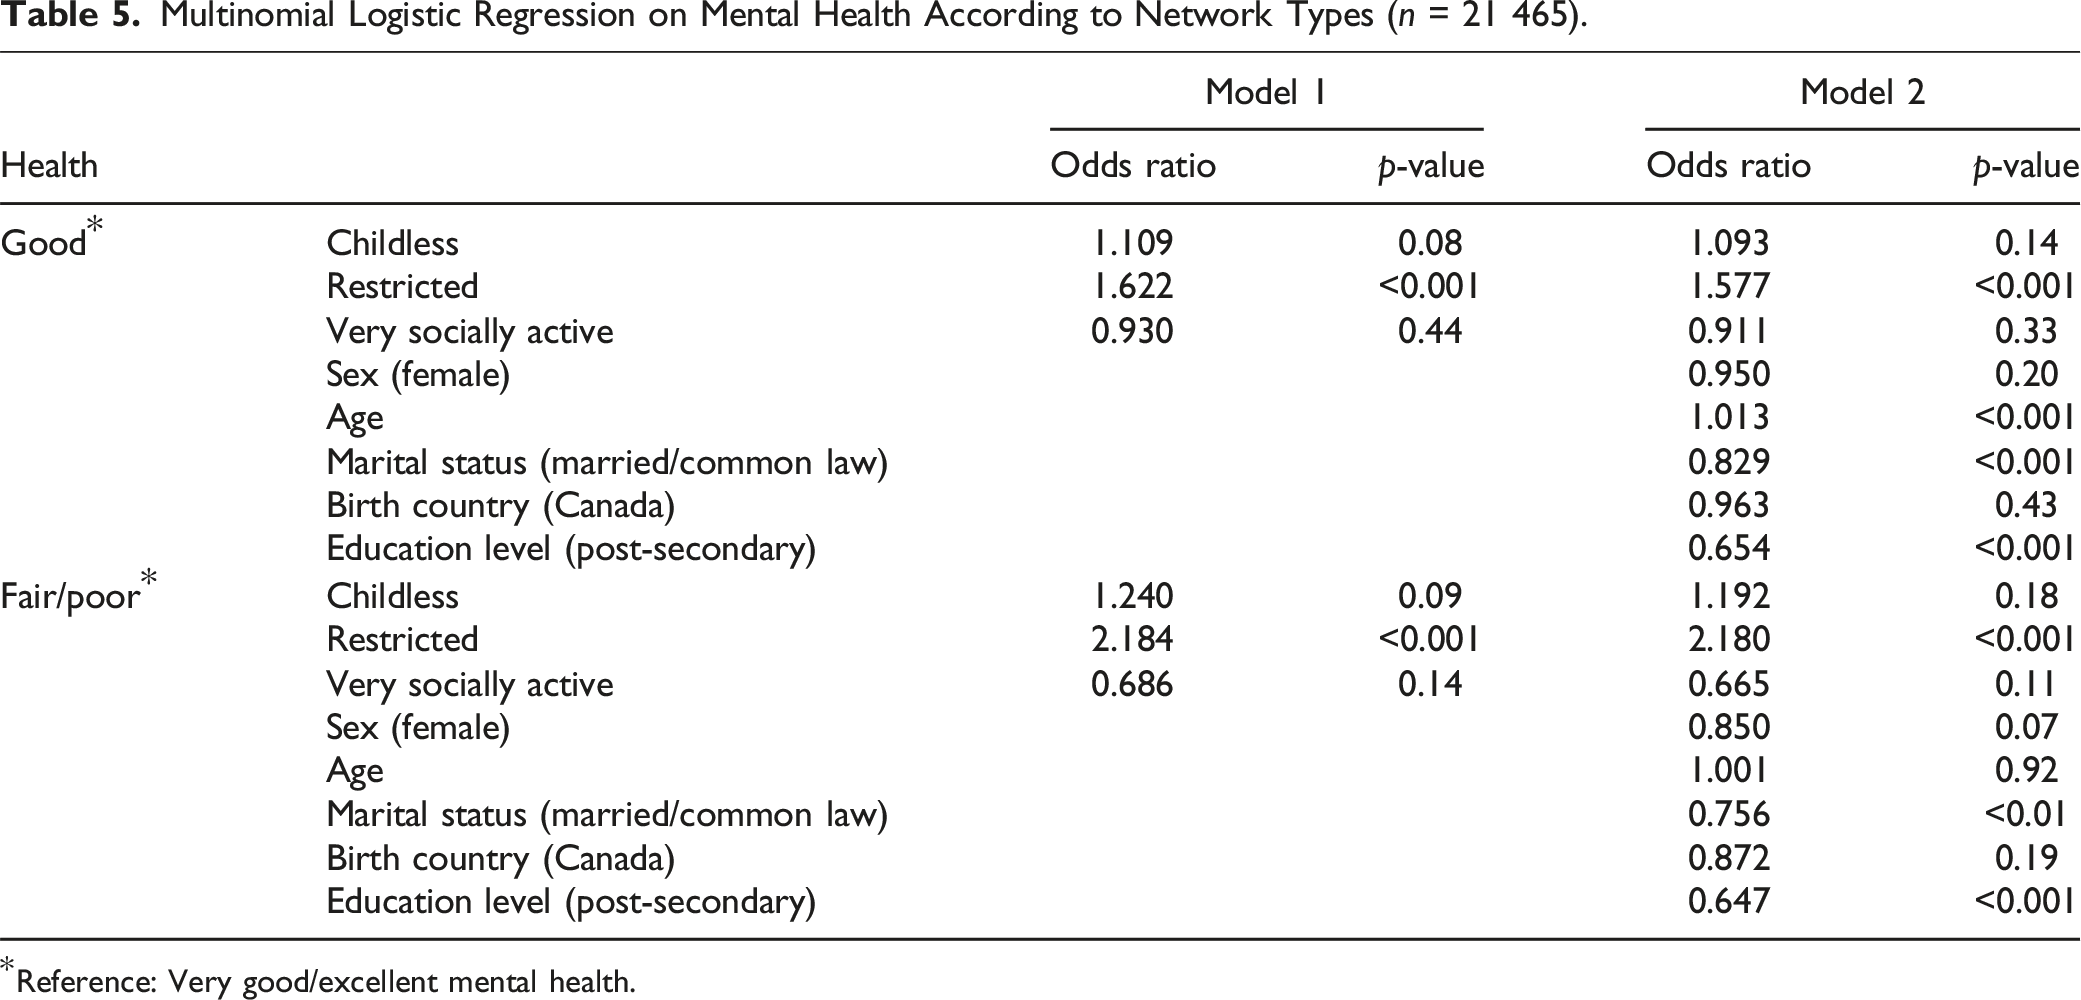
Reference: Very good/excellent mental health.
Discussion
Following a review of the main findings, some more surprising results are highlighted, along with hypotheses to explain them. Next, we present a brief discussion around the importance of social interactions’ quality, including negative interactions. Finally, before strengths and limitations, the complexity of the social support concept is mentioned while discussing the opposition between perceived needs and what is offered to individuals.
This article documented the diversity of social participation and network among older Canadians and examines their association with general and mental health. Older Canadian adults were grouped within four networks, that is, ‘diverse’, ‘childless’, ‘restricted’, and ‘very socially active’. In line with other research using a typology to document social networks in older adults, the ‘diverse’ and ‘restricted’ groups were identified (Fiori et al., 2007; Harasemiw et al., 2017; Litwin, 2001; Litwin & S., 2011; Park et al., 2018; Park et al., 2014), as well as the ‘childless’ network (Harasemiw et al., 2017). To our knowledge, no other typology has documented the ‘very socially active’ group, highlighted the existence of individuals very active socially. Although latent profile analysis usually recommends excluding clusters representing less than 5% of the sample, this group contributes to better documenting social participation and network knowledge of older Canadians. Such knowledge can contribute to reduced ageism, as negative attitudes towards older adults have been associated with feelings of rejection, which reduces interest in social participation (United Nations, 2021). The networks of the present study also had contrasting sociodemographic profiles, as well as different associations with health. Compared to ‘diverse’ and very good or excellent health, the members of the ‘restricted’ group were about twice as likely of reporting fair or poor general and mental health. These results are consistent with the literature supporting social isolation as a risk factor for poor health (Cornwell & Waite, 2009). The ‘very socially active’ group reported lower probabilities of reporting good rather than very good or excellent general health but not mental health. These findings suggest that health disparities exist based on social participation and networks of older Canadians.
Representing just under 10% of the sample of the present study, the ‘restricted’ network might suggest that in 2011–2015 social isolation remains a relatively marginal phenomenon among older Canadians. Social isolation has nevertheless extremely changed in the last decade (Office of the U.S. Surgeon General, 2023), the temporal dimension of isolation being a central element to consider, and the challenges concerning its conceptualization and data availability are well documented (Cornwell & Waite, 2009; Valtorta et al., 2016). Although social isolation is often confused with its subjective counterpart, that is, loneliness, statistics suggesting it is a societal problem can be alarming. In 2019, a survey suggests that nearly half (48%) of Canadians reported feeling socially isolated, lonely or both (Reid, 2019). More longitudinal studies with large samples size such as CLSA are needed to better understand the duration of these situations, or perceptions. Since the long-term consequences are generally more significant, and social or health events can influence them, these situations are increasingly documented as a societal problem that needs to be rapidly tackled (Office of the U.S. Surgeon General, 2023). In addition, concerted efforts are needed to better operationalize, conceptualize, and measure social isolation and loneliness. These evidence-based interventions are also needed, while promoting a nuanced public discourse about older adults’ social connectedness (Canadian Coalition for Seniors' Mental Health, 2024).
Interestingly, being part of the ‘very socially active’ network did not appear to be a protective factor for mental health but a tendency was observed, suggesting that this needs to be investigated in future studies. These associations need to be further studied, beyond the components classically measured for social participation and network – as carried out in the present study – but also including the quality of social relationships. Due to its highly subjective nature, the quality of social relationships remains difficult to measure but can be decisive when older adults ask for support from people around them. The present results might suggest that, despite having a large network, and frequent social participation and interactions, the perceived availability of social support of older adults could lead to stressful situations in which the availability of support differs from what these members can offer in return.
It would be beneficial to include quality of social relationships in studying older people’s social participation and network. As conceptualized by Holt-Lunstad (2018), social relationships include three components: structure, function, and quality. While the first two have been typically well measured, the latter remains poorly documented, probably because of its intrinsic and perceptual nature. Even with many social relationships, an individual might present poor support if these ties are constrained or undesired (e.g. a poor quality relationship). To better understand the influence of these interactions on health, difficult social relationships are an interesting avenue to explore. Difficult relationships were found to be characterized by non-reciprocal give-and-take social support (Offer & Fischer, 2018), suggesting that function and quality dimensions of relationships are intertwined. Moreover, as there is an increase of older population born outside of Canada (Statistique Canada, 2022) and social participation and networks are culturally sensitive (Stankov, 2015), the quality of social interactions must be considered. Since norms and values shaping sociability vary according to context, culture, and time (Massé, 1995), investigating different groups of older adults over time would provide better understanding of health from an equity perspective.
Finally, although the present study has found that the perception of the availability of support differs according to social participation and network, subjective assessment of sufficient or desired support is needed. Yet, receiving and providing support has been documented to be more strongly associated when the support is perceived as needed (Melrose et al., 2015). Mixed results on the usefulness of social support on well-being have also been shown (Nurullah, 2012). One way to better understand possible difference between the support needed and availability is to compare these perceptions among members of networks. In some situations, children may provide functional assistance (shopping, transport) to their older relative, out of altruism or a sense of obligation. However, they might prefer to carry out these activities themselves to increase their opportunities for interaction with others. As not everyone reacts equally to the support they receive (Lestari et al., 2021), assessing the needs of the people is essential to help them according to their preferences.
Strengths and Limitations
Using an extensive database with a nationally generalizable sample of Canadians aged 65 and older, this study was the first to document the diversity of social participation and network among older Canadians and examine their association with health using both structural and functional indicators. These findings provide valuable insights into a key social determinant of health and could be used to improve modifiable elements on which health and social policies can act. In addition to the common structural and functional variables of social network, the frequency of social participation was considered as an indicator of the extent to which individuals’ participation in activities outside the home, sometimes in relation to people outside their personal social network, represents opportunities to expand their network. Also, because the latent class analysis relies on probabilities of membership to determine the number of classes, it provides greater statistical power than other types of hypothesis-free cluster investigation (Feuillet et al., 2015; Sinha et al., 2021). These results contribute to documenting social inequalities in health. Among limitations, as the data was collected between 2011 and 2015, it may not fully reflect the reality of social interactions in a post-COVID era that has redefined the nature, forms and frequency of social interactions. Although the frequency of online social interactions (How often do you use social networking sites to stay in touch or make plans with friends? How often do you use social networking sites to stay in touch or make plans with family?) was initially considered, its distribution was too skewed to be used in modelling. As the CLSA was not designed specifically for network analysis, few variables were available for a deeper explanation of findings, for example, with regard to the quality of interactions. A self-reported questionnaire increases the probability of a social desirability bias, especially regarding network size and perceived social support availability, as previously highlighted (Montgomery & chung, 1999; White & Watkins, 2000). As they might influence the associations between social participation and network and health, future studies should consider indicators of material or financial wealth. Moreover, cross-sectional data prevent documenting the stability of the networks over time, or the impact of these changes on health. Finally, some multiple-choice questions may have been difficult for respondents to interpret, particularly those relating to time (i.e. the distinction between ‘sometimes’ and ‘a little of the time’), and relating to gender, as only Male and Female were the only available answers in a mandatory question. No questions on gender were included in the questionnaire but CLSA introduced in 2019 a question on gender identity that could help overcome this limitation.
Conclusion
Building on both structural and functional indicators of network, and social participation, and using cross-sectional data from the CLSA, this article provides a social typology of older Canadians. Four types of social participation and network were identified, that is, ‘diverse’, ‘childless’, ‘restricted’, and ‘very socially active’. Their associations with health differ with members of the ‘restricted’ group being associated with higher probabilities of reporting fair or poor health, both general and mental, while the ‘very socially active’ group presented lower likelihood of reporting good general health. Children becoming independent, retirement, widowhood, and changes in individual housing or health, such as cognitive decline or reduced mobility (Alwin et al., 2018; Litwin & Stoeckel, 2013; Michèle et al., 2019; Röhr et al., 2020; Saito et al., 2021), have been observed to be associated with modifications in social participation and interactions. It thus appears essential to document the evolution of individuals within their network. This evolution should also be documented in terms of associations with the health and well-being of older adults, using latent transition analyses documenting changes in the composition and structure of social networks over time. Since social participation and networks are modifiable, policies, programs or interventions aimed at the well-being of older adults should be based on this knowledge. The transition from one type of network to another – for example, from a large, diversified network to one focussing on family ties – could be deliberate (the desire to spend more time with family following the birth of a grandchild), or constraint (declining mobility requiring more functional support). As life events are sometimes stressful or unexpected, and social participation and network can be key to cope, it is essential to better understanding factors associated with the maintenance of chosen, high-quality social relationships, as opposed to interactions constrained by functional limitations. It is necessary to continue documenting social networks (including online interactions) and participation in older Canadians, particularly to better understand their role in health inequalities. Enhancing the evidence base on specific social determinants of health inequalities such as social integration and participation, and more specifically social relationships’ quality, can inform decision-makers on ways to better understand these issues. This study’s findings could serve as a first step towards a closer look at the respective contributions of virtual and real-life social interactions in older adults as virtual interactions could be perceived as both a challenge and an opportunity to stay connected.
Supplemental Material
Supplemental Material - Typology of Social Participation and Network and Health in Older Adults: Results From the Canadian Longitudinal Study on Aging
Supplemental Material for Typology of Social Participation and Network and Health in Older Adults: Results From the Canadian Longitudinal Study on Aging by Véronique Deslauriers and Mélanie Levasseur, in Journal of Ageing and Health
Footnotes
Acknowledgements
This research was made possible using the data/biospecimens collected by the Canadian Longitudinal Study on Aging (CLSA). Funding for the Canadian Longitudinal Study on Aging (CLSA) is provided by the Government of Canada through the Canadian Institutes of Health Research (CIHR) under grant reference LSA 94473, and the Canada Foundation for Innovation, as well as the following provinces: Newfoundland, Nova Scotia, Quebec, Ontario, Manitoba, Alberta, and British Columbia. This research has been conducted using the CLSA Baseline Data Versions 3.4 (tracking cohort) and 4.1 (comprehensive cohort), under Application Number 170314. The CLSA is led by Drs. Parminder Raina, Christina Wolfson, and Susan Kirkland.
We would like to acknowledge the support of Daniel Naud and Lise Trottier in conducting and revising the statistical analysis or methods section presented in this paper.
Declaration of Conflicting Interests
The author(s) declared no potential conflicts of interest with respect to the research, authorship, and/or publication of this article.
Funding
The author(s) disclosed receipt of the following financial support for the research, authorship, and/or publication of this article: At the time of the study, Véronique Deslauriers received the Bourse de stage en milieu de pratique awarded by the Fonds de recherche du Québec (FRQ; #257178; 2022). Mélanie Levasseur was a FRQ Senior Researcher (#298996; 2021–2025). She now holds a Tier 1 Canadian Research Chair in Social Participation and Connection for Older Adults (CRC-2022-00331; 2023-2030).
Ethical Statement

Supplemental Material
Supplemental material for this article is available online.
Appendix
Classification Probabilities for the Most Likely Latent Class Membership (Column) by Latent Class (Row).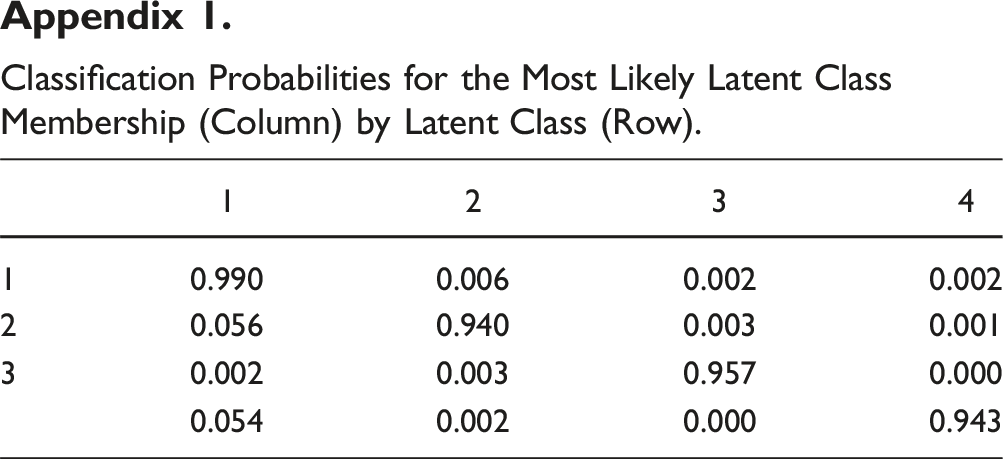
1
2
3
4
1
0.990
0.006
0.002
0.002
2
0.056
0.940
0.003
0.001
3
0.002
0.003
0.957
0.000
0.054
0.002
0.000
0.943
References
Supplementary Material
Please find the following supplemental material available below.
For Open Access articles published under a Creative Commons License, all supplemental material carries the same license as the article it is associated with.
For non-Open Access articles published, all supplemental material carries a non-exclusive license, and permission requests for re-use of supplemental material or any part of supplemental material shall be sent directly to the copyright owner as specified in the copyright notice associated with the article.
