
Abstract
Objective
Our study examines racial/ethnic differences in loneliness and social isolation among older adults with hearing loss.
Methods
Data were drawn from the 2022 Health and Retirement Study, including participants ages ≥50 with objectively determined hearing loss (N = 1817). Linear models were employed to analyze the association between race/ethnicity and both loneliness and social isolation.
Results
Initially, Black adults reported higher loneliness scores than White adults, but this trend reversed after controlling for contextual factors. Hispanic adults consistently showed lower loneliness scores across all models compared to both Black and White adults. Black adults reported significantly lower levels of social isolation compared to White adults, whereas Hispanic adults consistently exhibited higher levels than Black adults throughout the analysis.
Conclusion
These findings reveal distinct patterns of loneliness and social isolation across racial/ethnic groups among adults with hearing loss, highlighting the interplay between these outcomes and social, cultural, and societal factors.
Introduction
Age-related hearing loss is a widespread public health concern in the United States, affecting approximately one-third of adults aged 65–74 and nearly half of those aged 75 and older (National Institute on Deafness and Other Communication Disorders [NIDCD], 2023). With the aging population, this translates to tens of millions of individuals experiencing hearing loss, making it one of the most prevalent chronic conditions among older adults. Hearing loss can significantly impact an older adults’ quality of life, impeding their ability to carry out tasks such as activities of daily living (Gopinath et al., 2012; Holman et al., 2021), daily communications (Holman et al., 2021; Lemke & Besser, 2016), work-related tasks (Svinndal et al., 2018), and maintaining employment (Shan et al., 2020). Hearing loss can also lead to psychological distress, like social anxiety and depression, causes many older adults living with hearing loss to use maladaptive coping strategies such as withdrawal from social interactions (Dobrota et al., 2022) and relationships (Pichora-Fuller et al., 2016). These behaviors contribute to loneliness and social isolation—critical indicators of well-being. Moreover, hearing loss has been identified as a risk factor for discrimination (Denham et al., 2025) further exacerbating social disconnection and impairing social functioning. Given the established relationships between loneliness, social isolation, and adverse health outcomes such as cancer, inflammation, Alzheimer’s disease (National Institute on Aging, nd), and mortality (Holt-Lunstad et al., 2015), it is crucial to explore how loneliness and social isolation may differ across racial and ethnic groups living with hearing loss.
Loneliness is the subjective distressed feeling of being alone or separated, while social isolation is defined as the objective physical separation from other people (National Institute on Aging, nd). Though these variables are not synonymous and are not always correlated (Hawkley & Cacioppo, 2010), both inequitably affect older adults living with hearing loss (Huang et al., 2024; Shukla et al., 2020). A systematic review by Shukla et al. (2020) summarizing the current state of the literature on the association between hearing loss and loneliness and social isolation reports hearing loss to be associated with higher risk of both conditions among older adults in cross-sectional and longitudinal studies. Going beyond this association and focusing on intervention strategies, a recent scoping review (Hamada et al., 2025) examining the effectiveness of hearing aid adherence on loneliness and social isolation revealed the use of hearing aids in the presence of hearing loss can produce improvements in social engagement and reductions in feelings of loneliness and isolation. Though these results are optimistic, it is important to note the disparities in hearing aid use.
Previous literature suggests that individuals from racial or ethnic minority groups are less likely to participate in hearing healthcare help-seeking or use hearing aids when compared to non-Hispanic White adults (hereafter referred to as White; Nieman et al., 2016; Yi et al., 2022; Arnold et al., 2019). Using data from the National Health and Nutrition Examination Survey, Nieman and colleagues (2016) found that non-Hispanic Black (hereafter referred to as Black) older adults were less likely to use hearing aids compared to White older adults. Arnold and colleagues (2019) revealed similar findings, as older adults from Hispanic/Latino backgrounds had low rates of hearing aid use. Recent studies have examined the complex factors influencing hearing healthcare help-seeking and hearing aid adoption among individuals from racial or ethnic minority groups, revealing several structural and institutional mechanisms. Key factors identified include financial constraints due to high out-of-pocket costs for hearing aids (Bessen et al., 2024; Jilla et al., 2023), the impact of poverty on healthcare access and utilization (Arnold et al., 2019; Bessen et al., 2024; Lewis et al., 2025; Schuh & Bush, 2022), insufficient public awareness about hearing health management (Knudsen et al., 2010; Warren et al., 2024), persistent stigma associated with hearing loss and hearing aid use (Wallhagen, 2010), and perceived discrimination (Lewis et al., 2025). Using data from the National Institutes of Health All of Us dataset, Denham and colleagues (2025) examined adults with hearing loss and found an increased risk of discrimination within this group, exacerbating feelings of discrimination, particularly for Black individuals. Notably, many of these barriers intersect with known risk factors for increased loneliness and social isolation. This interconnection emphasizes that addressing hearing health disparities is not only important for better hearing, but also for improving mental and social well-being in diverse groups. Furthermore, it underscores the critical need to investigate racial and ethnic differences in experiences of loneliness and social isolation, particularly in relation to hearing loss.
Prior research examining the relationship between race/ethnicity and loneliness and social isolation has yielded complex and sometimes contradictory results. In a 2023 literature review examining the risk factors for loneliness, Barjakova and colleagues (2023), reported “mixed” results on racial/ethnic differences in loneliness among older adults as some studies reported lower levels of loneliness for those who identify as “White” adults compared to other races/ethnicities and other studies reporting opposite findings. Confounding patterns across racial and ethnic groups have also been examined in social isolation. Black adults are more likely to have smaller social networks—partly due to the impact of racial discrimination on socialization opportunities—and to rely on familial ties (Miyawaki, 2015). Hispanic adults often face challenges related to migration, language barriers, and cultural differences that can affect their social connections. However, familistic cultural norms among Black and Hispanic communities may foster strong familial bonds that mitigate feelings of social isolation which could explain why both groups are less likely to report feeling socially isolated compared to White adults (Cudjoe et al., 2018; Taylor et al., 2019). Additionally, it is important to consider potential biases in measures used to assess loneliness and social isolation, as these tools may not adequately capture culturally specific forms of social connectedness or the protective effects of familism (Trujillo Tanner et al., 2022). These conflicting findings highlight the need for more nuanced research that accounts for cultural differences, measurement biases, and the intersectionality of race/ethnicity, social and cultural contexts, and other social determinants of health in understanding experiences of loneliness and social isolation among diverse populations.
Despite the significant impact of hearing loss on social connectedness, limited research has examined how racial and ethnic backgrounds intersect with hearing loss to shape experiences of loneliness and social isolation in older adults. In this study, we conceptualize race and ethnicity not as biological determinants but as proxies for sociocultural, historical, and environmental factors that influence lived experiences and access to resources. Our objective was to explore how these factors contribute to loneliness and social isolation among diverse older adults living with hearing loss. Specifically, we asked: (1) To what extent do racial and ethnic group differences—used as proxies for broader social and structural experiences—relate to loneliness and social isolation among older adults with hearing loss? and (2) Do these differences remain after accounting for hearing-related factors and a range of demographic, health, and community-level variables? We emphasize that these group differences reflect cultural and environmental influences rather than innate biological differences. By exploring these questions, we aim to inform the development of more targeted and culturally sensitive interventions to address the psychosocial impacts of hearing loss in diverse older adult populations.
Methods
Data
This study included participants from the 2022 cohort of the Health and Retirement Study (HRS), a longitudinal survey of Americans over 50 conducted by the University of Michigan and sponsored by the National Institute on Aging (grant U01 AG009740). Since 1992, the HRS has collected biennial data through face-to-face interviews, covering demographics, objective and subjective health measures, and health conditions. In 2006, the HRS introduced a Self-Administered Psychosocial Leave-Behind Questionnaire (LBQ) for half of the interviewees, addressing social engagement, participation, networks, and loneliness (Smith et al., 2013).
As of the preparation of this study, the 2022 cohort included 15,856 participants. Of these, 4103 completed the LBQ, and 1817 had objectively determined hearing loss and self-identified as White, Black, or Hispanic, meeting the inclusion criteria for our study. Objective hearing loss in the HRS was assessed using the Siemens HearCheck Screener. Participants who wore hearing aids removed them for the test. The hearing screening device produced six pure tones at mid-range frequencies (1 kHz and 3 kHz), decreasing in intensity, and presented them to each ear separately, starting with the left ear. Participants were asked to indicate when they heard a tone by raising their hands. Based on prior research (Stephan et al., 2019), hearing loss was defined as hearing fewer than 6 tones in the better ear, while normal hearing was defined as hearing all 6 tones in at least 1 ear. Participants in the latter group were excluded from the study.
To ascertain household income, we used the RAND HRS Longitudinal File 2020 (V2), which includes data up to the 2020 wave. This data was merged with the 2022 HRS data using participant household identification numbers, as the 2022 income variable had not been released in the RAND HRS Longitudinal File at the time of manuscript preparation.
Measures
Dependent Variables
Loneliness and Social Isolation
Loneliness was assessed using the Hughes loneliness scale (Hughes et al., 2004). The Hughes loneliness scale is a psychometrically validated modified version of the Revised-UCLA Loneliness Scale (Russell et al., 1980) with an internal reliability of .72 (Hughes et al., 2004). The items on the Hughes Loneliness Scale are: (1) How much of the time do you feel a lack of companionship? (2) How much of the time do you feel left out? and (3) How much of the time do you feel isolated from others? Each question had a three-level response option of often, some of the time, and hardly ever or never. The responses were reverse coded so higher scores on the scale indicated greater loneliness. These scores were then summed to create a single scale ranging from 3 to 9. The Cronbach α of this measure in the present investigation was 0.80.
As the HRS does not include the variables of a psychometrically validated social isolation scale, such as the Lubben Social Network Scale (Lubben, 1988), 9 validated indicators seen in prior literature (Elayoubi et al., 2023; Taylor, 2020) were used to create a custom scale. Measures included: being married, monthly or more contact with adult children, other family members, and friends, active participation in clubs, groups, or volunteering, having friends and relatives living in one’s neighborhood, and reporting religious service attendance. In addition to these indicators, a measure indicating intergenerational living (living in a household with either biological/stepchildren, grandchildren, or both) was used to create the scale to ensure a culturally sensitive measurement of social isolation as seen in prior literature (Trujillo Tanner et al., 2022). All responses were coded dichotomously as no = 0 and yes = 1, then reverse scored and summed. Higher scores on the scale reflected higher levels of social isolation, ranging from 0 to 10. The Cronbach α of this measure was 0.70.
Independent Variables
Race and ethnicity were self-reported and categorized as Non-Hispanic White, Non-Hispanic Black, and Hispanic.
Covariates
Hearing-Related Characteristics
Subjective hearings ratings were assessed by participants’ response to the question, “Is your hearing excellent, very good, good, fair, or poor (using hearing aid as usual)?”. The possible responses were coded accordingly as 1 (excellent) through 5 (poor). Participants were also asked “Do you wear a hearing aid?” Responses were dichotomized as yes = 1 and no = 0.
Demographic Covariates
Age, sex, educational attainment, and relationship status were self-reported. Educational attainment was categorized as less than or equal to high school, some college/associates degree, and bachelor’s degree or more. Sex and relationship status were dichotomized as male = 0, female = 1, and not married/partnered = 0, married/partnered = 1. Employment status was self-reported and categorized as employed = 1, not working/laid off = 2, retired = 3, and disabled = 4. Total household income was categorized into quartiles based on the overall self-reported income levels, which were defined as: low income, lower-middle income, upper-middle income, and high income.
Health Status and Functional Capacity
Health covariates were self-reported and include self-rated health, chronic health conditions, activities of daily living (ADL), instrumental activities of daily living (IADL), depressive symptoms, subjective hearing ratings, and hearing aid use. Self-rated health was assessed by participants’ response to the question, “Would you say your health is excellent, very good, good, fair, or poor?”. The possible responses were coded accordingly as 1 (excellent) through 5 (poor). Chronic health conditions were derived from questions that asked participants whether a medical professional had ever told them that they had high blood pressure, diabetes, cancer, lung disease, heart problems, stroke, arthritis, or psychiatric disorder. We summed the number of health conditions reported with a range of 0 to 8.
To assess ADLs, participants were asked if they experienced any difficulty due to physical, mental, emotional, or memory issues with the following tasks: (a) dressing (including putting on shoes and socks), (b) eating (such as cutting up food), (c) using the toilet (including getting up and down), (d) bathing and showering, (e) getting in and out of bed, and (f) walking across a room. Responses were dichotomized as 0 = no and 1 = yes, and then summed to create a scale ranging from 0 to 5, where higher scores indicated greater ADL difficulty. The same method was applied to assess IADLs, which included tasks such as (a) preparing a hot meal, (b) shopping for groceries, (c) making telephone calls, (d) taking medications, and (e) managing finances, such as paying bills and tracking expenses, also on a scale ranging from 0 to 5.
Participants’ number of depressive symptoms were assessed using the eight-item Center for Epidemiologic Studies Depression Scale (CES-D) (Radloff, 1977). A composite score of the individual items were summed for a total count with a range of 0 to 8.
Neighborhood and Community Context
To assess participants’ perceptions of their neighborhoods, the Neighborhood Cohesiveness Scale was utilized (Kim et al., 2020). This scale includes statements such as, “I really feel part of this area,” “Most people in this area are friendly,” and “Most people in this area can be trusted.” All items were reverse scored with scores ranging from 1 to 7, and a sum score range of 8–56 with higher scores indicated better neighborhood quality. The internal Cronbach α of this measure was 0.90. Discrimination was also a part of this domain and was assessed using the Everyday Discrimination Scale (Williams et al., 1997), containing questions like “You are treated with less courtesy or respect than other people” and “You receive poorer service than other people at restaurants or stores.” All items were reverse scored and summed with a range of 6–36 and higher scores indicative of greater daily discrimination. The Cronbach α of this measure was 0.83.
Statistical Analyses
All statistical analyses were completed using SAS (Statistical Analysis Software, SAS Institute Inc., Cary, North Carolina, USA). First, descriptive analyses were performed, calculating means and standard deviations for continuous variables and frequencies and percentages for categorical variables. For continuous variables, we conducted one-way ANOVAs followed by post-hoc tests using Tukey’s method to identify significant differences between groups. Next, a series of general linear regression models (PROC GLM) explored the association between race/ethnicity and the dependent variables. To facilitate comparisons between racial/ethnic groups, we included two contrast variables: one using White older adults as the reference group to compare them with Black and Hispanic older adults, and another using Black older adults as the reference group to compare them with Hispanic older adults. For each dependent variable, we produced four models: Model 1: Adjusted for hearing aid use and subjective hearing ratings; Model 2: Further adjusted for sociodemographic factors; Model 3: Adjusted for health status and functional capacity; and Model 4: Further adjusted for neighborhood and community context. Statistical significance was determined at p < .05. Finally, we conducted zero-order correlations among loneliness, social isolation, and select independent variables that significantly influenced the final model to assess the robustness of our findings through sensitivity analyses.
To address missing data, we employed multiple imputation using the Multivariate Imputation by Chained Equations (MICE) method using PROC MI. We created five imputed datasets to account for uncertainty in the imputed values. The imputation model included the ADLs and IADLs, as these measures are administered only to a subset of participants in the HRS.
Results
Descriptive Characteristics of the Sample
Descriptive Characteristics of the Sample (N = 1817) by Race/Ethnicity.
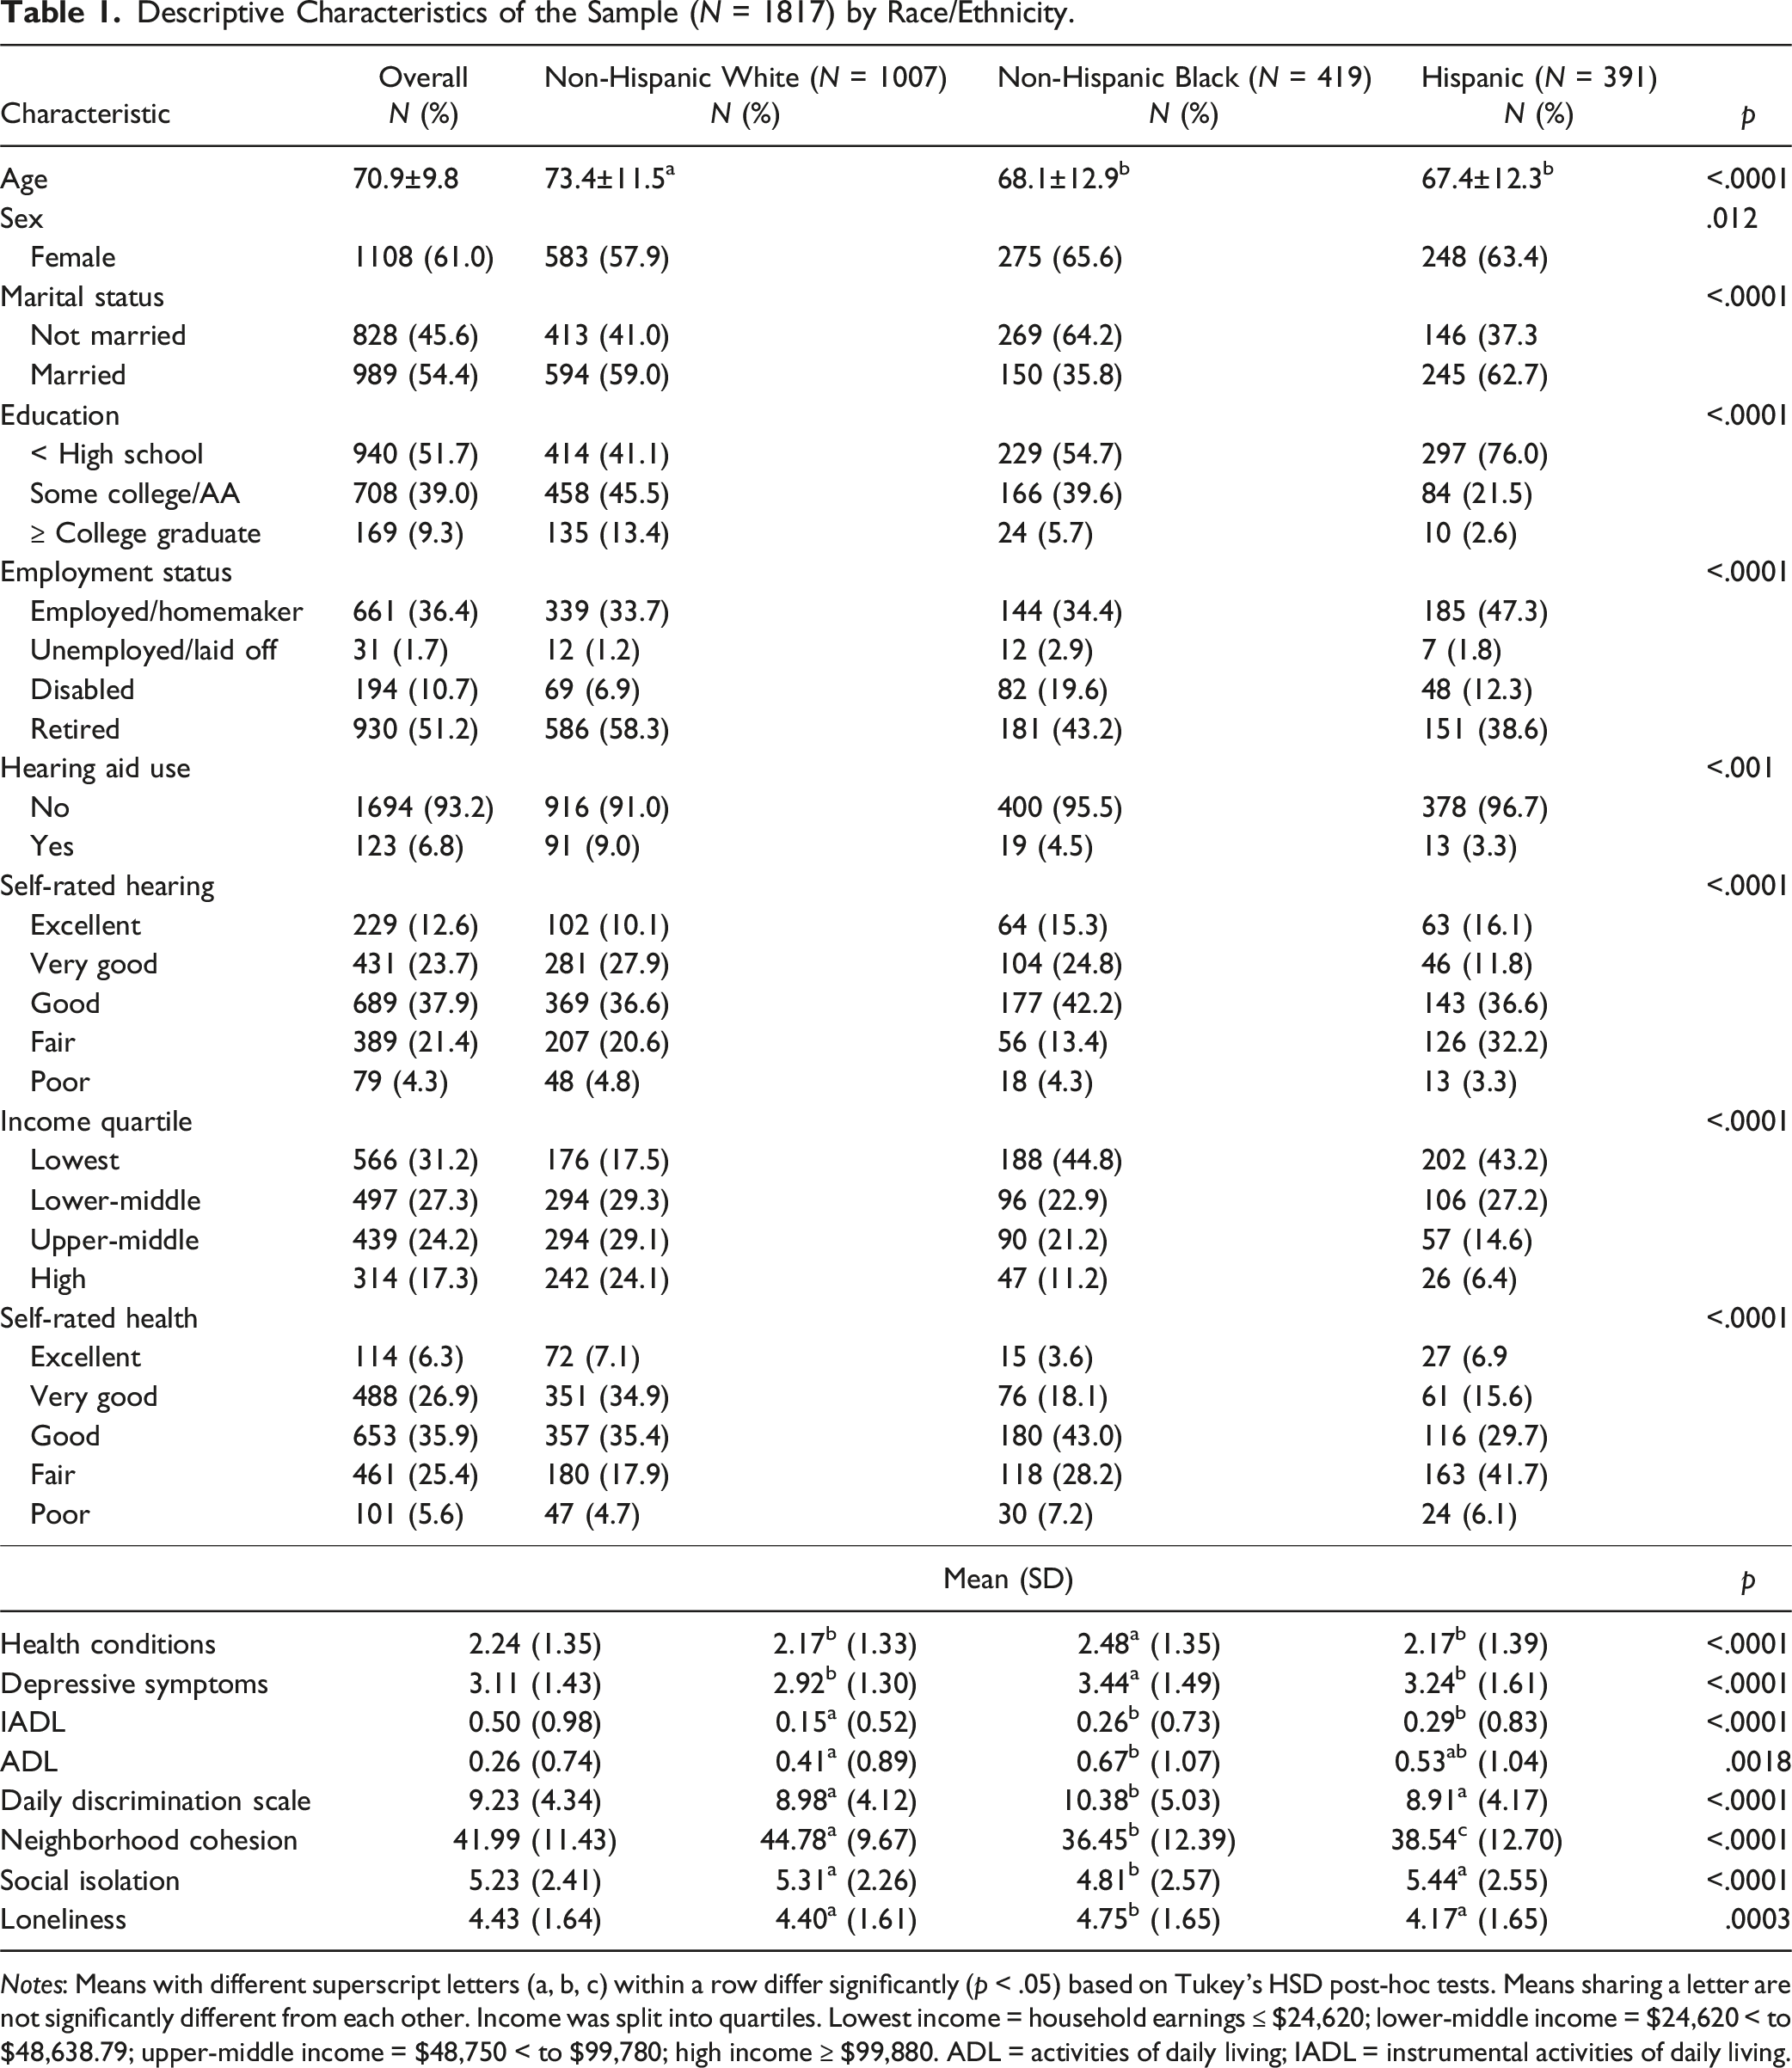
Notes: Means with different superscript letters (a, b, c) within a row differ significantly (p < .05) based on Tukey’s HSD post-hoc tests. Means sharing a letter are not significantly different from each other. Income was split into quartiles. Lowest income = household earnings ≤ $24,620; lower-middle income = $24,620 < to $48,638.79; upper-middle income = $48,750 < to $99,780; high income ≥ $99,880. ADL = activities of daily living; IADL = instrumental activities of daily living.
Despite all participants having hearing loss, only 6.8% used hearing aids, with usage being highest among White older adults (9.0%) and lower among Black (4.5%) and Hispanic older adults (3.3%; χ2(2) = 16.91, p < .001). Self-rated hearing varied significantly across groups (χ2(8) = 120.33, p < .001), with Hispanic older adults reporting the highest proportion of fair or poor hearing (35.5%). Income disparities were present (χ2(6) = 273.84, p < .0001), with 24.1% of White older adults in the highest income quartile compared to 11.2% of Black and 6.4% of Hispanic older adults.
Self-rated health also differed significantly (χ2(8) = 160.37, p < .0001), with White older adults reporting better health overall. Health conditions varied across groups (F(2, 1814) = 14.84, p < .0001, η2 = .016), with Black older adults reporting the highest mean number (M = 2.48), significantly higher than both White (M = 2.17) and Hispanic (M = 2.17) older adults. Depression scores also differed significantly (F(2, 1814) = 26.04, p < .0001, η2 = .028), with Black (M = 3.44) and Hispanic (M = 3.24) older adults reporting higher levels than White (M = 2.92) older adults. Functional ability measures showed significant differences, with Black and Hispanic older adults reporting higher IADL scores (F(2, 1814) = 24.37, p < .0001, η2 = .026; M = 0.26 and M = 0.29, respectively) compared to White older adults (M = 0.15). ADL scores (F(2, 1814) = 6.37, p = .0018, η2 = .007) were highest among Black older adults (M = 0.67), significantly different from White older adults (0.41).
Daily discrimination experiences were highest among Black older adults (M = 10.38), significantly different from both White (M = 8.98) and Hispanic (M = 8.91) older adults (F(2, 1814) = 14.09, p < .0001, η2 = .015). Neighborhood cohesion was highest among White older adults (M = 44.78), followed by Hispanic (M = 38.54) and Black (M = 36.45) older adults, with all groups significantly different from each other (F(2, 1814) = 89.24, p < .0001, η2 = .090). Loneliness showed significant differences across groups (F(2, 1814) = 8.51, p = .0003, η2 = .009), with Black older adults reporting the highest mean score (M = 4.75), significantly different from both White (M = 4.40) and Hispanic (M = 4.17) older adults. Social isolation scores also varied significantly (F(2, 1814) = 10.65, p < .0001, η2 = .012) with White (M = 5.31) and Hispanic (M = 5.44) older adults reporting higher levels than Black (M = 4.81) older adults.
Racial/Ethnic Differences in Loneliness and Social Isolation
Loneliness
OLS Regression Models Predicting Loneliness by Race/Ethnicity.
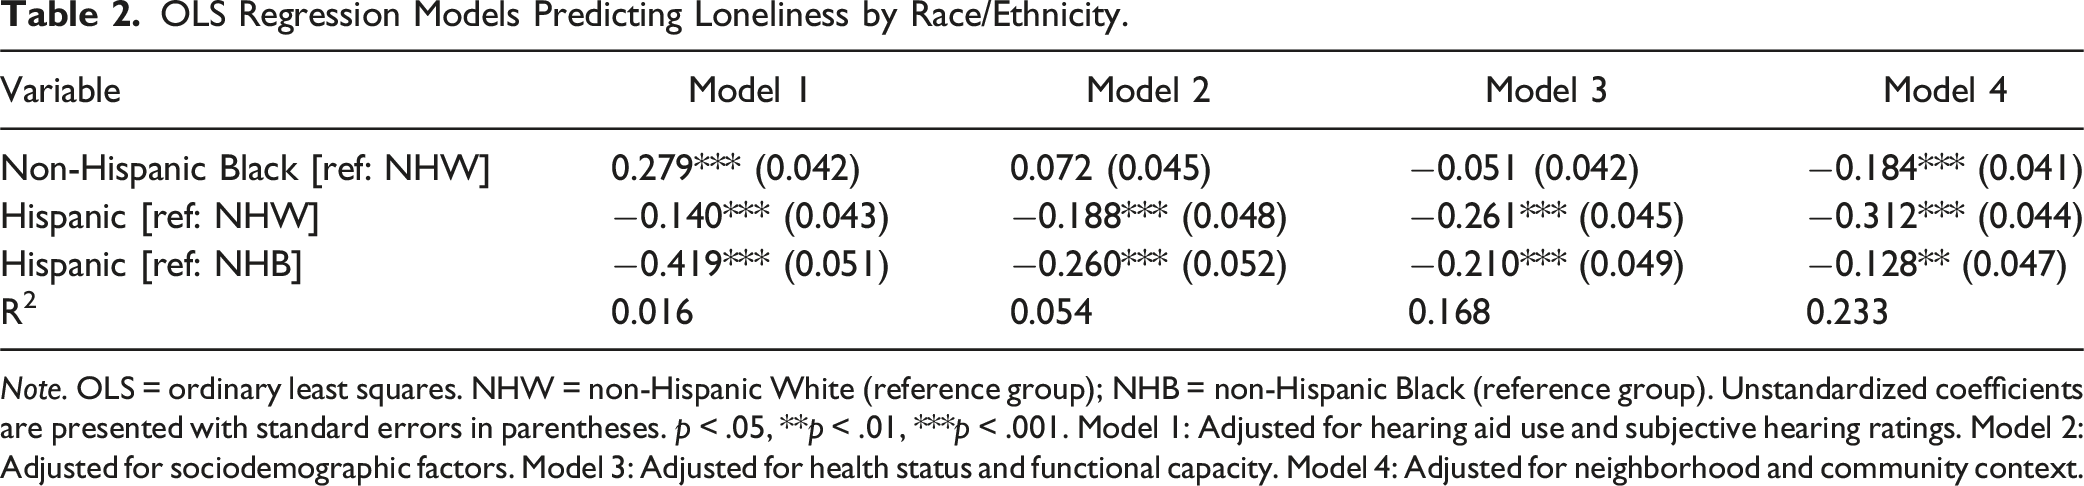
Note. OLS = ordinary least squares. NHW = non-Hispanic White (reference group); NHB = non-Hispanic Black (reference group). Unstandardized coefficients are presented with standard errors in parentheses. p < .05, **p < .01, ***p < .001. Model 1: Adjusted for hearing aid use and subjective hearing ratings. Model 2: Adjusted for sociodemographic factors. Model 3: Adjusted for health status and functional capacity. Model 4: Adjusted for neighborhood and community context.
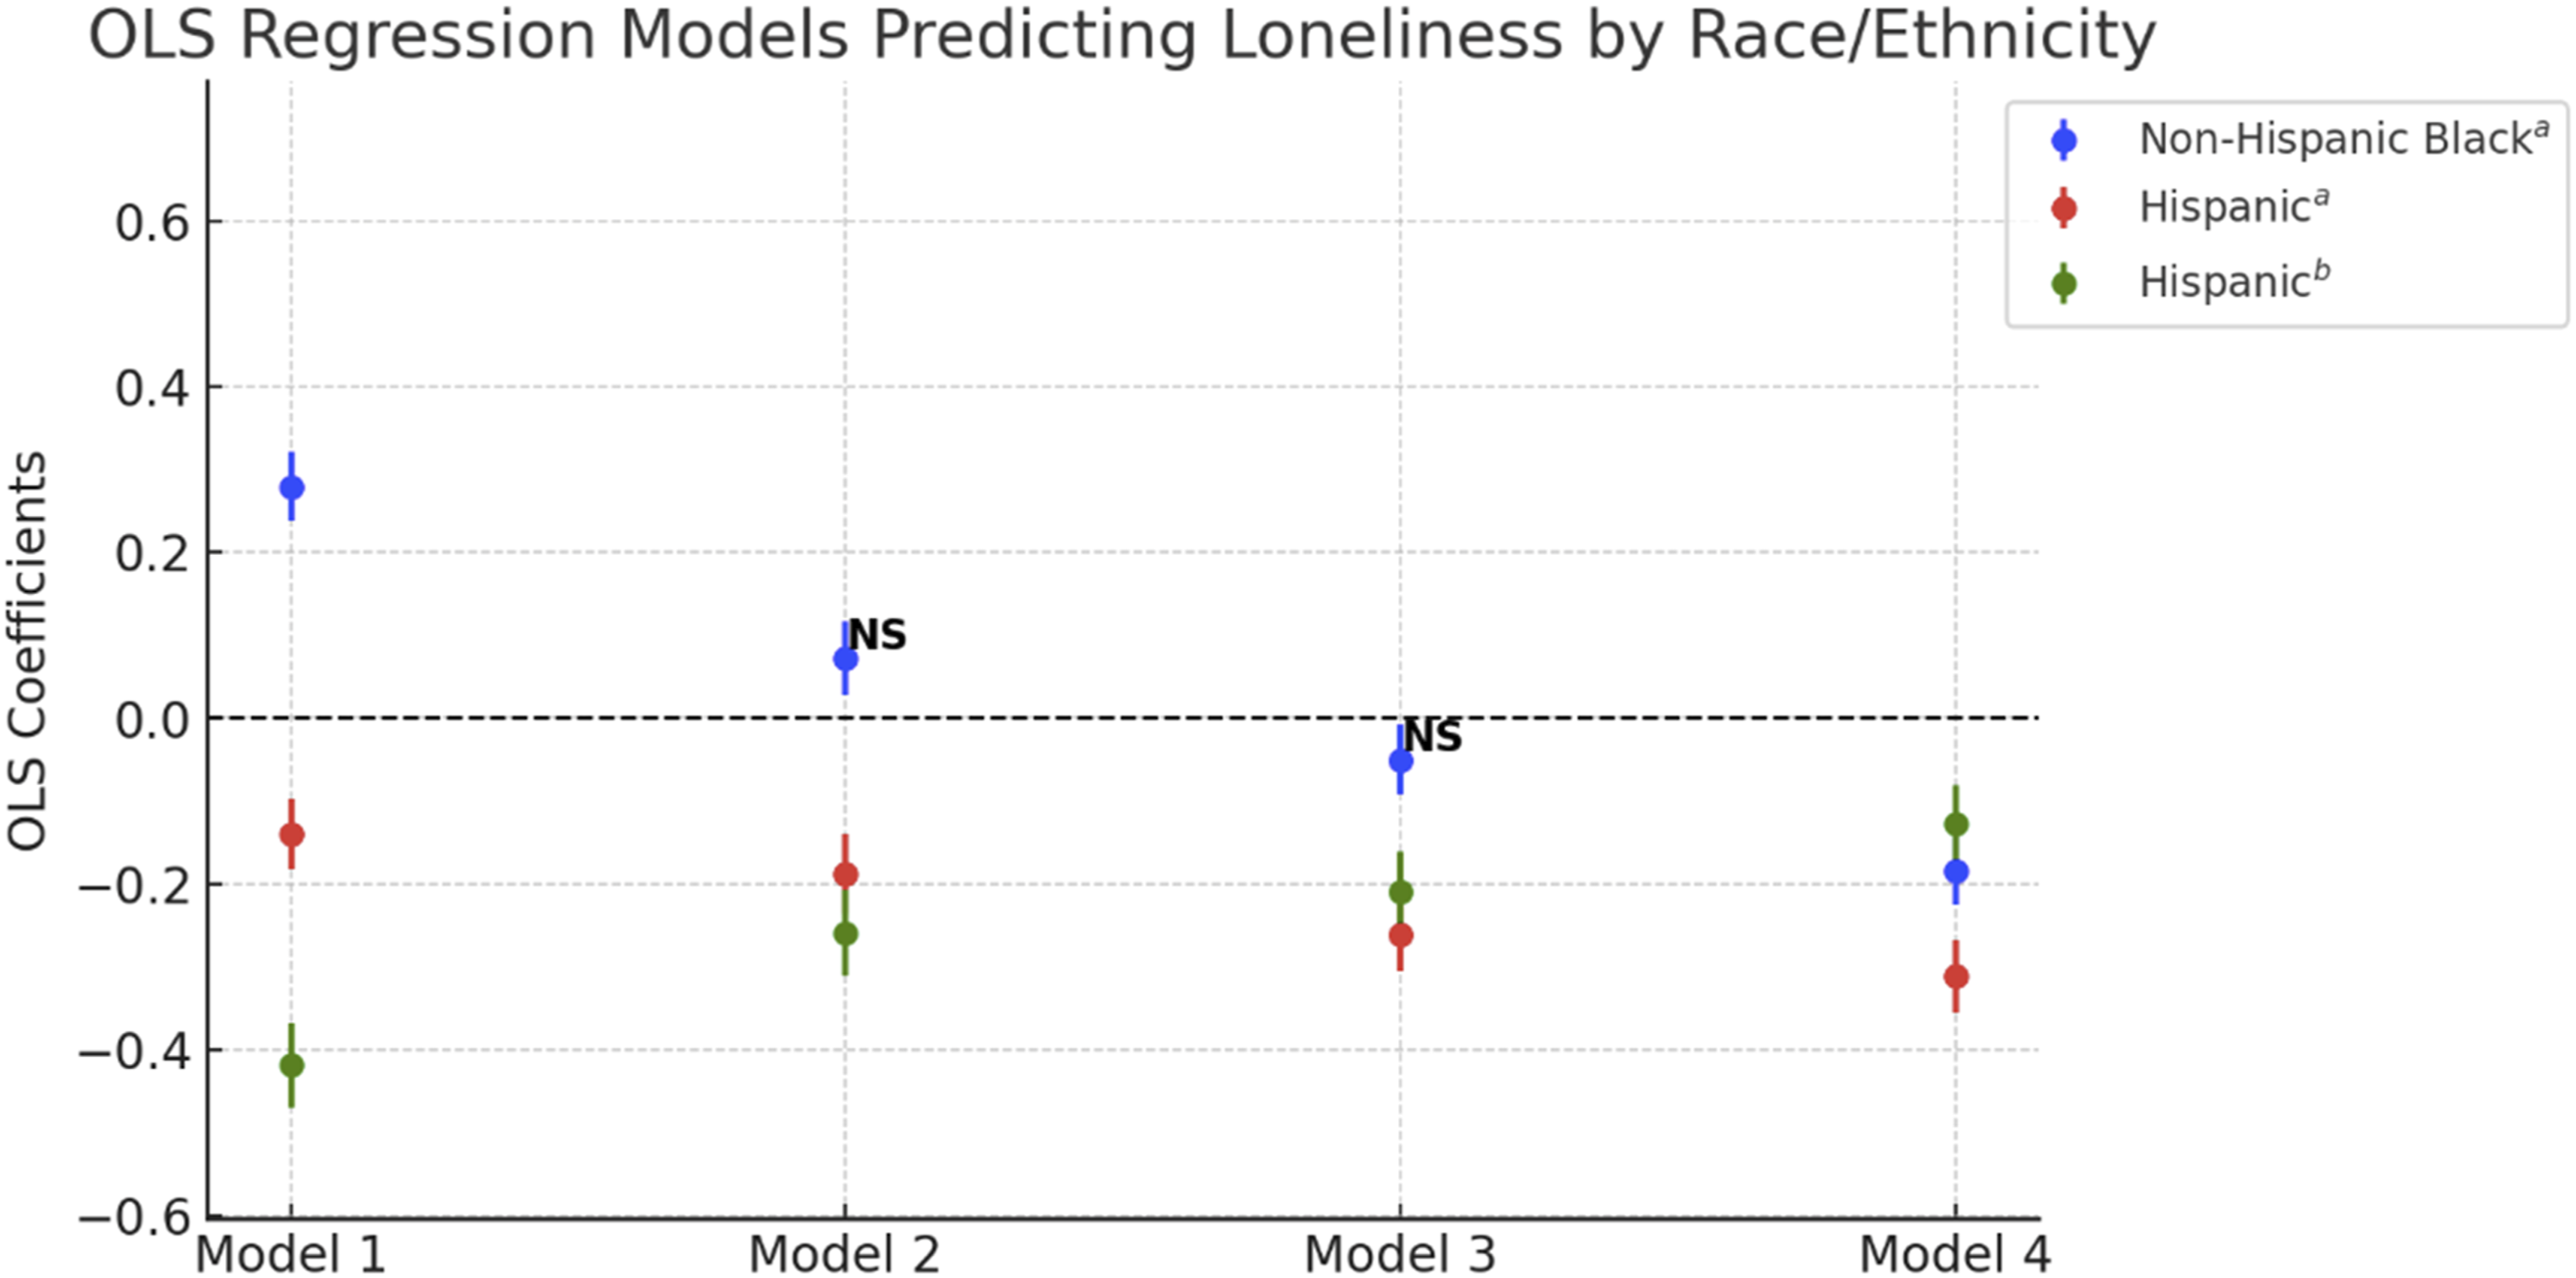
Visual representation of OLS regression models predicting loneliness by race/ethnicity. Note: OLS = ordinary least squares. Unstandardized coefficients are presented with 95% confidence intervals. Significance levels are indicated as follows: “NS” denotes non-significant results (p ≥ .05). Coefficients without “NS” are statistically significant at p < .05. Reference groups: (a) Non-Hispanic White for non-Hispanic Black and Hispanic, (b) non-Hispanic Black for Hispanic. Model 1: Adjusted for hearing aid use and subjective hearing ratings. Model 2: Adjusted for sociodemographic factors. Model 3: Adjusted for health status and functional capacity. Model 4: Adjusted for neighborhood and community context.
In Model 2, after controlling for sociodemographic variables, the association for Black older adults became non-significant (b = .072, SE = 0.045, p > .05) after controlling for sociodemographic variables. However, Hispanic older adults continued to show significantly lower loneliness scores compared to both White (b = −.188, SE = 0.048, p < .001) and Black older adults (b = −.260, SE = 0.052, p < .001, see Figure 1).
In Model 3, adjusting for health status and functional capacity, the association for Black older adults remained non-significant (b = −.051, SE = 0.042, p > .05). Hispanic older adults maintained significantly lower loneliness scores compared to White older adults (b = −.261, SE = 0.045, p < .001) and Black older adults (b = −.210, SE = 0.049, p < .001). Figure 1 further demonstrates this pattern, showing the decreasing magnitude of the loneliness among Hispanic older adults when compared to Black older adults as additional covariates are introduced.
In the fully adjusted Model 4, which included neighborhood and community context, Black older adults showed significantly lower loneliness scores compared to White older adults (b = −.184, SE = 0.041, p < .001), despite having higher levels in the initial model. Figure 1 illustrates this change. Hispanic older adults also demonstrated significantly lower loneliness scores compared to White older adults (b = −.312, SE = 0.044, p < .001) and Black older adults (b = −.128, SE = 0.047, p < .01). Other significant predictors of loneliness in the fully adjusted model included: poorer self-rated hearing (b = .052, p < .01), being female (b = .069, p < .05), not being married (b = −0.413, p < .001), higher education (b = 0.123, p < .001), higher depression scores (b = 0.309, p < .001), higher ADL scores (b = 0.068, p < .001), poorer self-rated health (b = 0.101, p < .001), higher daily discrimination (b = 0.078, p < .001), lower neighborhood cohesion (b = −0.019, p < .001), and being unemployed/laid off (b = −0.250, p < .05) (see supplemental Tables 1 and 2).
Social Isolation
OLS Regression Models Predicting Social Isolation by Race/Ethnicity.
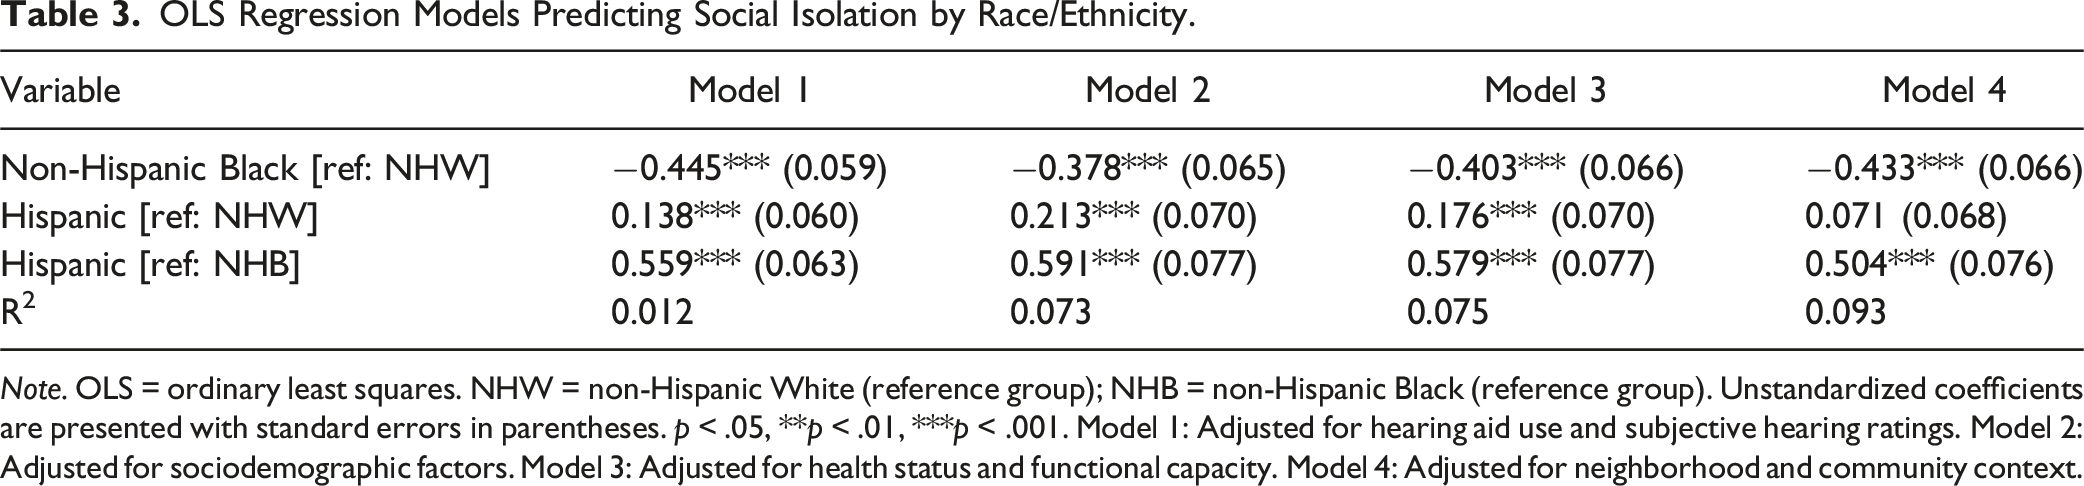
Note. OLS = ordinary least squares. NHW = non-Hispanic White (reference group); NHB = non-Hispanic Black (reference group). Unstandardized coefficients are presented with standard errors in parentheses. p < .05, **p < .01, ***p < .001. Model 1: Adjusted for hearing aid use and subjective hearing ratings. Model 2: Adjusted for sociodemographic factors. Model 3: Adjusted for health status and functional capacity. Model 4: Adjusted for neighborhood and community context.
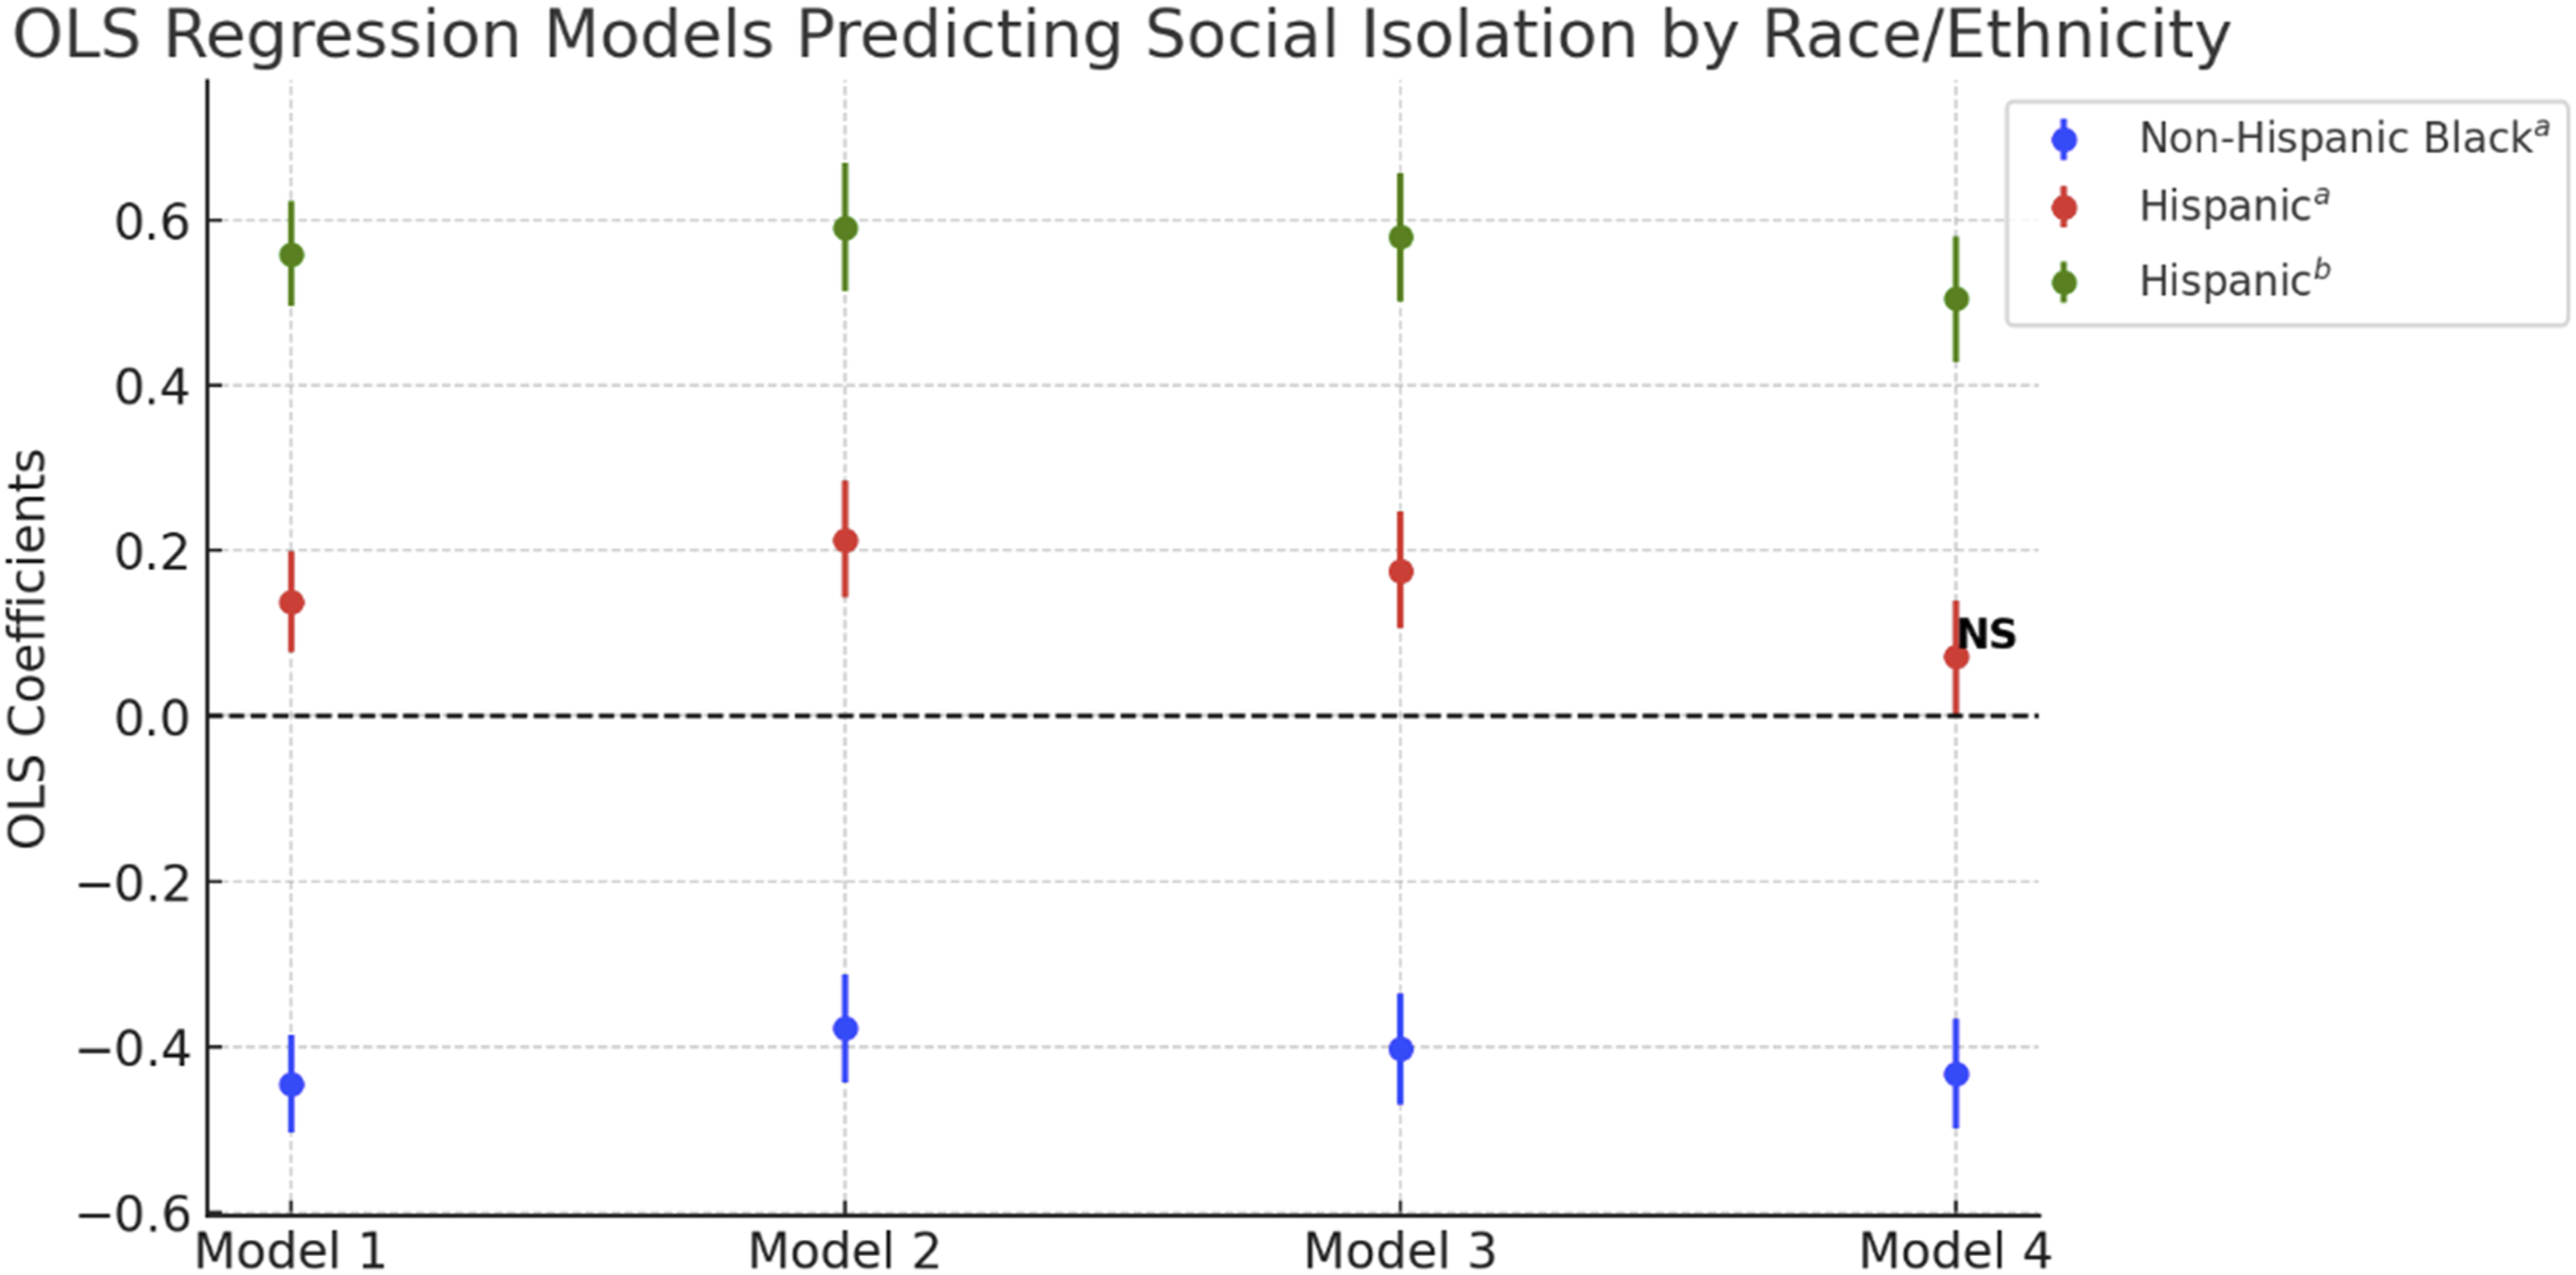
Visual representation of OLS regression models predicting social isolation by race/ethnicity. Note: OLS = ordinary least squares. Unstandardized coefficients are presented with 95% confidence intervals. Significance levels are indicated as follows: “NS” denotes non-significant results (p ≥ .05). Coefficients without “NS” are statistically significant at p < .05. Reference groups: (a) Non-Hispanic White for non-Hispanic Black and Hispanic, (b) non-Hispanic Black for Hispanic. Model 1: Adjusted for hearing aid use and subjective hearing ratings. Model 2: Adjusted for sociodemographic factors. Model 3: Adjusted for health status and functional capacity. Model 4: Adjusted for neighborhood and community context.
In Model 2, after controlling for sociodemographic variables, Black older adults continued to show significantly lower social isolation scores (b = −.378, SE = 0.065, p < .001). Hispanic older adults maintained significantly higher social isolation scores compared to both White (b = .213, SE = 0.070, p < .001) and Black older adults (b = .591, SE = 0.077, p < .001; see Figure 2).
In Model 3, adjusting for health status and functional capacity, Black older adults maintained significantly lower levels of social isolation (b = −0.403, SE = 0.066, p < .001). Hispanic older adults continued to show significantly higher social isolation scores compared to White (b = .176, SE = 0.070, p < .001) and Black (b = .579, SE = 0.077, p < .001) older adults.
In the fully adjusted Model 4, which included neighborhood and community context, Black older adults continued to exhibit significantly lower levels of social isolation (b = −.433, SE = 0.066, p < .001). The association between Hispanic ethnicity and social isolation became non-significant compared to White older adults (b = .071, SE = 0.068, p > .05). However, Hispanic older adults still showed significantly higher social isolation scores compared Black older adults (b = .504, SE = 0.076, p < .001; see Figure 2). Other significant predictors of social isolation in the fully adjusted model included: older age (b = 0.033, p < .001), being married (b = 0.297, p < .001), lower education (b = −0.280, p < .001), lower income rank (lowest: b = 0.445, p < .001; low: b = 0.512, p < .001; middle: b = 0.280, p < .001), being disabled and unable to work (b = 0.438, p < .001), being retired (b = 0.358, p < .001), poorer self-rated health (b = 0.138, p < .001), lower daily discrimination (b = −0.075, p < .001), and lower neighborhood cohesion (b = −0.017, p < .001).
Sensitivity Analysis
Zero-Order Correlations Among Race, Discrimination, Neighborhood Cohesion, Loneliness, and Social Isolation.
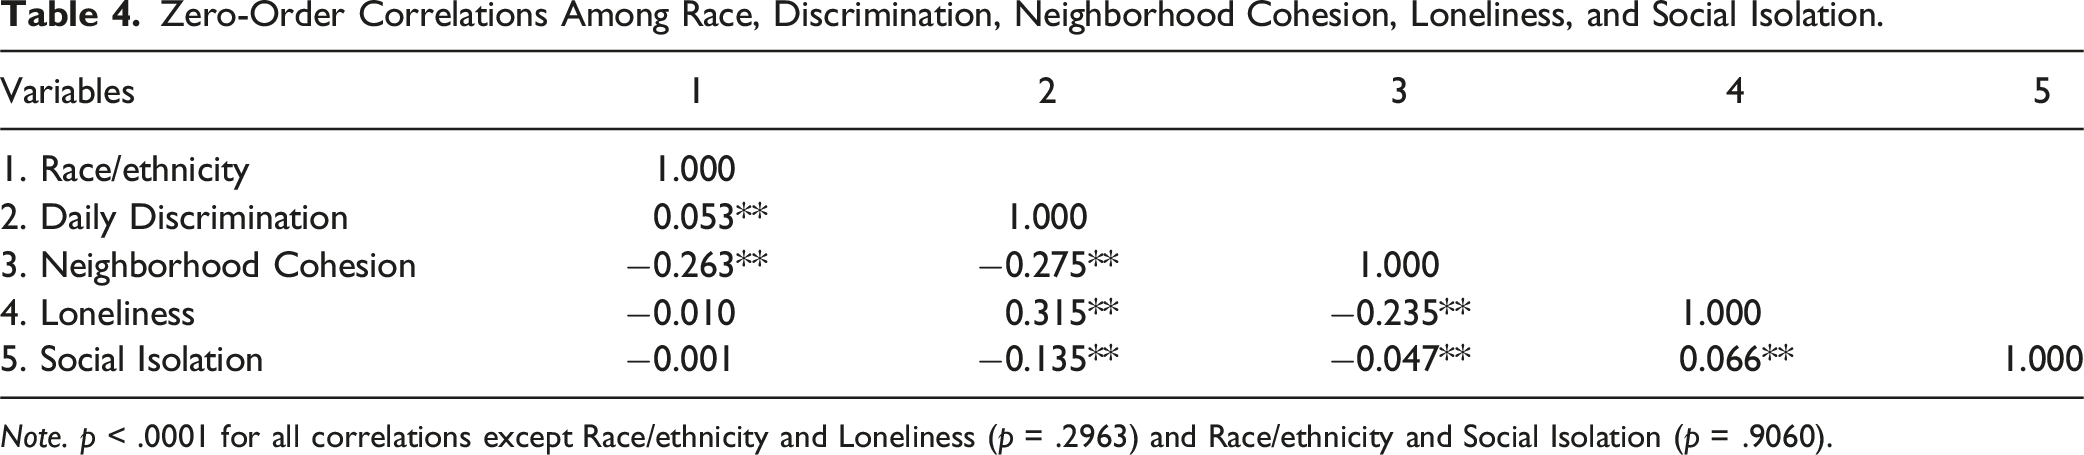
Note. p < .0001 for all correlations except Race/ethnicity and Loneliness (p = .2963) and Race/ethnicity and Social Isolation (p = .9060).
Race/ethnicity showed a weak positive correlation with daily discrimination (r = .053, p < .001) and a moderate negative correlation with neighborhood cohesion (r = −.263, p < .001). However, race/ethnicity was not significantly associated with either loneliness (r = −.010, p = .296) or social isolation (r = −.001, p = .906). Daily discrimination was moderately negatively correlated with neighborhood cohesion (r = −.275, p < .001) and moderately positively correlated with loneliness (r = .315, p < .001). Discrimination also showed a weak negative correlation with social isolation (r = −.135, p < .001). Neighborhood cohesion demonstrated a moderate negative correlation with loneliness (r = −.235, p < .001) and a very small negative correlation with social isolation (r = −.047, p < .001). Loneliness and social isolation were weakly positively correlated (r = .066, p < .001).
Discussion
The purpose of this research was to examine the impact of social, cultural, and societal factors on reports of loneliness and social isolation among older adults from varying racial and ethnic backgrounds. While significant differences emerged among racial and ethnic groups, no direct association was found between race/ethnicity and either loneliness or social isolation, highlighting the complex interplay of demographic, health, and contextual factors.
The examination of loneliness revealed a complicated dynamic among Black older adults. In the initial linear model, Black older adults had significantly higher loneliness scores compared to White older adults aligning with previous research on the influence of these variables on appraisals of loneliness among Black older adults (Ojembe et al., 2022; Taylor et al., 2023; Tibiriçá et al., 2022). However, upon controlling for neighborhood and community context, a notable suppression effect emerged, indicating that Black older adults experienced significantly lower loneliness scores than White older adults.
This suppression effect suggests that discrimination and neighborhood cohesion play pivotal roles in obscuring the relationship between race/ethnicity and loneliness among Black older adults. Previous literature supports this, highlighting the intersection of discrimination, race, and hearing loss, with a notably stronger relationship among Black individuals (Denham et al., 2025). When these contextual factors were considered, the data indicated that Black older adults with hearing loss may experience lower levels of loneliness compared to White older adults. Zero-order correlations reveal that higher perceived discrimination is linked to increased loneliness, while greater neighborhood cohesion is associated with reduced loneliness. Notably, Black older adults in the study experienced higher levels of discrimination and lower neighborhood cohesion compared to White and Hispanic counterparts. This finding suggests that the initially observed higher loneliness among Black older adults may be attributed to these contextual disparities. Previous literature supports the importance of contextual factors and communal ties in mitigating feelings of loneliness among Black older adults (Taylor et al., 2023; Miyawaki, 2015; Ojembe et al., 2022; Owen et al., 2023). This underscores the need for interventions addressing the impact of discrimination on mental health and promoting community cohesion, to effectively reduce loneliness in Black older adults living with hearing loss. Several interventions in other fields have targeted similar goals and can be adapted to meet the specific needs of this population (Ciechanowski et al., 2004; Northridge et al., 2012; Wilson & Givens, 2023).
In contrast to Black older adults, Hispanic older adults consistently demonstrated lower loneliness scores compared to their White and Black counterparts across all four models. This finding aligns with previous literature, suggesting that the communal nature of Hispanic communities, along with strong familial and social bonds, may contribute to reduced feelings of loneliness in this group (Ojembe et al., 2022). The protective effect of these cultural factors against loneliness is particularly noteworthy given the challenges faced by Hispanic older adults. However, the mechanisms underlying this resilience to loneliness among Hispanic older adults warrant further investigation, especially in the context of hearing loss and other age-related sensory impairments. While future research should continue to explore how cultural factors interact with health conditions to influence loneliness in diverse aging populations, recent work by Trujillo Tanner et al. (2022) has begun to address this gap by examining how culturally sensitive measures of social isolation among Hispanic older adults with sensory disabilities can illuminate the unique ways in which cultural values and family support may buffer against loneliness in the face of sensory impairments. Their findings indicate that, although Hispanics initially appeared more socially isolated due to reporting less social support from outside the home, they were actually more likely to report strong family social connections. This suggests that traditional measures of social isolation—which focus primarily on support outside the home and neglect family support—may lack content validity among Hispanic groups. Thus, culturally sensitive measures of social isolation will be increasingly consequential for future research and health policy to meet the needs of a diverse older population.
The relationship between race/ethnicity and social isolation presented a different pattern from that of loneliness. Black older adults reported significantly lower levels of social isolation compared to White counterparts across all models, a finding consistent with prior literature (Cudjoe et al., 2018; Taylor et al., 2019). The reduced isolation is thought to be a result of stronger familial ties within this group, which may serve as a buffer against disconnection (Cudjoe et al., 2018; Taylor et al., 2019). On the contrary, Hispanic older adults consistently exhibited higher levels of social isolation across all models compared to Black older adults, although this difference lost significance in the final model when compared to White counterparts.
This seemingly paradoxical finding—higher social isolation but lower loneliness among Hispanic older adults—can be partially explained by the zero-order correlations. Discrimination showed a stronger positive relationship with loneliness than with social isolation, suggesting that while discrimination may increase feelings of loneliness, it does not necessarily lead to objective social disconnection. Similarly, neighborhood cohesion exhibited a moderate negative correlation with loneliness and a weaker negative correlation with social isolation. These patterns suggest that strong community bonds, which are often prevalent in Hispanic communities, may be more effective in buffering against feelings of loneliness than in preventing objective social isolation. Prior literature has identified language barriers and discrimination as barriers to social integration among individuals of Hispanic backgrounds (Tibirica et al., 2022), which may contribute to social isolation. These findings highlight the complex interplay between racial/ethnic background, social factors, and experiences of loneliness and social isolation.
Our findings have important implications for hearing healthcare strategies and addressing health disparities. Hearing loss is increasingly recognized as a major public health crisis (Warren et al., 2024), with its prevalence expected to rise dramatically in the coming decades, particularly among older adults. This underscores the urgent need to study loneliness and social isolation in the context of hearing loss, particularly among diverse racial and ethnic groups. Our findings suggest that interventions aimed at reducing loneliness and social isolation among older adults with hearing loss should be tailored to the specific needs and cultural contexts of different racial and ethnic groups. For example, addressing discrimination and promoting community cohesion may be particularly effective for Black older adults, while interventions for Hispanic older adults might focus on reducing barriers to social integration while leveraging existing family support systems. Future research should further explore the mechanisms behind the resilience to loneliness among Hispanic older adults with hearing loss, as well as the unique challenges they face regarding social isolation.
Our study has several strengths, including the use of a diverse sample that reflects a wide range of racial and ethnic backgrounds among older adults, improving the generalizability of our findings to the broader population. Additionally, we incorporated multiple covariates that are strongly linked to hearing loss, loneliness, and social isolation, including chronic health conditions, income, and hearing aid usage. Furthermore, we accounted for neighborhood cohesiveness and discrimination indices, which are critical factors influencing loneliness and social isolation among individuals from racial or ethnic minority groups.
Despite these strengths, our study has notable limitations. Due to its cross-sectional nature, we cannot infer a causal relationship between hearing loss and either loneliness or social isolation among older adults from diverse racial/ethnic backgrounds. Future research can address this gap by using longitudinal methods. Additionally, the relatively small number of hearing aid users in our sample may have influenced our null findings on the impact of hearing aids on loneliness and social isolation. A future study can explore racial and ethnic differences in social engagement among hearing aid users to examine its direct effect. Moreover, our study could not account for hearing loss severity, as the HRS does not use full frequency range comprehensive audiometry (0.5–8 kHz), but a handle held hearing screener measuring responses from 1–3 kHz (Stephan et al., 2019). Previous research indicates that White older adults have more severe levels of hearing loss than Black and Hispanic older adults (Lin et al., 2012), thus potentially affecting our results. Furthermore, our study did not account for linguistic measures and the lack of specificity among Hispanics, as they are a heterogeneous group containing several subgroups with unique cultural backgrounds and experiences. We did not account for language proficiency nor provide a nuanced evaluation of this group. In addition, while we included intergenerational living in an attempt to create a more culturally sensitive measure, our assessment of social isolation still primarily relied on indicators of engagement outside the home, such as volunteering, active participation in clubs and groups, and the presence of friends and relatives living in one’s neighborhood. Recent work by Trujillo Tanner et al. (2022) suggests that such traditional measures may lack validity among Hispanic older adults, as they may not adequately capture the strong family social connections that are particularly salient in this population. As a result, our findings regarding social isolation among Hispanic participants should be interpreted with caution, and future research should consider culturally sensitive measures that account for family-based social support. Future studies should address these limitations to provide a more comprehensive understanding of the relationships between race/ethnicity, hearing loss, and social well-being in older adults.
Conclusion
Our findings underscore the complex nature of loneliness and social isolation among older adults from different racial/ethnic backgrounds. While Hispanic older adults were the least lonely, they experienced the highest levels of social isolation. In contrast, Black older adults were the least socially isolated but initially reported the greatest loneliness until social and community context factors were accounted for. The suppression effect observed in Black older adults emphasizes the critical role of contextual factors in shaping experiences of loneliness. For Hispanic older adults, the divergence between loneliness and social isolation highlights the need for nuanced approaches in understanding and addressing social well-being in this population.
Future research should further examine the unique challenges faced by Hispanic older adults living with hearing loss, particularly the factors contributing to higher social isolation despite lower reported loneliness. Additionally, interventions aimed at reducing loneliness and social isolation should consider the distinct experiences and needs of different racial/ethnic groups, addressing factors such as discrimination, neighborhood cohesion, and cultural values that shape social connections in later life. Moreover, given evidence that traditional measures of social isolation may not fully capture the family-based social connections salient among Hispanic older adults, future research and interventions should prioritize culturally sensitive assessments to better address the needs of this population.
Supplemental Material
Supplemental Material - Racial and Ethnic Differences in Loneliness and Social Isolation Among Older Adults With Hearing Loss: Findings From the Health and Retirement Study
Supplemental Material for Racial and Ethnic Differences in Loneliness and Social Isolation Among Older Adults With Hearing Loss: Findings From the Health and Retirement Study by Charity T. Lewis, Samantha Malak, Fumiko Hamada, and Julia Toman in Journal of Aging and Health
Footnotes
Funding
The author(s) received no financial support for the research, authorship, and/or publication of this article.
Declaration of Conflicting Interests
The author(s) declared no potential conflicts of interest with respect to the research, authorship, and/or publication of this article.
Supplemental Material
Supplemental material for this article is available online.
References
Supplementary Material
Please find the following supplemental material available below.
For Open Access articles published under a Creative Commons License, all supplemental material carries the same license as the article it is associated with.
For non-Open Access articles published, all supplemental material carries a non-exclusive license, and permission requests for re-use of supplemental material or any part of supplemental material shall be sent directly to the copyright owner as specified in the copyright notice associated with the article.