
Abstract
We examine the effects of nonprofit organizations’ resource streams and network ties on changes to the services provided and clientele served as specified in the mission statements. The organizations’ network ties are used to develop a measure of the services and beneficiaries mentioned in their inter-organizational (IO) peers’ mission statements. These measures of the content of peers’ mission statements were significant in predicting future changes in organizations’ mission statements. We argue that although mission statements are consistent with the rational systems approach by directing action toward some goal, future mission activities and clientele are greatly influenced by nonprofits’ IO ties, which is consistent with a hybrid open-natural systems approach.
Organizational researchers are divided when it comes to mission statements. For-profit research asserts that mission statements are malleable, do not say what the organization is about, and should be ignored (A. Campbell, 1997; Hanes, 1999; Krantz and Gilmore, 2009; Mazuris, 1999; McSherry; 1994). In contrast, nonprofit researchers view mission statements as not only important for internal direction, goal attainment measures, and constraints but also for external recruitment of human resources, donations, volunteers, and clientele (Brown & Yoshioka, 2003; Hull & Lio, 2006; James, 1983; Kinsbergen, Tolsma, & Ruiter, 2013; Mitchell, 2013). Although mission statements are viewed as goal setting instruments that nonprofit executives use to direct an organizations’ services, recently some nonprofit research has questioned this rational approach arguing that nonprofits are not closed systems but rather open systems embedded in their external environment via social networks that enable and constrain action (Carman & Nesbit, 2013; B. Chen & Graddy, 2010; Kapucu & Demiroz, 2013; Leiter, 2013; Wilson, 2013).
Drawing on rational and hybrid open-natural system theories (W. R. Scott and Davis, 2007), we propose that current social networks influence future changes in the nonprofits’ activities and beneficiaries mentioned in their mission statements. To test the hypotheses derived from this proposition, we utilize longitudinal data on mission statements, funding sources, activities, and networks of nonprofit organizations in the Minneapolis/St. Paul metropolitan area over a 9-year period. We seek to measure not only the extent to which current mission statements direct and constrain the activities of the organization but also the extent to which funding sources and networks among organizations drive changes in their mission statements.
Organizational Perspectives on Nonprofit Missions
W. R. Scott and Davis (2007) assert that there are three main organizational perspectives. The rational system perspective views organizations as pursuing specific goals using formalized social structures to achieve these ends, whereas the natural system perspective views organizations as being dominated by informal social structures with multiple conflicting embedded interests where policies and strategies are implemented mostly to ensure organizational survival. The third perspective discussed later is a hybrid. The first two perspectives view mission statements very differently. The open systems perspective views organizations as being embedded in the wider material resource and institutional environments. It also provides a rationale for why inter-organizational (IO) networks influence and shape organizations. In the following sections, we further define the rational, natural, and open systems perspectives as well as an open-natural hybrid combination, and then offer hypotheses based on these theoretical positions related to changes in nonprofit organizational mission statements.
Rational Systems
W. R. Scott and Davis (2007) describe organizations in the rational systems perspective as “collectives oriented to the pursuit of relatively specific goals and exhibiting relatively high formalized social structures” (p. 29). Research has found that mission statements are important for nonprofit organizations because the mission and its associated activities are well established before the search for human and financial resources begins (Brooks, 2005; Hull & Lio, 2006; James, 1983). In addition, nonprofit organizations tend to be driven by members’ idealism (Baum & Oliver, 1996; Bordt, 1997; Smith, 1997) with employees deriving intrinsic rewards when committed to the mission of the organization (Alatrista & Arrowsmith, 2004). Increasingly, mission statements are recognized as a strong management tool that can motivate employees and keep them focused on the organization’s purpose. For example, Brown and Yoshioka (2003), studying a youth and recreational service organization, found that employee satisfaction and intentions to remain with the organization were correlated with positive attitudes toward the organization’s mission. Kim and Lee (2007) found that nonprofit employees’ positive attitude toward the agency’s mission created loyalty to the organization. Moreover, mission statements are also recognized as a tool that can attract resources, guide decision-making, as well as being a management tool that rallies, motivates, recruits, and influences fund raising in addition to being a source of innovation, a distinct holistic identity, and an energy source (Brinckerhoff, 2009; McDonald, 2007; Vandijck, Desmidt, & Buelens, 2007; Young, 2001).
Natural Systems
W. R. Scott and Davis (2007) describe organizations in the natural systems perspective as
collectives whose participants are pursuing multiple interests, both disparate and common, but who recognize the importance of perpetuating the organization as an important resource. The informal structure of relations that develop among the participants is more influential in guiding the behavior of participants than is the formal structure. (p. 30)
The natural systems perspective does not view its formal goals as articulated in the mission statement as being as influential as the goals emerging from the informal structure and resource needs. Thus, organizations are governed by survival and will abandon the pursuit of avowed objectives to save themselves. Perrow (1961) argued that “official goals are purposely vague and general and do not indicate major factors which influence organizational behavior” (p. 854). The vagueness of organizational goals can empower the staff to develop new programs that they especially believe in and thus contribute to mission drift (Minkoff & Powell, 2006). Consequently, within this perspective, mission statements have little significance and will change in response to organizations’ resource conditions.
Researchers of for-profit organizations have drawn conclusions consistent with the natural systems perspective. Mazuris (1999), for example, argues that mission statements lack clarity, do not specify an audience, and are full of double talk and thus “are too often a waste of time and money, and so bland as to be meaningless to customers, employees and shareholders” (p. 20). Similarly Krantz and Gilmore (2009) complain that mission statements are often developed around popular management clichés such as passion, excellence, and service to customers, which then become detached from the daily operational realities and obfuscate understanding of the difficult challenges facing the organization. In addition, McSherry (1994) describes mission statements as “yearning for a rational sense of purpose beyond existing” (p. 9) and Hanes (1999) decried the staleness of mission statements to the point that “the only way for a company to stand out is to not have a mission statement at all” (p. 16). A. Campbell (1997) argues that mission statements may not just be meaninglessness jargon, but actually may do harm by creating emotional resistance from employees that do not share their espoused values.
Nonprofit organizations have also been found to have employees pursuing more their own interests rather than the organization’s mission. Carman and Nesbit (2013) and Salamon (1995) assert that employee interests drive nonprofits’ activities programs, while Dover and Lawrence (2012) found that internal power structures among employees inhibit creation of new programs to fulfill its mission. B. Campbell (1999) argues that this misalignment is partially due to the organization’s mission not being fully understood by funding sources due to a lack of clear oral and written communication. He concludes that if a donor doesn’t understand the mission and still contributes, it is not the mission statement that is guiding the organization.
Open Systems
The open systems perspective conceptualizes organizations as “congeries of interdependent flows and activities linking shifting coalitions of participants embedded in wider material-resource and institutional environments” (W. R. Scott & Davis, 2007, p. 32). Environments shape, support, and penetrate organizational boundaries to the point that connections with external elements can be more important than those within the organization. In contrast to rational and natural systems, the open systems perspective is not concerned with distinguishing formal from informal structures, but rather views the organization as a system of interdependent activities that cross organizational bounds, thereby making the formal/informal structure distinction irrelevant. With regard to mission statements, the open systems perspective would argue that organizational goals (formal or informal) are shaped and molded by their network ties and the institutions in which they are embedded.
In particular, IO ties and reoccurring transactions among organizations provide the context in which institutional isomorphism occurs (DiMaggio & Powell, 1983; Meyer & Rowan, 1977). This occurs when organizations operating in the same institutional field (and thus facing similar forces from the external environment) respond to uncertainty by mimicking others and adopting normative practices of the institutional field, thus resulting in organizations becoming increasingly similar. In general, nonprofits face isomorphic pressures from the industry and broader institutional field in which they operate (Leiter, 2013) but also simultaneously shape these pressures by promoting particular institutional logics and values within the institutional field (K. K. Chen, Lune, & Queen, 2013).
With regard to mission statements, White and Dandi (2009) found that the missions of 50 Catholic hospitals had similar components and values. Similarly, Peyrefitte and David (2006) examined the mission statements from four industries and concluded that isomorphism occurred due to the unique institutional pressures in each industry. More broadly, researchers argued that there has been a general convergence across all components of mission statements, including concern for society, customers, social responsibility (Kaptein, 2004; Leuthesser & Kohli, 1997). Hanes (1999) says that “words featured in mission statements have become so overused as to mean nothing” (p. 16) and thus implies that mission statement clichés are being copied from one organization to another. Suchman (1995) argued that this type of convergence may be driven to achieve a false appearance of legitimacy.
W. R. Scott and Davis (2007) argue that the open systems perspective is compatible with the rational and natural systems perspectives and can be combined to form a hybrid. With regard to nonprofit missions, the open-rational perspective argues that nonprofits will intentionally develop and use networks to achieve their organizational goals. Eng, Liu, and Sekhon (2012) found nonprofits leverage social mission to improve their ability to acquire network resources. Wilson (2013) found local governments implement municipal directives by using their nonprofit networks, and then build network ties with the targeted beneficiary group to implement the service. Kapucu and Demiroz (2013) found that nonprofits participate in network capacity building programs to strengthen network relationships.
The open-natural hybrid perspective predicts that organizations embedded in social networks are influenced and shaped by their networks often unintentionally. Thus, mission statements may not reflect the true goals of the organization, but instead articulate a mission that is more reflective of an organization’s position in a broader social environment. For example, Sosin (2012) found that nonprofits that engaged in network relationship strategies to maintain legitimacy with funding agencies often created new services and serviced new populations based on their relationships rather than organizational goals.
Hypotheses
In this section, we derive hypotheses to see which theoretical perspective has more empirical support. The rational systems perspective purports a strong linkage between the organization’s mission and activities and between mission statements over time. James (1983) argues that in nonprofits, mission comes first, then the leadership decides the goals which determine the choice of activities. After this is done, the nonprofit then seeks revenues to cover the variable costs of its activities and its fixed costs associated with buildings and administrative expenses. Thus, the mission and the associated activities are being marketed to attract and direct financial and human resources. Consequently, we expect that there is a correspondence between the activities described in the mission statements and what actually goes on in the organization. This is stated in Hypothesis H1 below:
Several hypotheses can be drawn from the open-natural perspective as organizations interact with the environment to obtain funding and reduce uncertainty. First, funding sources can affect mission statements. Similar to James (1983), we view donative transactions as qualitatively different than commercial transactions. Commercial transactions are governed by market exchange and narrow cost-benefit analysis, whereas donative transactions are affected more by moral sentiments and perspectives on the collective good. Consequently, organizations compete for support based on donors’ perceived value of the goods or services to the collectivity, the cost to provide these goods and services, and the likelihood that providers will deliver the goods in an effective manner (Hansmann, 1996).
With regard to mission statements, open-natural system theory would argue that organizations that rely on donor transactions to fund their activities are more likely to experience future goal displacement (see Froelich, 1999, for a comprehensive review) as the organization’s goals and activities are modified for two reasons. First, due to the volatility of donor transactions, nonprofits seek to replace donor revenues with diversified commercial revenues (AbouAssi, 2013; Carroll & Stater, 2009). Gronbjerg’s (1992, 1993) reported that it is not uncommon for individual contributions to fluctuate by as much as 50% a year. Consequently, nonprofits establish a diversified portfolio of commercial operations that are unrelated to their social mission to stabilize revenue (Cooney, 2011). For example, Liu and Ko (2012) found that British nonprofits diversified into unrelated retail operations to reduce their dependency on contributions. Second, goal displacement is more likely to occur with donor than commercial transaction due to large donations coming with strings attached. Kelly (1998) found that nearly 25% of survey respondents admitted altering priorities or goals to obtain a particular contribution. In addition, donors also indirectly influence who the organization chooses to serve. For example, R. A. Scott (1966) found that programs for the blind were changed to focus more on the “employable” blind adults because this particular target group resonated more with the donating public. Similarly, Milofsky and Blades (1991) found that health services targeting ailments of minority groups attracted less funding than health services more likely needed by those donating. Even corporate donations are likely to influence activities and target clients as corporations view their donations as part of their public relations strategy (Kelly, 1998). For example, DiMaggio (1986) found that corporate donations for the arts generally go to established mainstream organizations with programs of broad appeal and less likely to offend.
A more stable alternative source of funding is the government. Gronbjerg’s (1993) study participants describe public funding as being predictable and “money in the bank” (p. 173). Reiner’s (1989) study of public funds as seed money for community development organizations in New York found that over a 6-year period, few organizations had their funding discontinued even though they had failed to achieve self-sufficiency by the prescribed time. Public funding also poses less of a threat of goal displacement in terms of organizational activities (Gronbjerg, 1991). Liebschutz’ (1992) longitudinal study of six nonprofits in New York found that public funding resulted in minor deviations from their core mission. Thus, public funding provides organizational stability. Lecy and Van Slyke (2013) argue that the increase in public funding for nonprofits has created long-term relationships between government and third-party nonprofits to stabilize the production of services. Witesman and Fernandez (2013) found that in these relationships public officials trust nonprofits more than the for-profit providers and award them longer contracts with less monitoring. Consequently, public funding provides nonprofits with a safe haven from which they can fulfill their mission.
Although public funding is very stable and appears to be less likely to shift, constrain, or dictate organizations’ activities, it can be influential in shaping the organizations’ clientele. On the one hand, public funding resulted in organizations broadening their target group (Lipsky & Smith, 1990). On the other hand, Kirk and Kutchins (1992) assert that public funding for mental health services narrowed the clientele group as well as the diagnoses and associated treatments for mental illness as organizations conformed to government funding requirements. Overall, nonprofit organizations’ target groups are more likely to conform to public funding opportunities than the service provided. Thus, our hypothesis for public funding is as follows:
Open systems theory argues that social networks affect organizations in directed and intentional ways as well as in undirected and unintended ways. Although managers may invoke an open-rational response to uncertainty in the environment by working through their social network to gain access to new and unique information that gives rise to new product development and innovation (Kraatz, 1998; Smith-Doerr & Powell, 2005), to new alliance partners (Beckman, Haunschild, & Phillips, 2004), to new sources of volunteer labor (Paik & Navarre-Jackson, 2011), to financial and human capital (Eng et al., 2012), to larger grants (B. Chen & Graddy, 2010), and to legitimacy (Galaskiewicz, 1985), organizations and their managers may also be influenced by their networks. The open-natural perspective asserts that networks may have unintended or indirect influence on organizations due solely to its presence within the network. These unintended and indirect network influences have been found in nonprofits. Although there can be benefits from developing alliances between for-profit and nonprofit organizations, Baur and Schmitz (2012) found that these network alliances can result in loss of independence and credibility for nonprofits. B. Chen and Graddy (2010) found that although network expansion to meet requirements of the funding agency increased organizational learning, it did not improve client outcomes. Similarly, Paik and Navarre-Jackson (2011) found that although recruiting volunteers via networks was effective among those with religious involvement, recruiting did not affect those with bridging social capital or diverse ties. Thus, volunteering appears to be a natural network outcome for those with diverse ties.
With regard to mission statements, a nonprofit’s mere position within its network can potentially result in changes in mission activities and beneficiaries. Nonprofit organizations can learn firsthand about unmet community needs from their network contacts. They can also learn about new funding opportunities and new technologies that enable them to stay competitive and do their jobs better. Working with other organizations also means that organizational routines, procedures, and even priorities have to be modified, so as to ensure cooperative relations. In the process of exchanging resources and getting to know one another, organizations may come to value the same things which can result in their mission statements changing and becoming more similar. Therefore, we assert the following hypotheses:
Method
In 1980, we drew a stratified systematic sample of 326 organizations from a universe of 1,601 public charities in the Minneapolis/St. Paul metropolitan area. The sampling frame came from the Cumulative List of Organizations published by the Internal Revenue Service and was current for October 31, 1979. We excluded private and corporate foundations (although community and operating foundations were included) and churches, congregations, assemblies, and any other explicitly religious organizations (although we included organizations that provided charitable services and were affiliated with a church) from our sampling frame.
In late 1980 and early 1981, we did face-to-face interviews with the chief executive or operating officer of 229 organizations (a 70.2% response rate). We interviewed executives from 201 organizations of these organizations in late 1984 and early 1985 and from 174 of these organizations in late 1988, 1989, and 1990. In 1994 and 1995, we returned to the field and interviewed executives in 162 of these organizations about their organizations in 1992 and 1994. By the end of the study period in the summer of 1996, there were 156 organizations left in the panel and 155 of these had valid mission data. The attrition rate was 31.9%. We gathered data on mission statements and other data on the organizations during all four periods, but we only had network data for 1984 and 1988.
Mission Statement Data
The mission statements were content coded based on their domain of activities and the demographics of their beneficiaries. The coding was initially done by two of the authors independently who read through the statements for each organization and the third made the final coding decisions on any discrepancies between the two original coders. Agreement between the two coders for the coding of mission activities and beneficiaries was 91% and 96%, respectively. The coding categories for the domain of activities were based on the National Taxonomy of Exempt Entities’ (NTEE) categories. These activities were coded with a 1 if the organization’s mission statement specified their involvement in the activity j, and a 0 otherwise. The percentage of organizations with mission statements indicating their engagement in each activity for 1980, 1984, 1988, and 1992 are presented at the top part of Figure 1.
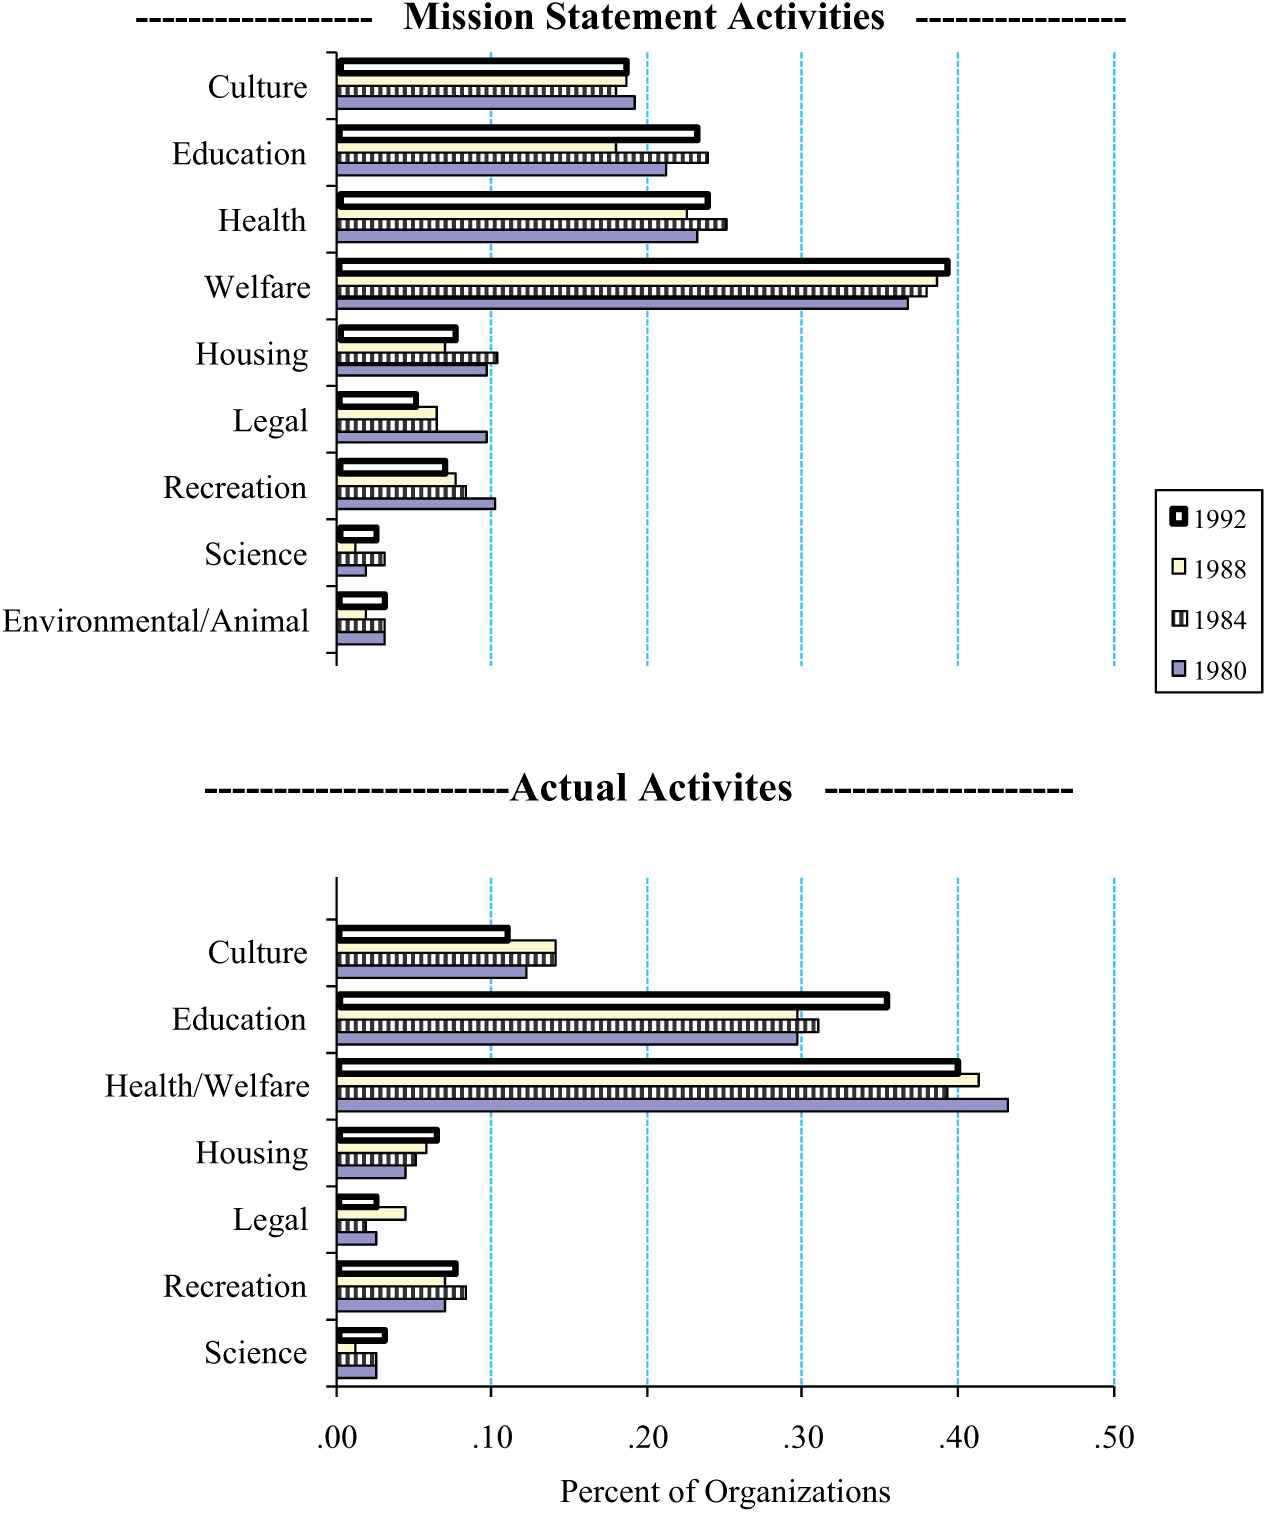
Organizational activities based on mission statements and actual activities performed.
The mission statements also were coded for the demographics of the organizations’ clientele, which we label beneficiaries. We used 13 of the initial 17 demographic categories because 4 of the categories were not served by any of the organizations. Demographics were coded with a 1 if the organization’s mission statement specified that they served demographic group j, and a 0 otherwise. Consequently, mission statements could indicate that the organization served multiple beneficiary groups. If no demographic group was mentioned in the mission statement, then all demographic categories were coded with a 0. In 1984, 64 organizations did not specify the demographic nature of their clientele, when compared with 54 organizations in 1988. The percentage of organizations targeting each demographic group for 1980, 1984, 1988, and 1992 are presented in Figure 2.
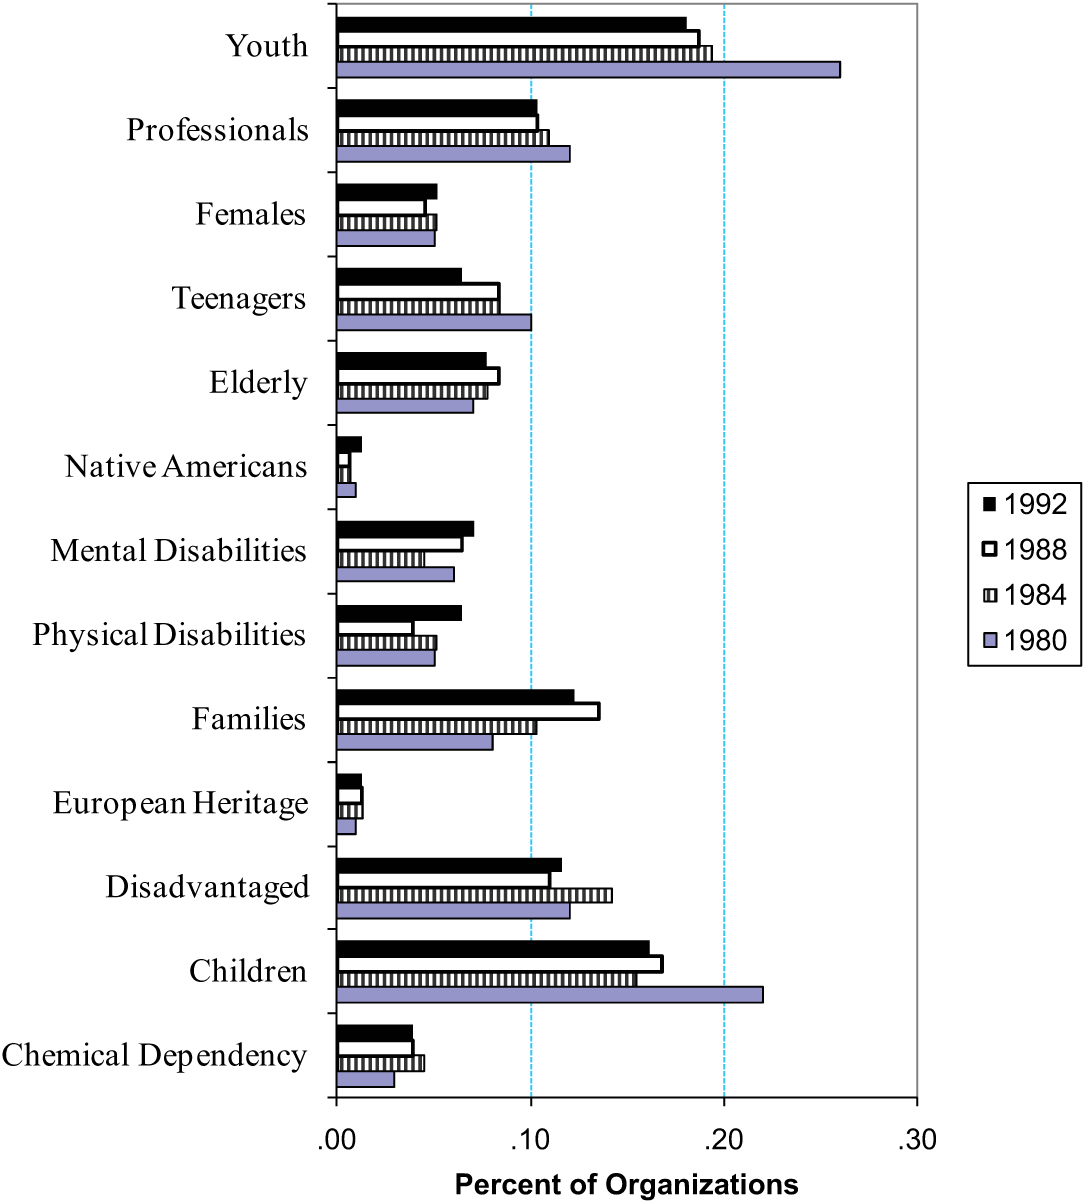
Clientele demographics based on mission statements.
Inter-Organizational Network Data
In 1984 and 1988, we asked organizational respondents to indicate, first, which nonprofits in our panel they gave information to or received information from about community affairs, technical matters, or political affairs; second, which organizations they sent to or received personnel, clients, and facilities; and, third, in which nonprofits did they know a manager or a staff person personally. This information was added across three asymmetric matrices to produce one matrix for 1984 and one for 1988 where values in the matrices could range from 0 to 3. We then symmetrized and normalized the matrices to create 155 × 155 matrices for 1984 and 1988. To normalize the matrix, we divided cells by the row totals. This resulted in a 155 × 155 matrix where the value in each cell represented the extent to which organization j was influential over organization i.
Actual Activities
In 1980, 1984, 1988, and 1992, managers of the organizations were asked to identify the types of services provided. The list of services/activities to choose from included health/welfare, educational, legal, recreational, scientific, housing and urban development (HUD), and other. This question was asked before they were asked for their mission statements, and thus provides a basis to determine how closely their mission statements actually matched the reality of what the organization did. The percentage of organizations that engaged in each activity for the four data collection periods is presented at the bottom part of Figure 1.
Resource Inputs
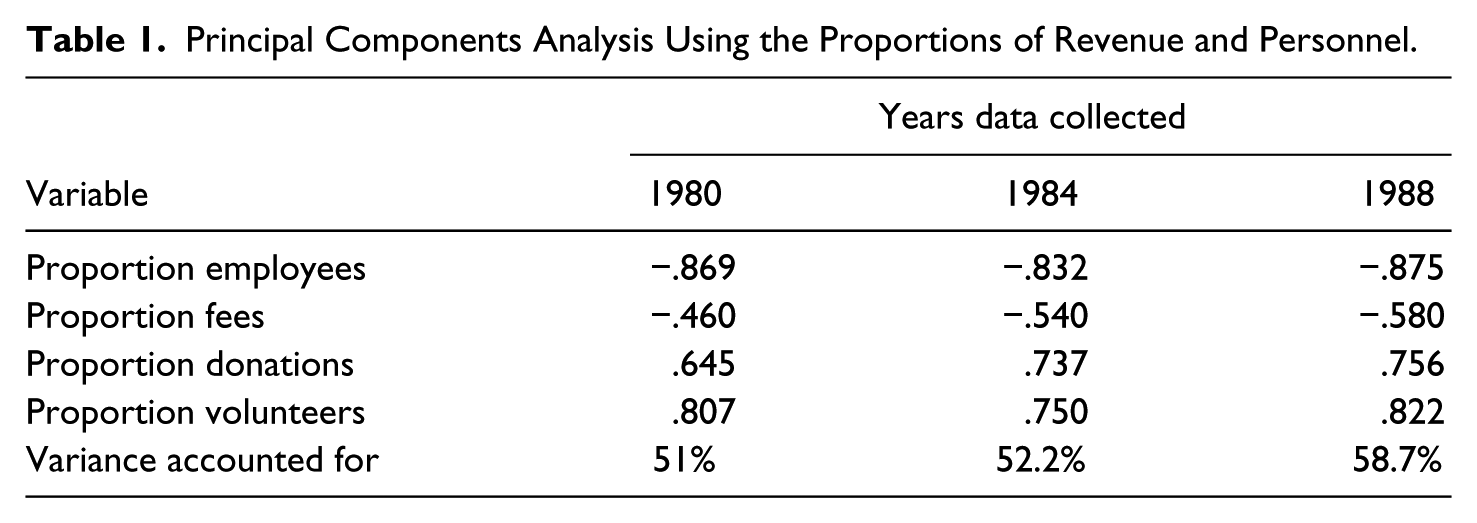
One source of revenue is government funding that comes in the form of competitive grants and contracts from federal, state, county, and local government. We compute proportion of government funding as the percent of total revenue. Second, we created a donative/commercial index. Commercial-type revenues included program service revenues and net earnings from the sale of unrelated services. We coded Medicaid and Medicare payments as commercial-type revenue. Donative revenues included individual donations, dues, corporate gifts and grants, foundation grants, trusts and bequests, net income from special fund-raising events, and grants from federated fund drives (e.g., United Way). We converted data on these revenue streams into 1994 dollars. In addition, our measures of nonprofits’ inputs also included the number of employees and volunteers. We also summed the numbers of full- and part-time employees and volunteers and computed the proportions of personnel who were volunteers and paid in 1980, 1984, 1988, 1992, and 1994. We did principal components analysis using the proportions of revenue from fees and donations and the proportions of personnel who were volunteers and employees. We extracted one factor each for 1980, 1984, and 1988. The loadings for each of the 3 years along with the percent of variance accounted for by the one factor are presented in Table 1. These scores were computed for the 155 organizations that survived through 1992 (for more details, see Galaskiewicz, Bielefeld, & Dowell, 2006).
Principal Components Analysis Using the Proportions of Revenue and Personnel.
Control Variables
We identified four control variables that could potentially influence organizations changing their mission statements. First, we used a dummy variable to control for variation between our 1988 and 1992 data. Organizations are often influenced by large macro environment shifts such as changes in the economy and public policy as well as natural disasters. For example, in the aftermath of Katrina’s destruction nonprofits in New Orleans changed their activities to meet the new needs of their clientele (Lacho, Bradley, & Cusack, 2006). Although the Minneapolis/St. Paul metropolitan area did experience a significant natural disaster during the period of this study, it was still situated in the broader context of national economic cycles and policy changes that occurred during the Reagan years. Thus, we control for the broader environment effects by using a dummy variable for 1988.
The second control variable is the age of the organization. Younger organizations that have yet to establish a strong donor base may be more likely to change their mission in search of a cause that will be backed by donors. This search may also include a search for new clientele and thus result in organizations modifying their targeted beneficiary group.
The third control variable is the organizational size that is measured by the amount of annual expenditures. Mosley, Maronick, and Katz (2012) found that larger organizations were more likely to add and delete programs. Larger organizations have more resources to expand their activities and beneficiaries, whereas smaller organizations may stay more focused on a particular niche. During the interviews, respondents almost always referred to their audited financial statements from the previous year to answer this question. We used the average expenditures over the previous years in the period between interviews. For example, the 1988 data contain mean expenditures from 1984 to 1987.
The fourth control variable is the previous period’s mission activities or beneficiaries. Organizations are best at repetitive processes and can have difficulty innovating. Nonprofits often go outside of the organization to bring in new people with experience to implement a new activity (Eng et al., 2012). Even the new employees hired to innovate, typically implement the new activity in a manner similar to their former organization (Liu & Ko 2012). In addition to these external isomorphic pressures, there are also internal power structures affecting the ability of nonprofits to innovate a new service which would limit changes in missions (Dover & Lawrence, 2012). Consequently, the best predictor of services provided and beneficiaries of those services is the organization’s services and beneficiaries from the prior period.
Results
Hypotheses
The descriptive statistics and correlations for the variables are presented in Tables 2 and 3. The services provided (i.e. activities conducted) as stated in the mission statement and the services actually provided are presented in Table 2. The 13 demographics of the clients served, as coded from each organization’s mission statement, are presented in Table 3. There is a separate observation for 1984 and 1988 for each organization. As there are 155 organizations, there are a total of 310 observations. Thus, a mean of .06 for the legal mission variable in Table 2 indicates that 6% of the 310 mission statements coded across 2 years specified that legal services were provided. Table 2 shows a strong correlation between mission content and activities in a given year. Those that said their mission was to provide recreation, culture, housing, and health and welfare also said that they actually engaged in these activities.
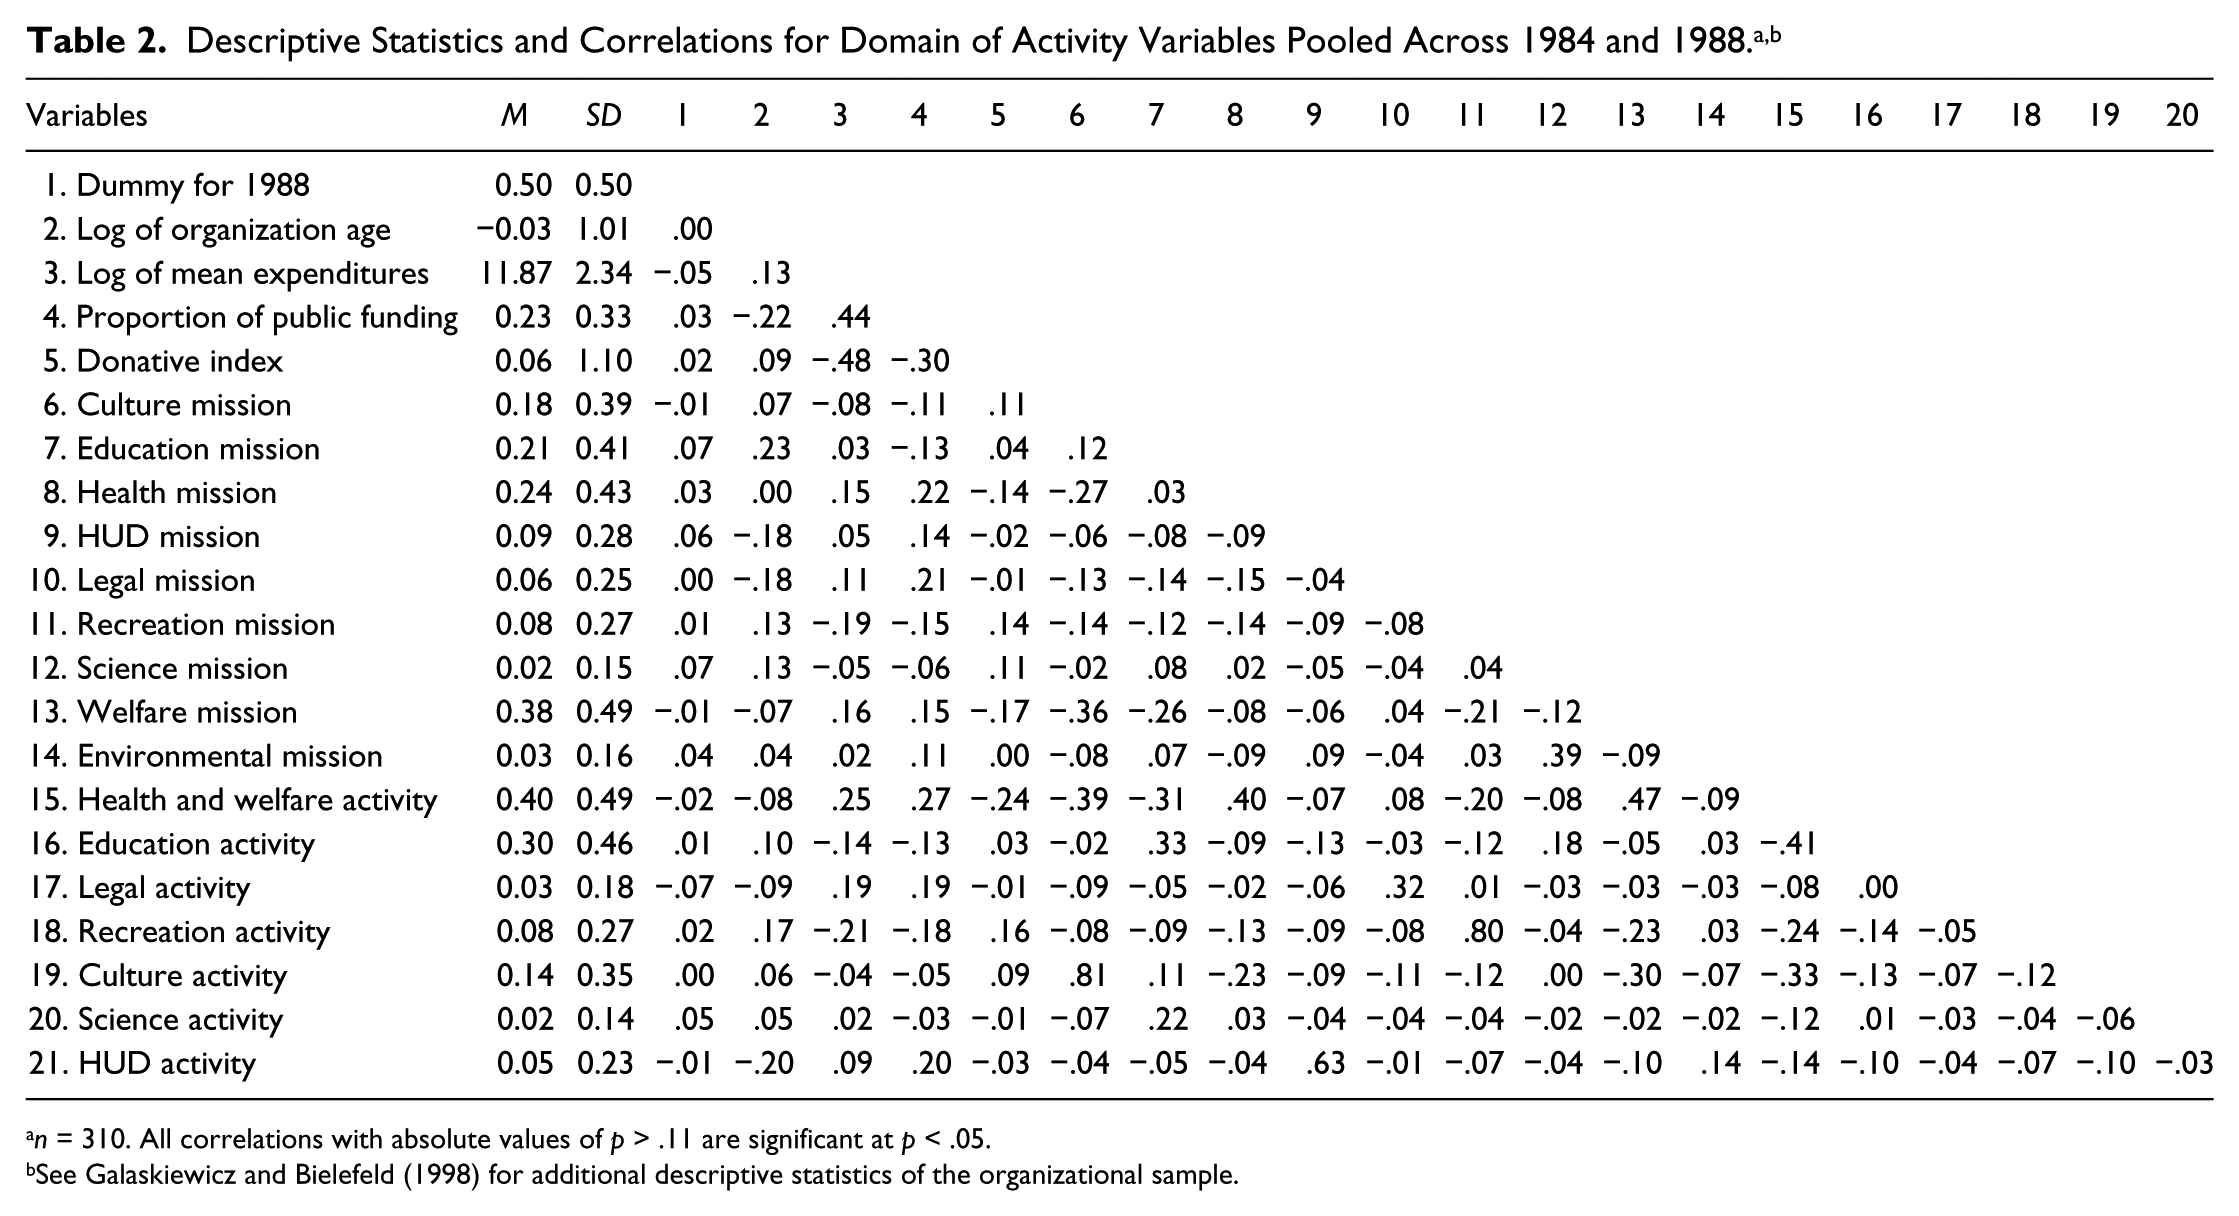
n = 310. All correlations with absolute values of p > .11 are significant at p < .05.
See Galaskiewicz and Bielefeld (1998) for additional descriptive statistics of the organizational sample.
Descriptive Statistics and Correlations for Demographic Variables for 1984 and 1988. a
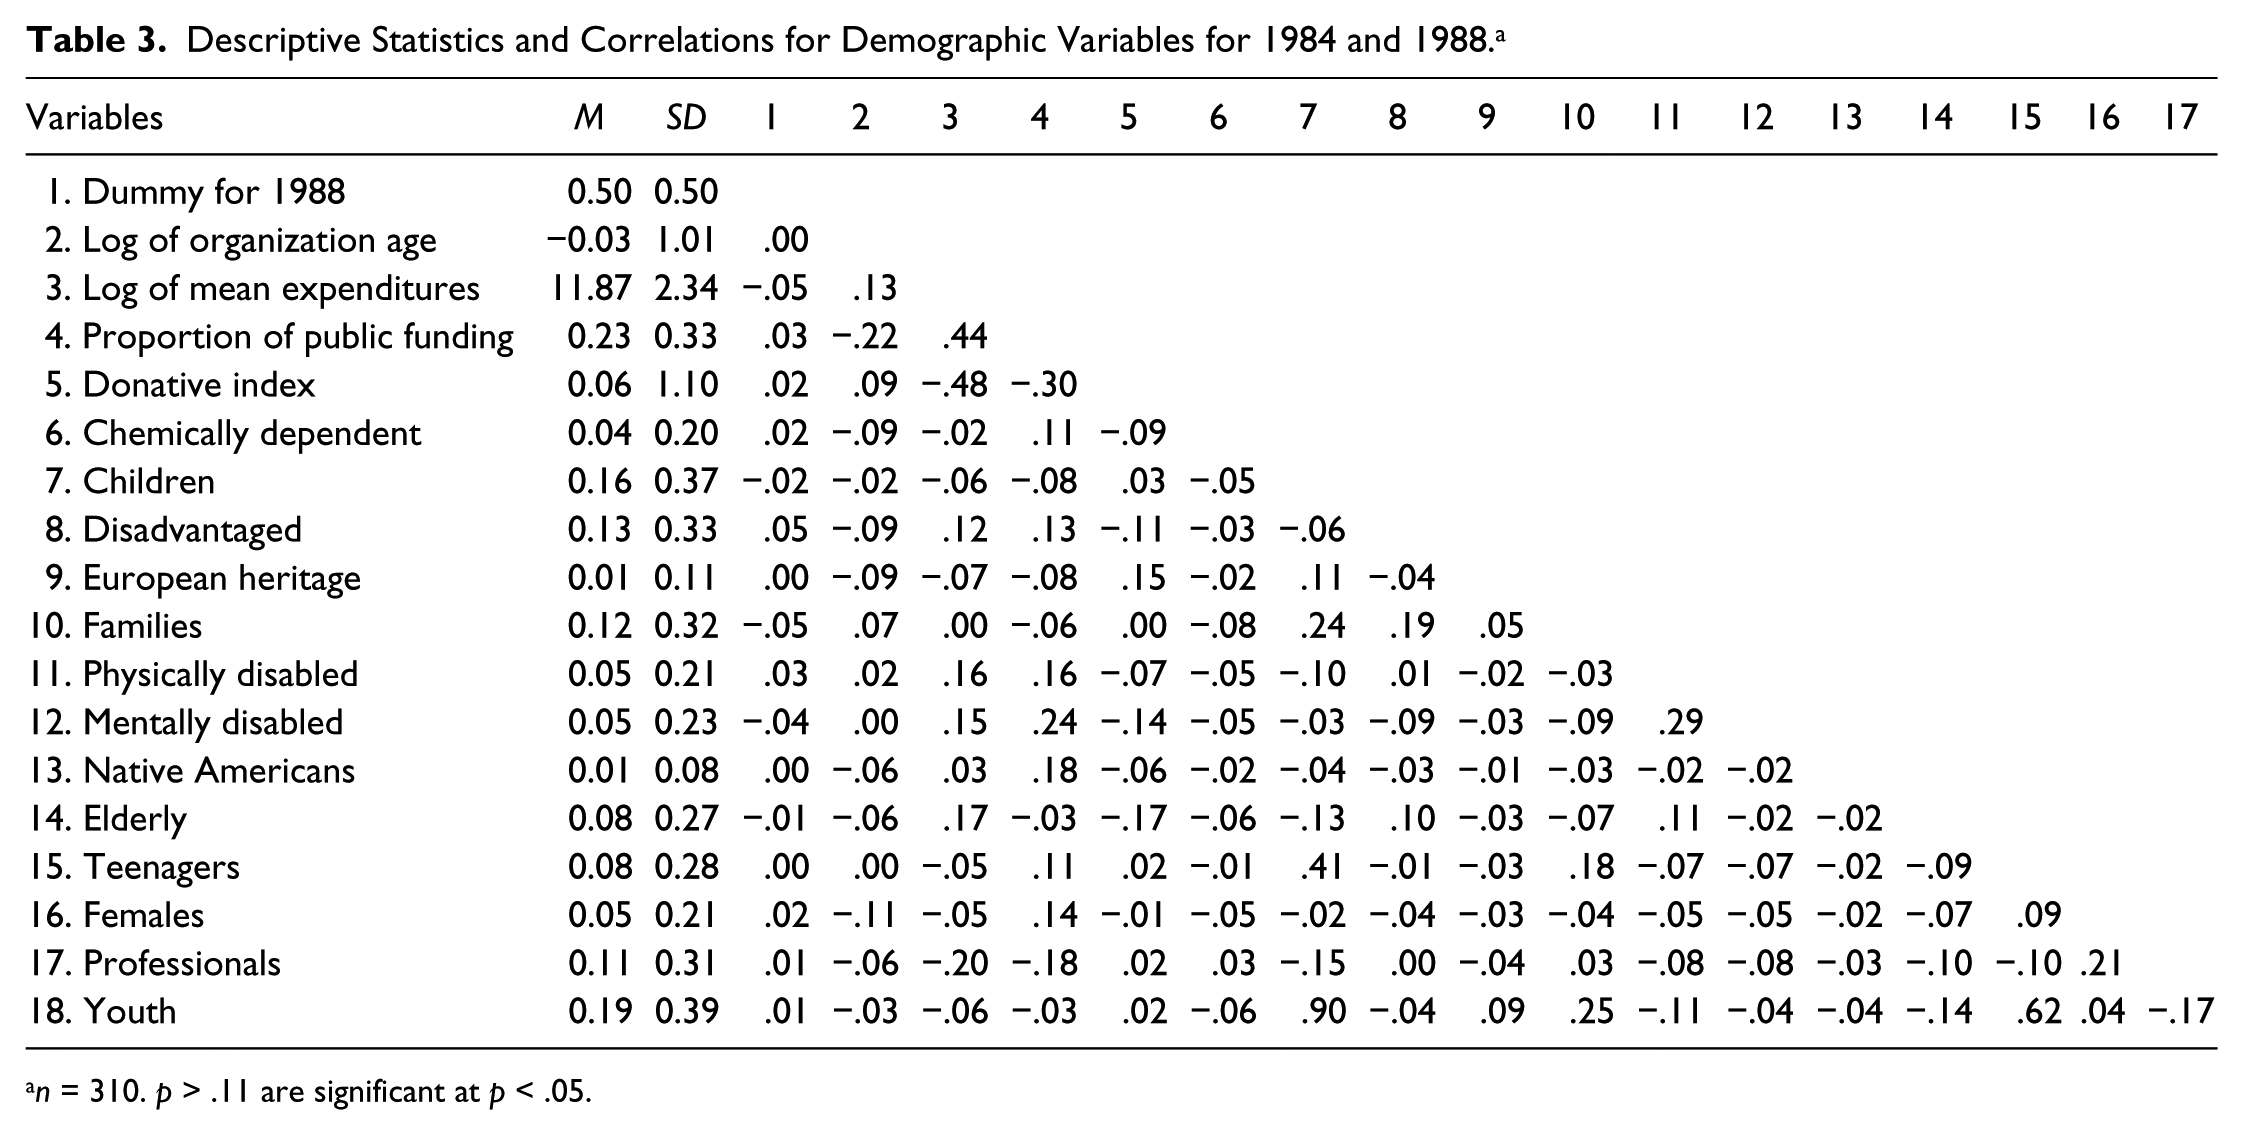
n = 310. p > .11 are significant at p < .05.
Table 4 presents the results of a more rigorous testing hypothesis H1, which states that activities specified in the mission statement will match the activities that the organization is engaged in. Because the mission statements were coded in more detail than the actual activities, the mission activity data for the health and welfare activities were consolidated into a single variable and the mission activity data for the environment and animal category were excluded, resulting in seven activity categories. The dependent variable in the logit models is the actual activity which is coded as 1 if the organizational respondent said it was a priority and 0 otherwise. The independent variable is whether the activity was mentioned in the mission statement. The model was estimated for each of the activities and included 4 years of data (1980, 1984, 1988, and 1992) for each of the 155 organizations. The results reveal that activities mentioned in the mission statements are a significant predictor of actual activities conducted. Therefore, mission statements are relevant in defining the activities conducted by the organization, and H1 is supported.
Logit Models of Activities in Stated Mission Predicting Actual Activities of Organization. a
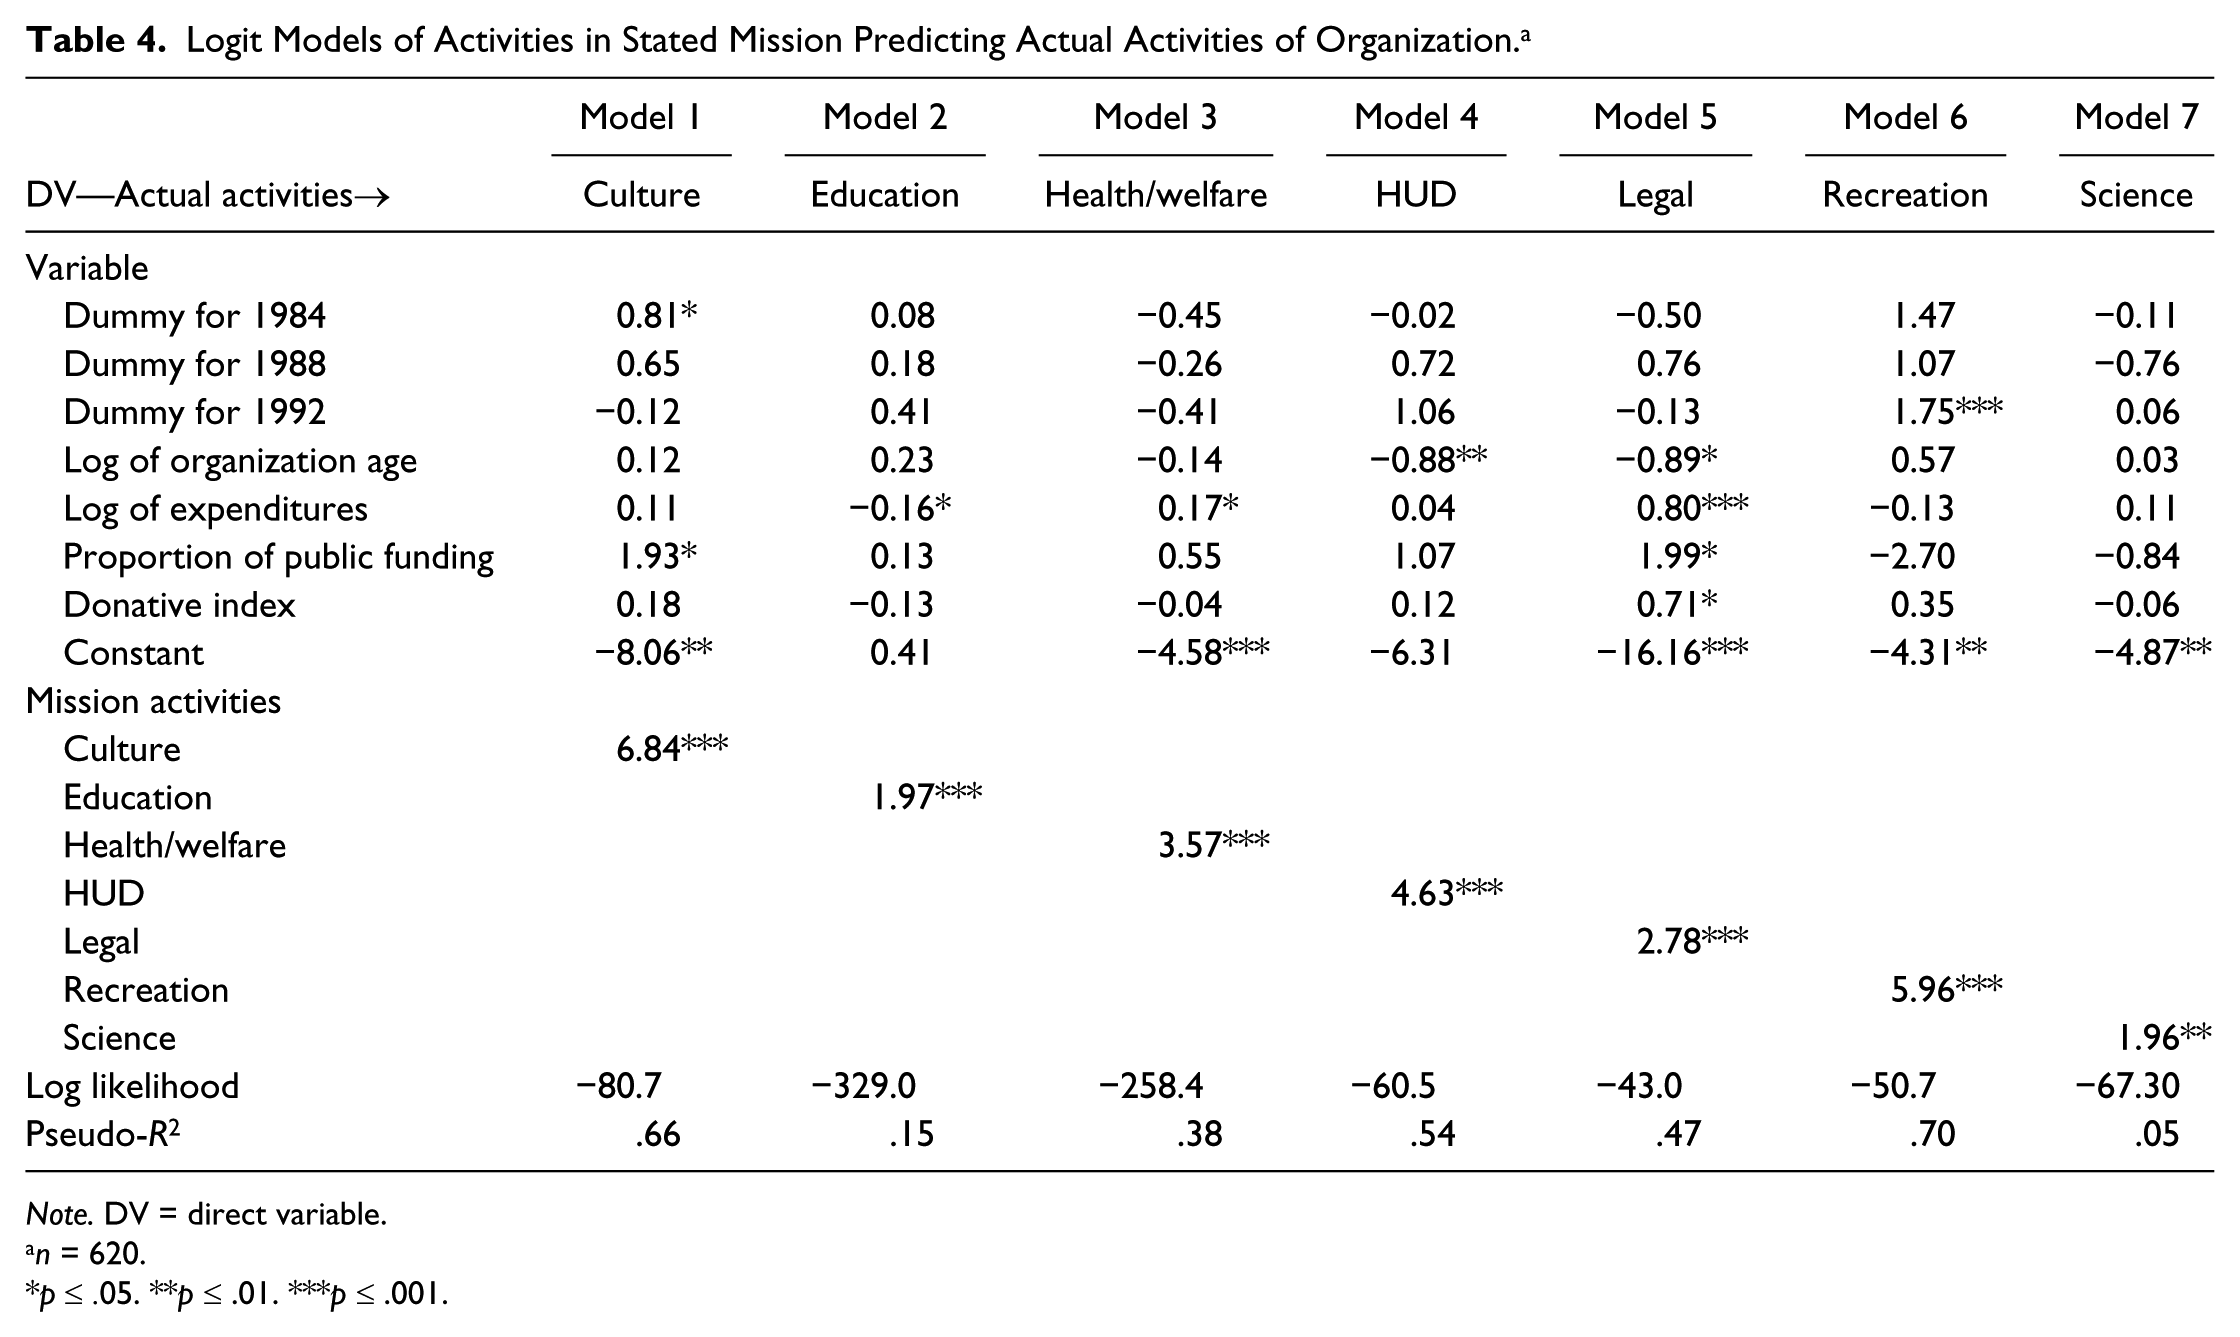
Note. DV = direct variable.
n = 620.
p ≤ .05. **p ≤ .01. ***p ≤ .001.
For the remaining hypotheses, the following basic logit model was used to calculate the independent variables’ impact on changes to mission statements:

where i = 1 to 155 organizations, k = 1 to 9 (activities) or k = 1 to 13 (demographic groups), and t = 1984 or 1988, t + 4 = 1988 or 1992. P(Yit+4 = 1) is the expected probability that organization i has a particular activity or demographic group k in their mission statements at t + 4, Yikt is the outcome variable lagged 4 years, Wijt is the IO network data, and X is the vector of independent and control variables measured at t. We used the cluster command within Stata, given that the observations are independent across organizations, but not necessarily within the organization across years.
Wijt is the network data (or weights) matrix where managers expressed the ties to other organizations and is a 155 × 155 normalized matrix with zeros in the diagonal. We have network data for 1984 and 1988. These network data are multiplied by an N × 1 vector containing information on the particular mission category (activity or demographic) of the organizations in the network. The product term, WijtYikt, is the proportion of an organization’s network partners weighted by tie strength that listed a particular activity or demographic group in their mission statement at time t. The models are similar to those described in Marsden and Friedkin (1993) and are referred in the literature as social influence models.
Yikt measures the impact of providing a specific service or serving a particular demographic group in the previous period on the next period. Consequently, the coefficients attached to each effect parameter indicate the extent to which a variable affected the likelihood of an organization having an activity or demographic group in its mission statement at t + 4, net of it having that activity or demographic in its mission statement at t. Thus, when the dependent variable is for 1988, the independent and control variables are from 1984 data, and when the dependent variable is from 1992 data, the independent and control variables are from 1988.
Logit models were estimated to test hypotheses, which examined the effects of donative transactions (H2a), public funding (H2b), and social networks (H3) in predicting organizations’ missions. In all models, we pooled the data across the two observation periods (1984 to 1988 and 1988 to 1992). In Table 5, we combine the demographic categories. As the sample had 155 organizations in both 1988 and 1992, and these organizations were serving clients in a total of 13 demographic categories, there was a total of 4,030 (155 × 2 × 13) observations. Similarly, in Table 6, we combined the nine activities. Thus, the logit models calculated had 2,790 (155 × 2 × 9) observations. In addition, we calculated separate logit models for each activity or demographic target category in Tables 7, 8, and 9, where the models had 310 (155 × 2) observations. Again, we used the cluster command within Stata and estimated robust standard errors.
Logit Models Predicting Beneficiaries Stated in Mission. a
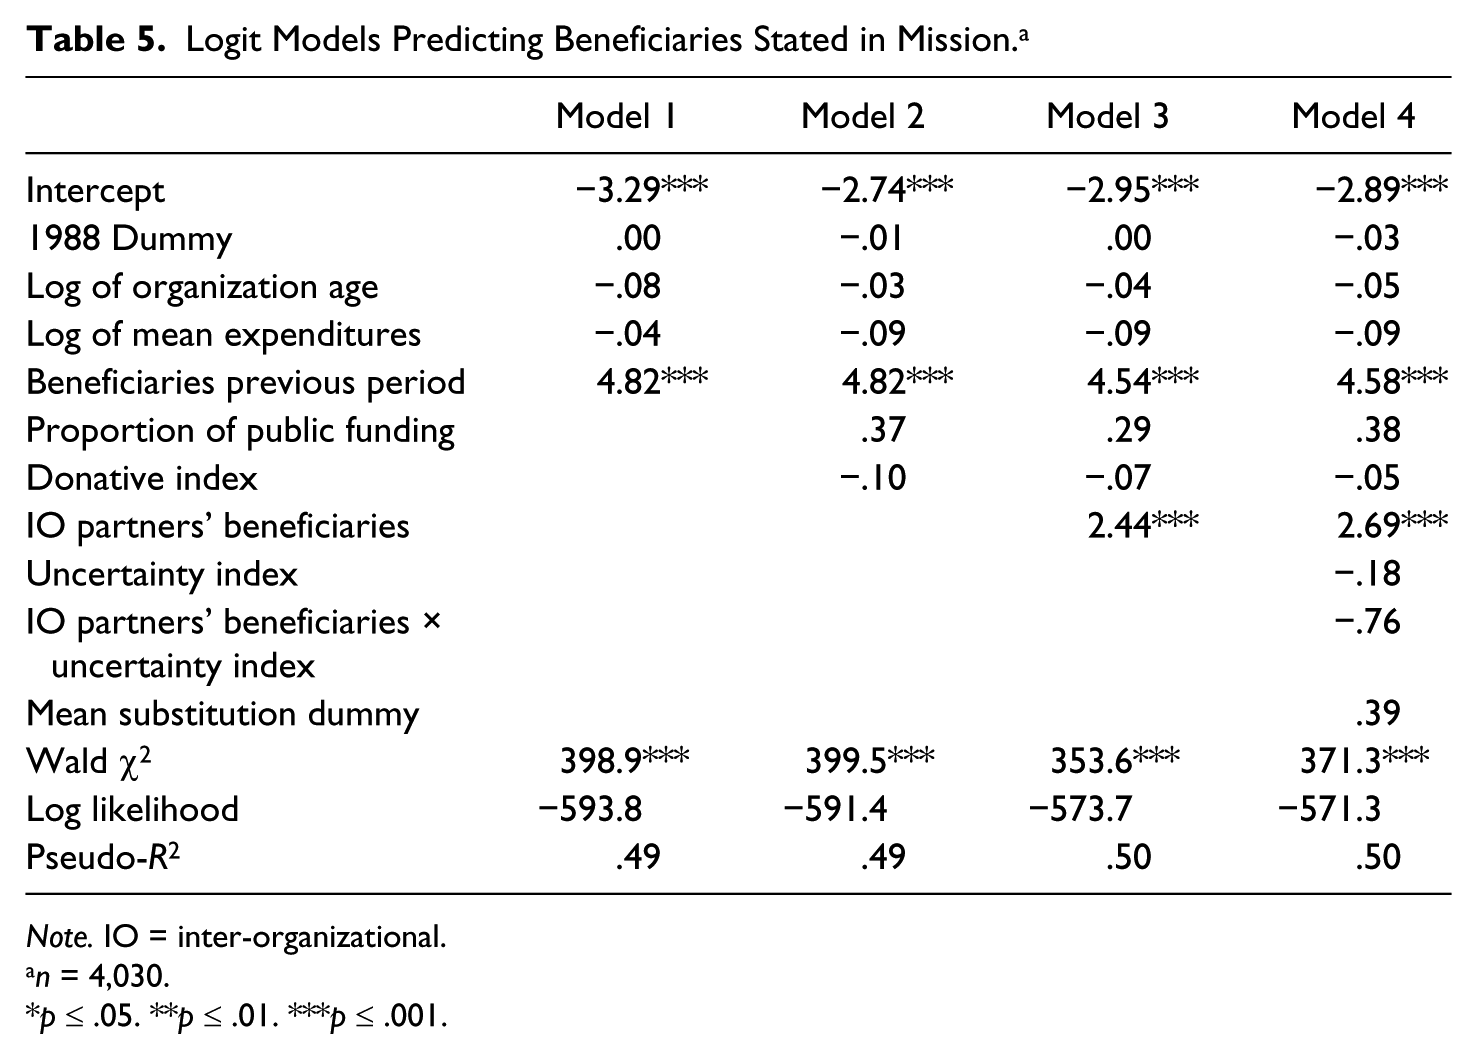
Note. IO = inter-organizational.
n = 4,030.
p ≤ .05. **p ≤ .01. ***p ≤ .001.
Results of Logit Models Predicting Activities Stated in Mission. a
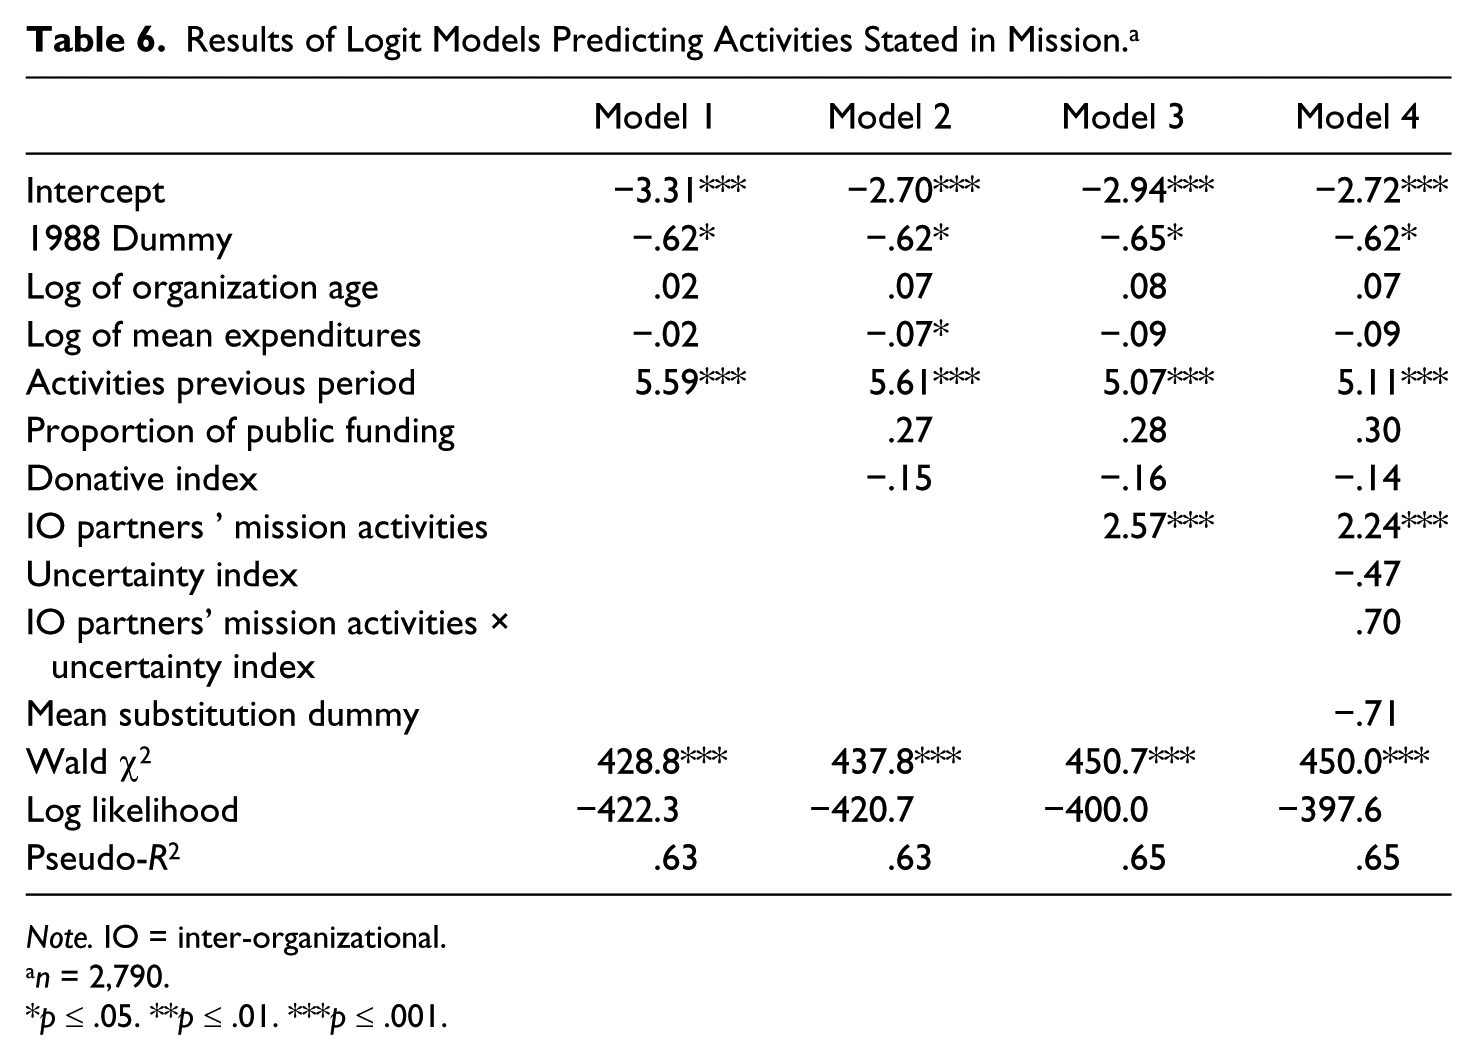
Note. IO = inter-organizational.
n = 2,790.
p ≤ .05. **p ≤ .01. ***p ≤ .001.
Logit Models Predicting Individual Beneficiary Categories in Stated Mission. a
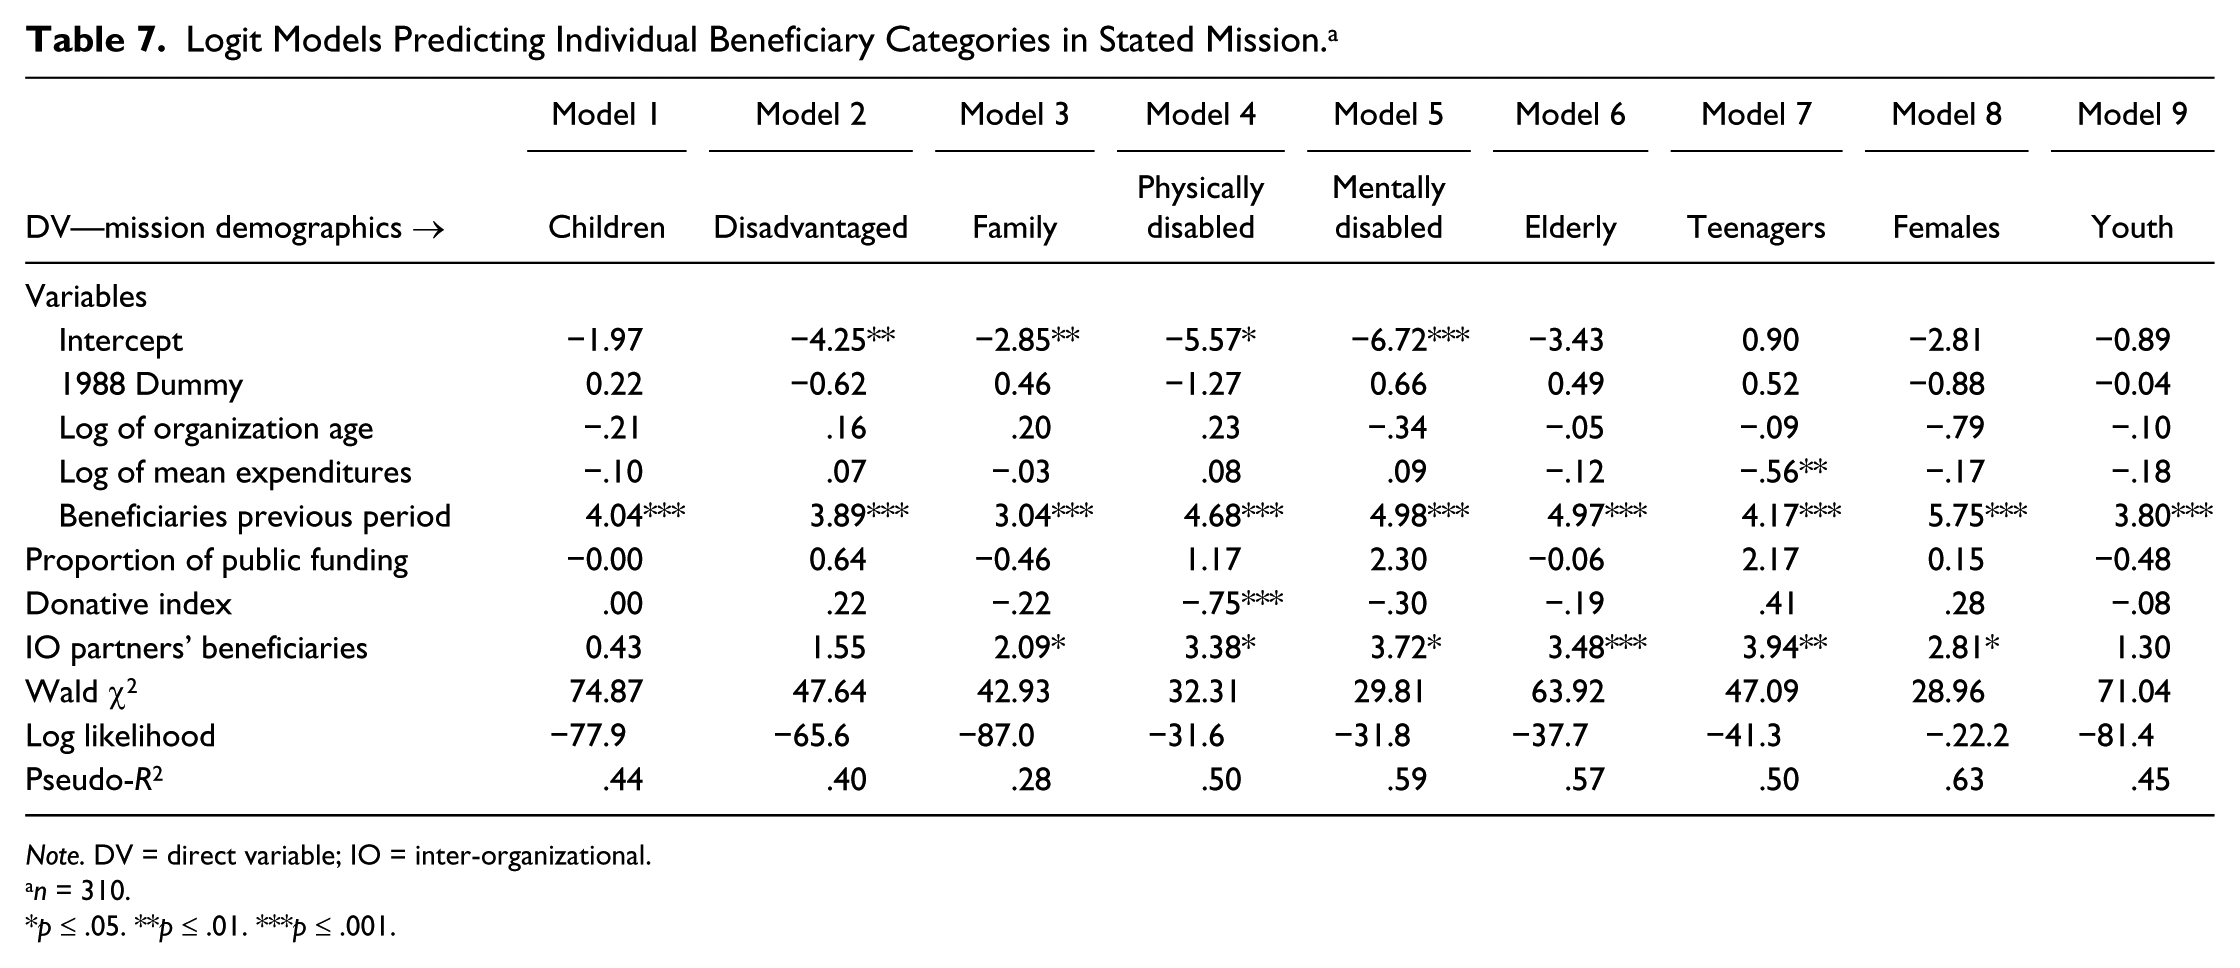
Note. DV = direct variable; IO = inter-organizational.
n = 310.
p ≤ .05. **p ≤ .01. ***p ≤ .001.
Logit Models Predicting Individual Activity Categories in Stated Mission. a
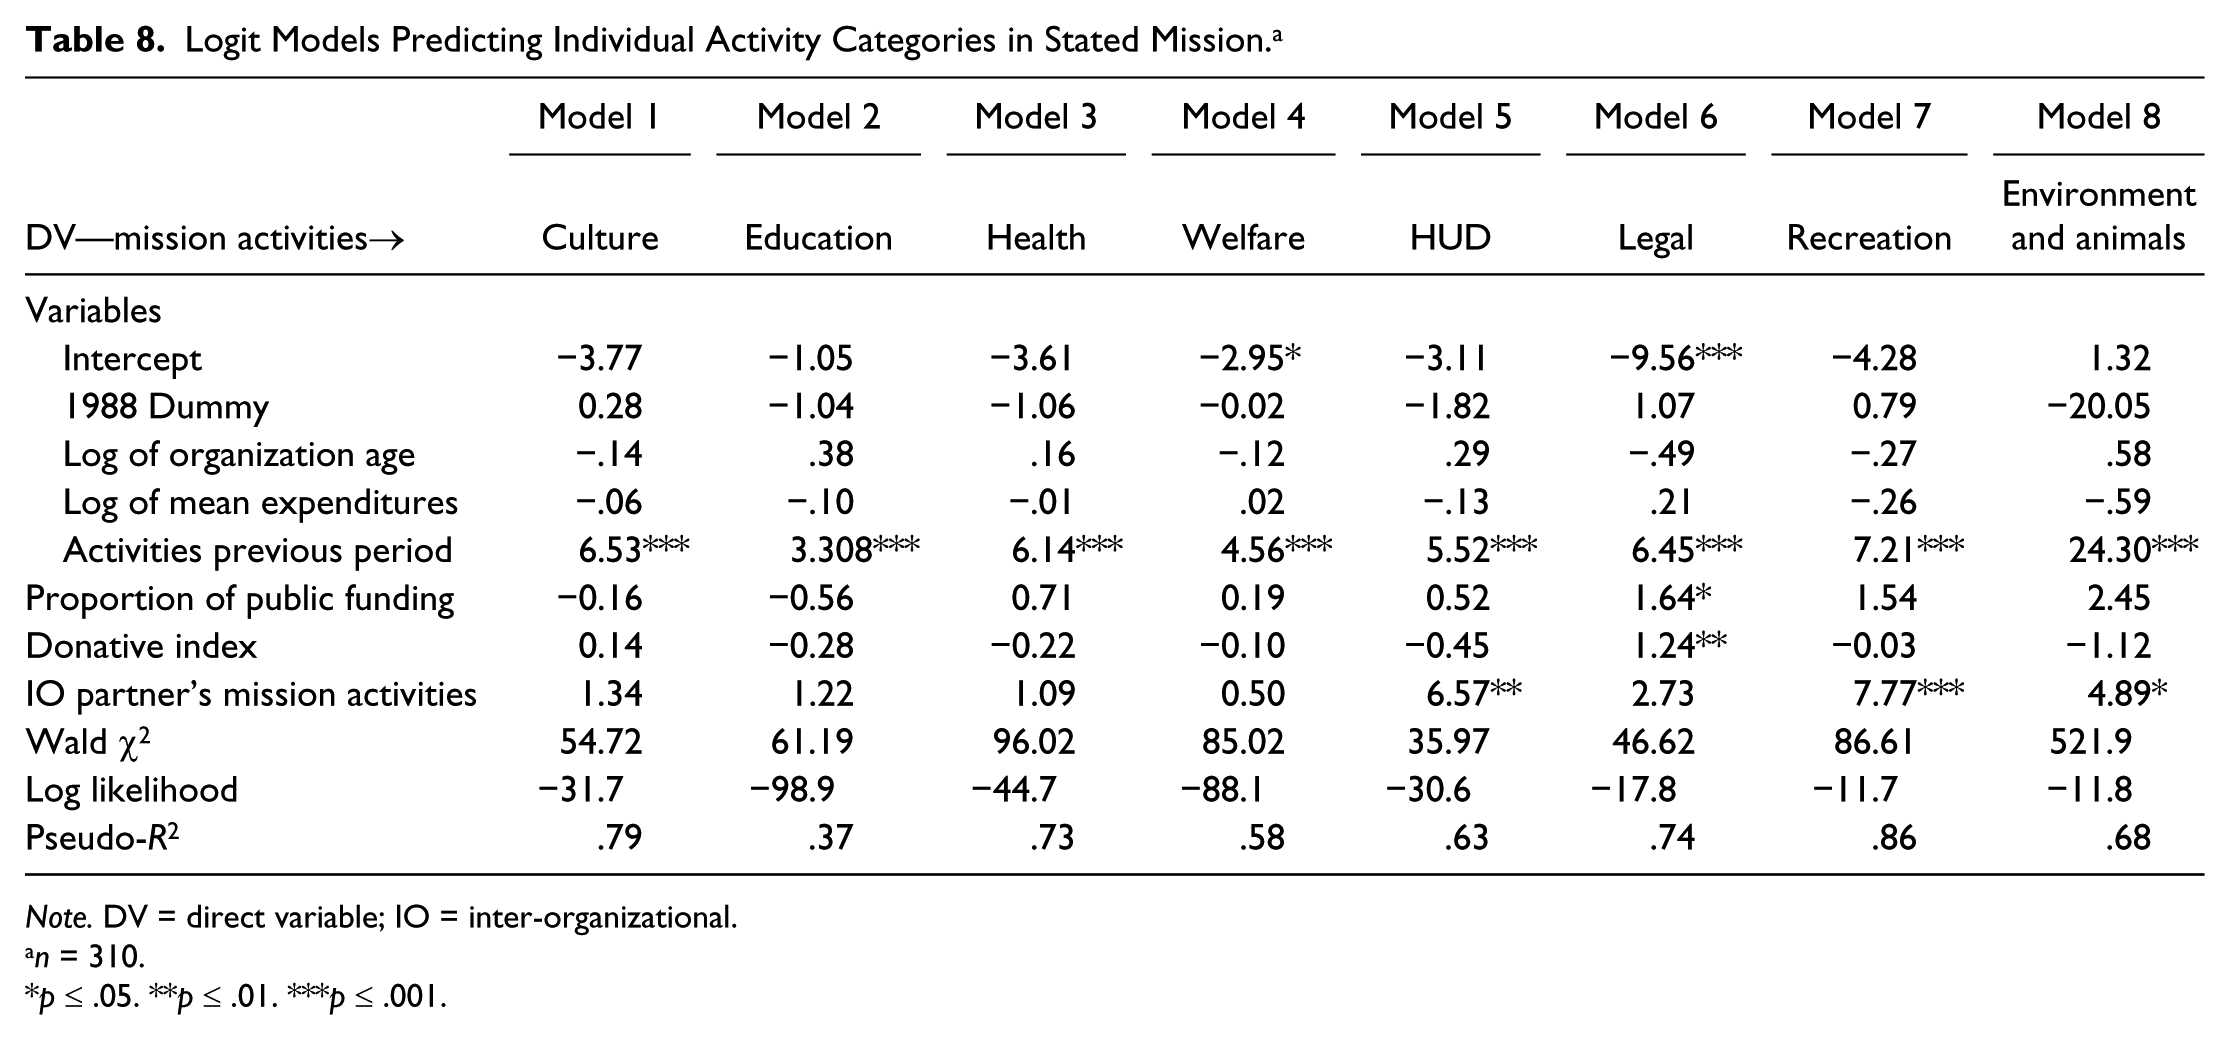
Note. DV = direct variable; IO = inter-organizational.
n = 310.
p ≤ .05. **p ≤ .01. ***p ≤ .001.
Logit Models Predicting Individual Activity Categories Using IO Partners’ Actual Activities. a
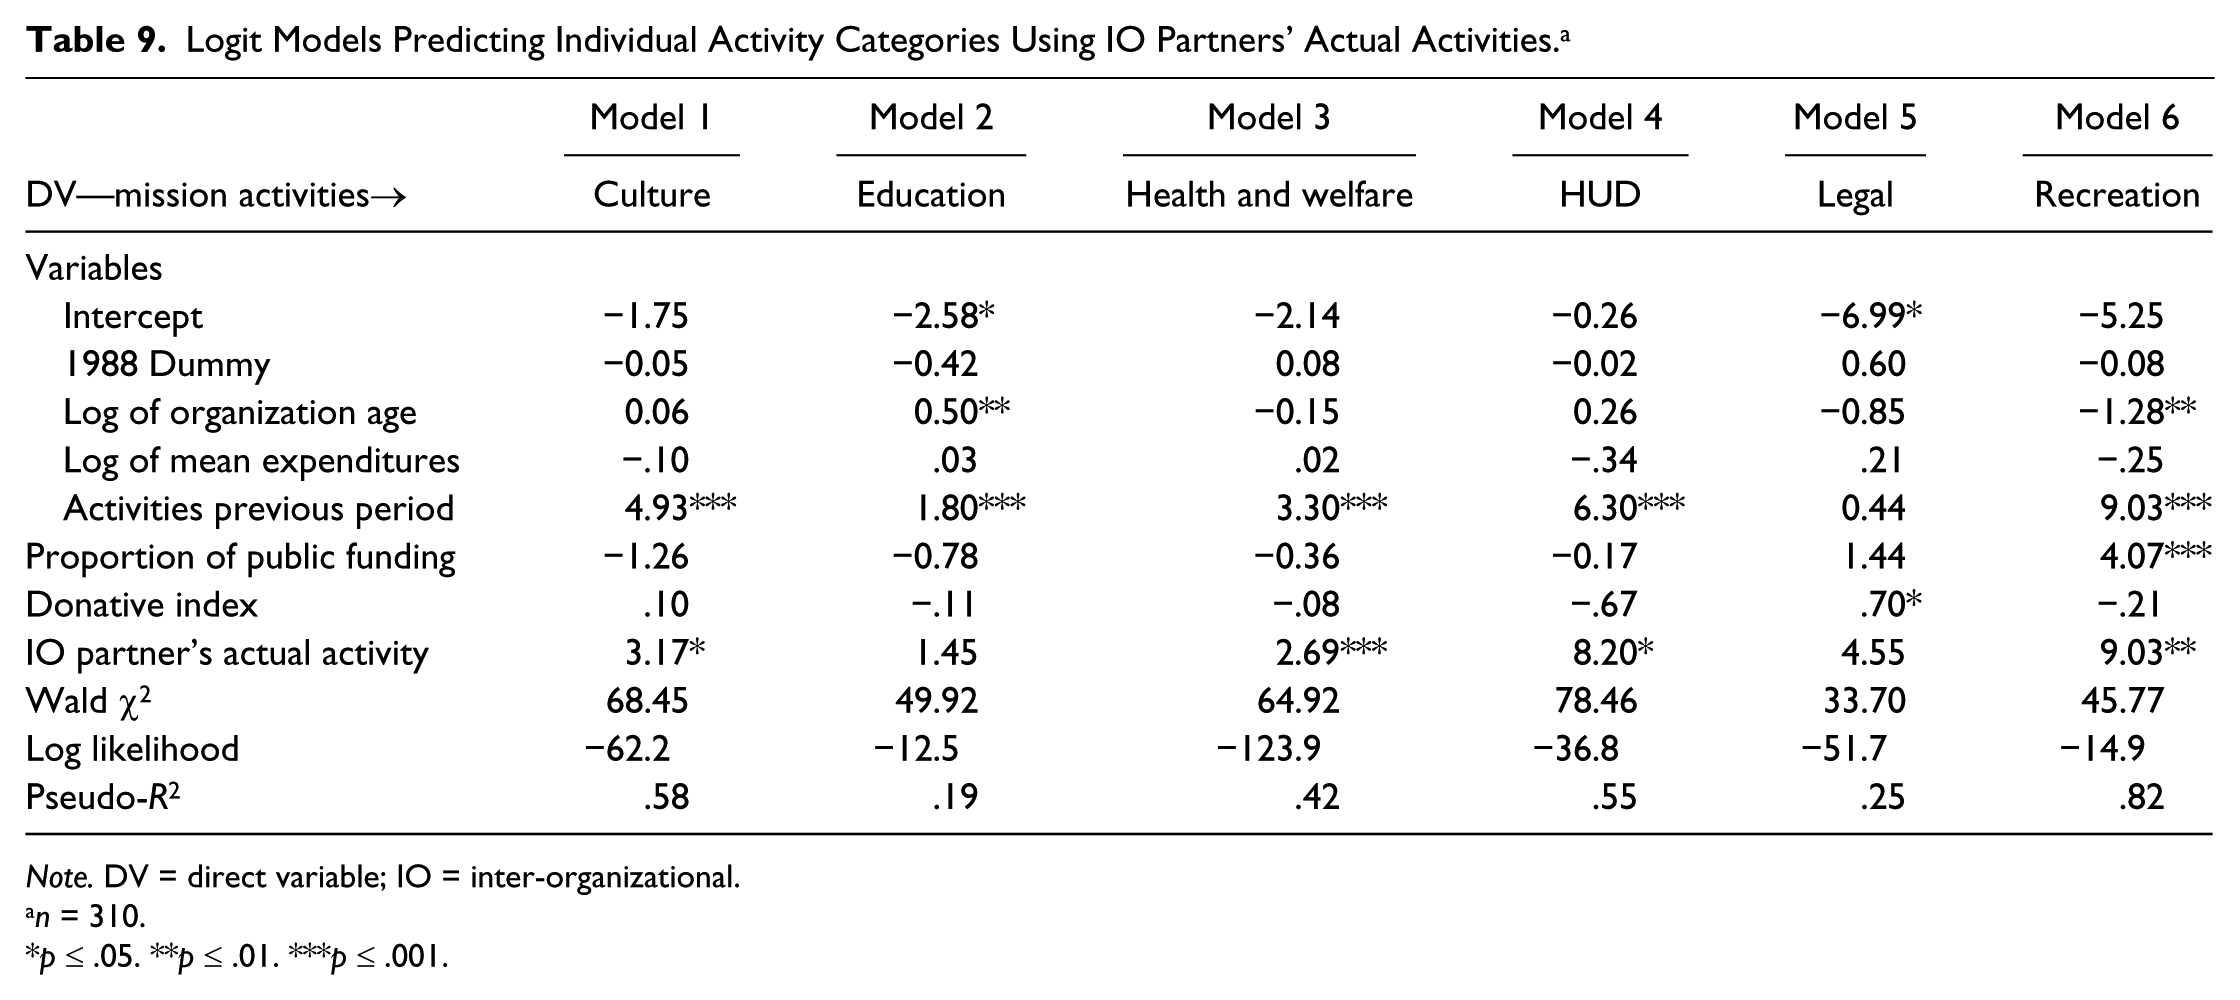
Note. DV = direct variable; IO = inter-organizational.
n = 310.
p ≤ .05. **p ≤ .01. ***p ≤ .001.
The results using pooled data to test H2a and H2b are shown in Table 5 for changes in mission beneficiaries, and in Table 6 for changes in mission activities. Model 1 provides a base model in both tables and Model 2 provides the results when the donative and public funding variables are included. The results reveal that neither of these funding variables was significant in predicting changes to the mission statements.
For H3, the results for Model 3 using combined observations in Tables 5 and 6 reveal that IO partners’ mission statements were significant in predicting future changes to both the mission’s activities and the beneficiaries served. The addition of the network effects for beneficiaries in Model 3 of Table 5 resulted in a significant improvement in the χ2 measure. Similarly, the inclusion of the network effects for activities resulted in a significant χ2 improvement in Model 3 of Table 6.
Robustness Tests
Does uncertainty matter?
As financial uncertainty has been found to result in nonprofits adding and dropping programs (Mosley et al., 2012), we also examined whether the network effects were contingent on the respondents’ perceptions of uncertainty in Model 4 of Tables 5 and 6. The uncertainty variable was calculated using an organization’s information level and certainty of receiving next year’s funds from each of its funding sources (see Galaskiewicz & Bielefeld, 1998 for a detailed description). None of the multiplicative interactions were statistically significant. Thus, there was no evidence that uncertainty was necessary for IO networks to influence changes in mission activities or beneficiary groups.
Is there variation across types of activities and beneficiaries?
We also used logit models to test the influence of funding streams and inter-organizational relations (IOR) on each of the 9 activity and the 13 demographic categories. To estimate these logit models, we use the 310 observations from the two periods of organizational data. The results of these models are shown in Tables 7 and 8. Table 7 reveals the results for mission beneficiaries, whereas Table 8 shows the results for mission activities.
In Table 7, estimations of the 13 individual demographic models were attempted, but only 9 of the models were sufficiently defined. Two of the models are undefined due to the lack of variation in the few organizations serving these beneficiary groups as there are only two serving the European heritage group and one serving the Native American group. For organizations serving professionals and chemical dependency, however, it is more due to the stability in beneficiaries served. All 6 organizations with chemical dependency beneficiaries and all 16 of the organizations with professional beneficiaries continually served their respective clients across the three periods. Consequently, the models could not be estimated to predict changes in these two demographic groups.
An examination of Tables 7 and 8, which breaks out the observations for each demographic and activity category, respectively, again reveals that there is minimal support for the natural system hypotheses. Neither the proportion of public funding nor the donative index has much of an effect on either the beneficiaries or the activities given priority in mission statements 4 years later. The only exceptions are in Model 4 of Table 7 where a greater dependency on donations and volunteers decreases the likelihood of including physically disabled clients in the mission statement, and Model 6 of Table 8 where both the proportion of public funding and being more dependent on donations and volunteers increase the likelihood of prioritizing legal services in later mission statements. Thus, the proportion of public funding and the donative index had no significant effect in 15 of the 17 models.
For the nine demographic models that could be estimated, Table 7 provides additional support for H3, which states that mission beneficiaries of IOR are significant in predicting changes to the demographic group served as specified in the mission statement. The results in Table 7 show that the mission beneficiaries of one’s IO partners are significant in predicting changes to the demographic beneficiary group mentioned in later mission statements in six of the nine logit models. The only three demographic groups for which network peers’ beneficiary groups were not significant are the children, disadvantaged, and youth. In Table 8, we find that IO partners’ mission activities predicted changes to the mission activities of an organization in three of the eight activities: housing, recreation, and environment and animals.
In Table 9, the independent variable is the actual activities of network partners instead of mission statements activities, and the dependent variable is the activity mentioned in the organization’s mission statement 4 years later. Thus, Table 9 examines how well the actual activities of an organization’s IOR predict the activities that will be in its future mission statement. Table 9 reveals that changes to health and welfare, housing, and recreational activities in the mission statement by t + 4 are significantly influenced by the activities of one’s network ties 4 years earlier. Thus, there is additional support for H3.
Discussion
With regard to our theoretical results, we have shown that mission statements are consistent with the rational systems and the open-natural systems approach. Mission statements in nonprofit organizations are accurate reflections of the actual services provided and thus appear to be directing decision-making and action within the organization. Also in looking at changes over time, categories used in previous mission statements were strongly predictive of current mission categories. This supports H1 and rationalist arguments that mission statements are enduring features of organizations. For the sector this is important, because it shows that missions are tightly coupled to future activities and there is continuity in mission statements over time. Our findings suggest that in all likelihood, the values of boards, directors, staff, and members kept these organizations on track. These findings also support K. K. Chen, Lune, and Queen’s (2013) claim that nonprofits are collectivities where values are enacted.
In analyzing changes in mission activities and beneficiaries, we did not find support for simple natural systems theory. Neither dependency upon donated income and labor, dependency upon government funding, nor, for that matter dependency upon commercial income and employees led to changes in mission activities or beneficiaries. We argued in the theory section that dependency on donative transfers or government funding would lead to mission drift as the organization would remake itself to fit the priorities of funders. This implied that reliance on commercial income would “liberate” the organization and allow it to pursue its own mission without the interference of outsiders. None of this proved to be true. Our test was quite rigorous, because we controlled for organizations’ mission priorities in previous years. We feel confident concluding that, in our sample at least, mission did not follow money.
We did find support for the argument that the missions and activities of nonprofits’ IO partners influenced changes to mission statements. For example, if one’s IO partners were committed to or engaged in certain activities or mentioned certain beneficiary groups in their mission statements, it was highly likely that an organization would include these activities and beneficiaries in their mission statements four years later. In our robustness test, we discovered that these changes were not driven by rationalistic responses to organizational uncertainty. Even though it is commonly asserted that diversification into new activities and/or demographic groups is a means to reduce risk and one often will imitate peers under these circumstances, our results did not support this explanation. We tested if environmental uncertainty prompted mimicry as neo-institutional theory suggested (DiMaggio and Powell, 1983), but interaction effects were not significant.
There are several possible reasons why social influence was so prevalent in this organizational field; however, our data do not allow us to give a definitive answer. As noted earlier, network contacts can provide information about new funding opportunities and new technologies; also working with other organizations sometimes results in organizations adapting to their partners’ ways. It also could be that there was a common comfort or desire to operate in similar niches to one’s IO partners, which was a natural consequence of being embedded in the same network. We often assume that homophily leads to the creation of network ties, but it may work the other way around where network ties result in greater homophily. This is a very strong claim and suggests that boards and administrators are responsive to the vision of their network ties and would indeed change their own vision to maintain the relationship.
Whatever the reason for the convergence, the consequences are that organizations end up competing with their friends. Organizations became more similar to their partners by either dropping out of niches that their IO partners were not participating in or by entering new niches occupied by their partners. This would appear to violate the commonly held idea that niches provide a way to escape competition, and instead suggests that IO ties, at least among nonprofits, result in a convergence of organizations together into the same market niche. Perhaps the logic is that it is more advantageous to be in a niche where you collaborate with your competitors than to be in a niche where you compete against fellow isolates.
Our study has several limitations that should be noted for future research. The longitudinal data used are not current enough to reflect the impact of social networking via social media. The technological environment has significantly changed the way information is now shared within networks. On the one hand, it could be that IO networks are not as dense or useful, given that more information is available on the web. On the other hand, social media may make it easier and more advantageous for organizations to “hook up” with each other. Web pages often have links to other sites, which would be an incentive for organizations to form a partnership with others particularly in the same service domain as it increases their visibility at minimal cost.
Another problem is that our results do not address what causes two organizations to form a tie in the first place and why some organizations’ networks expand or contract. Our results should not be interpreted as indicating that there are not strong and growing ties based on an organization’s original mission. As McPherson, Smith-Lovin, and Cook (2001) would argue, homophily is still a powerful predictor of IO relations, but forming ties because both provide similar services generically, for example, mental health, may mean that one has ties to someone which provides services to very different clientele. Thus, the same network tie that binds organizations because of their current missions may also be the tie that leads organizations to change their missions. Research needs to examine this reciprocal causality.
We were concerned that respondents may not accurately report their organization’s IORs. Respondents who are heads of large nonprofits often cannot remember or did not ever know about ties to smaller organizations. We aided recall by presenting a list of the other organizations in our panel to respondents, but we did gather corroborating evidence that ties between the organizations ever existed. Also we only measured whether or not there was tie of a given type and did not measure how strong the tie was. Thus, there are a number of measurement issues that need to be addressed in future research.
We only had two periods that we studied (1984 to 1988 and 1988 to 1992), and we were locked into 4-year intervals. Ideally, we would have had network data for 1980 giving us three time periods, but unfortunately we did not collect this information. Also it is unclear that 4 years is the correct time interval. For example, the effect of government funding and/or donative transfers on changes in the mission statement may have been more short term, for example, over a 1- or 2-year period. Because the panel study only visited organizations four times over a 15-year period, we could not measure year-by-year changes or decipher which time period produced the most change.
A final limitation is that perhaps the strong effects we found in Table 4 (where past mission activities predicted current mission activities) are a function of selection bias. As Hannan and Freeman (1984) might argue, organizations that survive stick to their missions. Hager, Galaskiewicz, and Larson (2004) found that older and larger organizations tended to survive longer, and this is one reason why we included these two variables in all our models. However, this does not address the problem directly, and more research needs to be done on the consequences of changing one’s mission statement on survival.
Footnotes
Acknowledgements
We would also like to acknowledge the graduate and undergraduate research assistants who helped collect these data, especially Wolfgang Bielefeld and Mark Hager.
Declaration of Conflicting Interests
The author(s) declared no potential conflicts of interest with respect to the research, authorship, and/or publication of this article.
Funding
The author(s) disclosed receipt of the following financial support for the research, authorship, and/or publication of this article: We would like to acknowledge the following for their financial support: the Sociology Section, Division of the Social and Economic Sciences, the National Science Foundation (SES 80-08570, SES 83-19364, SES 88-12702, and SES 93-20929), The Program on Nonprofit Organizations at Yale University, the Center for Urban and Regional Affairs at the University of Minnesota, the University of Minnesota Graduate School, the Northwest Area Foundation, the Nonprofit Sector Research Fund, and the Association of American Colleges.