
Abstract
Almost all of the scientific literature on charitable giving is implicitly based on a static paradigm which posits there are non-donors who never give and donors who habitually give year-in/year-out to a specific charitable purpose. This article presents evidence that charitable giving is not static, but dynamic: Few Americans never give, and among Americans that donate the majority are switchers—giving in some years but not others or switching from one charitable purpose to another. The implications are that a static perspective is misleading, and research questions should place more emphasis on the time dimension of charitable giving.
Keywords
Introduction
There is an extensive modern literature on charitable giving that began about six decades ago (Boulding, 1962; Bryan & Test, 1967; Dickinson, 1962; Morgan, 1961). The literature includes theoretical research about why people give (e.g., Andreoni, 1989; Becker, 1974), observational research (e.g., Bekkers & Wiepking, 2011b), and experimental research (e.g., Isaac & Davis, 2006; Oppenheimer & Olivola, 2011). A central focus of the observational and experimental literature is how to increase voluntary giving, for instance, in the American context to be greater than 2% of gross domestic product (GDP). In other words, how to “expand the pie” (List & Price, 2012).
Almost all of this literature is written from a static perspective that posits there are people who give and people who do not: “A common view of giving is that donors have a stable pattern of giving that may imply a commitment to a certain level of giving” (Auten & Rudney, 1990, p. 89). For instance, a common cross-sectional observational result—such as that (roughly) 60% of Americans gave and 40% did not—that is routinely obtained regardless of the year in which the cross-section is taken is often implicitly interpreted as there being a 60/40 split between people habitually engaged with donating and people never engaged. Well-familiar research questions flow from a static interpretation: How can people who do not donate be encouraged to give? How can people already donating be encouraged to give more? Accordingly, most observational research tries to provide insight into these questions by describing associations between socioeconomic characteristics and, respectively, the probability of giving and amounts given. Most experiments try to answer these questions by investigating nudges intended to encourage people, not otherwise inclined to donate, to give, and to encourage people already inclined to donate to give even more.
The problem with a static perspective is that it focuses our attention entirely on these two research questions. However, new types of research questions rise in importance if rather than static, giving is dynamic. For example, if over longer periods of time nearly everyone donates, but a majority give from time to time, giving in some years but not in others, an important question would then be: What kind of nudge could encourage a “time-to-time” donor to become a year-in/year-out donor? Furthermore, if time-to-time giving is prevalent, then such questions about giving over time may present the best opportunity to advance knowledge about how to expand the charitable giving pie. Yet, questions about giving patterns over time are going largely under-investigated.
This article presents descriptive evidence that giving behavior is strongly dynamic. We use Panel Study of Income Dynamics (PSID) biennial data that describe the giving behavior of 6,245 Americans in the eight even number years 2000–2014. There are several results. First, in contrast to cross-sectional studies that have routinely shown that (again roughly) 60% of Americans give and 40% do not, we find that nearly everyone is engaged with donating. Second, the majority of donors are “switchers”: They do not give year-in/year-out to a specific charitable purpose. A static view that the cross-sectional 60% has a stable pattern of giving is not accurate: About half of the 60% are switchers. Similarly, a static view that the 40% are not engaged with donating is a significant overestimate: Nearly two thirds of this 40% “non-donors” do give to charitable organizations at least once over the eight calendar years (but did not do so in the cross-sectional year whose data were being analyzed).
Third, by ignoring the time dimension of giving, static interpretations of cross-sectional regression estimates usually overestimate the associations between socioeconomic characteristics and amounts given. Fourth, we present results about the dynamics of giving to specific charitable purposes, such as to organizations that help people with basic needs, organizations that serve a combination of purposes (like the United Way), health, and education. The dynamics of giving to specific purposes are stronger than just described: There is more switching. Fifth, there is less switching off/on in giving to religious congregations, but the dynamics of giving to congregations are stronger than one might have expected.
The results are significant because they are the first comprehensive measurement of giving dynamics in the United States. They suggest the need to shift perspectives about charitable giving from static to dynamic, and investigate what have been until now lightly researched questions: questions focused on time.
Background and Theory
In this section, we present evidence that most of the charitable giving literature is being written from a static perspective. Then we discuss theoretical reasons to think that giving would be dynamic.
A Static Perspective
Thirty years ago, Auten and Rudney (1990) raised caution about using a static perspective to understand charitable giving. Auten and Rudney investigated Internal Revenue Service deductions data over 5 years (1971–1975) and found a high degree of year-to-year variability in amounts given. They concluded that because stable habitual giving did not appear to be the norm, cross-sectional analyses could be providing a misleading description of giving, including its association with income. They recommended that “[f]uture research should make more use of panel data to examine the dynamics of giving and long-run giving patterns. (p. 92)” Their paper is one of the few to explicitly label cross-sectional annual statistics as providing “a static view.”
Since then, the majority of empirical research about giving has remained cross-sectional. Bekkers and Wiepking (2011b) and Wiepking and Bekkers (2012) comprehensively reviewed the empirical literature about giving, and all the papers they were able to find were cross-sectional analyses. The extension of this literature in the volume edited by Wiepking and Handy (2015) with chapters analyzing giving in many different countries using a uniform methodology is important, but all the analyses are cross-sectional. While much has been learned from the cross-sectional literature, it has been rare for papers in this literature to echo Auten and Rudney’s caution that cross-sectional statistics provide a static perspective. Similarly, it has been rare for a cross-sectional paper to suggest that its cross-sectional descriptive statistics and regressions may be very different if one takes into account longer run giving patterns.
There are of course papers in the charitable giving literature that use panel data and fixed-effects (or first-difference) regressions to eliminate potential bias from time-invariant omitted variables, the use called for by Bekkers and Wiepking (2011b, p. 355). 1 These papers do not describe long-run giving patterns nor estimate models of giving dynamics. In fact, it is typically the opposite. For example, to claim that a coefficient from a fixed-effects regression is an unbiased estimate of a causal effect, it is necessary to assume strict exogeneity (Wooldridge, 2010, Chapter 7, pp. 287–288): that is, to assume that no dynamics in the dependent variable (e.g., giving) link one time period to the next. Hence, fixed-effects papers about giving have typically assumed a static perspective is in place in the paper’s conceptual framework. 2
Moreover, most theory about why and how much people give has been explicitly static. This is understandably true for the foundational work (Andreoni, 1989, 1990; Batson et al., 1978; Becker, 1974; Bergstrom et al., 1986; Boulding, 1962; Cialdini et al., 1982; Piliavin et al., 1981) and remains true in subsequent theoretical development. Bekkers and Wiepking’s (2011a) seminal review of the literature about why people give was organized around three questions: who, what, and where. That the time dimension of giving—When?—is not one of the questions is evidence that the extensive literature reviewed was static. 3
A Dynamic Perspective
There are many theoretical reasons to expect that giving will be dynamic over time. First, it is well known that the majority of people give only in response to a request (Bekkers & Wiepking, 2011b). Hence, year-to-year variation in whether people are asked to give will translate into year-to-year variation in whether people give. Relatedly, many people seek to “avoid the ask” (Andreoni et al., 2017; DellaVigna et al., 2012). This implies further time variation in giving. Second, there is evidence that requests arriving when time is pressed lead to lower donation rates (Knowles & Servátka, 2015): How much time pressure a person is experiencing when requests arrive could lead to variations in giving. Third, there is evidence that separation in time between the decision/pledge to give and the actual payment of the gift leads to a substantial amount of not following through (Fosgaard & Soetevent, 2018; also see Andreoni & Serra-Garcia, 2016, 2019). Initial intentions to give not brought to fruition could easily lead to time variation in giving. Fourth, theories of habit formation (e.g., Becker, 1996; Pollak, 1970) applied to giving suggest that giving now can cause giving later (Lee et al., 1999; also see Asraf & Bandiera, 2017). Meer (2013) presents evidence of this for giving to a university.
In addition, the need to replace a static view with a dynamic perspective has been established in other areas of social science research. Welfare receipt is a well-known example in which a static perspective had created a myth—that people who receive welfare were long-term welfare dependent—that dynamic analysis later debunked: In fact, 75% of people who receive welfare do so for 5 or fewer years (see Coe, 1981; Duncan et al., 1988; Ellwood, 1986). The PSID played a central role in these papers, which in turn had significant influence on the 1996 welfare reform. Another example is the literature on giving within the family, which is conceptually closely related to the literature on charitable giving. This literature has also been static in perspective: “Even simple questions such as the year-to-year variation in receipt of transfers have remained unanswered . . .” (McGarry, 2016, p. 1). McGarry (2016) provides evidence that giving within the family has strong year-to-year dynamics.
Little is known about the dynamics of charitable giving. A limitation of the extant evidence is that it describes only a single charitable purpose (Ottoni-Wilhelm, 2010; Wu & Brown, 2010) or an aggregation of purposes (Auten & Rudney, 1990) and/or covers only a few years of time (10 months—Leliveld & Risselada, 2017; 2 years—de Wit & Bekkers, 2015; 3 years—Ottoni-Wilhelm, 2010; Wu & Brown, 2010; 5 years—Auten & Rudney, 1990). Bekkers and Wiepking’s (2007) observation still stands: “Dynamic analyses of donation patterns over time are clearly needed” (p. 43).
This article’s first contribution is to provide a comprehensive description of giving dynamics over time. By comprehensive, we mean two things: thorough in the dimension of purposes to which Americans give and long enough across the dimension of time to measure different dynamic giving patterns—never, seldom, from time-to-time, and frequent. The second contribution is to show how cross-sectional descriptive statistics and associations, if interpreted from a static perspective, mislead about donation behavior.
Data and Method
The data are from eight biennial waves of the PSID 2001–2015 interview years that measure giving in the previous calendar years 2000–2014 (McGonagle et al., 2012; PSID, 2017). Giving to nine charitable purposes is measured in separate queries: helping people with basic needs, organizations that serve a combination of purposes (like the United Way; henceforth “combined purposes”), health, education, youth/family services, neighborhoods/community, arts/cultural, environmental, and international. Giving to all of these purposes, aggregated together, we refer to as giving to “charitable organizations.” Giving for religious purposes and spiritual development is measured with a question about giving to churches, synagogues, mosques, and TV/radio ministries; we refer to this as giving to “congregations” and analyze it separately. Two strengths make the PSID well suited for our analysis: First, it provides high-quality measurement of giving (Wilhelm, 2006, 2007), and second, because the PSID interviews the same people across time, it permits investigation of the dynamics of American giving.
We use the three subsamples within the PSID: the nationally representative subsample, the low-income oversample, and the 1997 immigrant refresher sample. Our results use the PSID weights that adjust for unequal selection probabilities that initially brought families into the PSID through one of the three subsamples and for differential attrition (Schoeni et al., 2013). The PSID’s unit of analysis for measuring giving and income is the family. The PSID “family unit” is defined to be people living together and sharing economic resources. The size of the panel sample for analysis is 6,425 individuals.
For an individual to be included in the panel sample, we required them to be a reference person or spouse/partner of a responding family unit in all eight of the interview years (transitions in being a reference or spouse/partner permitted). This requirement naturally excludes very young adults (who moved from their family-of-origin to create their own family unit), as well as the very old (whose declining health led to them being unable to continue responding to interviews). 4 To check robustness, Online Appendix B compares statistics describing giving in 2006 among those in the panel sample to giving in 2006 among the people in that year’s cross-sectional sample (i.e., all who responded to the PSID in the 2007 interview year). Online Appendix B shows that the giving statistics match closely between the panel and the cross-sectional samples. However, there are a few indications that the panel is a little more “stable” than the cross-section (e.g., more likely to be in the middle of their life-course, slightly more likely to be married, slightly higher income). These indications of more stability in the panel sample suggest that the dynamics of giving we estimate may be a lower bound.
A second reason our description of giving dynamics may be a lower bound is that giving is measured at the purpose level, not the organization level. For example, a person who gives 1 year to her local food bank, then the next year switches to Habitat for Humanity, and then the year after that switches to the Salvation Army’s Christmas Assistance would appear in our analysis as a non-dynamic, year-in/year-out giver to organizations that help people with basic needs. Although an organizational-level analysis would reveal even stronger dynamics than we report, a purpose-level analysis is the level appropriate for policy analysis.
We describe giving dynamics by measuring for each person the number of years out of 8 they gave: never (did not give in any of the 8 years), seldom (gave in 1 or 2 years out of 8; so every fourth year or less), from time-to-time (in 3, 4, or 5 years; roughly every other year), and frequently (in 6, 7, or 8 years; 3 out of 4 years or more often). Changes in these definitions produce a qualitatively similar description. However, note that using these definitions leads to a third reason our description of giving dynamics may be a lower bound: The definition of “frequent” (“year-in/year-out”) giving includes giving in 6 or 7 years, not necessarily in every year; and “never” includes people (albeit likely not many) who did not give in any of the 8 years but may give in future years.
Results
Study 1 describes the dynamics of giving to all nine charitable purposes aggregated together and also for four separate charitable purposes: basic needs, combined purposes, health, and education (separate results for the other five purposes are in Online Appendix C). Study 2 presents evidence that interpreting cross-sectional results without consideration of giving dynamics leads to overestimates, both of summary statistics and regression coefficients. Study 3 briefly presents parallel results about the dynamics of giving to religious congregations.
Study 1: Dynamics of Giving to Charitable Organizations
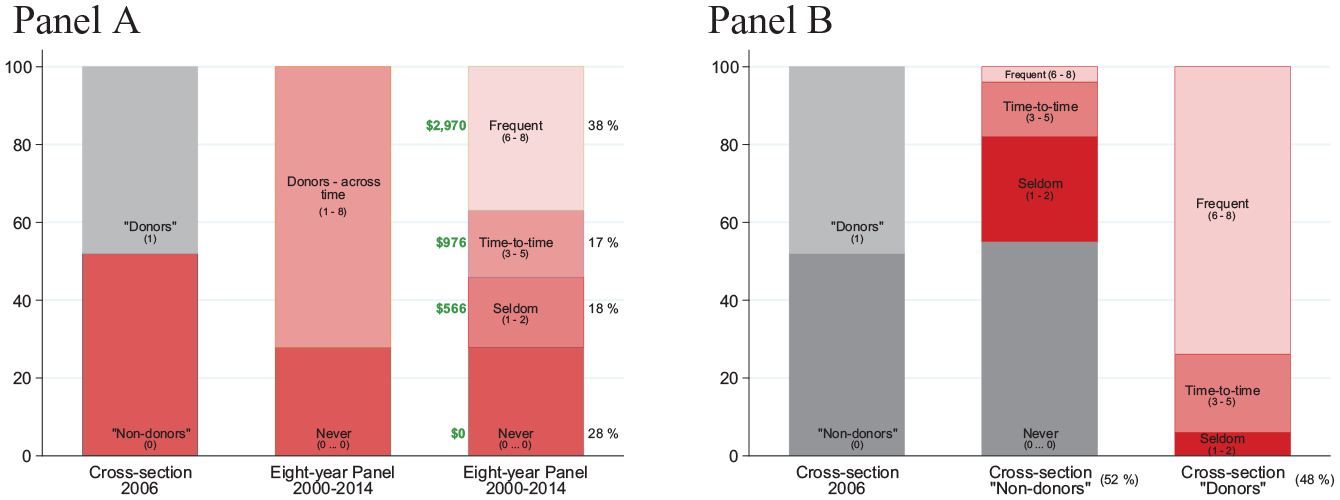
Figure 1 presents the dynamics of giving in the 8-year panel. The first bar examines 2006 only and shows that 61% (of the panel sample) gave to at least one of the nine charitable purposes in that year. Thirty-nine percent did not give. This is the kind of cross-sectional description that is typical in the literature.
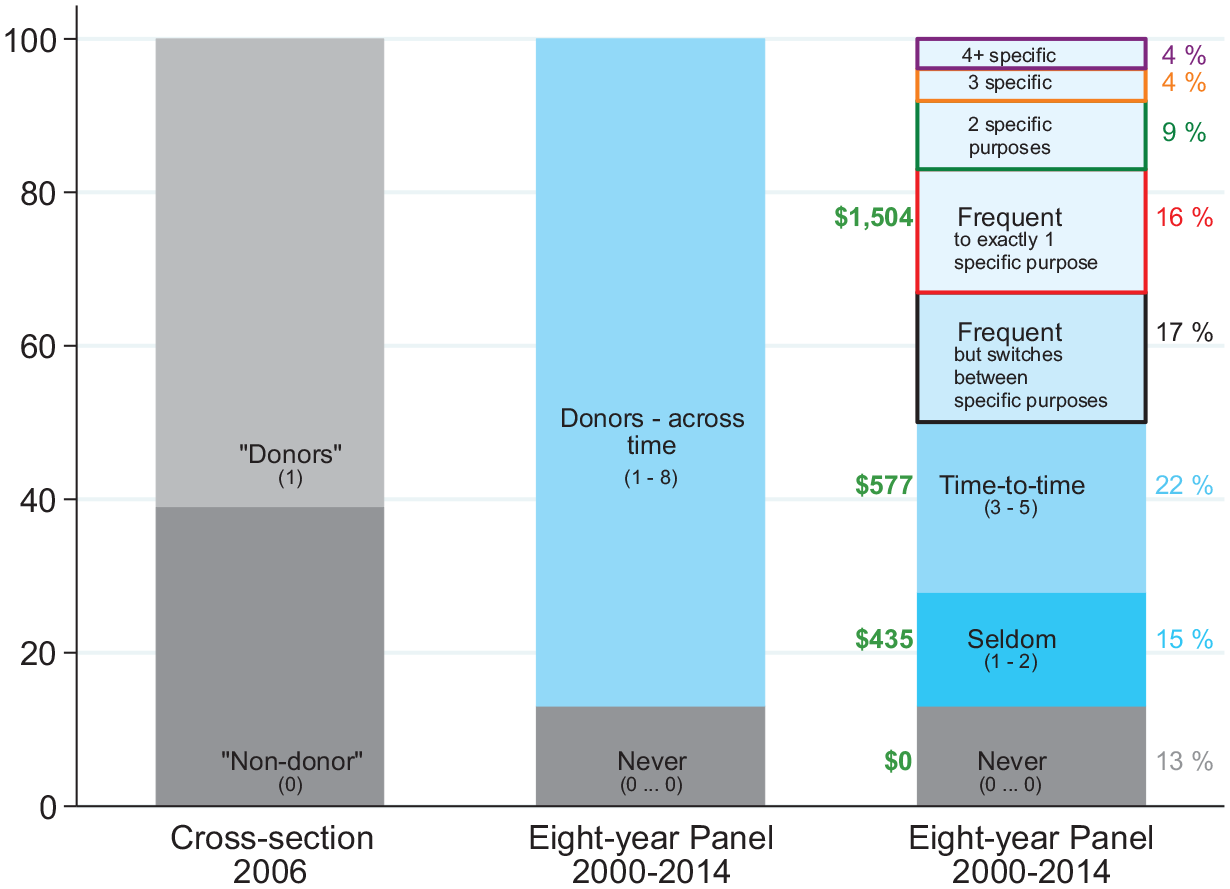
Dynamics of American giving: The majority of donors give every other year (or less often) to a specific charitable purpose.
The second bar begins to reveal the dynamics. It shows that 87% of Americans gave at least once over the eight calendar years (again, to at least one of the nine charitable purposes). That the 87% is much higher than the 61% in the first bar is an indication of the strength of giving dynamics: The 26 percentage point difference indicates that many people gave in at least 1 of the 8 years, but not in 2006. The second bar also shows that a small minority, 13%, did not give to any charitable organization in any of the 8 years.
The third bar shows the dynamic patterns: 15% of Americans gave seldom, 22% gave from time-to-time, and 17% gave frequently but switched year-to-year from one purpose (e.g., basic needs) to another (e.g., health), hence our first main result—54% of Americans give to charitable organizations but are “switchers”; they give in some years but not others, or they switch their giving from one charitable purpose to another. The majority of Americans who donate—62% (54/87)—are not year-in/year-out givers to the same charitable purpose.
These strong dynamics in the yes/no decisions to give would have a very different interpretation if seldom/time-to-time donors counterbalance their less frequent donations by giving larger amounts when they do give. This is not the case. The dollars just to the left of the third bar are the average amounts given per year by frequent, time-to-time, and seldom donors. The average annual giving of seldom and time-to-time donors, including in the average only the years in which they gave more than zero, are US$435 and US$577. In both cases, these are much less than the US$1,504 annual average among those who frequently gave.
Figure 2 describes the dynamics of giving to four charitable purposes. The results for basic needs (Panel A) show that 35% of Americans gave in 2006 (again, a typical cross-sectional result), but that many more, 75%, gave at least once over the 8 years. The third bar shows strong dynamics: 28% gave to basic needs seldom and 30% gave from time to time. Only 17% gave frequently. The majority of donors to basic needs—78% (58/74)—do not give year-in/year-out.
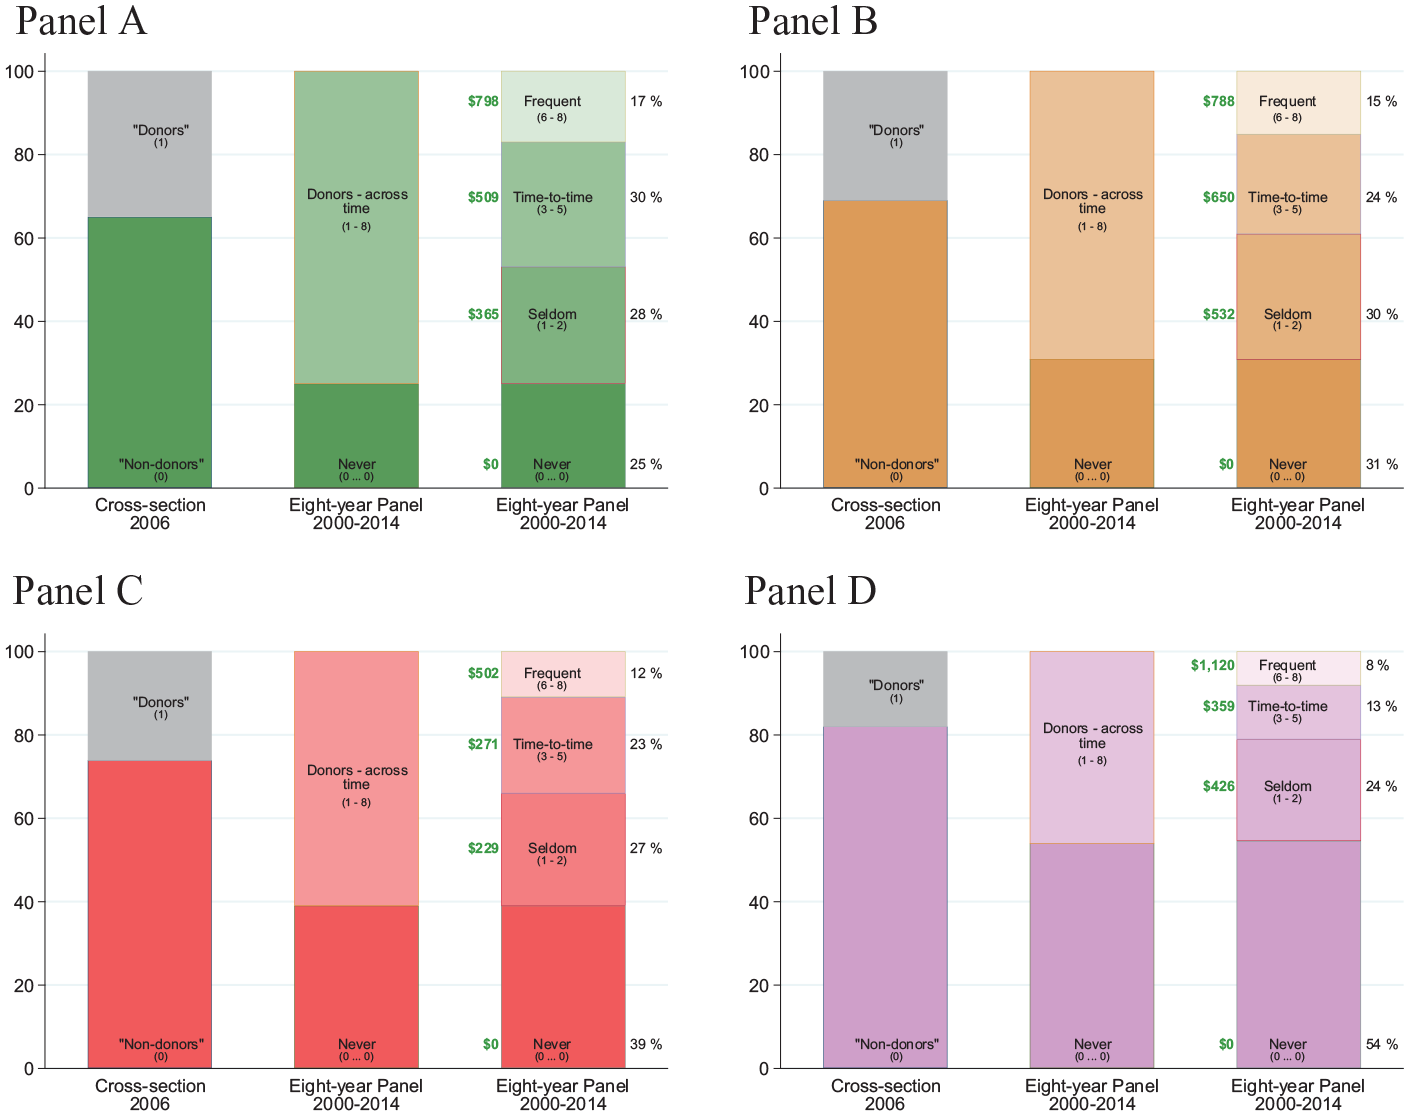
Dynamics of American giving to separate charitable purposes: A large majority of donors give every other year or less often.
The dynamics of giving to the other purposes in Figure 2 are similarly strong. The majority of donors to combined purposes, health, and education—78%, 82%, and 80%—do not give year-in/year-out to the respective purposes. As in Figure 1, seldom and time-to-time donors are not counterbalancing by giving larger amounts. The dynamics of giving to youth/family services, neighborhoods/community, arts/cultural, environmental, and international are even stronger: The percentages of donors to these purposes not giving year-in/year-out range from 80% to 96% (Online Appendix C).
Study 2: Cross-Sectional Estimates and the Dynamics of Giving
When we look at a cross-section of giving, we now know we are looking at a mix of seldom, time-to-time, and frequent donors. Study 2 asks whether this fact leads to a reinterpretation of received stylized facts based on cross-sectional analyses.
Figure 3 splits the panel sample into two groups based on whether they donated to any charitable organization in 2006. Figure 3’s first bar is the same as Figure 1’s first bar. The second bar focuses on the 39%—the cross-sectional “non-donors”—and shows their dynamics of giving over time. The third bar does likewise for the 61% who were “donors” in the 2006 cross-section.
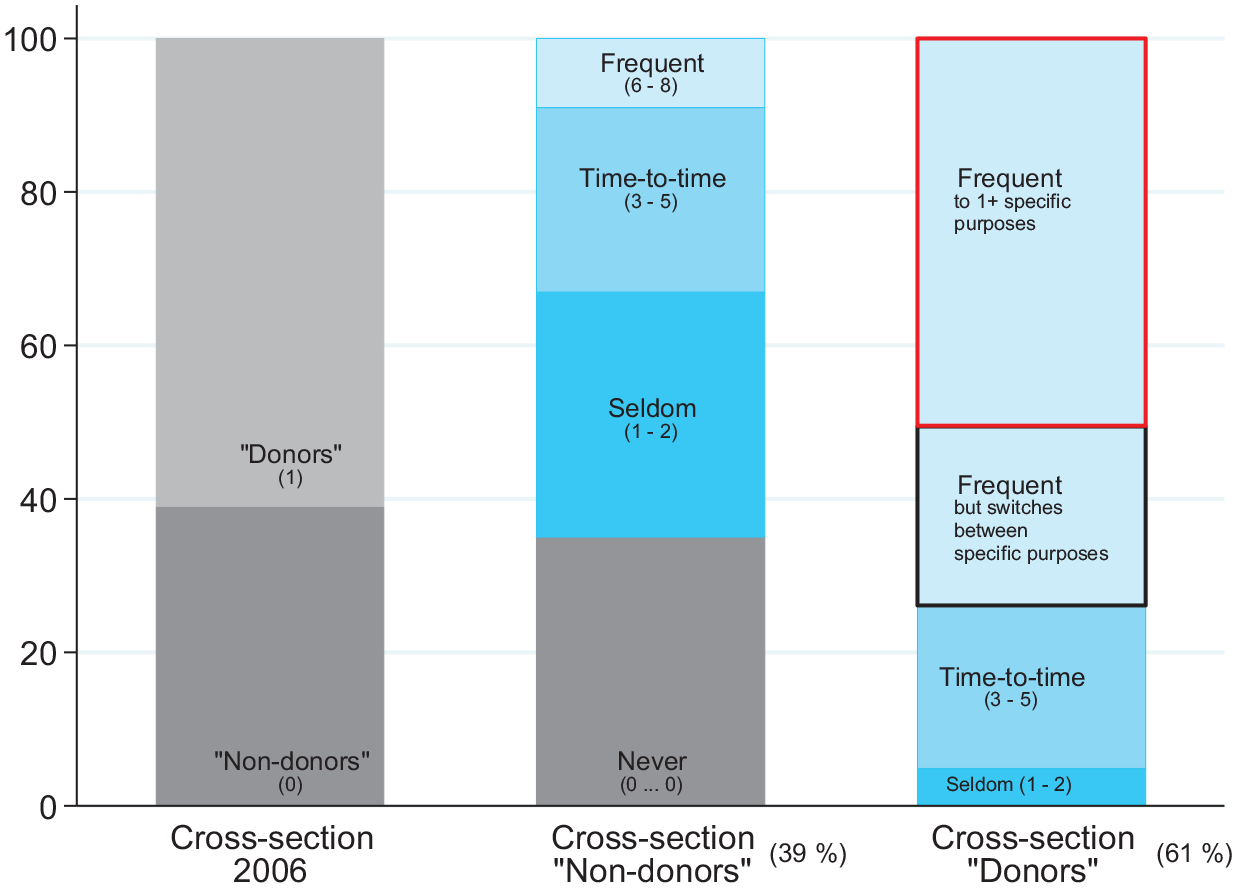
Dynamics of giving by people identified as “non-donors”/“donors” to charitable organizations in the 2006 cross-section.
Among the 39% who would be identified as “non-donors” in a typical cross-section, the second bar shows that 32% of them gave every fourth year or less and 24% gave roughly every other year. Indeed, just under 10% were frequent donors. Hence, among those whom a cross-sectional analysis would indicate “do not donate,” nearly two thirds gave to charitable organizations. Another way to say this: People identified as “non-donors” in a cross-section are about twice as likely to give (in some other year) than they are to never donate.
The third bar shows that, among the 61% identified as “donors” in a cross-section, about one half are switchers: 5% give seldom, 21% give from time-to-time, while 23% give year-in/year-out but switch between charitable purposes. If all you know is a cross-sectional indication that a person is a donor, it is a coin-flip as to whether or not that person is a frequent giver to one (or more) specific purposes.
Figure 4 presents corresponding results for specific charitable purposes. The results for basic needs (northwest panel) in the first bar show that in 2006, 35% of Americans gave and 65% did not. The second bar shows that, among the 65% cross-sectional “non-donors” to basic needs, 60% of them donated to basic needs in other years: 34% seldom, 22% from time-to-time, and 4% frequently.
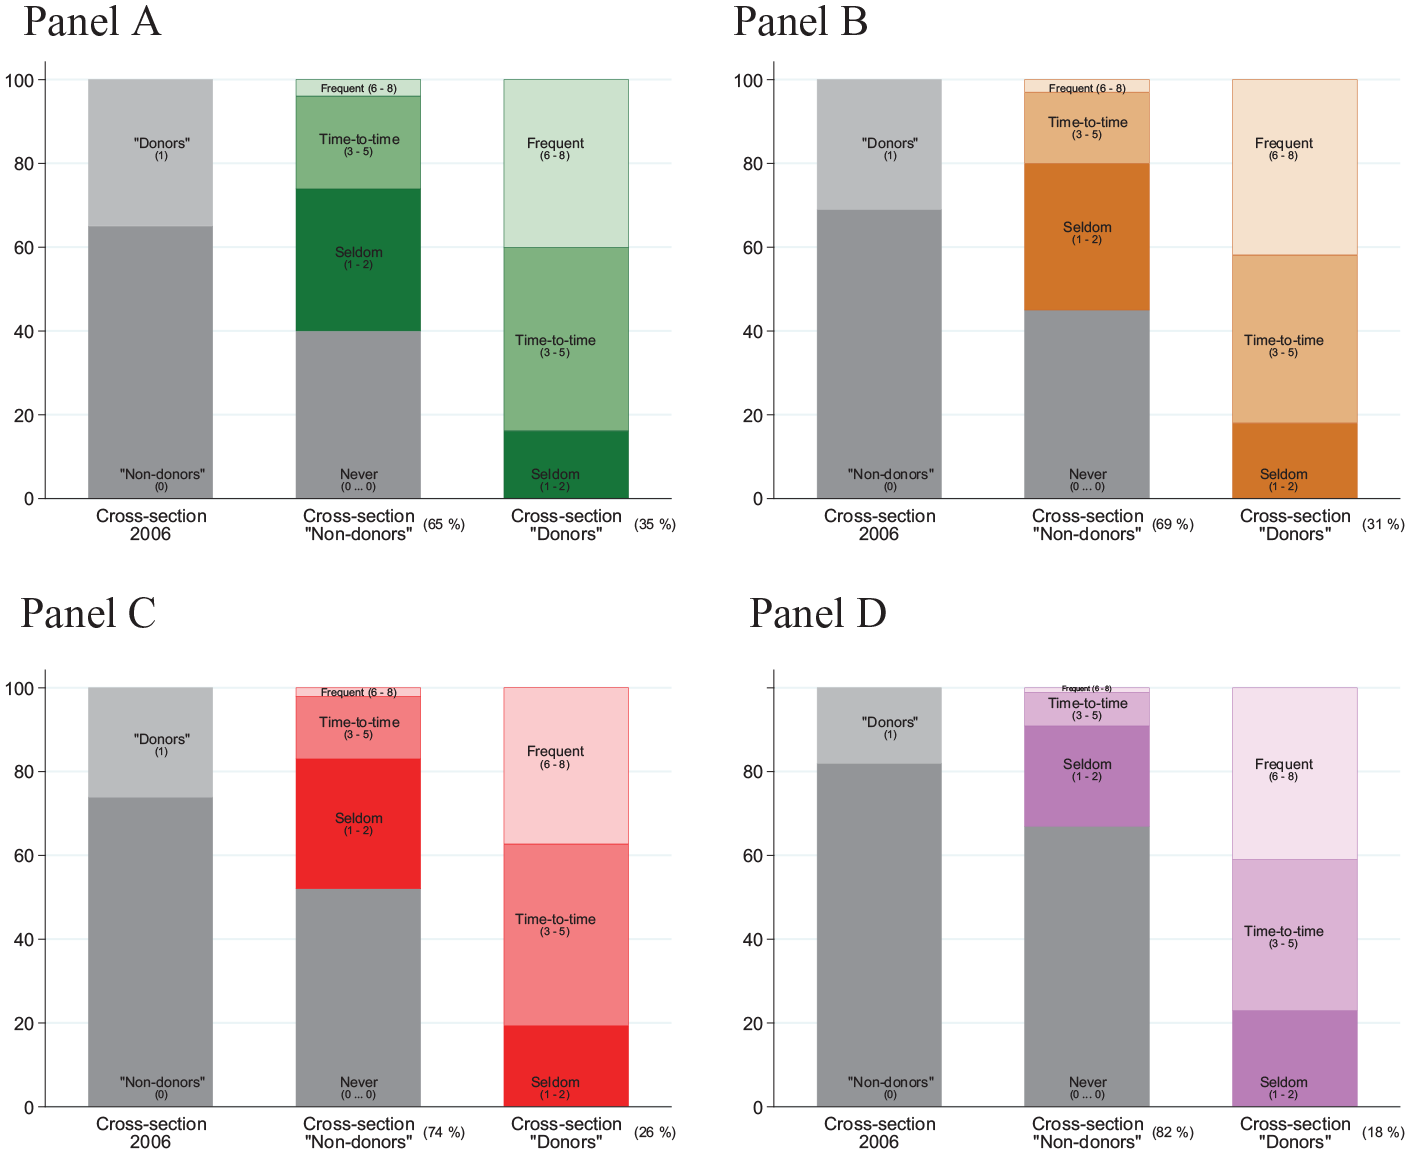
Dynamics of giving by people identified as “non-donors”/“donors” to separate charitable purposes in the 2006 cross-section.
The third bar shows that, among the 35% cross-sectional “donors” to basic needs, only 40% of them gave year-in/year-out. Most of them, 60%, gave from time-to-time (44%) or seldom (16%).
The results for combined purposes are similar. Among cross-sectional “non-donors,” a majority (65%) do give in other years, and among cross-sectional “donors,” only a minority (42%) gave year-in/year-out. Among cross-sectional “non-donors” to health and education, it is substantial minorities (48% and 33%, respectively) who give in other years; among cross-sectional “donors” once again only 37% and 41% gave year-in/year-out. Results for the other specific purposes are qualitatively similar to those for health and education (Online Appendix C).
Cross-sectional regressions between amounts given and socioeconomic characteristics viewed from a dynamic perspective
In this section, we present evidence that interpreting cross-sectional regression coefficients without consideration of giving dynamics usually leads to overestimates of the associations. Table 1 begins with a typical cross-sectional regression in Column 1. The dependent variable is the logarithm of the amount given in 2006 to the nine purposes aggregated together (corresponding regressions for 2000 and 2014 are in Online Appendix D). The regression includes “non-donors” in 2006 (we added US$10 to each person’s giving before taking the log, for both non-donors and donors); we now know from Figure 3 that two thirds of these “non-donors” are people who gave in other years. The independent variables are socioeconomic and demographic characteristics measured in 2006. We focus on income, college education, and family structure (also included number of children, birth cohort, race, religious affiliation; coefficient estimates in Online Appendix D).
Charitable Organizations: Cross-Sectional Regressions of Log Amount Given in 2006 by Different Dynamic Groups (Columns 1–8), and of Frequent Giving (Column 9), on Socioeconomic Characteristics.
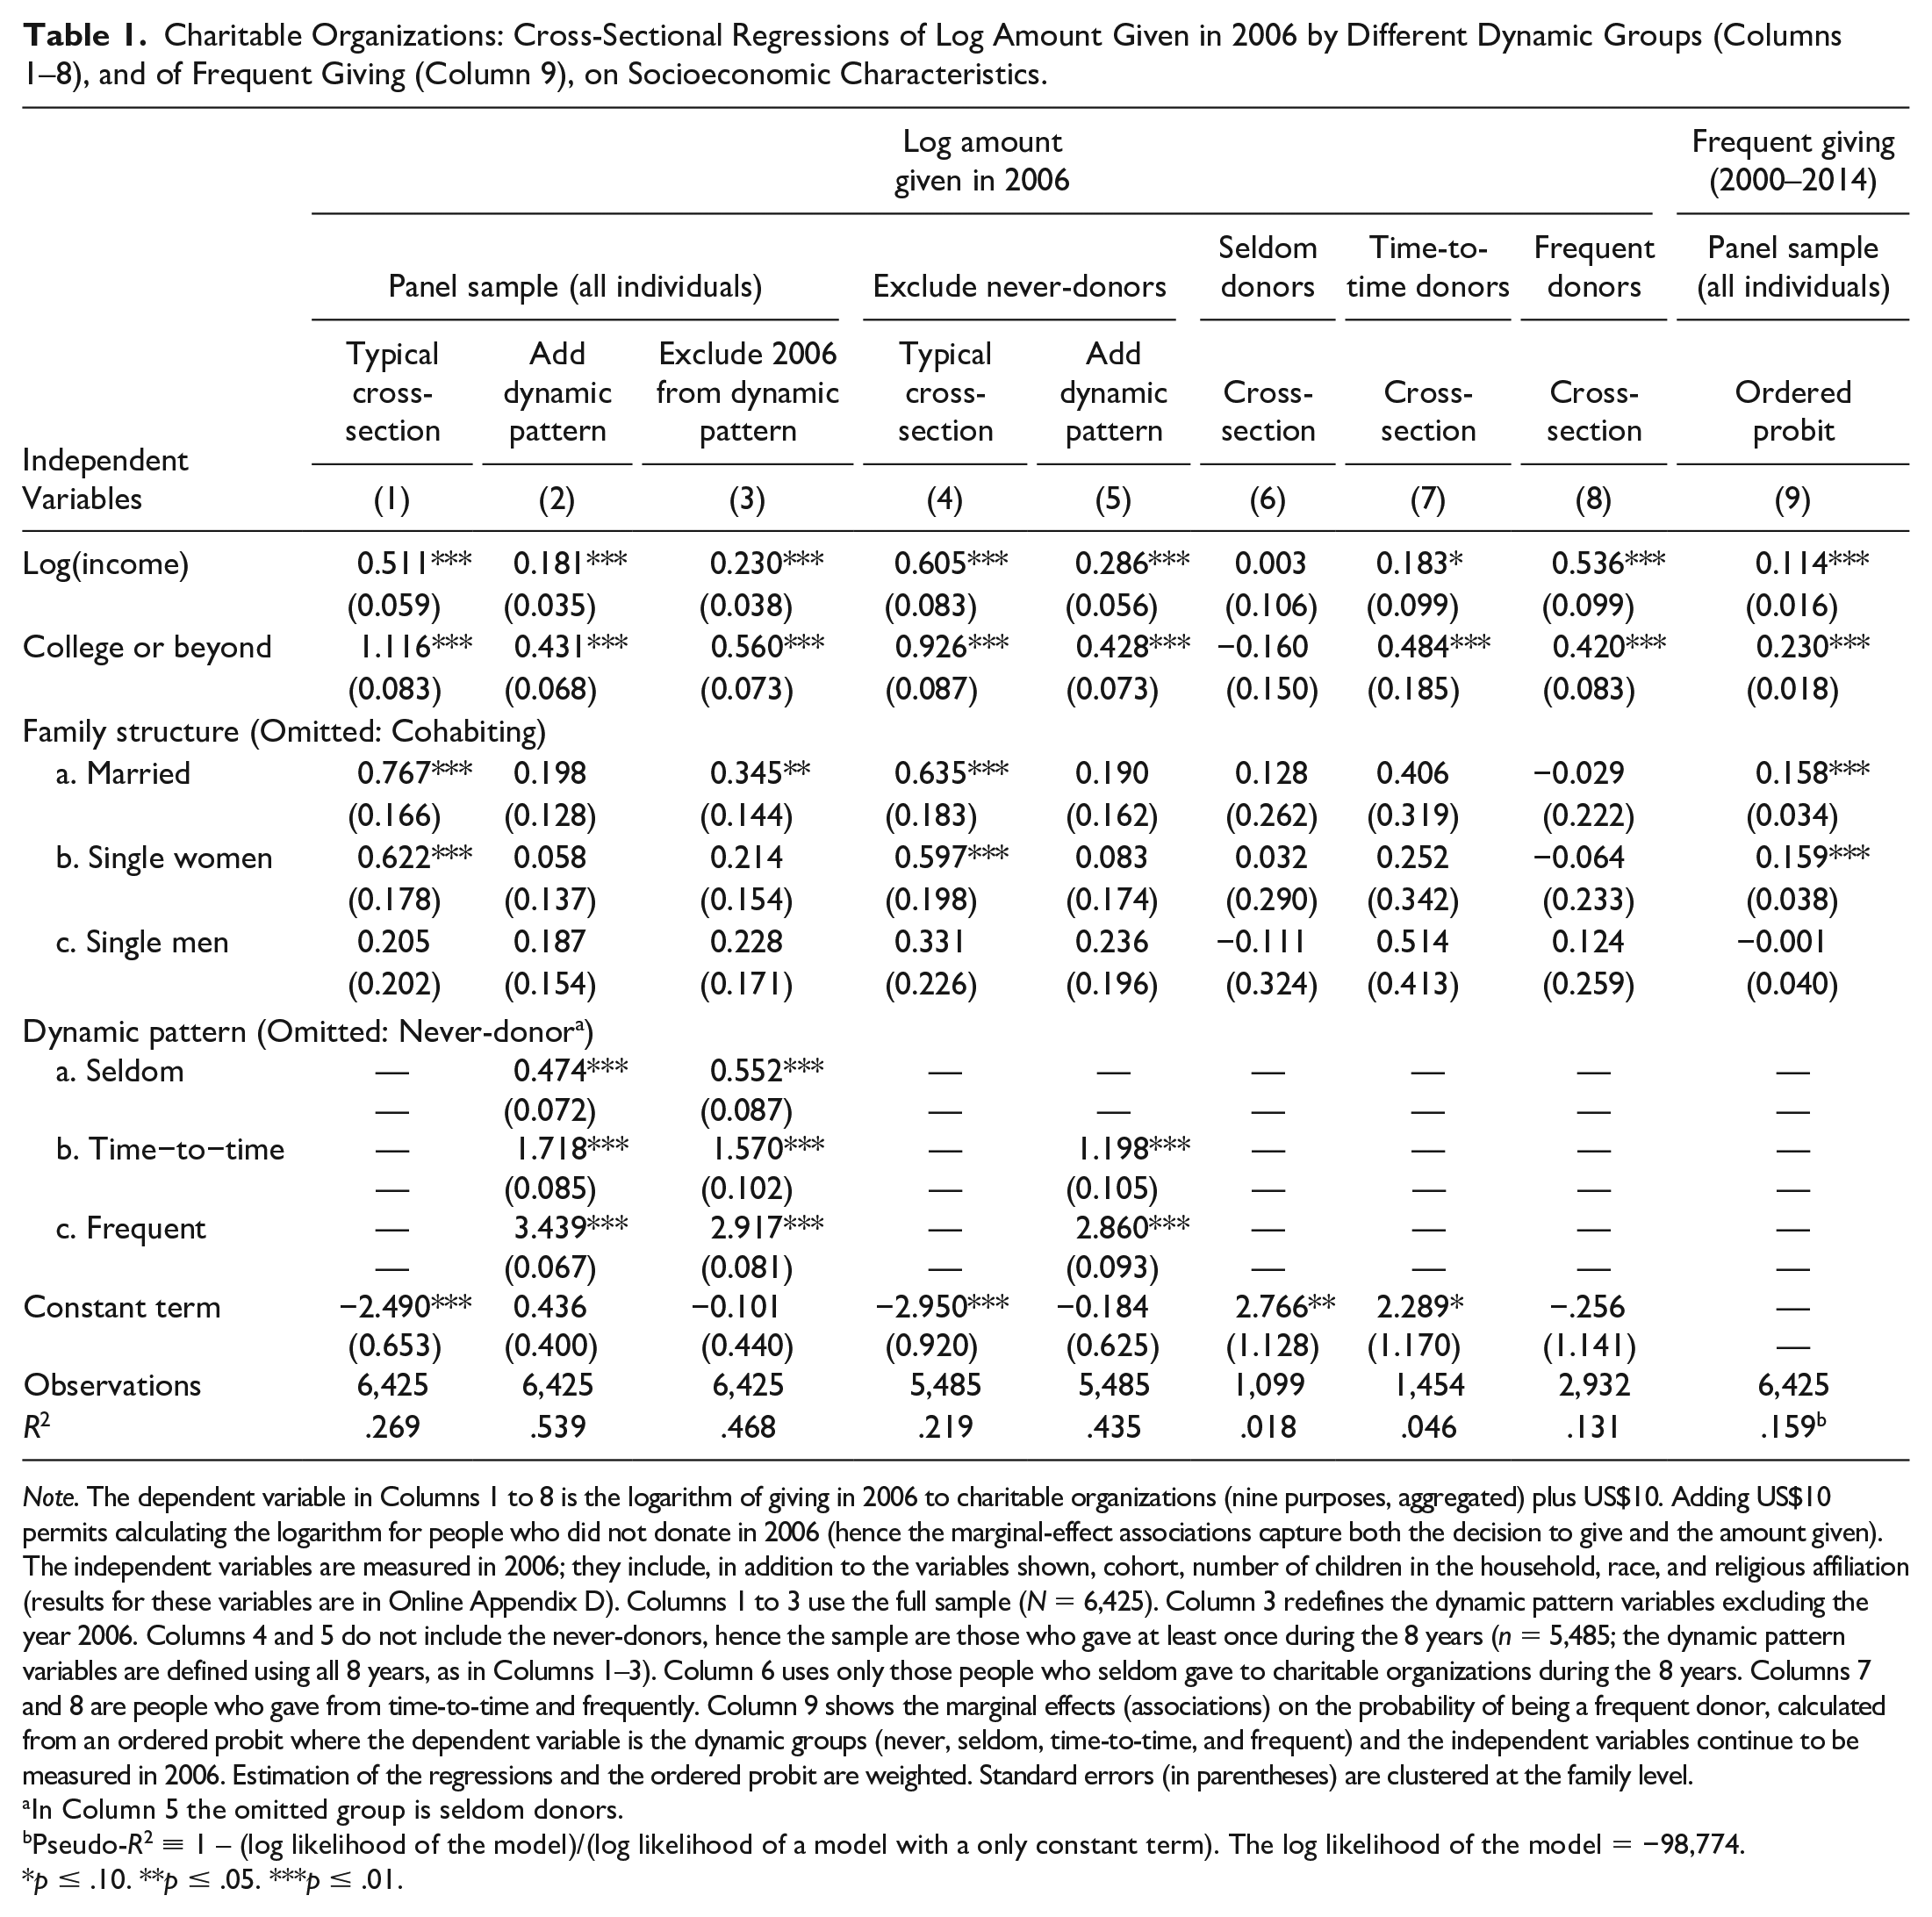
Note. The dependent variable in Columns 1 to 8 is the logarithm of giving in 2006 to charitable organizations (nine purposes, aggregated) plus US$10. Adding US$10 permits calculating the logarithm for people who did not donate in 2006 (hence the marginal-effect associations capture both the decision to give and the amount given). The independent variables are measured in 2006; they include, in addition to the variables shown, cohort, number of children in the household, race, and religious affiliation (results for these variables are in Online Appendix D). Columns 1 to 3 use the full sample (N = 6,425). Column 3 redefines the dynamic pattern variables excluding the year 2006. Columns 4 and 5 do not include the never-donors, hence the sample are those who gave at least once during the 8 years (n = 5,485; the dynamic pattern variables are defined using all 8 years, as in Columns 1–3). Column 6 uses only those people who seldom gave to charitable organizations during the 8 years. Columns 7 and 8 are people who gave from time-to-time and frequently. Column 9 shows the marginal effects (associations) on the probability of being a frequent donor, calculated from an ordered probit where the dependent variable is the dynamic groups (never, seldom, time-to-time, and frequent) and the independent variables continue to be measured in 2006. Estimation of the regressions and the ordered probit are weighted. Standard errors (in parentheses) are clustered at the family level.
In Column 5 the omitted group is seldom donors.
Pseudo-R2 ≡ 1 – (log likelihood of the model)/(log likelihood of a model with a only constant term). The log likelihood of the model = −98,774.
p ≤ .10. **p ≤ .05. ***p ≤ .01.
The estimates, interpreted from a static perspective, indicate very strong associations between socioeconomic characteristics and amounts given. The income elasticity is 0.511: A 10% increase in income is associated with 5.11% larger giving. College education is associated with nearly threefold larger amounts given (e1.116 = 3.05). Married couples and single women give much larger amounts (e.767 = 2.15 and e.622 = 1.86 times, respectively) than cohabiting couples. Results like these are typical and have appeared numerous times previously in the literature (Bekkers & Wiepking, 2011b; Wiepking & Bekkers, 2012).
Column 2 adds a dynamic perspective by including indicators for whether the person is a seldom, time-to-time, or frequent donor; the reference category is never-donors (13% of the sample). Once the dynamics of giving are controlled, the income elasticity falls by almost two thirds to 0.181, the college education association falls by half to 1.5, and the married couple and single women associations are not nearly as large as Column 1 would suggest. Moreover, there is no longer any evidence that married couples/single women give larger amounts than single men. The large change in associations is not about loss of statistical significance (all the standard errors in Column 2 are noticeably smaller than their Column 1 counterparts); it is about the fall in the magnitude of the point estimates. The magnitudes fall because, as Figure 1 indicates, amounts given and frequency of giving are strongly correlated.
Columns 3 to 5 check the robustness of Column 2-to-Column 1 comparison. Column 3 redefines the dynamic pattern variables excluding 2006. This breaks the connection in Column 2 between being a never-donor in all 8 years (including 2006) and giving US$0 in 2006. The redefined dynamic patterns using 7 years are seldom (1–2 years), time-to-time (3–4 years), and frequent (5–7 years). Column 3 results as compared with Column 1 continue to indicate that Column 1 coefficients overestimate the associations between socioeconomic characteristics and amounts given. 5 Columns 4 and 5 return to the 8-year definition of the dynamic pattern but drop the never-donors from the analysis. This answers a slightly different question: Among people who ever donate, does the typical cross-sectional regression continue to overestimate the associations? The answer is yes: The results from comparing Column 5 (with the dynamic pattern variables included) with Column 4 are qualitatively similar to the results seen when comparing Column 2 with Column 1, although as to be expected the specific quantitative magnitudes are somewhat different. For instance, the income coefficient drops by one half (.605 to .286) rather than by two thirds.
Columns 6 to 8 re-estimate Column 1 regression separately for each dynamic group. Separate estimation produces smaller sample sizes in each regression and hence larger standard errors. However, the question to ask is as follows: Are Column 1 point estimates good approximations for the magnitudes of the point estimates for any of the dynamic groups? Column 6 shows that among the people who seldom gave, the socioeconomic characteristics are not strongly associated with the 2006 amount given. Column 7 indicates that for time-to-time donors, the results are similar to those already seen in Column 2. Column 8 indicates that the income elasticity among frequent donors is 0.536. This is the only coefficient in the table for which Column 1 typical cross-sectional estimate is a reasonable approximation of the coefficient in one of the dynamic groups. College education is associated with amounts given with about the same magnitude as in Column 2 (substantially smaller than in Column 1). There is no evidence among frequent donors that married couples/single women give larger amounts than cohabiting couples.
In summary, Columns 1 to 8 indicate that a static interpretation of the estimates from a typical cross-sectional regression—an interpretation that would suggest the estimates are only about associations between socioeconomic characteristics and amounts given—usually overstates by a lot the magnitude of those associations. The cross-sectional estimates are also picking up strong associations between those characteristics and the time dimension of giving.
Characteristics–time associations are presented in Column 9. The dependent variable is now the dynamic groups (never, seldom, time-to-time, and frequent), and the estimation is ordered probit. The estimates in the column are marginal-effect associations with the probability of being a frequent donor. The socioeconomic characteristics remain those measured in 2006. The estimates indicate that a 10% increase in income is associated with a 1.14 percentage point higher probability of being a frequent donor. College education is associated with a 23 percentage point higher probability of being a frequent donor, and being married, or being a single woman, is associated with an almost 16 percentage point higher probability.
By ignoring the time dimension, a static interpretation of the cross-sectional associations in Column 1 (and Column 4) directs attention away from the strong associations between socioeconomic characteristics and the frequency of giving evidenced in Column 9. Directing attention to the time dimension of giving has important implications for researchers and practitioners, to be discussed after first presenting parallel results about congregations.
Study 3: Dynamics of Giving to Religious Congregations
The dynamics of giving to religious congregations/TV/radio ministries are similar in strength to the dynamics of giving to charitable organizations aggregated together (Figure 1), but less strong than the dynamics in any one of the specific charitable purposes (Figure 2). Figure 5 presents the results. Panel A shows the dynamics, and Panel B presents the dynamic patterns of cross-sectional “non-donors” and “donors” to congregations.
Dynamics of American giving to congregations.
Bar 1 of Panel A shows that 48% of Americans gave to congregations in 2006, but Bar 2 indicates that 72% gave at least once over the 8 years. The third bar shows the dynamics: 18% gave seldom, 17% gave from time-to-time, and 38% gave frequently. Hence, about half (49%) of donors to congregations did not give year-in/year-out. This is similar to the percentage of donors to aggregate charitable organizations who gave seldom/time-to-time (43%), but much smaller than the corresponding percentages among donors to any one of the specific charitable purposes (78% or higher). In short, the dynamics of giving to congregations are strong but, perhaps not surprisingly, not as strong as the dynamics of giving to basic needs, combined purposes, health, or education.
In Panel B, the second bar shows that, among the 52% who are cross-sectional “non-donors” to congregations, 45% donated in other years (not quite half, similar to health): 27% seldom, 14% from time-to-time, and 4% frequently. The third bar shows that among the 48% who are cross-sectional donors, 26% gave seldom/time-to-time, similar to the corresponding percentage among donors to aggregate charitable organizations (Figure 3), but much smaller than the corresponding percentages for specific charitable purposes (58% or higher; Figure 4).
Online Appendix D presents cross-sectional regression results for congregations that parallel Table 1. The results are similar to those for charitable organizations in that a static interpretation of cross-sectional estimates overstates the magnitudes of associations between socioeconomic characteristics and amounts given—again because the estimates also pick up associations between the characteristics and the frequency of giving—while directing attention away from those characteristics–time associations. The most interesting results are about the latter: The probability of being a frequent donor to congregations is less strongly associated with income and college, and more strongly associated with being married, than is the probability of being a frequent donor to charitable organizations.
Discussion
Extant interpretations of cross-sectional results routinely suggest a dichotomy in which people are viewed as either never-givers or always-engaged donors. The evidence presented above indicates this interpretation is inaccurate: Few Americans never give, and the majority of Americans who donate are switchers; they do not give year-in/year-out to a specific charitable purpose. The terms “non-donor” and “donor” when based on cross-sectional data are misleading: A two-thirds majority of “non-donors” to charitable organizations in a cross-section give to charitable organizations in other years, and almost half of “donors” in a cross-section do not give year-in/year-out to a specific charitable purpose. Associations between amounts given and socioeconomic characteristics are less strong than a static interpretation of cross-sectional results would suggest; a large portion of those associations are about the dynamics. The dynamics of giving to specific charitable purposes are even stronger: The vast majority of donors to specific purposes do not give year-in/year-out to that purpose (78% and higher, depending upon the purpose). That such large percentages of ever-donors to specific purposes are seldom/time-to-time givers appears to be an empirical regularity. 6 America is more of a nation of seldom and time-to-time givers than previously realized, especially to specific charitable purposes.
Although the evidence indicates strong dynamics in American giving, there are some qualifications to be kept in mind. First, there are three reasons, discussed in the “Data and Method” section, to believe that the present results understate giving dynamics. Of these, we think the most important is that giving was measured at the purpose level, not the organization level. Purpose-level measurement is relevant for policy analysis (e.g., for analyzing the giving of Americans to help people with basic needs), but does imply that the dynamics we report are a lower bound to the dynamics practitioners in specific organizations should expect to experience. 7 Second, the Great Recession occurred during the time period of the data, which may suggest the present results overstate dynamics compared with what would have been seen in a recession-free period. Whether the recession caused a structural change in American giving dynamics is an important question for future research. Finally, we have described the dynamics in terms of whether or not people gave, and how frequently they gave across time, but not in terms of amounts donated. Although we found that lower frequencies of giving were not counterbalanced by larger amounts, analysis of the dynamics in the amounts is another important topic for future research. 8
The results are significant for several reasons. By comprehensively describing American giving dynamics, the results imply the need for a paradigm shift in how we think about giving: a shift from the static to the dynamic. Furthermore, that such large percentages give every other year or less often suggests a new imperative for research: focus on time.
Recent experiments that have focused on time and followed participants over a longer period than the initial session tend to find that the initial success from a static perspective was later in time substantially reduced (e.g., Knowles & Servátka, 2015) or entirely reversed (e.g., Meier, 2007). Andreoni and Serra-Garcia (2016) provide evidence of heterogeneity in how people use time to alter their giving: Some behave consistently across time, some want to renege in the future on pledges made today, and some seek a way to avoid the temptation to give today. The present results about the dynamics of giving elevate the importance of time-based designs such as these, not merely as one of the many important directions experimental research on giving is taking, but rather as a major new branch of the research agenda. 9
Finally, the results have implications for practitioners. For those interested in increasing the percentage of income Americans give above the “stubborn two percent” (Faculty of the Lilly Family School of Philanthropy, 2019), a static perspective has constrained thinking to two approaches: (a) encourage people already donating to give larger amounts and (b) encourage non-donors to start giving. However, a dynamic perspective suggests both approaches are unlikely to succeed. If in the two approaches “donor” is interpreted to mean “always-engaged donor,” and “non-donor” is interpreted to mean “never-donor,” success is unlikely because (a) frequent donors are already giving large amounts (on average) and (b) the 13% of Americans who “never” donate were so identified because they did not give in any 1 out of 8 years, making it unlikely that they will “switch-on” in the future. 10
A dynamic perspective also suggests that approaches (a) and (b) ask the wrong question because a static perspective’s “always-donor versus never-donor” dichotomy is not accurate: The majority of American donors are switchers, and people identified as “non-donors” in a cross-section are twice as likely to give in some other year than they are to never give.
What are better questions? A dynamic perspective points to the importance of asking questions based on time. What determines whether a time-to-time giver becomes a frequent giver, instead of a seldom giver? To our knowledge, there is no previous research on this question. Other important questions naturally follow: Why does an otherwise frequent giver “switch-off” for a year? Why does an otherwise seldom giver—for whom most years come and go without giving—switch-on 1 year and give? The importance of focusing on time rises upon realizing that, although an overwhelming majority of Americans give to charitable organizations across the years, only one third give year-in/year-out to a specific charitable purpose.
Conclusion
Measuring giving by more than 6,000 people across 8 years, we present evidence that American giving is strongly dynamic over time. That giving is strongly dynamic implies the need to shift perspectives with which we think about giving from the static to the dynamic. This paradigm shift suggests a new imperative for both secondary data and experimental research to focus on time. The importance of time also suggests a shift in what is counted as “successful” fund-raising to put more emphasis on increasing the frequency across time with which people give. After 60 years of important research on charitable giving having laid the foundation, it is time to focus on time.
Supplemental Material
sj-pdf-1-nvs-10.1177_0899764020977661 – Supplemental material for Dynamics of American Giving: Descriptive Evidence
Supplemental material, sj-pdf-1-nvs-10.1177_0899764020977661 for Dynamics of American Giving: Descriptive Evidence by Patrick M. Rooney, Mark Ottoni-Wilhelm, Xiaoyun Wang and Xiao Han in Nonprofit and Voluntary Sector Quarterly
Footnotes
Acknowledgements
We are grateful for helpful comments received from René Bekkers, Jonathan Meer, Sarah Smith, three anonymous reviewers and the Editor, and also participants at the 47th Association for Research on Nonprofit Organizations and Voluntary Action Annual Conference, University of Southern California’s Research Symposium: Philanthropy and Social Impact, the 9th European Research Network on Philanthropy International Research Conference, and the 6th Science of Philanthropy Initiative Conference.
Declaration of Conflicting Interests
The author(s) declared no potential conflicts of interest with respect to the research, authorship, and/or publication of this article.
Funding
The author(s) disclosed receipt of the following financial support for the research, authorship, and/or publication of this article: The collection of the Panel Study of Income Dynamics (PSID) data used in this study was partly supported by the National Institutes of Health under Grant Numbers R01 HD069609 and R01 AG040213, and the National Science Foundation under Award Numbers SES 1157698 and 1623684. Major support for the collection of the Philanthropy Panel Study data was provided by the Atlantic Philanthropies, the Bill and Melinda Gates Foundation, The John Templeton Foundation, The Charles Stewart Mott Foundation, and Fidelity Charitable Investments.
Supplemental Material
Supplemental material for this article is available online.
Notes
Author Biographies
References
Supplementary Material
Please find the following supplemental material available below.
For Open Access articles published under a Creative Commons License, all supplemental material carries the same license as the article it is associated with.
For non-Open Access articles published, all supplemental material carries a non-exclusive license, and permission requests for re-use of supplemental material or any part of supplemental material shall be sent directly to the copyright owner as specified in the copyright notice associated with the article.