
Abstract
Empirical research on donor behavior infers from donations being negatively related to overhead ratios (or indicators based on these ratios) that donors give more to more “efficient” organizations. This relation is proved to be at least partly driven by a purely mechanical link between donations and overhead ratios, which therefore should be isolated when studying empirically the behavioral effect of overhead ratio–based indicators on donors’ giving decisions.
Introduction
There is a huge literature suggesting that donors take into consideration (perceived) efficiency when determining which organizations to donate to, a reason why watchdog agencies include in their standards and ratings efficiency-related measures (Bhattacharya & Tinkelman, 2009; Wong & Ortmann, 2016). The empirical strategy to corroborate this is to link donations to a variable reflecting in one way or another the share of overhead costs (the sum of administration and fundraising costs) in total costs (the overhead ratio). What is commonly called the price of donations is, following its original naming in the seminal Weisbrod and Dominguez (1986) paper, in most specifications positively related to this ratio. Keeping this in mind, what follows will be presented in terms of the overhead ratio, which when referred to should be interpreted as “the overhead ratio or variables positively related to this ratio.” Different literature reviews on surveys, experiments, and accounting data-based work, already confirmed, with a limited number of exceptions, a negative relationship between donations and the overhead ratio (Jacobs & Marudas, 2009; Parsons, 2003). This has also been observed in experimental work on “overhead aversion” (e.g., Gneezy et al., 2014; Portillo & Stinn, 2018). Studies introducing various intervening variables allowed a more refined interpretation of this relationship, without invalidating it (e.g., Bakija & Heim, 2008; Brooks, 2007; Tinkelman, 1998; Tinkelman & Mankaney, 2007; Van der Heijden, 2013; Yetman & Yetman, 2013).
There are a number of well-known conceptual and practical issues with interpreting overhead ratios as unbiased efficiency indicators: overhead ratios are cost ratios without reference to output (Parsons, 2003), missing the crucial efficiency assessment relating organizational effort to output; overhead ratios are averages whereas to maximize the impact of potential donations marginal measures should be used (Jegers, 2008); too low levels of administration and fundraising may contain output (Castaneda et al., 2008); accounting manipulations might distort the overhead ratio disclosed (Keating et al., 2008; Krishnan et al., 2004, 2006; Parsons et al., 2017; Quosigk & Forgione, 2018); and potential donors might not correctly interpret efficiency data (Bennett & Savani, 2003). These problems, however, relevant in their own right, are not the central issue of this note, which focuses on the widespread use of the overhead ratio in empirical research on the drivers of donations.
This note’s main argument concerns the empirically found negative relation between donations and the overhead ratio. The (implicit or explicit) reasoning in the literature is that potential donors observe this proxy for organizational efficiency and react accordingly by giving more when overhead costs are relatively lower. In what follows it will be proved that in fairly general circumstances the level of donations is mechanically related to the overhead ratio. This implies that when estimating donations–overhead ratio relations, they should be corrected for this effect, resulting in more precise estimates of the donors’ behavioral responses to overhead levels. Assume the mechanical effect is, for example, negative, then an empirically observed negative relation between donations and the overhead ratio might just capture this effect, or exaggerate the behavioral reaction of donors, if not even conceal a positive relation between donations and the overhead ratio 1 once the mechanical effect is factored in.
In what follows the main concepts are introduced, after having presented a few numerical examples illustrating the logic of this note. Then the mechanical link between donations and the overhead ratio is derived. A conclusion and research implications conclude the note.
The Link Between Donation Level and Overhead Ratio
Some Numerical Examples
Before engaging in the general analysis, a few numerical examples are presented (in ascending order of complexity) to illustrate its logic.
Ignoring taxable output, we follow the traditional classification of non-profit organizations’ activities: administration, fundraising, and program. The costs of administration and fundraising, obtained after having appropriately allocated costs, are the “overhead” costs.
We assume throughout that donors are not influenced by the organization’s efficiency as reflected by the overhead ratio and will illustrate that even then different donation levels go together with different overhead ratio levels, wrongly suggesting causality, especially in cross-sectional research. If there were also a behavioral mechanism, the empirical assessment of the overhead ratio–donation relationship would show the combined effect of the technical relationship and the behavioral relationship.
In line with most of the literature, it will be assumed that the organization breaks even, producing as much as possible without incurring a loss. As shown below, this condition can be accommodated to other profit/loss assumptions without affecting the main implication of the analysis presented.
Example 1
Consider two organizations (A and B) providing goods or services free of charge, the fixed production cost of which is 20 currency units (henceforth “currency units” will not be mentioned anymore but implied for all monetary amounts), and the variable cost 2 per unit produced. Administrative costs and fundraising costs are fixed, 5 and 3, respectively. Donations to A amount to 50 and to B 100 and constitute all of the organizations’ revenues. Overhead ratios (ORs), defined as total overhead costs divided by total costs), then are respectively:
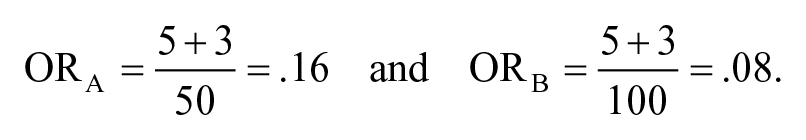
Hence, in this example, higher donations automatically go together with lower overhead ratios.
Example 2
We add to the previous example the assumptions that donations also come with a variable cost (e.g., for processing). Suppose this is .05 per currency unit donated. Fundraising costs then are 3 + (.05)(50) = 5.5 for A, and 3 + (.05)(100) = 8 for B. We then have
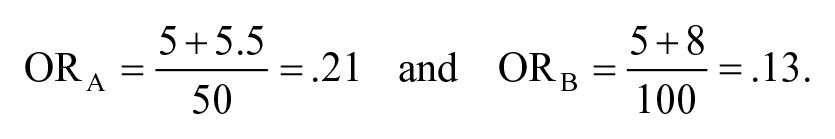
The conclusion of Example 1 remains.
Example 3
We now add to the previous example a variable administration cost of .10 per unit of output delivered. The amount available for production is what is left of the donations after having taken into consideration the variable donation cost ((1 − .05)(50) = 47.5 for A, and (1 − .05)(100) = 95 for B), net of the total fixed costs (20 + 5 + 3 = 28). As the variable cost per unit produced is 2 + .10 = 2.10, A produces in break even (47.5 − 28)/2.10 = 9.29 units, while B produces (95 − 28)/2.10 = 31.90 units. Hence, total overhead costs respectively are 5 + 3 + (.05)(50) + (.10)(9.29) = 11.43 and 5 + 3 + (.05)(100) + (.10)(31.90) = 16.19, leading to
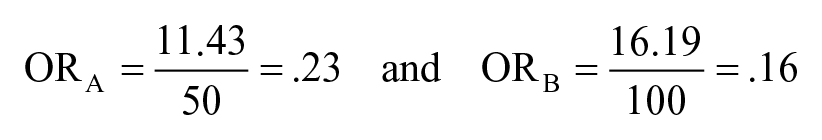
not qualitatively altering the above conclusions.
Example 4
This last example introduces a unit price equal to 1 for the output produced by the organizations. Break-even volumes for A and B, respectively, are (47.5 − 28)/(2.10 − 1) = 17.73 units and (95 − 28)/(2.10 − 1) = 60.91 units. Total costs now equal, in break even, the sum of donations and sales, respectively, 50 + 1 × (17.73) = 67.73 and 100 + 1 × (60.91) = 160.91. Overhead costs now are respectively 5 + 3 + (.05)(50) + (.10)(17.73) = 12.77 and 5 + 3 + (.05)(100) + (.10)(60.91) = 19.09, leading to
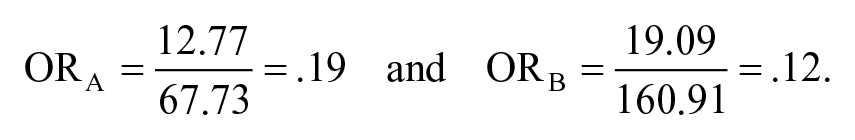
Also here, a lower donation level goes together with a higher overhead ratio.
In what follows, the analysis presented in the above examples is generalized in an analytical way, to make sure the conclusions reached are not just artifacts construed by a judicious choice of the parameters involved. It will be noted that under some circumstances, the technical relationship between the overhead ratio and donations can even be positive. This still means that such a technical relationship exists.
Costs and Break-Even Output
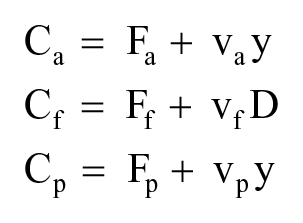
Administration (subscript a), fundraising (f), and program (p) costs each consist of a fixed part (F.) and a variable part (v.) multiplied by activity level assumed to be program activity (y) for administration, and level of donations (D) for fundraising:
Total costs, obviously, are

Not to detract from the main message of the current note, and acknowledging the ceteris paribus character of the analysis presented below, output price (P) is assumed to be exogenously determined, possibly being zero (P ≥ 0).
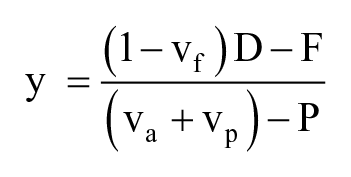
We assume P does not suffice to cover output-related variable costs (P < va + vp), a situation typifying numerous non-profit organizations. Hence, the necessity of donations, the variable cost of which should be low enough to allow more than recovering the total fixed cost F = Fa+Ff+Fp, 0 ≤ vf < (D − F)/D <1, or equivalently D > F/(1 − vf). Assuming the organization to break even 2 and donations to be given, output is
Producing more output would result in financial loss, as P < (va + vp), so producing the break-even volume is compatible with the organization maximizing output. 3
Not surprisingly, break-even output, ceteris paribus, increases (decreases) with decreasing (increasing) va, vf, vp, and F, and increasing (decreasing) D and P.
In the Appendix, the effects of changes in the cost components on total costs, when still meeting the break-even condition, are analyzed.
The Link Between Donations and the Overhead Ratio
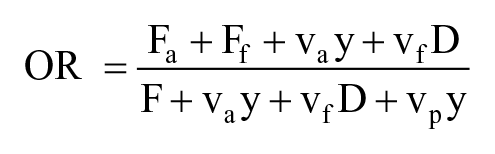
The overhead ratio (OR) is commonly defined as the total overhead cost divided by total costs:
Substituting the above expression for the break-even value of y and deriving OR w.r.t. D results in the following numerator (the denominator being C2 and hence positive):
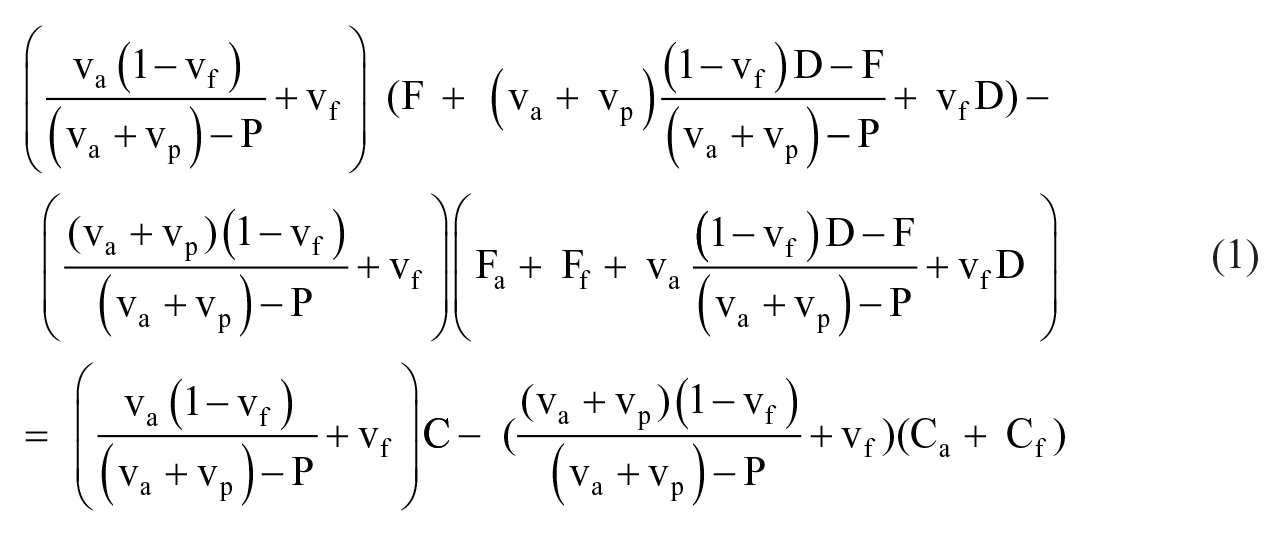
The sign of this expression determines the sign of ∂OR/∂D. If it differs from zero, this implies that the level of donations and the overhead ratio are technically linked to each other. If, for example, it is observed that higher donations go together with lower overhead ratios, and if ∂OR/∂D < 0, the observed relationship can be entirely or partially mechanical, meaning that one cannot automatically infer from observing this negative relationship a specific donor behavior such as consciously reacting on changing overhead ratios. Hence, trying to assess donor reactions necessitates correcting for the mechanically induced effects. 4
The Case of Fixed Overhead Costs
To fix the ideas, let us first look at the special, frequently observed, case in which variable overhead costs are negligible: va, vf → 0. From Equation 1, we then see that the sign of ∂OR/∂D is the sign of
which is clearly negative, as vp + va → vp > P.
The variable administrative and fundraising costs going to zero, the donation elasticity of the overhead ratio is, after substitution of y = (D − F)/(vp − P)
which is negative as vp > P and D > F. Moreover, |εOR,D|> 1, and therefore |εD,OR|< 1. Hence, in this case, higher donations automatically go together with lower overhead ratios, the latter decreasing relatively faster than the former. |εOR,D|increases for increasing values of P and F, and decreases for increasing values of vp and D, the effects being the opposite for |εD,OR|.
The General Case
We now turn to the general situation in which both overhead costs also have a variable component. Departing from Equation 1, we determine the donation elasticity of the overhead ratio:
In the previous paragraph it was proved that, for va, vf → 0, this expression is negative. When vf → 0 it is positive, C exceeding, by definition, Ca + Cf. So, εOR,D, and hence εD,OR, can be both positive or negative, only in special cases being equal to zero (e.g., when all variable costs involved are zero).
Conclusion and Research Implications
Donations and overhead ratios by construction being linked to each other, positively or negatively, imply that observed relations between them do not only reflect donors’ behavioral reactions to overhead ratios: at least part of the comovement is due to purely technical effects. Empirical work therefore should try to control as much as possible for this technical link, or at least take it in consideration while interpreting the observed empirical relations. The correction to be made is shown to depend on the interplay between fixed and variable costs of administration, fundraising, and output production. A crude but feasible way to achieve this, assuming within-industry homogeneity in cost structures, would be to include in regressions explaining donation levels not only the overhead ratio as an explanatory variable, but also, apart from considering the costumary direct industry effect, 5 the overhead ratio interacted with an industry dummy (labeled Ii for industry i):
β1 then estimates donors’ reactions to disclosed efficiency levels, whereas when leaving out the interaction terms the coefficient of OR would be a conflation of β1 and the βi. A more fine-grained approach might be possible, if data allow, in a panel estimation, now interacting OR with a firm-level dummy. Absent reliable data on fixed and variable cost components, this would not entirely eliminate the interference of the technical relation between overhead ratios and donations and the behavioral relation between both, but it would at least allow a less blurred estimation of the latter.
Footnotes
Appendix
The effect on total costs of a change in output-related variable costs is, when still meeting the break-even condition,
implying that changes in va and vp are more than compensated by the concomitant changes in output. This, however, does not automatically apply to the respective cost components. For Cp we find
the sign of which depends on the sign of (va − P), which can go both ways, the only condition on P being P < va + vp. Switching vp and va in the right-hand side of the last expression results in an equivalent conclusion for ∂Ca/∂va.
A change in vf induces a change in Cf proportional to D. For total costs C we have
implying that, to continue to break even, the direct increase (decrease) of Cf is more than compensated by the cost effect of the decrease (increase) of the break-even output.
As to the impact of changing fixed costs, the direct effect of a change in Ff on Cf is nothing else than the change in Ff. For Cp (and in a comparable way for the effect of changing Fa on Ca, switching again vp and va), the direction of the effect of changing fixed costs can be positive or negative:
the sign of which depends on whether P exceeds va.
The effect of any change in fixed costs on total costs is for all three categories of fixed costs negative:
Acknowledgements
The insightful and constructive comments by the three anonymous referees and the editors-in-chief Angela Bies and Chao Guo are gratefully acknowledged.
Declaration of Conflicting Interests
The author(s) declared no potential conflicts of interest with respect to the research, authorship, and/or publication of this article.
Funding
The author(s) received no financial support for the research, authorship, and/or publication of this article.