
Abstract
This Research Note introduces nonprofit scholars to the contemporary analytical tool of conditional inference trees as a means to shed more light on the institutional forces behind the changing composition of nonprofit boards of trustees. Revisiting the data of the Six-Cities Cultures of Trusteeship Project, this note illustrates the illuminating power of conditional inference trees for analyzing data (particularly categorical data), not well served by significance testing. Applying these popular models adds depth, nuance, and increased clarity to some of the original findings from the Six-Cities research project. This empirical case serves as a how-to for future researchers hoping to more flexibly model the relative impact of institutional (and other) variables on nonprofit organization structures, as well as expand their methodological toolkit when dealing with all sorts of regression problems.
Keywords
For decades, nonprofit scholars, studying governance, have been concerned with the composition of boards as a key to understanding how/which board members span boundaries between communities, elites, and organizations. Nonprofit trusteeship research literature, seeking evidence of centralized elites (see, e.g.,: Abzug & Galaskiewicz, 2001; Yoon, 2021), the demographic democratization of governance (see, e.g.,: Bradshaw et al., 1996; Fredette & Sessler Bernstein, 2019), and/or refuting the notion that “one [board composition] size fits all” (see, e.g., Abzug & Simonoff, 2004; Hall, 1992) has proliferated over the past 50 years. Still, scholars of nonprofit governance have specifically noted limitations in dominant methodologies used to study heterogeneity within the sector and its boards of trustees (see, e.g., Cornforth, 2012).
In service to the search for methodological alternatives, this research note introduces another potential tool to the board scholar’s empirical toolbox. We first introduce and summarize the major questions and findings that came out of the original Six-Cities studies of cultures of trusteeship, highlighting the specific theoretical frameworks and analytical tools used to attain the results. Next, we introduce conditional inference (CI) tree analysis as a particularly useful tool when confronted with this kind of data. Finally, we apply CI tree analysis to several of the major questions of the Six-Cities study to shed new light on old data and pave the way for additional nonprofit institutional studies in the future. CI trees allow us to predict trustee demographic and attainment characteristics, and nonprofit board characteristics, in a way that reduces the dependence on strong parametric assumptions. Beyond our replication, we present CI trees as a potential tool for nonprofit researchers interested in a flexible, visually striking and evocative method to address “all kinds of regression problems using nominal, ordinal, numeric, censored as well as multivariate response variables and arbitrary measurement scales of the covariates” (Hothorn et al., 2006, p. 651).
Revisiting the Six-Cities Studies
Beginning in the late 1980s, a team of neo-institutionalist historians, sociologists, and management scholars at Yale University’s Program on Nonprofit Organization used the concept of cultures of trusteeship (Hall, 1992) to critically examine “one size fits all” conceptions of nonprofit governance operating in different institutional environments. To that end, subsets of the larger research group were dispatched to six cities of theoretical import and within the six cities, groups of scholars collected demographic data on trustees of fifteen nonprofit organizations (each, the largest of its subsector) at three points in time: 1931, 1961, and 1991. Historical data on trustees of the largest secular, Protestant, Catholic, and Jewish hospitals, the largest art museum, symphony orchestra, nonprofit college/university, community foundation, United Way, Junior League, YMCA, YWCA, and secular, Catholic and Jewish family service organization were collected for 1931 and 1961 while (then) contemporary data were collected in 1991. The data collection resulted in usable data on 8,926 trustees, although connecting the individual level biographical data to the larger trends in the institutional environment proved to be a methodological challenge.
Teams of researchers analyzed the data in search of evidence of time period, regional, and industry cultures of trusteeship. Findings were consistent overall although groups of researchers used different theoretical frameworks to ask varied research questions using diverse analytical methods. Ultimately, the data set was made publicly available, shifted hands, and is currently available at the Inter-university Consortium for Political and Social Research, https://www.icpsr.umich.edu/web/ICPSR/studies/35239. With the data set publicly available, we were able to revisit some of the more confounding issues with an analytical tool, relatively new to the nonprofit studies field: CI trees, revealing new insights about trusteeship over time, place, and industry.
Original Six-Cities Questions, Methods, and Findings
In 1994, Abzug posited three overarching institutionalist research questions:
Abzug (1994) established that trustee elite status decreased while demographic diversification (toward more women and people of color) increased over the study’s time period. Still, Abzug (1994, p. 220) cautioned “[b]oards do seem to follow the exigencies of their stakeholder environments over time, however, at any given point in time, local factors can account for interorganizational variation.” In an attempt to quantify this impact of “cultures of trusteeship” defined by city/region, industry/subsector, and religion/faith tradition, Abzug (1994, p. 224) used multivariate analysis which revealed the central paradox of the data: “[t]he persistence of the local (the provincial, the religious, the gendered) is a challenge to institutional theories of increasing [over time] standardization.”
A few years later, Abzug and Galaskiewicz (2001, pp. 55–56) asked whether local nonprofit boards, (a) “increased the percentage of directors with professional and managerial backgrounds and college education” and/or (b) are “dominated by particular interests or cultural identities.” To determine whether boards were “crucibles of expertise or symbols of local identities,” Abzug and Galaskiewicz (2001, p. 58) created a dispersion index to measure “the degree to which different status groups are broadly or narrowly represented on nonprofit boards at a given point in time,” computed for the demographic/ascriptive and achievement variables of interest. The researchers found that by 1991, almost all boards became less exclusive and more representative of the trustee population as a whole.
Three years later, Abzug and Simonoff (2004, p. 123) returned to the data set, de-emphasizing hypothesis testing and, instead, seeking to highlight “factors in the institutional environment that would shed light on unique and patterned structural and compositional board forms.” Abzug and Simonoff reminded readers that large data sets may yield statistically significant yet theoretically unimportant findings and that a better goal might be the search for the small set of models that best describe the data. They set about the alternative approach of using statistical information, building on pioneering work of Kullback and Leibler (1951), Akaike (1973), Hurvich and Tsai (1989) and Simonoff (2003). Using such information-theoretic measures to simplify models, Abzug and Simonoff (2004, p. 87) described and interpreted the observed patterns in the data when modeling the impact of Year, Industry, City, Religious-Base, Board Size, and all of the two-way interactions between these predictors, on the trustee demographic and achievement targets (i.e., race, gender, Ivy League attendance, etc.). Their summary of targets demonstrated that all of the chosen models included both city and industry as either a main or two-way interaction effect–providing evidence of the salience of regional and subsector institutional factors in board structure and composition. Time period was almost, but not quite, as predictive and religious base of boards was less so. Despite the clear importance of the influence of time period, geography, industry/subsector (and to some degree faith tradition), Abzug and Simonoff found that these patterns were modified by the interactions among them. However, by focusing on parametric models, this earlier study was limited to two-way interactions to preserve interpretability. Ultimately, Abzug and Simonoff (2004) summarized, [t]he patterns that we do observe, with our neo-institutional main and interaction effects, through our identification of best approximating models, give us confidence that further research in this field will unearth other valuable benchmarks in the understanding of these defining structures of nonprofit organizations. (p. 123)
It is exactly to the task of furthering this research, now armed with new models and methodologies, that we now turn.
CI Tree Analysis and Its Uses
The large 6-Cities data set, characterized by both great complexity and patterned missing data, posed a problem for parametric modeling. Indeed, most of the research using the data, as noted above, eschewed hypothesis testing, recognizing the limits of such for these data. Although the most recent analytical treatment of the data, by Abzug and Simonoff (2004), recognized the value of seeking best approximating models, what was missing from that early rendering was a way to graphically and flexibly model and describe relationships in the data. Specifically, the older models were both too simple—limited to two-way (as opposed to three-way, or even higher-order) interactions—and too complex. Indeed, including the full interactions, corresponding to different response patterns related to all values of one predictor over all values of another predictor, rather than just the values of each predictor actually exhibiting patterns consistent with an interaction, made intuition less clear. Attempting to directly address that lacuna, we draw from the pioneering work of Hothorn et al. (2006). Specifically, we are encouraged by Hothorn et al.’s (2006, p. 651) unified framework for recursive partitioning, embedding “tree-structured regression models into a well-defined theory of conditional inference procedures.” Chatterjee and Simonoff (2020) explain that when assumptions underlying regression (such as linear relationships, or even smooth curves or surfaces) might not hold, more flexibility is needed. They suggest the use of methods designed to segment the predictor space, and add that “[t]hrough the use of simple segmenting rules, these methods provide a nonparametric way of representing a regression relationship. If the rules are based on repeatedly partitioning the predictor space, the resulting estimate takes the form of an easily-interpretable tree.” (Chatterjee & Simonoff, 2020, p. 314). Indeed, such treatments can be used to bridge the methodological gap between the Abzug and Galaskiewicz (2001) clustering graphics and the Abzug and Simonoff (2004) text-heavy information-theoretic approach to model selection.
We provide here a brief description of tree modeling; further details can be found in Chapter 16 of Chatterjee and Simonoff (2020). Tree methods are based on recursive partitioning, in which the predictor space is repeatedly split based on the value of a predictor. Building a tree then comes down to two issues at each step: choosing the variable on which to split (the splitting variable) or choosing not to split at all, and determining the value at which the variable will be split (the split point). Numerical and ordinal predictors are split at a single split point (the two subgroups corresponding to observations with values less than or equal to or greater than the split point, respectively), while nominal categorical predictors are split into two mutually exclusive sets of predictor values. This results in a binary tree, with parent nodes being split into two child nodes. The goal in building a tree is to split the data so that the child nodes are more homogeneous than was the parent node, guarding against splitting too little (underfitting) or too much (overfitting).
Different tree methods use different criteria to determine the splitting variables and split points and control the complexity of the fitted tree. Consider the situation of a numerical response that can be viewed as having roughly normally distributed errors. The earliest approach to constructing a tree was to search over all possible predictors and all possible split points to find the one that minimizes an impurity measure of the resultant tree. Such an impurity measure would be sum of squares:
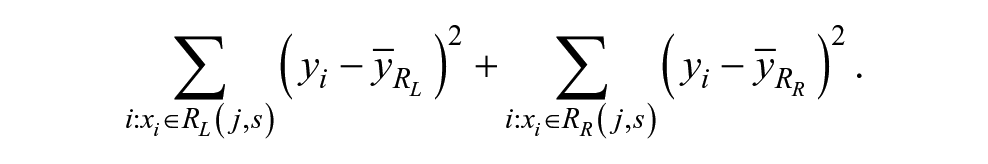
Here, the notation
The CI tree approach of Hothorn et al. (2006) separates the choices of splitting variable and split point. This avoids a problem with the CART-based approach, which is known to have a tendency to bias toward splitting on variables with more possible split points (splitting variable selection bias). This can be achieved by first determining if a global independence null hypothesis can be rejected (i.e., the hypothesis that the response is unrelated to all potential split variables). If it can be rejected, the split variable is chosen based on a measure of association with the response, and the split point is chosen in the usual way using sum of squares; if it cannot be rejected, splitting at that node stops. Note that this avoids the need to overfit the tree and then prune it back.
The CI approach measures the association between the response and the splitting variables using statistics of the form
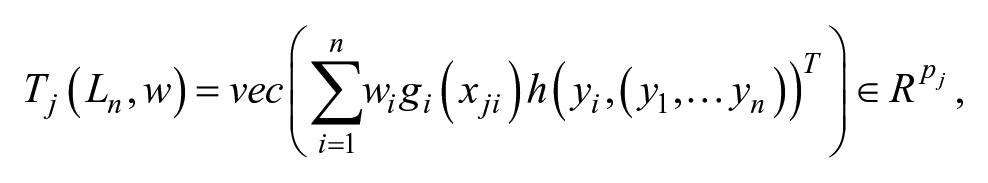
where
The decision to split a node on any variable or not is made using the statistics Tj in a hypothesis test, which requires the distribution of these statistics under the null hypothesis of no association. This is done by fixing the covariates and conditioning on all possible permutations of responses, resulting in a nonparametric permutation test. The global hypothesis test combines the individual ones, taking into account the multiple tests being made (one for each covariate), producing an overall p-value for the test of a lack of association between the response and any covariate. If it is below a prespecified level (by default
The regression tree takes as the fitted response for a particular set of predictor values, the appropriate summary response (based on the nature of the response) for all observations in the terminal node in which that set of values falls. For normally-distributed errors, this is the sample mean, and the tree then provides a flexible nonparametric alternative to linear least squares regression. Other distributional families are possible in extensions of the CI tree concept; for example, one example in the next section is based on a count variable, and the response is, therefore, modeled as Poisson distributed, even allowing for overdispersion, with the fitted response again being the sample mean. If the response is categorical, the algorithm results in a classification tree, with the fitted response either being the most probable outcome in that terminal node, based on the observed proportion of each possible outcome of the response variable (if classification is the goal), or the set of observed proportions themselves (if probability estimation is the goal); this provides a flexible nonparametric alternative to binomial or multinomial logistic regression. Note that it is not possible to construct these trees by hand; software to do so is necessary. This is discussed further in the appendix.
In addition to the flexibility and interpretability of trees noted earlier, they have several other useful properties. They automatically implement variable selection, scaling up easily to data sets with many predictors. They are also extremely effective at uncovering interactions, revealing the structure of the interaction through which values of the variable being split fall into one branch or the other of the tree.
This is particularly apparent for categorical variables, such as City, Industry, and Year in the 6-Cities data, as a tree automatically groups different levels of a categorical variable together, or splits them apart if the tree includes splitting on that variable. For the 6-Cities data, this allows a much more nuanced view of how local effects of, for example, city and industry differ or are similar across different cities and industries, for different years, based on how the city, industry, or year variable splits in a tree. Trees are designed to uncover combinations of predictor values associated with homogeneous responses within the combination and heterogeneous responses across them, making it easy to see which cities or industries are similar to each other over which time periods, and which differ.
New Findings
In this section, we illustrate the application of CI trees to the 6-Cities data set. All trees are constructed and graphed using the partykit package (Hothorn & Zeileis, 2015) and the statistical language R (R Core Team, 2020). Each of the trees presented here is based on the default splitting rules, which typically perform well from a predictive point of view. Note, however, that the complexity of the tree can be controlled in various ways; if the interest is in describing the broad underlying patterns, an analyst can opt to report simpler trees for some of the response variables, for example. To demonstrate the flexibility and interpretability of CI tree modeling for complex data sets, we revisit four different target variables of the 6-Cities data set as reported by Abzug and Simonoff (2004). Visiting these same relationships with CI tree modeling—whether our targets are categorical or numerical—allows us to graphically depict representations of flexible data-driven subgroups of trustees defined by interactions among predictors. Thus, we are able to graphically display much more nuance of the institutional environment upon the trustee characteristic in the population and can more clearly see the drivers of the observed patterns. The results for these four response variables demonstrate the kind of insights that are possible from construction and examination of trees.
We begin where Abzug and Simonoff (2004) began: Asking what is the model of institutional forces predicting race of a trustee? Abzug and Simonoff (2004) concluded that the best model predicting the likelihood that a trustee of the population was Black, would be one including Year, Industry (of board), and an interaction between City and Religious-Base of Institution (CR Y I). In following the analyses presented by Abzug and Simonoff (2004), we treat each of the boards as if they are independent of each other, ignoring that in some cases the same nonprofit is represented in different years. We do this for two reasons: (a) accounting for that longitudinal nature would make the analysis more complicated (although, in fact, Fu & Simonoff, 2015, describe a generalization of CI trees to longitudinal data) and (b) given that the boards for the same nonprofit are separated by 30 years, it is not unreasonable to think that any correlations would not be that strong. A CI classification tree of the likelihood that a trustee in the 6-Cities data set is Black is presented in Figure 1.
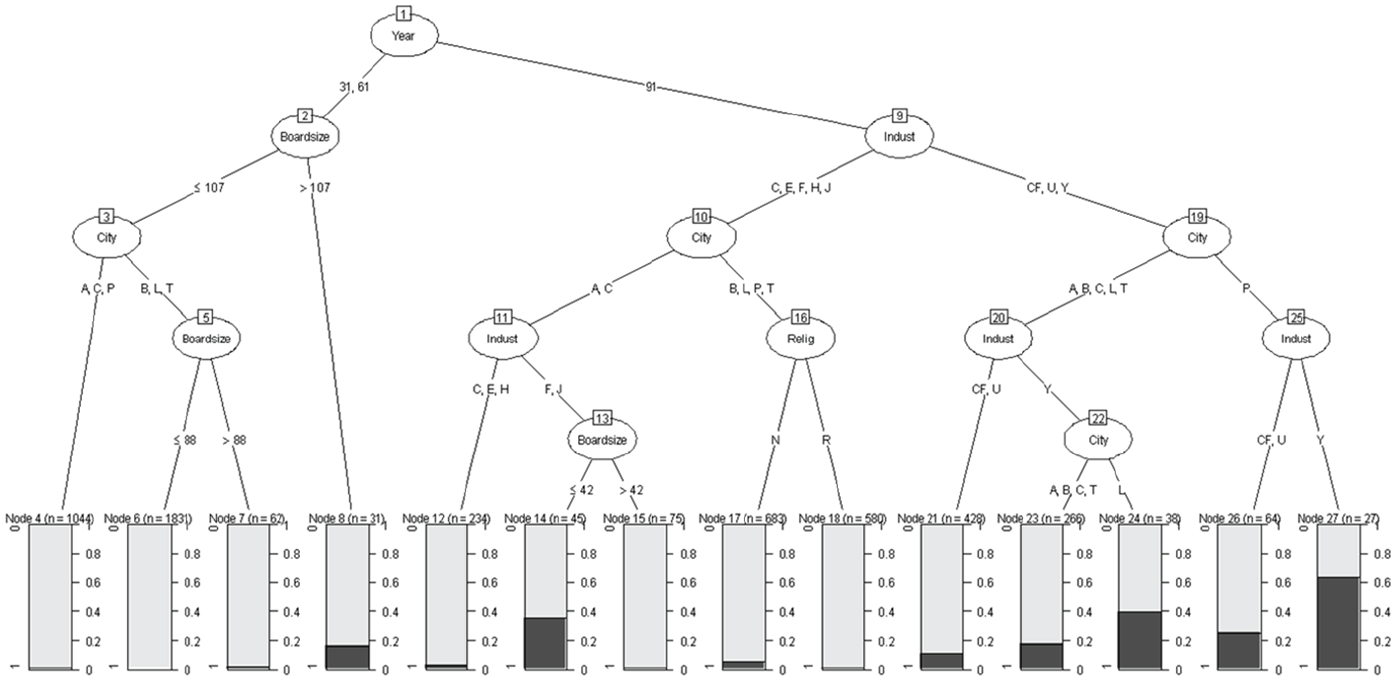
The classification tree (the analogue of logistic regression) for whether a trustee is BLACK.
The way to interpret Figure 1 is that in the plots at the bottom (the so-called terminal nodes), the dark bar represents the proportion of the board that is Black, the oval-shaped curves represent a variable that is split, and the two branches below an oval describe how the variable was split. Thus, the first variable that splits the data is Year, separating 1991 boards (the 10 rightmost terminal nodes in the plot, numbered 12, 14, 15, 17, 18, 21, 23, 24, 26, and 27) from 1931 and 1961 boards (the four leftmost terminal nodes, numbered 4, 6, 7, and 8). It is evident that 1931 and 1961 boards had virtually no Black representation, except for very large boards (more than 107 members, where it was a bit less than 20%).
Recall that the model chosen in Abzug and Simonoff (2004) did not include interactions involving either Year or Industry, implying that those effects are estimated to be the same across all cities and religious groups. The tree implies a much more nuanced story, focusing on 1991. It is complex, but we can still see patterns. Industry is most important, as there is relatively little Black representation in Culture, Educational, Family Services, Health, and Junior League boards, but much higher representation in Community foundation, United Way, and especially Y boards. From just this one picture, we get a much more refined, detailed, and intuitive understanding of how to represent racial diversity in elite nonprofit boards over time. Year and industry are still important predictors, but this visually-rich analysis shows us directly which years and which industries are driving our results, and we also see, graphically, where the most predictively important split takes place. The tree also allows the analyst to drill down to a more granular level for the 1991 boards, identifying interactions involving industry, city, and board size. This highlights both the efficiencies and the flexibility that trees can provide. The tree shows that the three-level Year variable really is a two-level variable for this response (1931/1961 and 1991), implying a summarized simpler relationship than the general Year main effect in the parametric model, while also pointing to different estimated Black membership patterns by city and industry in 1991, which would require a three-way interaction effect to represent in the parametric model (that is, the model fit in Abzug and Simonoff, 2004, cannot uncover this pattern). The parametric model highlighted higher Black membership in Youth boards in general (as a main effect), but the tree highlights that this is actually concentrated in 1991 Youth boards in Los Angeles (Node 24) and Philadelphia (Node 27). Note also that the parametric model pointed to an effect of Religious status on the likelihood of a trustee being Black (differing by city), but the tree does not provide any evidence of the need for Religious status in the model fitting.
What the trees specifically add to our understanding of trusteeship is a highly visual depiction of how the pressure of institutional forces (of city/place, industry/field, and year/era) is unevenly applied. We have gained the complexity of three-way interactions while actually optimizing interpretability and intuition. We have a more nuanced and complete picture of how the institutional pressure of, for instance, year/era separates more substantively into pre and post 1991 eras (rather than three different eras for 3 different years), and how the institutional forces of city/place and industry/fieldwork within these two subgroups of year in explaining race in boards of trustees. That the trees pointed us to greater Black trustee presence in the boards of youth organizations in Los Angeles and Philadelphia in the 1991 timeframe might lead us to better understand how institutional pressures (i.e., time periods characterized by greater agitation for civil rights, say) may have differential local effects. The trees unearth specific multi-order interactions that suggest the local limitations of the grand theories, and suggest areas for further investigation.
The 6-Cities researchers were also interested in patterns of trustee traditional elitism. Figure 2 provides the tree for whether trustees attended an Ivy League educational institution, given they attended college.
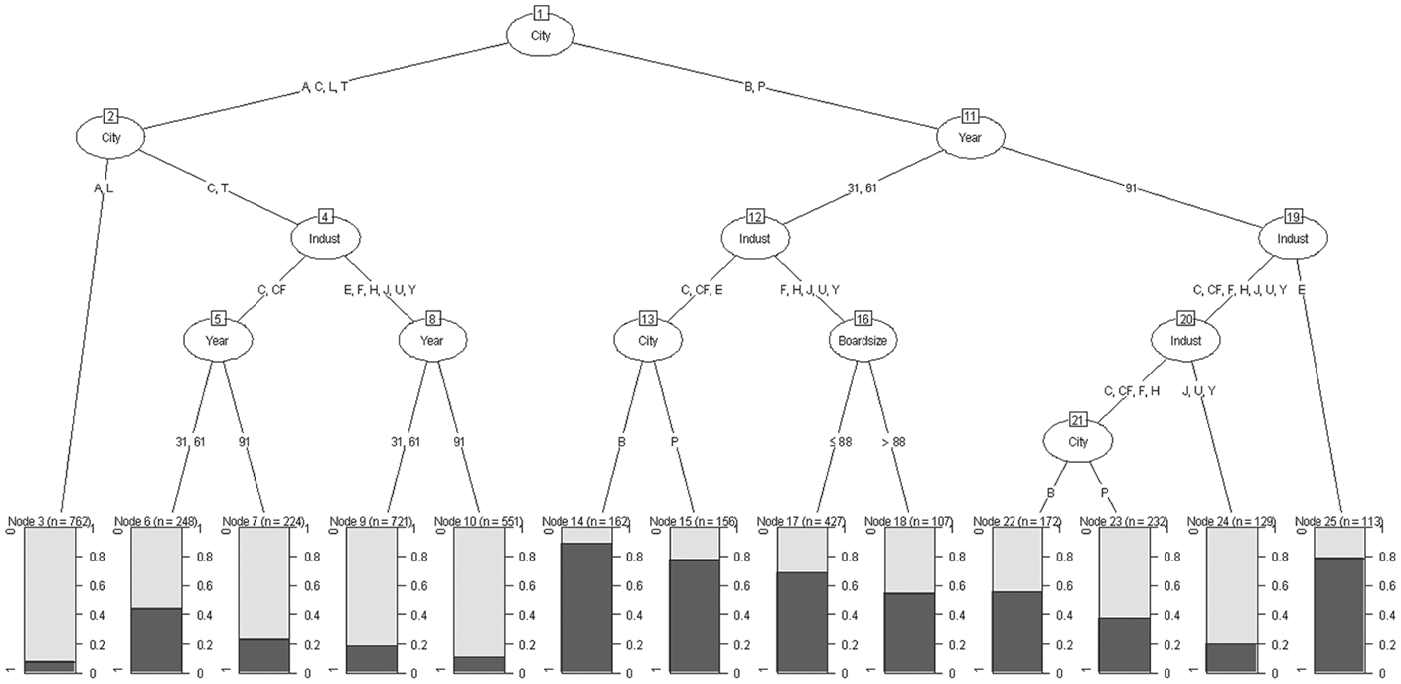
The classification tree (the analogue of logistic regression) for whether a trustee attended an IVY LEAGUE institution.
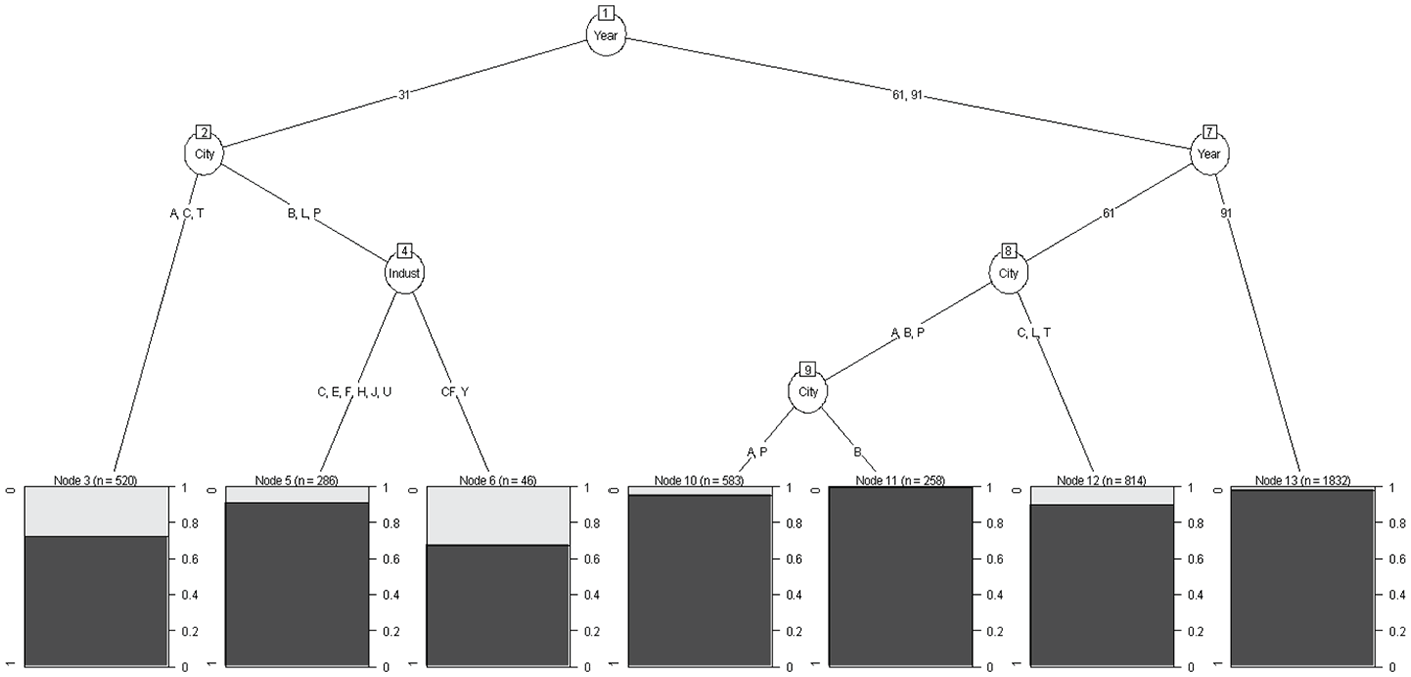
Unsurprisingly, Figure 2 shows that City is the most important effect on Ivy League institution attendance, with the right split at the top corresponding to Boston and Philadelphia (the homes of two Ivy League schools) having far higher Ivy League attendance rates than the left split of the other cities. In those two cities, attendance was higher in 1931 and 1961, and higher in the Culture, Community foundation, and Education industries. It is still high in those two cities in 1991 in Education, but less so in the other industries (particularly Junior League, United Way, and Ys). Ivy League attendance is very low in Atlanta and Los Angeles, irrespective of any other factors. In Cleveland and the Twin Cities, it is higher in 1931 and 1961, and higher in Culture and Community foundation industries. Interestingly, it is not higher in Education nonprofits in the non-Ivy League cities compared with other industries, corresponding to a three-way CIY interaction. One could speculate that educational institutions in cities without Ivy League institutions might avoid the supposed elite status of Ivy League institutions in favor of “elite” institutions closer to home, such as Emory University in Atlanta, University of Southern California or Cal Tech in Los Angeles, and Case Western Reserve in Cleveland. Once again, then, we see how the trees allow us to break down both city/region and industry/field forces into specific interpretable interactions. The preferred parametric model in Abzug and Simonoff (2004) included the main effect of Religious affiliation (R), and the two-way interactions of City and Year (CY) and Industry and Board size (IB). The tree once again does not find evidence for a Religious affiliation effect. The CY effect in the parametric model implies different Ivy League attendance patterns for the 18 combinations of year and city, but the tree implies both a simpler pattern (no interactions at all for boards in Atlanta and Los Angeles) and a more complex one (the City by Industry by Year interaction noted above in Cleveland and the Twin Cities, reflecting higher Ivy League attendance in those cities in 1931 and 1961 for the Cultural and Community Foundation industries). The tree supports the importance of the year effect in Boston and Philadelphia (a CY effect), with generally lower Ivy League attendance in 1991, but also splits on City, Industry, and Board size within those cities, patterns that would require a four-way interaction to duplicate in a parametric model.
The difference in the pattern for any college attendance (as opposed to “elite” Ivy League attendance) is strikingly evident in Figure 3, and the implied relationship is in many ways simpler than the full (CY, I, YB) parametric model supported in Abzug and Simonoff (2004), starting with the lack of any evidence of a Board size effect.
The classification tree (the analogue of logistic regression) for whether a trustee attended (any) COLLEGE.
We see a generally extremely high percentage of college experience, with almost 100% of trustees attending some college in 1961 to 1991. The figure implies that almost all boards are indistinguishable from a practical point of view in terms of college attendance, except for small pockets of lower attendance, corresponding to lower percentages of college attendance in Atlanta, Cleveland and the Twin Cities and lower attendance in Community Foundations and Ys in Boston, Los Angeles, and Philadelphia. These are two- (CY) and three- (CIY) way interaction effects, but ones that are limited to small subsets of boards, in contrast to the implications of the parametric model that apply to all of the combinations of city, year, and industry. The extremely high proportions of college attendees in 1961 and 1991 reflect the dramatic increase in college attendance in the population as a whole after World War II, which was likely jumpstarted by the effects of the G.I. Bill for mostly male veterans, and the introduction of women into the workforce during the war, and has continued into the 21st century.
Our final example is an analysis of a board structural (as opposed to compositional) variable—that of board size. This response is a count variable, and was analyzed in Abzug and Simonoff (2004) using Poisson regression, allowing for extra-Poisson overdispersion. CI trees can also be constructed assuming (extra-)Poisson variation, and that is what was done here, yielding the regression tree depicted in Figure 4.
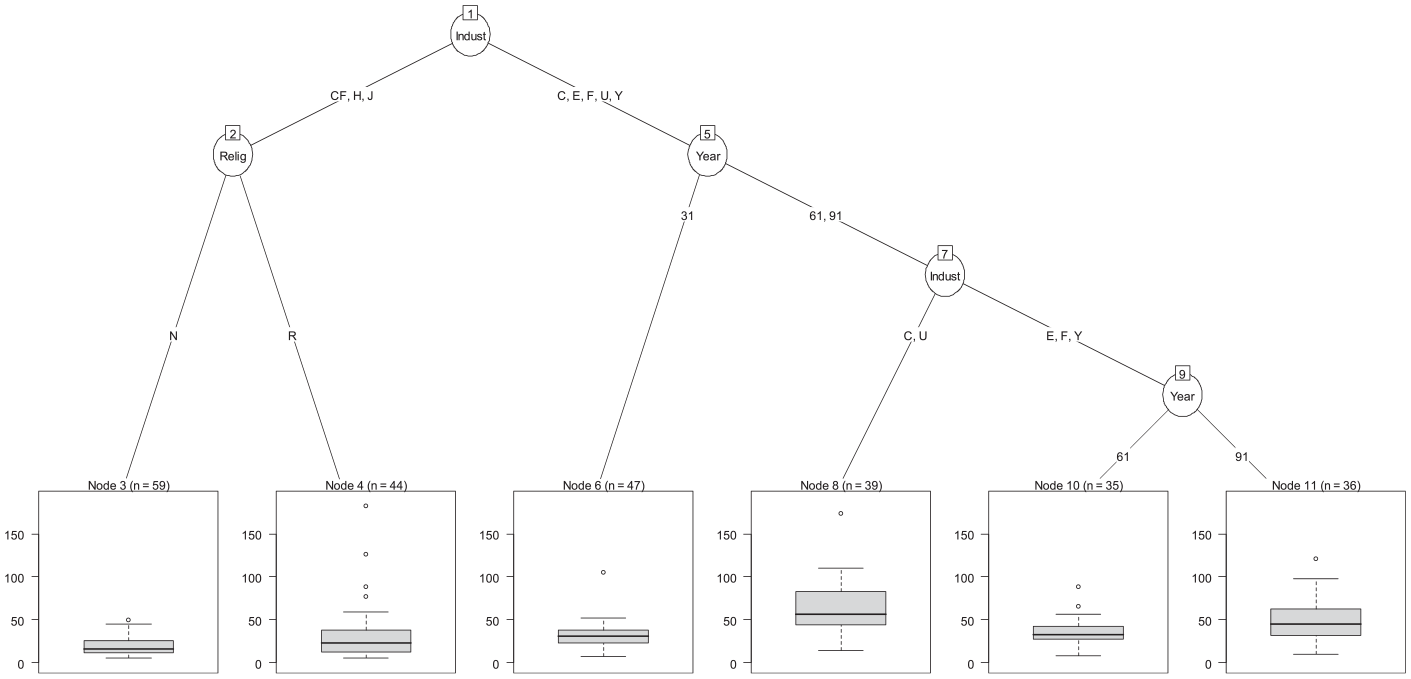
The regression tree (the analogue of Poisson regression, allowing for overdispersion) for BOARD SIZE.
The tree emphasizes the importance of industry, as Community Foundation, Health, and Junior League boards are smaller, with nonreligious boards being the smallest on average. In the other industries, boards were generally larger in 1991, in contrast to 1931 and 1961, where industry mattered such that boards for Culture and United Ways were larger than the others. It is interesting to see that city does not enter the tree as a splitting variable at all, in marked contrast to it appearing in two interactions (with religious status and with industry) in the parametric modeling of Abzug and Simonoff (2004), who suggest the model (CI, CR, YI). This results in considerable simplification of the implications of the modeling, as the tree focuses on the third interaction in that model, that of year and industry, as being of the most practical importance.
Conclusion
Revisiting a benchmarking data set with contemporary analytical tools has allowed us to shed new, nuanced light on important questions in the study of nonprofit trusteeship. Although replicating the finding that board structure and composition follows the institutionalizing forces of change over time, and industry and regional/city cultures of trusteeship, we are able to more hierarchically (graphically) order the importance of these forces on the different target variables. We are also able to drill down more deeply into the data to reveal multi-order interactions that break down into more locally differentiated explanatory factors. Time period differences are most pronounced for trustee race and (any) college attendance, but it is the split after 1961 that is most influential for race while it is the split after 1931 that is most predictive for (any) college attendance. City effects are most pronounced for Ivy League attendance (not surprising, as we compare Boston and Philadelphia—each home to an Ivy League institution—with four other cities that are not home to an Ivy League institution), while industry effects differing over years are most predictive for the board size structural variable. Yet, beyond helpfully hierarchically ordering the main effects, the CI trees also help us make sense of multi-order interaction effects which provide a corrective to the grand generalizing of theories such as institutionalism. The trees show us where institutional forces are most pronounced in their effects, and where they are less so. The graphical nature of CI tree analysis enables us to see how a picture can be worth a thousand words. As such, we have high hopes for the adoption of tools such as CI classification and regression tree modeling for complex nonprofit organizational data sets and research questions. Future work using these methodologies, revisiting large, iconic data sets, and further exploring nonprofit board structure and composition will be welcome.
Footnotes
Appendix
Although many statistical packages can construct and graph trees, conditional inference trees can be constructed using the partykit package in R. Details on the R package can be found at https://www.r-project.org/, and the package can be downloaded through the Comprehensive R Archive Network (CRAN) described at https://cran.r-project.org/mirrors.html. The data used in this article, and code to produce the figures, are available at https://people.stern.nyu.edu/jss2/NonprofitTrusteeship/trees/
Authors’ Note
We thank the reviewers for providing their insight and advice throughout this process.
Data Availability Statement
The data upon which the findings reported in this article are based are available at the Inter-university Consortium for Political and Social Research, https://www.icpsr.umich.edu/web/ICPSR/studies/35239, and specific data and code availability are detailed in the ![]() .
.
Declaration of Conflicting Interests
The author(s) declared no potential conflicts of interest with respect to the research, authorship, and/or publication of this article.
Funding
The author(s) received no financial support for the research, authorship, and/or publication of this article.