
Abstract
Some microfinance institutions (MFIs) can drift from their social mission, generating well-studied effects for their borrowers. We focus on the lesser-known effect of mission drift on the financial return to other stakeholders (employees, government, micro-savers, and banking creditors). Using a sample of 534 MFIs, we calculated the economic value distributed by the MFI to these stakeholders by considering salaries, taxes, and interest paid. We found a negative relationship between average loan size and return to employees (RTE), government, and banking creditors, and a positive relationship between women borrowers and RTE and government. This is explained by the fact that mission-focused MFIs are usually small, labor-intensive institutions with a stable business model. We found a positive relationship between average loan size and return to micro-savers, and a negative relationship between women borrowers and return to micro-savers. The reason is that many mission-focused MFIs do not offer micro-savings, undermining financial inclusion.
Mission drift is a popular research topic with respect to non-profit organizations (Irvin & Kavvas, 2020; Jones, 2007) and, in particular, microfinance institutions (MFIs) (Beisland et al., 2019). The need for many MFIs to generate profit often leads these institutions to lose sight of their social mission under the influence of for-profit funders (Mia & Lee, 2017) and loan officers (Beisland et al., 2019). The consequences of mission drift for borrowers and MFI reputation have been extensively studied. Mission drift usually reduces outreach (Pedrini & Ferri, 2016) and can be detrimental to the poorest clients (Fouillet & Augsburg, 2010), harmful to women (Frank et al., 2008), and disappointing to donors and social investors (Grimes et al., 2019). However, the effects of mission drift on other stakeholders (employees, government, micro-savers, and banking creditors) have been insufficiently studied, a gap that this article seeks to address. Our article first calculates the economic value that MFIs distribute to each stakeholder. Second, we study the relationship between mission drift and the financial returns to stakeholders.
We propose a model to explain the effect of microfinance mission drift on stakeholder financial returns. Our conceptual framework is stakeholder theory, but organizational ecology theory (Hannan & Freeman, 1984) and social capital theory (Coleman, 1988) provide arguments for the hypotheses. Many papers study the effect of mission drift on borrowers and donors (Armendáriz & Szafarz, 2011; Beisland et al., 2019; Hermes et al., 2011; Pedrini & Ferri, 2016). Our article contributes to these strands of literature by relating mission drift to stakeholders, such as employees, the government, depositors, and banking creditors. We tested the model through an empirical study using a panel data sample of 534 MFIs from 80 countries. We used the average loan size and the percentage of female borrowers as proxies for mission drift (D’Espallier et al., 2017; Mersland & Strøm, 2010; Quayes, 2021). We provide new insights into the effect of mission drift on employees, government, micro-savers, and banking creditors.
There are many ways to study MFI performance, whether it is financial performance (Consultative Group to Assist the Poorest [CGAP], 2003), social performance (Schreiner, 2002), or impact (Banerjee et al., 2015). We apply the idea proposed in the guidelines of the Global Reporting Initiative (GRI, 2016) and measure the economic value that an organization distributes among its stakeholders. The concept of distributed economic value is a similar idea to surplus distribution, which has already been applied in microfinance (Hudon & Périlleux, 2014; Périlleux et al., 2012). The approach followed and the indicators used can help organizations to implement the management-for-stakeholders approach.
Literature Review and Hypotheses Development
Explanatory Theories of Mission Drift
Mission-focused MFIs target the poorest members of society, especially women and rural populations, but some MFIs have been accused of failing to serve those most in need. The debate on the magnitude of the mission drift problem in microfinance is not yet closed. There is evidence of institutions that have abandoned their mission (Beisland et al., 2019; D’Espallier et al., 2017), but it is doubtful that the problem affects the industry as a whole (Mersland et al., 2019; Quayes, 2021).
Many theories try to explain the reason why MFIs deviate from their mission. The high transaction costs involved in making small loans is the most commonly accepted explanation, but it is not the only motivation (Armendáriz & Szafarz, 2011). Resource dependence theory states that organizations must find the means to access key resources to survive (Froelich, 1999), including physical, human, and organizational resources (Barney, 1991). Therefore, some MFIs do not want to rely exclusively on poor borrowers and diversify their clientele. Teleological theory assumes that every organization has a purpose, which is the ultimate goal guiding the movement of the entity (Van de Ven & Poole, 1995). This may explain the reason why some MFIs become bankable and expand their mission, although this does not always mean abandoning the poor (Armendáriz & Szafarz, 2011). Indeed, loans often increase in size simply because some clients are no longer poor and therefore demand larger loans than before. Serving these clients is simply a strategy to achieve the MFI’s laudable end goal. Life cycle theory explains that MFIs change their original mission as they evolve from the birth phase to maturity because of the desire for growth (Hoque et al., 2011). The for-profit or non-profit status of an institution also matters, and MFIs that follow the social welfare logic strive to maintain their social mission (Im & Sun, 2015).
Some deviations from the mission can be explained by internal stakeholders, such as employees; others can be explained by external stakeholders, such as funders; and still others can be explained by the environment, such as changes in legislation (Minkoff & Powell, 2006). Dialectical theory proposes that an alteration of the status quo between different power groups triggers changes in organizations (Van de Ven & Poole, 1995) and may explain why MFI employees, such as loan officers, sometimes generate the actual deviation of a well-intentioned MFI (Beisland et al., 2019). Regulations that increase MFI requirements (e.g., capping maximum interest rates) may result in the MFI leaving its traditional clientele (Hudon, 2011).
Explanatory Theories of Return to Stakeholders
Stakeholder theory is a theory of organizational management and ethics that explicitly addresses morals and values as a central feature of the management of organizations (Phillips et al., 2003). The theory states that management should create value, not only for shareholders but also for the remaining stakeholders (E. Freeman, 1984). The return to stakeholders may be affected by internal factors (e.g., the for-profit or non-profit status of the MFI) and by external factors (e.g., the country where the MFI operates). Im and Sun (2015) distinguished between MFIs that follow the social welfare logic and those that follow the commercial logic and found that the former made every effort to expand outreach to the poor by making small loans, while the latter were more likely to seek high profitability. The for-profit or non-profit status of the MFI guides management decisions, affects the MFI’s performance, and may justify differences in financial returns to stakeholders.
The theory of social capital provides arguments that justify the effect of country characteristics on the return to stakeholders. Social capital is generated through networks of relationships, reciprocity, and social norms (Coleman, 1988). Its determinants include social trust, group membership, country fractionalization, income inequality, educational level, and personal income (Alesina & Zhuravskaya, 2011; Christoforou, 2011). There is strong evidence that the social capital of a country can have a positive impact on the performance of the companies operating in that country because societies with a high level of social capital create a favorable business climate (Westlund & Adam, 2010). Chmelíková et al. (2019) found a positive relationship between social capital intensity and MFI performance as measured by profitability, repayment, efficiency, and outreach. Microfinance succeeds in societies conducive to the development of social capital (Postelnicu & Hermes, 2018) because the threat of social sanctions in the case of late repayment is not very credible in fragmented societies, which increases credit risk and discourages lending to the poor. The social capital of the country in which the MFI operates may affect the MFI’s performance and explain differences in the financial return to stakeholders.
Hypotheses Development
Our first hypothesis concerns the financial return to employees (RTE). Transaction cost theories may justify the relationship between mission drift and financial RTE. The transaction costs of an MFI include the costs to search and gather information; negotiate and decide; manage, process, deliver, and administer credit; and monitor and enforce borrower compliance (Armendáriz & Szafarz, 2011). Prior studies indicate that the business model of mission-focused MFIs, which generally includes in its mission lending to the poorest and women (Mersland et al., 2019), is more labor-intensive than that of mission-drifted MFIs (Serrano-Cinca & Gutiérrez-Nieto, 2014). Then, the benefits of maintaining its mission can be extended to employees by generating local employment. Loans for just a few dollars require many loan officers to be employed to grant microcredits that have to be entered into a computerized system to be analyzed and monitored, sometimes with on-site visits. Consequently, these institutions have to employ a large workforce to grant small loans (Serrano-Cinca & Gutiérrez-Nieto, 2014). These MFIs are usually small non-profit institutions (D’Espallier et al., 2017). We must also bear in mind that employee expenses depend not only on the number of employees but also on their salaries, so that, MFIs that pay on average high salaries are expected to make the highest contributions to employees.
However, the efficient use of information and communication technologies can break the strong expected association between mission-focused MFIs and employment. Peer-to-peer lending platforms automate as much as possible the management of loans. Some of these platforms offer microcredits, but they are still a minority and do not reflect the reality of the current microfinance industry. Based on the above discussion, our first hypothesis is:
Our second hypothesis concerns the financial return to government (RTG). MFIs contribute to governments by paying taxes, which directly and indirectly contribute to society as a whole, because taxes pay for public spending and the welfare state. The amount of fees and taxes received by the government should be reduced by the amount of subsidies and grants provided by the government to correctly calculate the contribution to government (McLeay, 1983). The financial RTG depends on the profit made by the MFI, the tax rate, and the practices the institution can put in place to avoid the payment of taxes.
Many empirical studies have found no difference between the profitability of mission-focused MFIs that make small loans and MFIs that make larger loans (Serrano-Cinca & Gutiérrez-Nieto, 2014). MFIs that make small loans have high operating costs, but these can be offset by the high interest rates paid by clients. In regard to the percentage of loans to women, some empirical studies have found that women tend to pay higher interest rates than men, although women pose no more risk than men (Alesina et al., 2013; Bellucci et al., 2010). The cause of these high interest rates may be that female entrepreneurs face tighter credit availability (Bellucci et al., 2010). Mission-focused entities retain a high loan portfolio yield to survive, but many of them are not self-sustainable (Hudon et al., 2018). However, these mission-focused MFIs have greater access to donations than those that have drifted their mission, thus maintaining the level of profits.
Organizational ecology theory states that structural inertia causes organizations to remain as they are (Hannan & Freeman, 1984). However, organizations can suffer from stress, which is usually caused by dissatisfaction with their performance and indicates the need to renew (Huff et al., 1992). According to the stress inertia theory, organizations change when the accumulation of stress exceeds structural inertia (Jas & Skelcher, 2005). Therefore, if an MFI drifts from its mission, it may be because it is not performing well and is trying a new strategy. When an organization changes its goals, its performance usually worsens and it achieves less profit than before because of the confusion generated by the change (Naranjo-Gil et al., 2008). This leads to decreased performance, which can provoke some talented employees to leave the MFI and can lead some donors to stop their support of the organization. This would explain why mission drift often leads to low profits.
The optimization of tax savings requires significant economic and legal resources, which explains the negative relationship between company size and effective tax rates (Lanis & Richardson, 2015). This provides the justification for mission-focused MFIs, which are usually small-sized institutions, not engaging in tax optimization practices. However, mission drift affects non-profit MFIs more than for-profit ones (Serrano-Cinca & Gutiérrez-Nieto, 2014), and some countries have special transaction-tax allowances for non-profits (CGAP, 2012). This argument favors a negative relationship between the focus on mission and the financial RTG, but we do not believe it outweighs the negative effects associated with mission drift. Based on the above discussion, our second hypothesis is:
Our third hypothesis refers to the financial return distributed by the MFI to depositors and banking creditors through interest payments. The higher the indebtedness and the interest rates are, the greater the contribution to the creditors will be. The pecking order theory describes a manager’s preferences in financing due to information asymmetry, which increases the cost of financing (Donaldson, 1961; Myers & Majluf, 1984). Donaldson (1961) argued that companies should first prefer internal funds, then external funds, and of these, debt should be preferred to equity. For MFIs, the hierarchy starts with internal financing from retained earnings, followed by subsidies and donations, deposits, bank debt, and, as the last resort, a request for equity from their shareholders and the capital markets.
Although the hierarchy remains, not all options are available to some kinds of MFIs. For example, not all MFIs can receive donations, collect deposits, or access the capital markets. It is unfeasible for micro-savers to monitor banks; therefore, the financial sector is highly regulated, as justified by the public and private interest regulation theories (Goodhart et al., 2013). Deposits are a cheaper source of funding than funds borrowed from banks, but unregulated MFIs cannot take deposits and have to borrow funds from banks. Many mission-focused entities are small unregulated MFIs (D’Espallier et al., 2017), and obviously, if deposits cannot be taken, the returns to depositors are zero. We expect mission-focused MFIs to generate lower financial returns for depositors than mission-drifted MFIs. By contrast, the typical pattern of a drifted MFI is a large for-profit institution (Serrano-Cinca & Gutiérrez-Nieto, 2014). Drifted MFIs receive fewer donations than focused ones (Serrano-Cinca & Gutiérrez-Nieto, 2014). The higher the percentage of donor funding, the less interest the MFI will pay, which argues in favor of a negative relationship between mission-focused MFIs and interest payments to banking creditors. Based on the above discussion, our third hypothesis is:
Empirical Study
Dependent Variables
Table 1 shows the variables used and their definitions. First, we calculated the economic value that each stakeholder received, that is, personnel expenses for employees, taxes for governments, banking interest for banking creditors, and deposits for depositors. Given that the largest MFIs contribute the most in salaries, taxes, and interest, we opted to scale contributions to control for size effects by dividing the economic value that each stakeholder received by the total assets. We calculated financial ratios, which is a standard approach to assessing the performance of an organization. The dependent variables are the returns to each of the four stakeholders analyzed—that is, financial RTE, financial RTG, financial return to depositors (RTD), and financial RTB.
Variables Employed and Their Definitions.
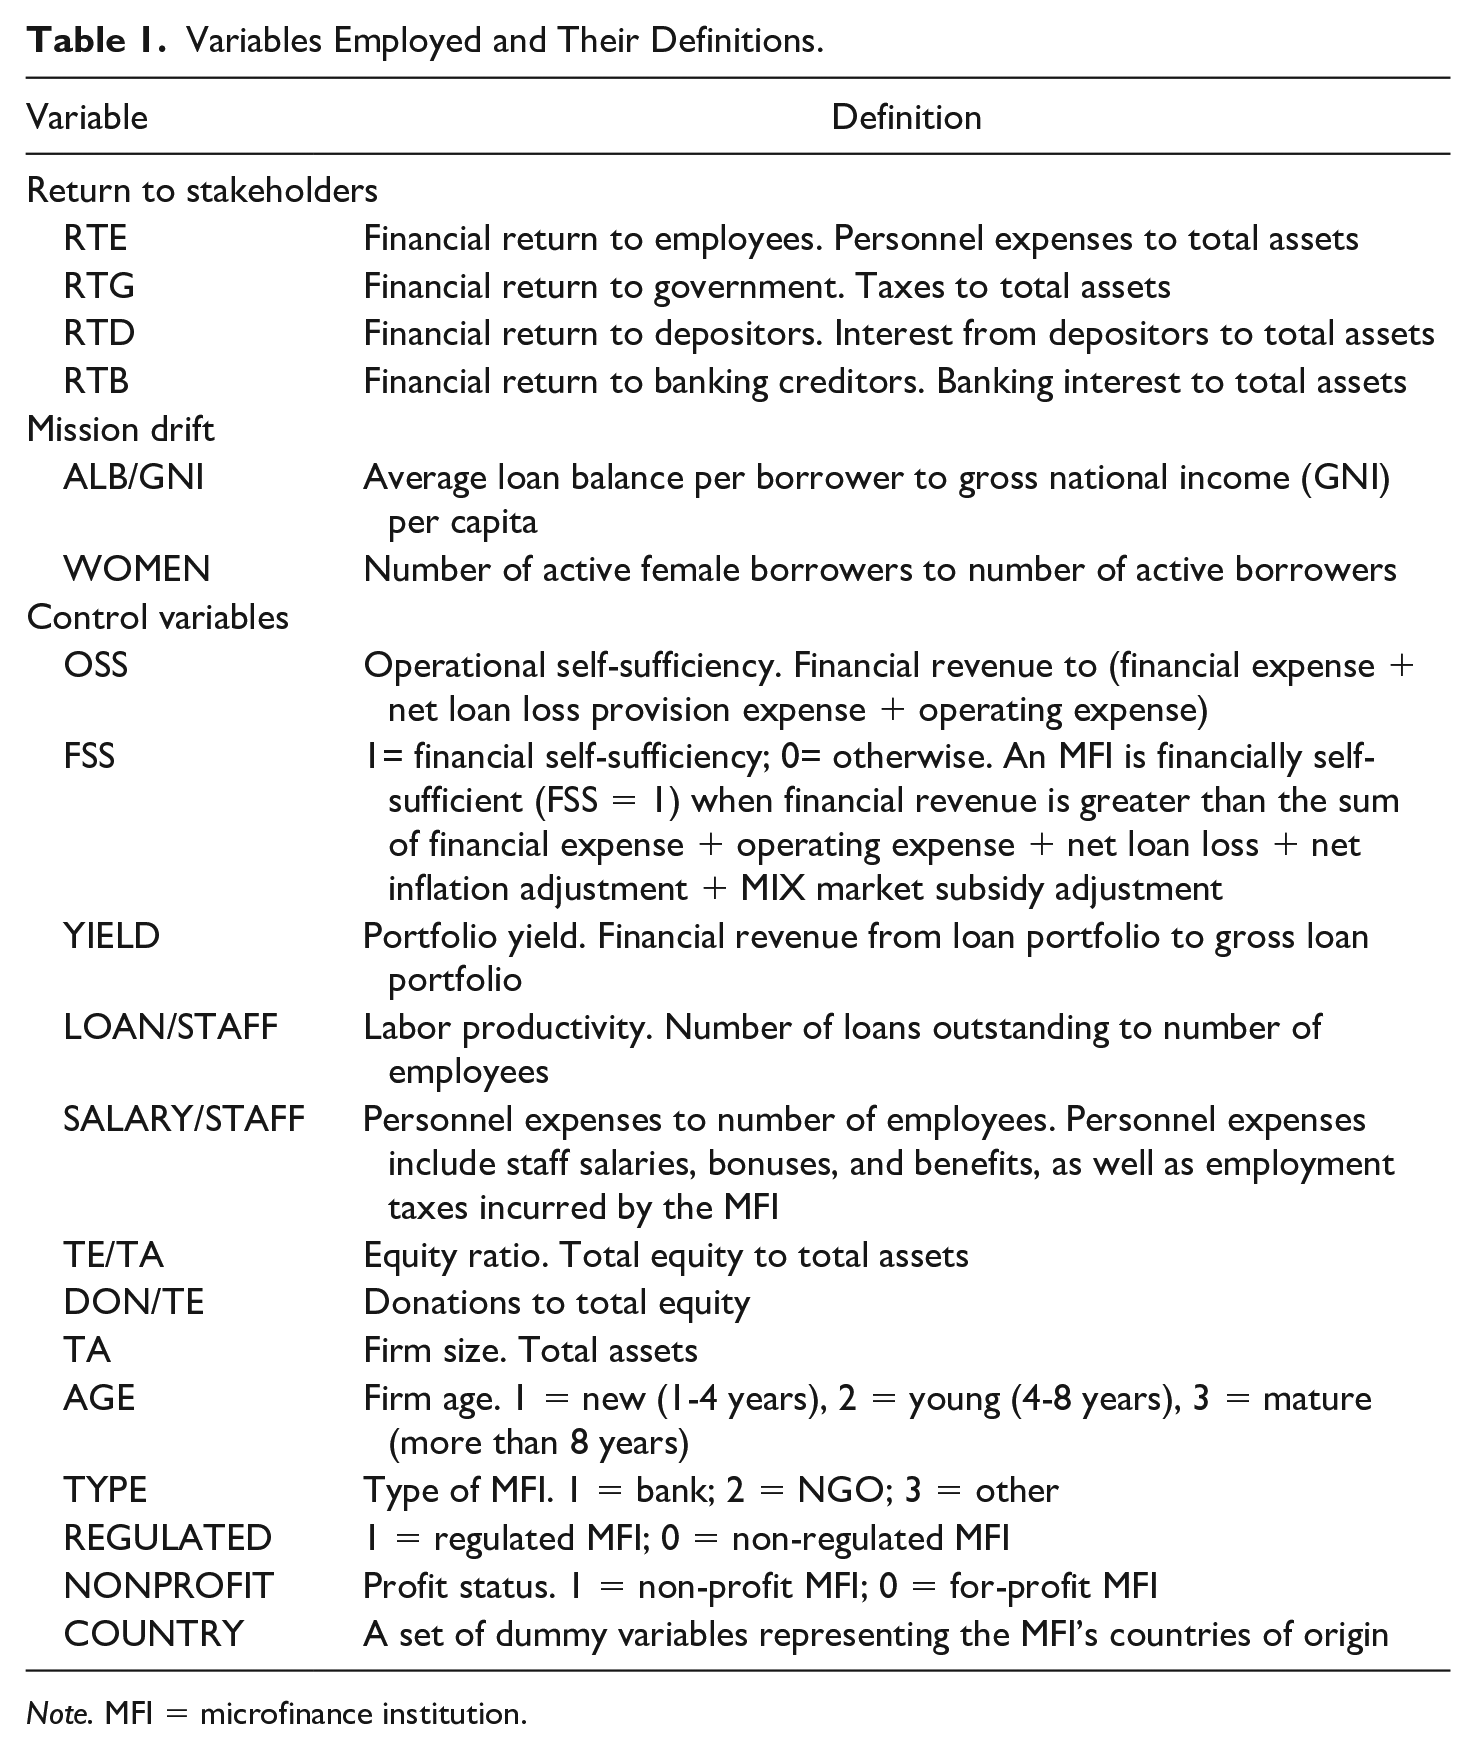
Note. MFI = microfinance institution.
Independent Variables
Measuring mission drift is as difficult as measuring social impact (Mair & Marti, 2006; Mersland et al., 2019). The topic of microfinance mission drift can be understood in two ways: the first is when MFIs deviate from desired social outcomes over time, and the second is when MFIs deviate from their own stated mission (Mersland et al., 2019). We have followed the first approach, using the mission drift proxies standard in MFI studies. Mission drift was measured using two indicators: the average loan balance per borrower (ALB/GNI) and the percentage of women borrowers (WOMEN). Both indicators have been widely used in the literature on mission drift in microfinance (Copestake, 2007; Cull et al., 2007; Hermes et al., 2011). The average loan size is the traditional measure of the depth of outreach, which attempts to capture the poverty level of the clients, and also borrower sex (women are preferred) is often used as a simple, indirect proxy for the depth of outreach (Schreiner, 2002). The average loan balance per borrower was corrected by the gross national income per capita of the respective country to standardize for the variation in income across countries. Many MFIs include in their missions the empowerment of women, who are associated with poverty in the countries where MFIs operate; consequently, the percentage of women borrowers is usually seen as another mission drift indicator. The extent to which these indicators are adequate for measuring mission drift can be questioned (Armendáriz & Szafarz, 2011; Copestake, 2007; Cozarenco et al., 2022; Mersland et al., 2019). Mersland et al. (2019) matched mission statements with the actual practices of microfinance organizations using content analysis. MFIs that claimed to have a poverty alleviation mission had significantly smaller average loan sizes, and MFIs whose mission statements focused on women had an impressive 80.5% of women in their clientele base.
Control Variables
To try to control for outside influences, we used several control variables, such as MFI characteristics, which were measured using several financial indicators. Financial performance indicators for MFIs included operational self-sufficiency (OSS), portfolio yield (YIELD), equity ratio (TE/TA), efficiency (EXP/REV), the ratio of gross loan to staff (LOAN/STAFF), the average cost per employee (SALARY/STAFF), and donations to equity ratio (DON/TE). Particular characteristics included firm size, measured by total assets (TA), firm age (AGE), and type of entity (TYPE) as well as dummy variables indicating whether the MFI was financially self-sufficient (FSS), was a non-profit institution (NONPROFIT), or was a regulated institution (REGULATED). The MFI’s home country was represented by a set of dummy variables, one for each country (COUNTRY).
The loan portfolio divided by the number of employees is expected to be low in mission-focused MFIs because these entities have many employees compared to the small loan portfolio they generate. By contrast, the number of loans outstanding per number of employees is expected to be high in mission-focused MFIs. These MFIs are usually small non-profit institutions because banks are more inclined to attract higher-end customers. MFIs paying high average salaries are expected to show the highest employee contributions. Understandably, mission-focused entities may be rather financially inefficient—that is, they have high operating costs and achieve not very high revenues (D’Espallier et al., 2017).
A positive relationship between financial performance and tax payment can be expected. Some empirical studies support the positive relationship between MFI size and profitability, which is justified by the liability of smallness (J. Freeman et al., 1983). However, large companies are more likely to evade taxes because they have the resources to do so (Lanis & Richardson, 2015); thus, the relationship between firm size and taxes is not clear. Banks are expected to pay more taxes than non-profit MFIs, as the latter often have access to tax benefits (Bloodgood et al., 2014). In addition, for-profits have a goal of making a profit that, in turn, translates into higher tax payments.
Life cycle theory applied to microfinance shows that MFIs are usually funded with grants, and when they mature, they are more commercially oriented and reduce donations in favor of other sources of funding (Hoque et al., 2011). The age of the MFI is thus expected to be an explanatory factor for interest payments because MFIs can become regulated entities over time. The financial structure of MFIs consists of equity and liabilities. The higher the equity ratio is, the lower the MFI’s use of leverage will be, and the lower the contribution from the creditors will be. Many MFIs receive donations, which are a free form of funding, so that, the larger the donations are, the lower the interest payments will be. When an MFI becomes regulated, it usually decreases operating costs and gains in efficiency (D’Espallier et al., 2017). Therefore, it is expected that greater efficiency will be associated with a higher contribution to depositors but a lower contribution in the form of bank interest.
The country context is an important determinant of MFI performance (Ahlin et al., 2011), and, in a similar way, the country where the MFI operates can play a role in determining wages, taxes, and the payment of interest. The theory of social capital justifies a positive relationship between the level of social capital in a country and the performance of the MFIs that operate in it for reasons related to social trust, country fractionalization, and educational level. A positive association exists between social capital and per capita gross domestic product (GDP), the employment-to-population ratio, and spending on education (Schyns, 2002). Several country-related factors favor the payment of taxes: for example, the corporate tax rate, the shadow economy level (Lee, 2013), the GDP per capita (Fuest & Riedel, 2009), and the country’s fractionalization (Postelnicu & Hermes, 2018). A similar effect can be expected on the financial RTE. Several country characteristics favor the payment of interest: for example, the country’s lending rate and the development of the credit market because MFIs can access credit and are not dependent on donations or equity (Berdiev & Saunoris, 2016).
Sample and Data
Data on MFIs came from the MIXMarket database covering the period 1999 to 2017. After deleting observations with missing data, the final sample contained a total of 534 MFIs from 80 different countries. Table 2 shows the distribution of the sample by type of MFI, geographic area, age, financial sustainability, regulation characterization, and profit status.
Sample Characteristics.
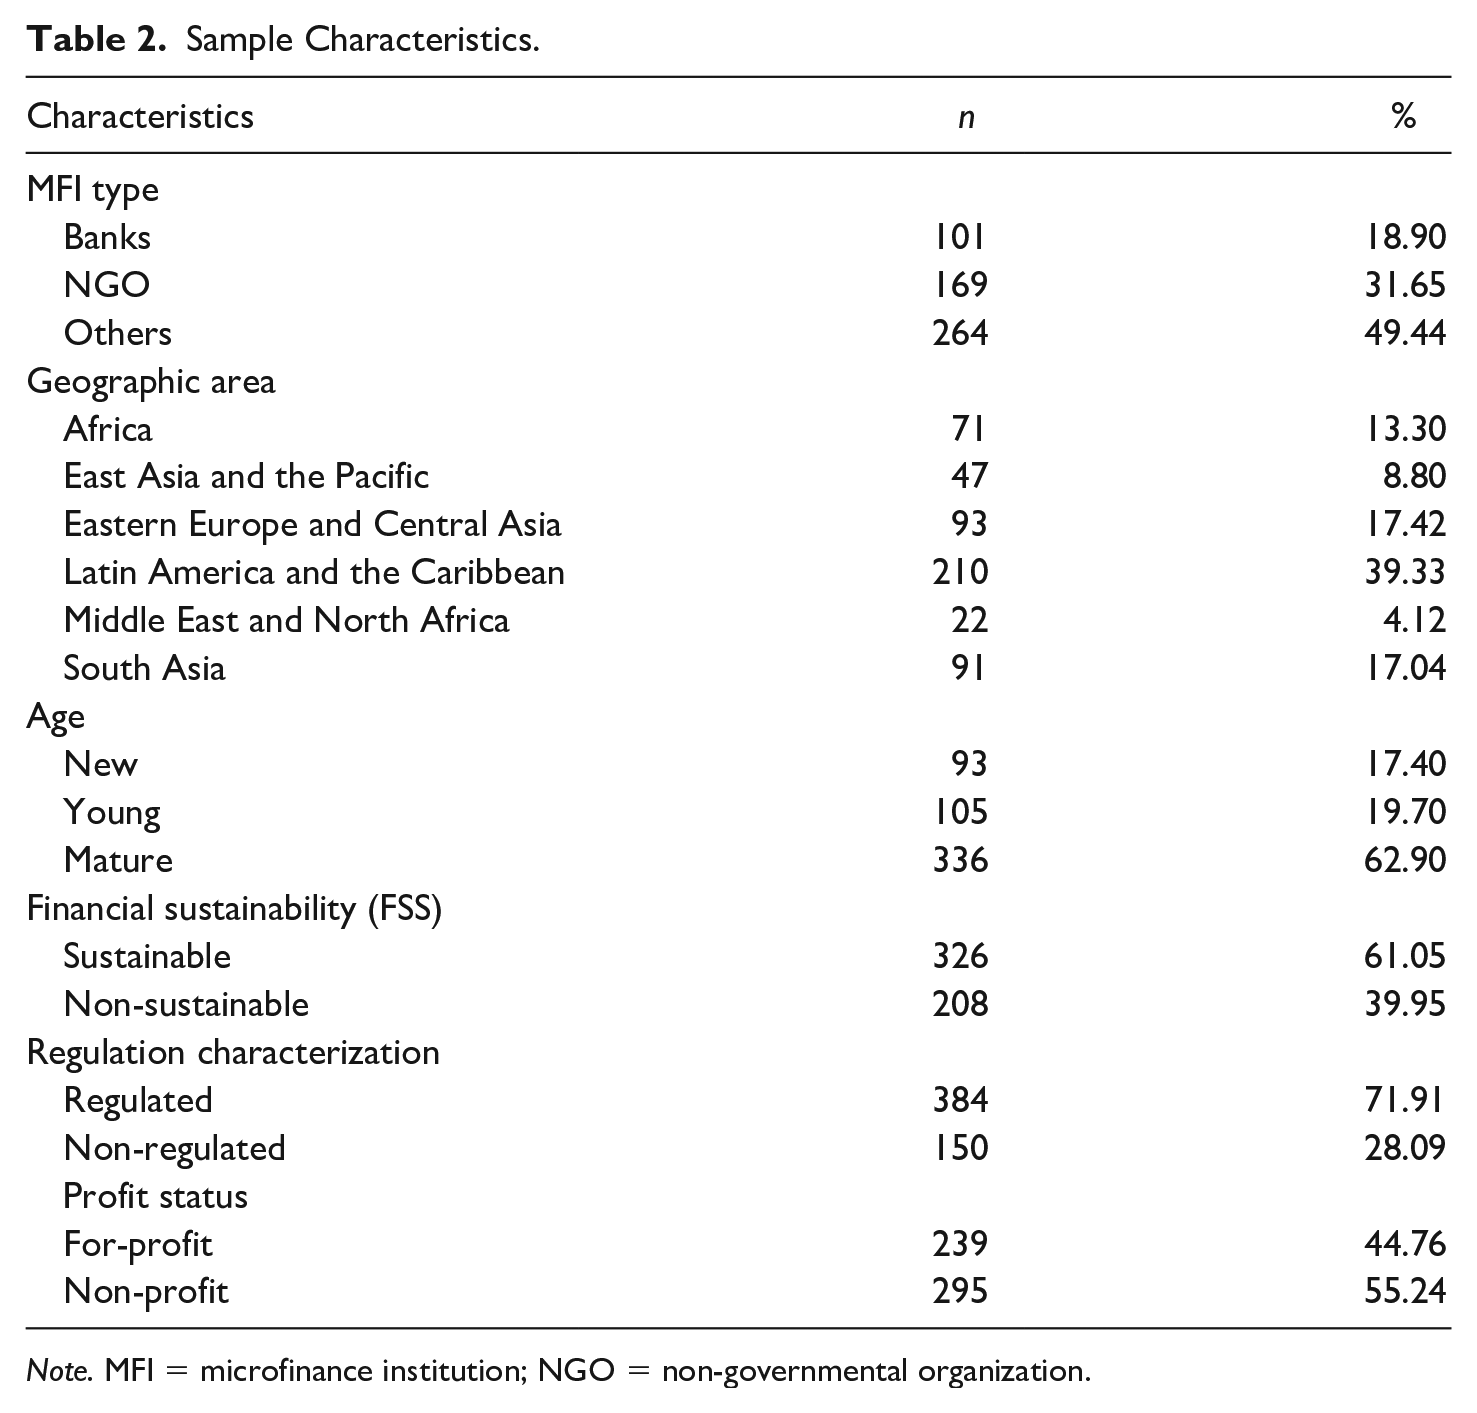
Note. MFI = microfinance institution; NGO = non-governmental organization.
Table 3 presents the descriptive statistics for all variables and the Pearson correlation coefficients with levels of significance for the continuous variables. We winsorized the data to minimize the distortionary effects of outliers. A particularly interesting result is the correlation between the contributions to the four stakeholders, which is small but statistically significant. Three of the six correlation coefficients are negative. For example, the Pearson’s correlation coefficient between RTE and RTB is positive (0.11), but it is negative (–0.16) between RTE and RTD. This means that it is not possible to simultaneously serve all four stakeholders because their interests are often opposed, and it is logically impossible to maximize in more than one dimension at the same time (Jensen, 2001).
Descriptive Statistics and Correlations for the Main Variables (N = 3,204).
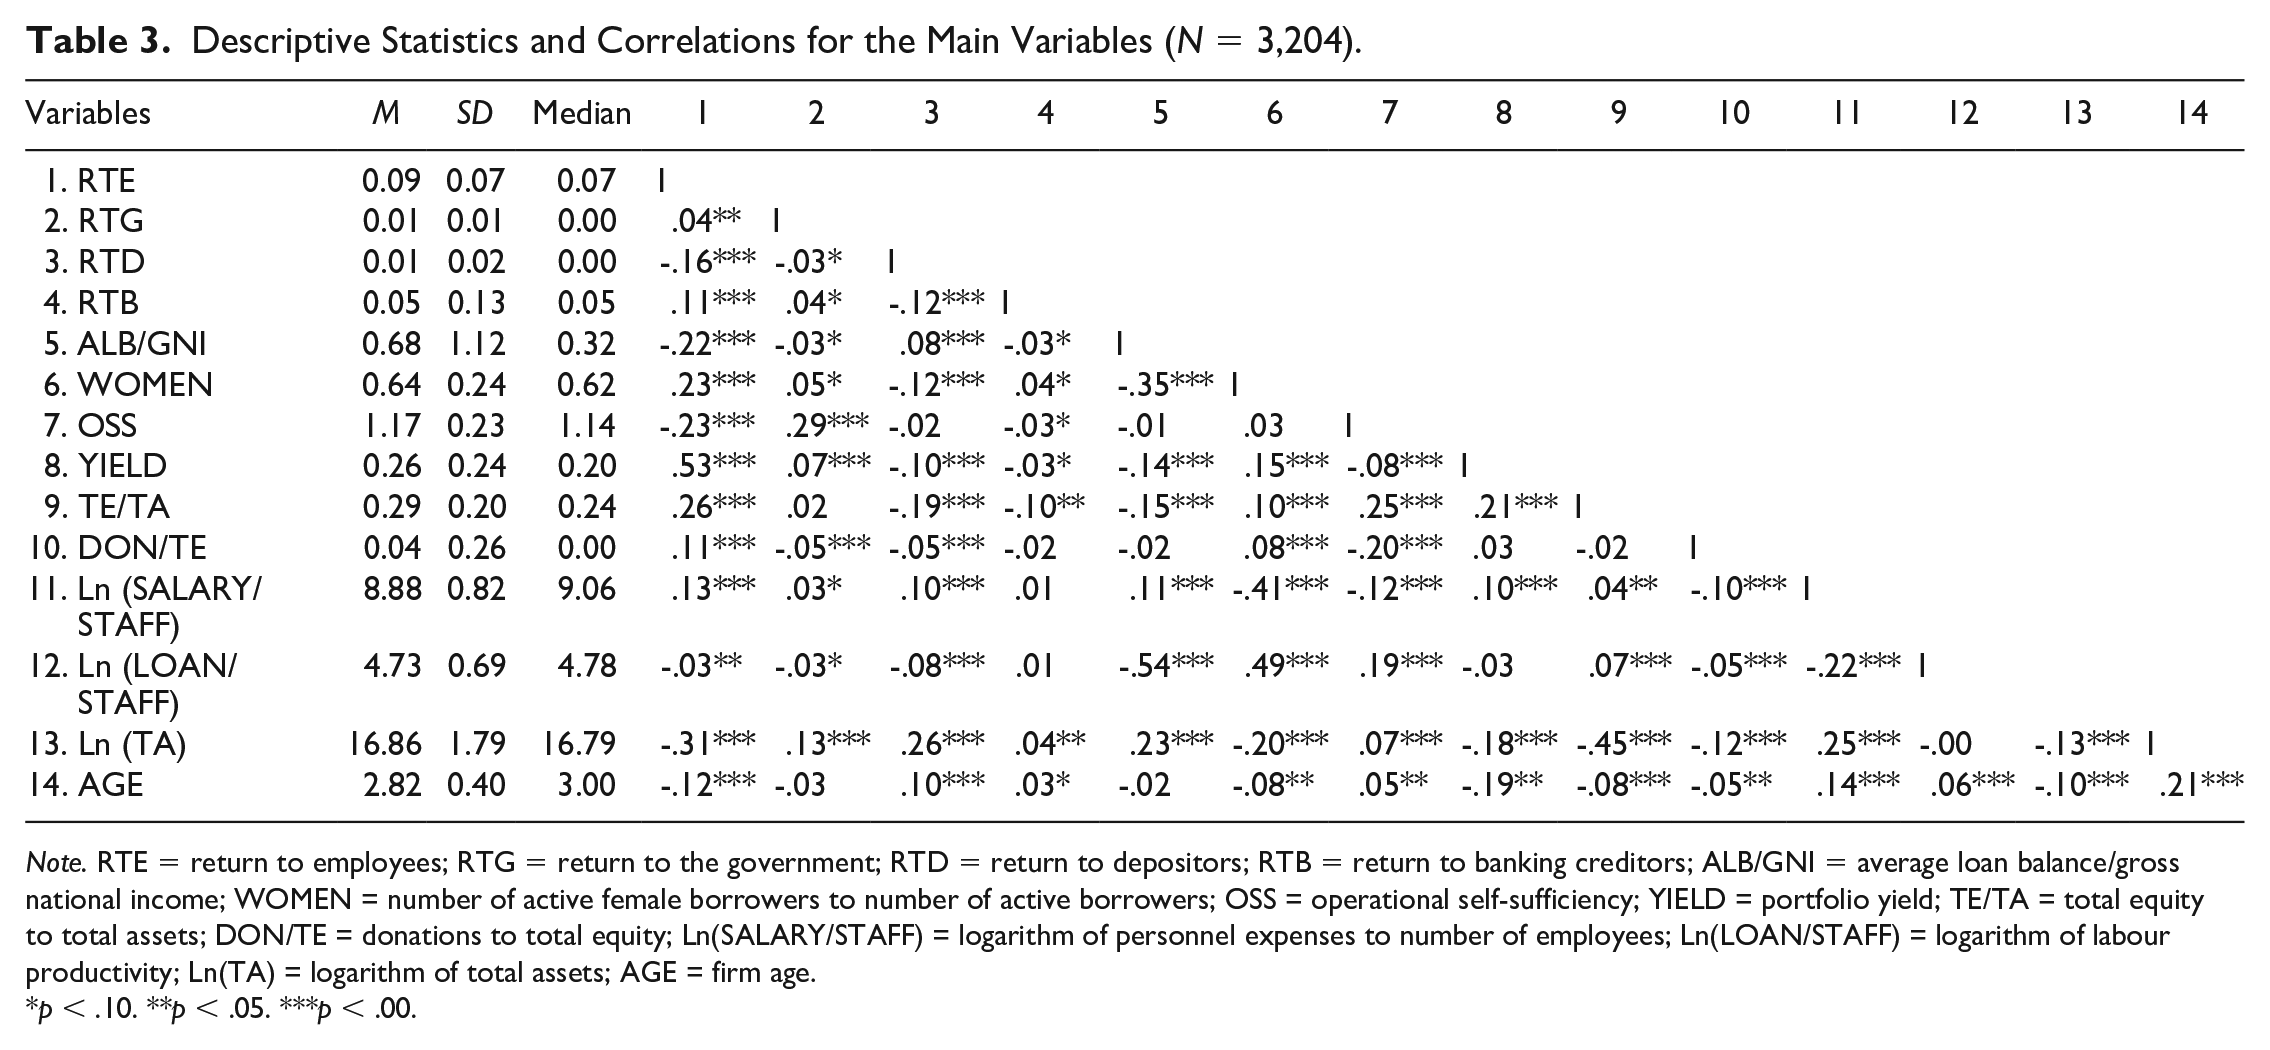
Note. RTE = return to employees; RTG = return to the government; RTD = return to depositors; RTB = return to banking creditors; ALB/GNI = average loan balance/gross national income; WOMEN = number of active female borrowers to number of active borrowers; OSS = operational self-sufficiency; YIELD = portfolio yield; TE/TA = total equity to total assets; DON/TE = donations to total equity; Ln(SALARY/STAFF) = logarithm of personnel expenses to number of employees; Ln(LOAN/STAFF) = logarithm of labour productivity; Ln(TA) = logarithm of total assets; AGE = firm age.
p < .10. **p < .05. ***p < .00.
Panel Data Results
We used two-way regression for panel data to test our hypotheses. We chose this technique because of its ability to analyze data with temporal and cross-sectional variability. We used a balanced panel data set of six observations from 534 MFIs, which resulted in 3,204 MFI-year observations. We selected MFIs with complete data for different 6-year periods from 1999 to 2017. Our model explains financial return to stakeholders by mission drift. MFI characteristics and country dummy variables were included as control variables. We developed the following four linear regression equations:
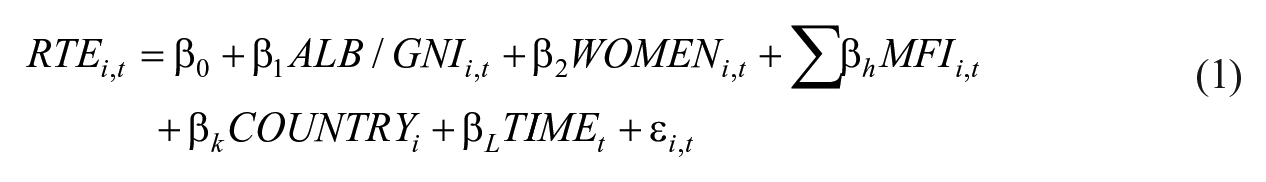
where i = 1,. . .,534 and t = 1,. . .,6. RTE is the financial RTE for MFI i at year t and so on; ALB/GNI is the standardized average loan size; and WOMEN is the percentage of female borrowers. MFI is a vector of MFI feature control variables, and COUNTRY is a vector of country dummies capturing the MFI’s home country. Regression models were estimated using panel data methods. εit is a composite error term
We used both the two-way-fixed-effects (FE) model and the two-way-random-effects (RE) model to estimate the panel data. We applied the Hausman χ2 test to select the appropriate model between FE and RE models. We applied some tests for panel data to test the independence and the identical distribution of errors in the model specification, namely, the Wooldridge test for autocorrelation to test serial correlation, the Pesaran test of cross-sectional independence to test contemporaneous cross-sectional correlation, and a modified Wald statistic for group-wise heteroscedasticity in the residuals. The variance inflation factor (VIF) multicollinearity test was performed, finding VIF values below the threshold limit for all coefficients (the maximum value was 3.56), suggesting the absence of serious collinearity. We used panel-corrected standard error (PCSE) estimates to obtain standard errors for the FE estimator to deal with the problems of serial correlation and heteroscedasticity.
Tables 4 to 7 present the results of the panel data analysis. The first two columns show the results of the estimation of FE and RE models. The third column presents the PCSE. The Hausman χ2 test rejects the RE estimator (prob. > χ2 is less than .001) in favor of an FE model. The results of the Wald test are significant in all of the regression models (p values <.000), indicating that the error terms exhibit heteroscedasticity. The Wooldridge test and the Pesaran test indicate that serial and cross-sectional correlation exists in the error terms (Wooldridge’s test p-values < .05; Pesaran’s test p values < .000).
Data Panel Regression Results for the Dependent Variable Return to Employees (RTE).
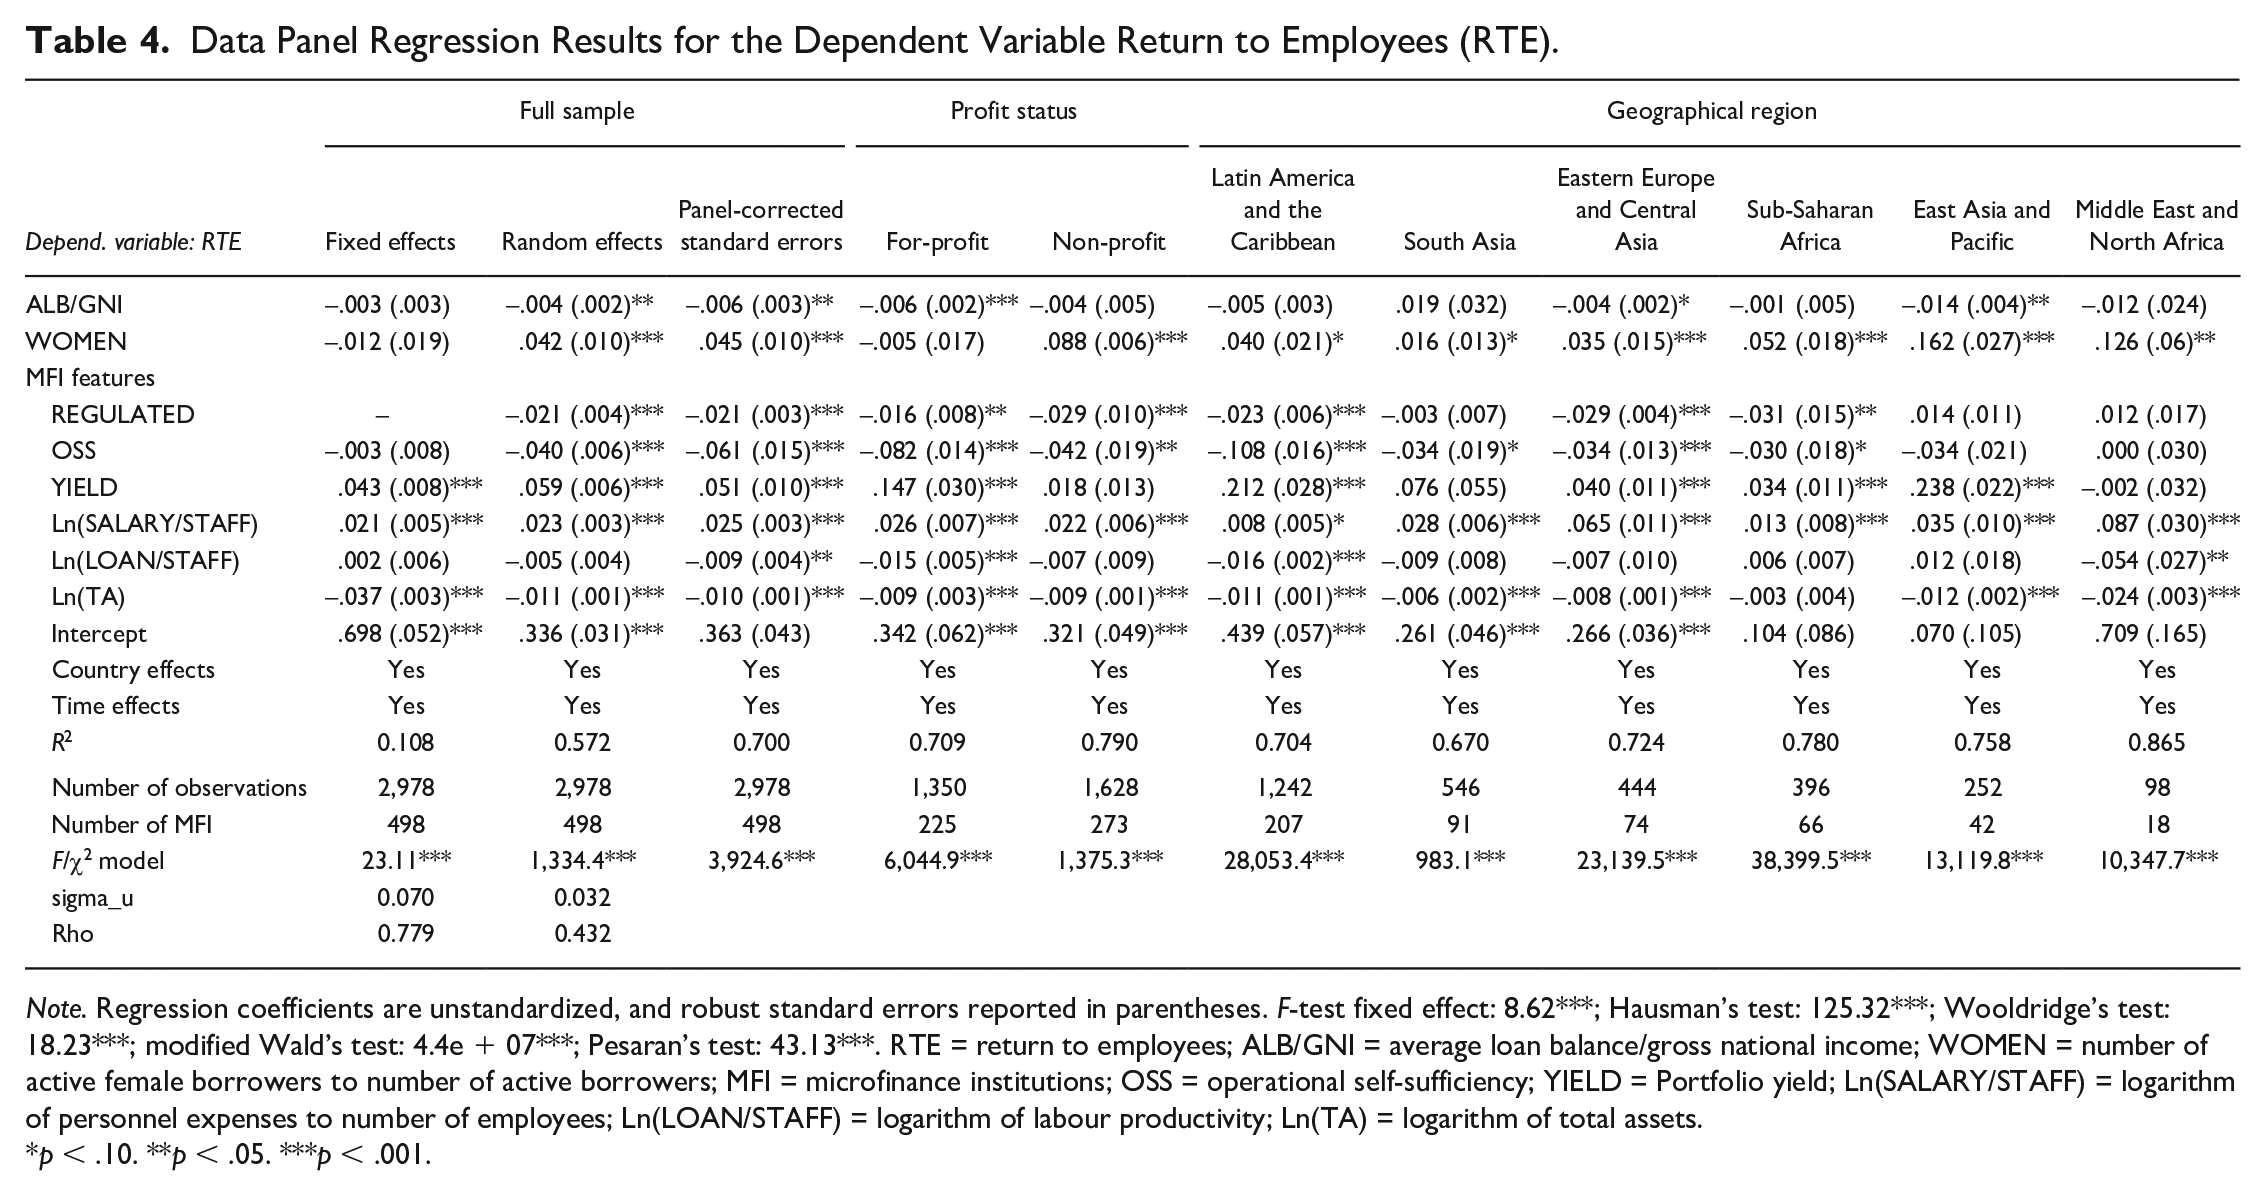
Note. Regression coefficients are unstandardized, and robust standard errors reported in parentheses. F-test fixed effect: 8.62***; Hausman’s test: 125.32***; Wooldridge’s test: 18.23***; modified Wald’s test: 4.4e + 07***; Pesaran’s test: 43.13***. RTE = return to employees; ALB/GNI = average loan balance/gross national income; WOMEN = number of active female borrowers to number of active borrowers; MFI = microfinance institutions; OSS = operational self-sufficiency; YIELD = Portfolio yield; Ln(SALARY/STAFF) = logarithm of personnel expenses to number of employees; Ln(LOAN/STAFF) = logarithm of labour productivity; Ln(TA) = logarithm of total assets.
p < .10. **p < .05. ***p < .001.
Data Panel Regression Results for the Dependent Variable Return to Government (RTG).
Note. Regression coefficients are unstandardized, and robust standard errors reported in parentheses. F-test fixed effect: 5.45***; Hausman’s test: 20.97***; Wooldridge’s test: 15.14***; modified Wald’s test: 2.6e + 07***; Pesaran’s test: 69.27***. RTG = return to the government; ALB/GNI = average loan balance/gross national income; WOMEN = number of active female borrowers to number of active borrowers; MFI = microfinance institution; OSS = operational self-sufficiency; YIELD = Portfolio yield; DON/TE = donations to total equity; Ln(TA) = logarithm of total assets.
p < .10. **p < .05. ***p < .001.
Data Panel Regression Results for the Dependent Variable Return to Depositors (RTD).
Note. Regression coefficients are unstandardized, and robust standard errors reported in parentheses. F-test fixed effect: 3.71***; Hausman’s test: 5.86*; Wooldridge’s test: 0.708; modified Wald’s test: 1.1e + 09***; Pesaran’s test: 667.33***. RTD = return to depositors; ALB/GNI = average loan balance/gross national income; WOMEN = number of active female borrowers to number of active borrowers; MFI = microfinance institutions; OSS = operational self-sufficiency; TE/TA = total equity to total assets; DON/TE = donations to total equity; AGE = firm age; Ln(TA) = logarithm of total assets.
p < .10. **p < .05. ***p < .00.
Data Panel Regression Results for the Dependent Return to Banking Creditors (RTB).
Note. Regression coefficients are unstandardized, and robust standard errors reported in parentheses. F-test fixed effect: 1.8***; Hausman’s test: 7.06; Wooldridge’s test: 298.046***; modified Wald’s test: 8e + 07***; Pesaran’s test: 199.62***. RTB = return to banking creditors; ALB/GNI = average loan balance/gross national income; WOMEN = number of active female borrowers to number of active borrowers; MFI = microfinance institution; OSS = operational self-sufficiency; TE/TA = total equity to total assets; DON/TE = donations to total equity; AGE = firm age; Ln(TA) = logarithm of total assets.
p < .10. **p < .05. ***p < .001.
Table 4 reports the results of the model that used the financial RTE (RTE) as a dependent variable. Results support Hypothesis 1a: a negative relationship exists between average loan size and the RTE, and Hypothesis 1b, a positive relationship between the percentage of loans to women and the RTE. The estimated coefficients are significant in most models. In terms of the control variables, the greatest financial RTE is associated with a typical pattern of a mission-centered MFI—that is, small unregulated entities, not very sustainable, not very productive, and burdening borrowers with high margins. As expected, as average salaries increase, so do the financial RTE.
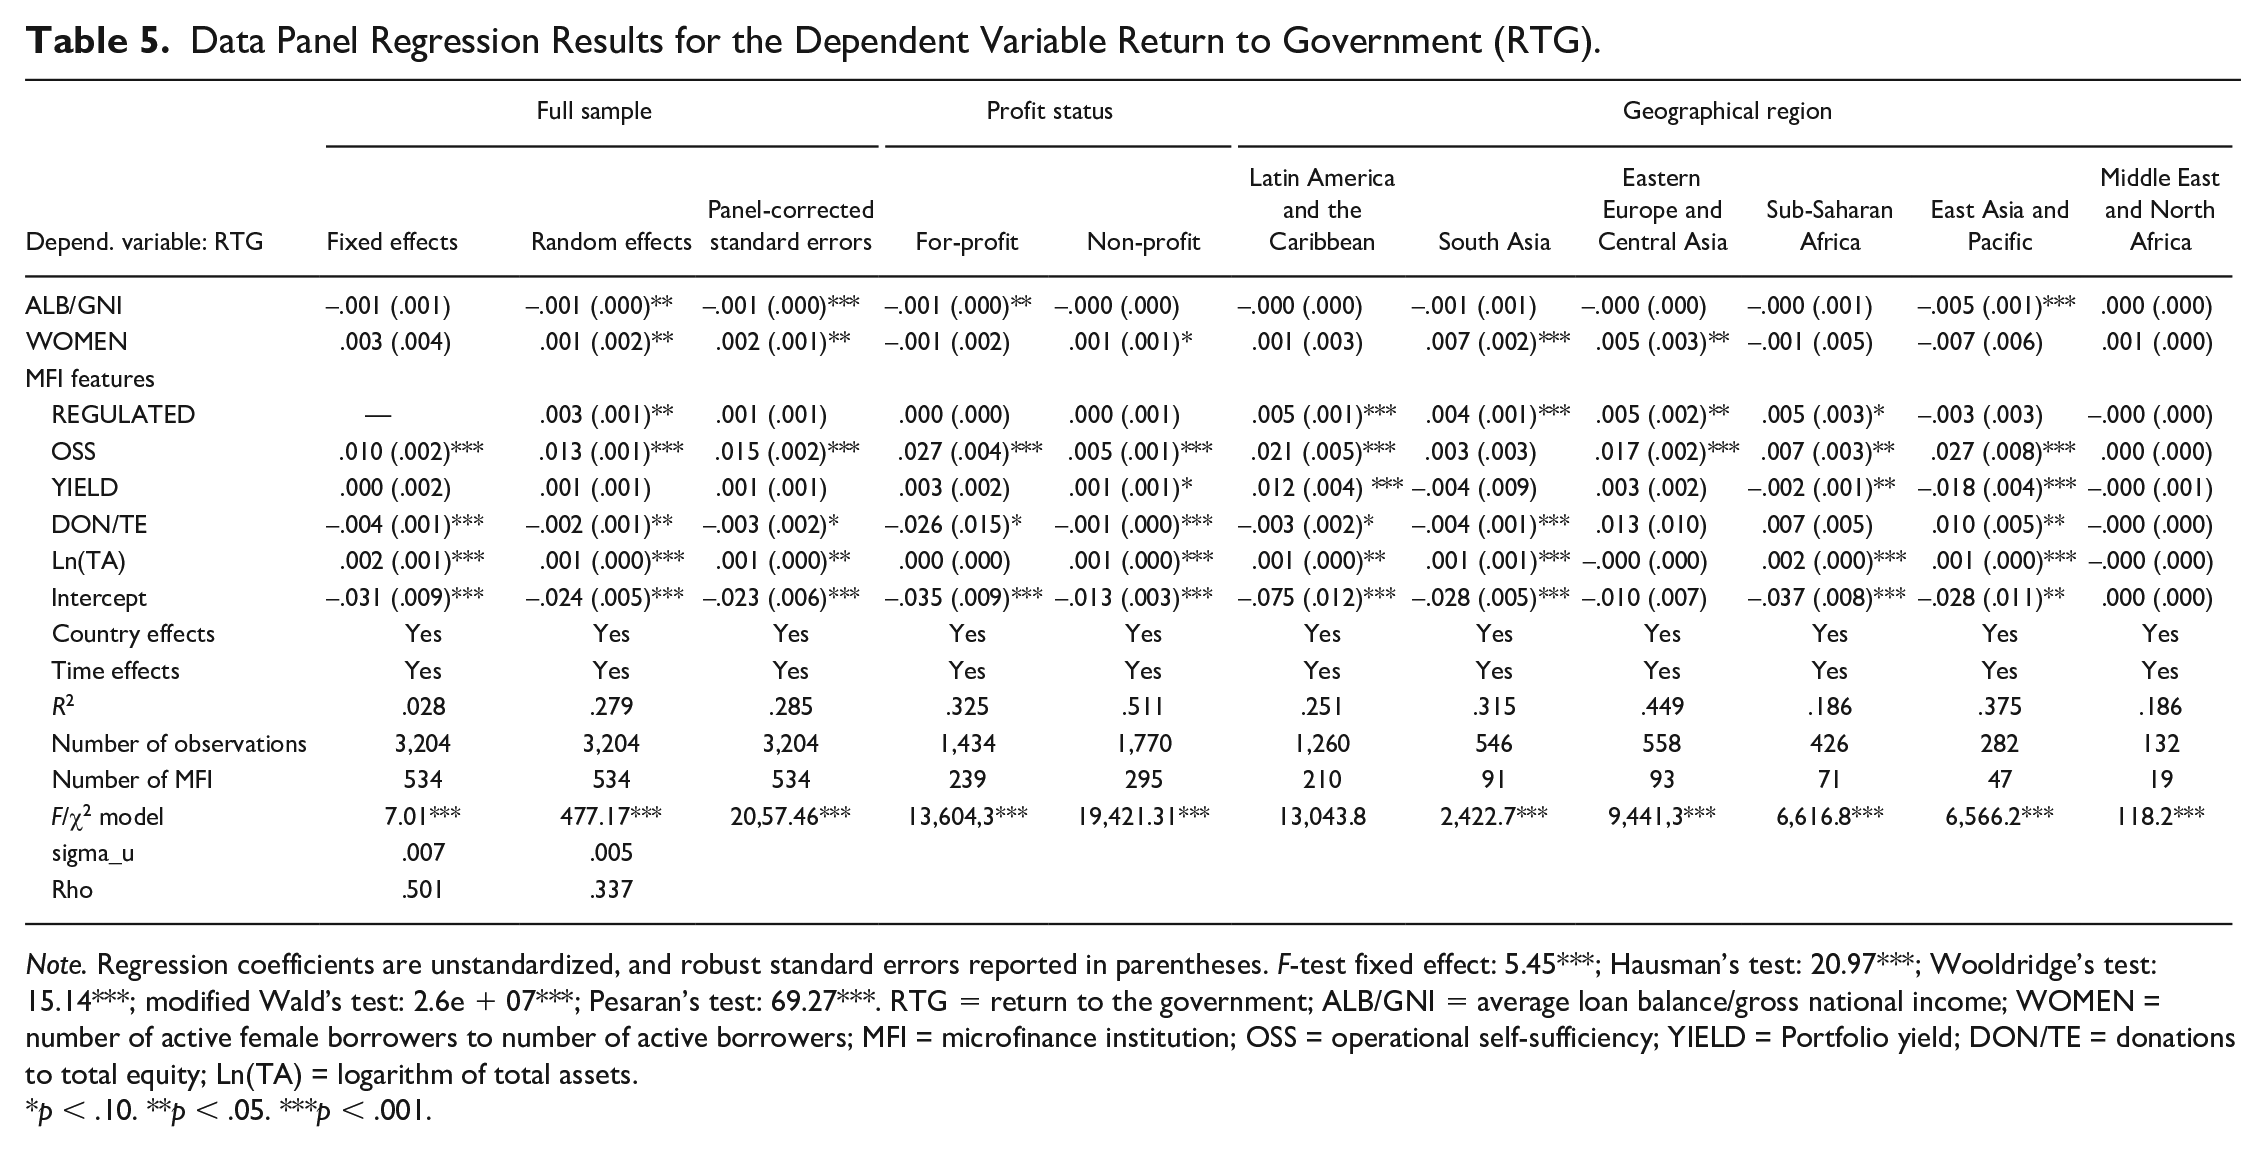
Table 5 reports the results of the model that used the financial RTG as a dependent variable. Data support Hypothesis 2a: a negative relationship exists between average loan size and the RTG, and Hypothesis 2b, a positive relationship between the percentage of loans to women and the RTG. As for the control variables, the greatest financial RTG is associated with large and regulated MFIs that are sustainable and do not receive donations.
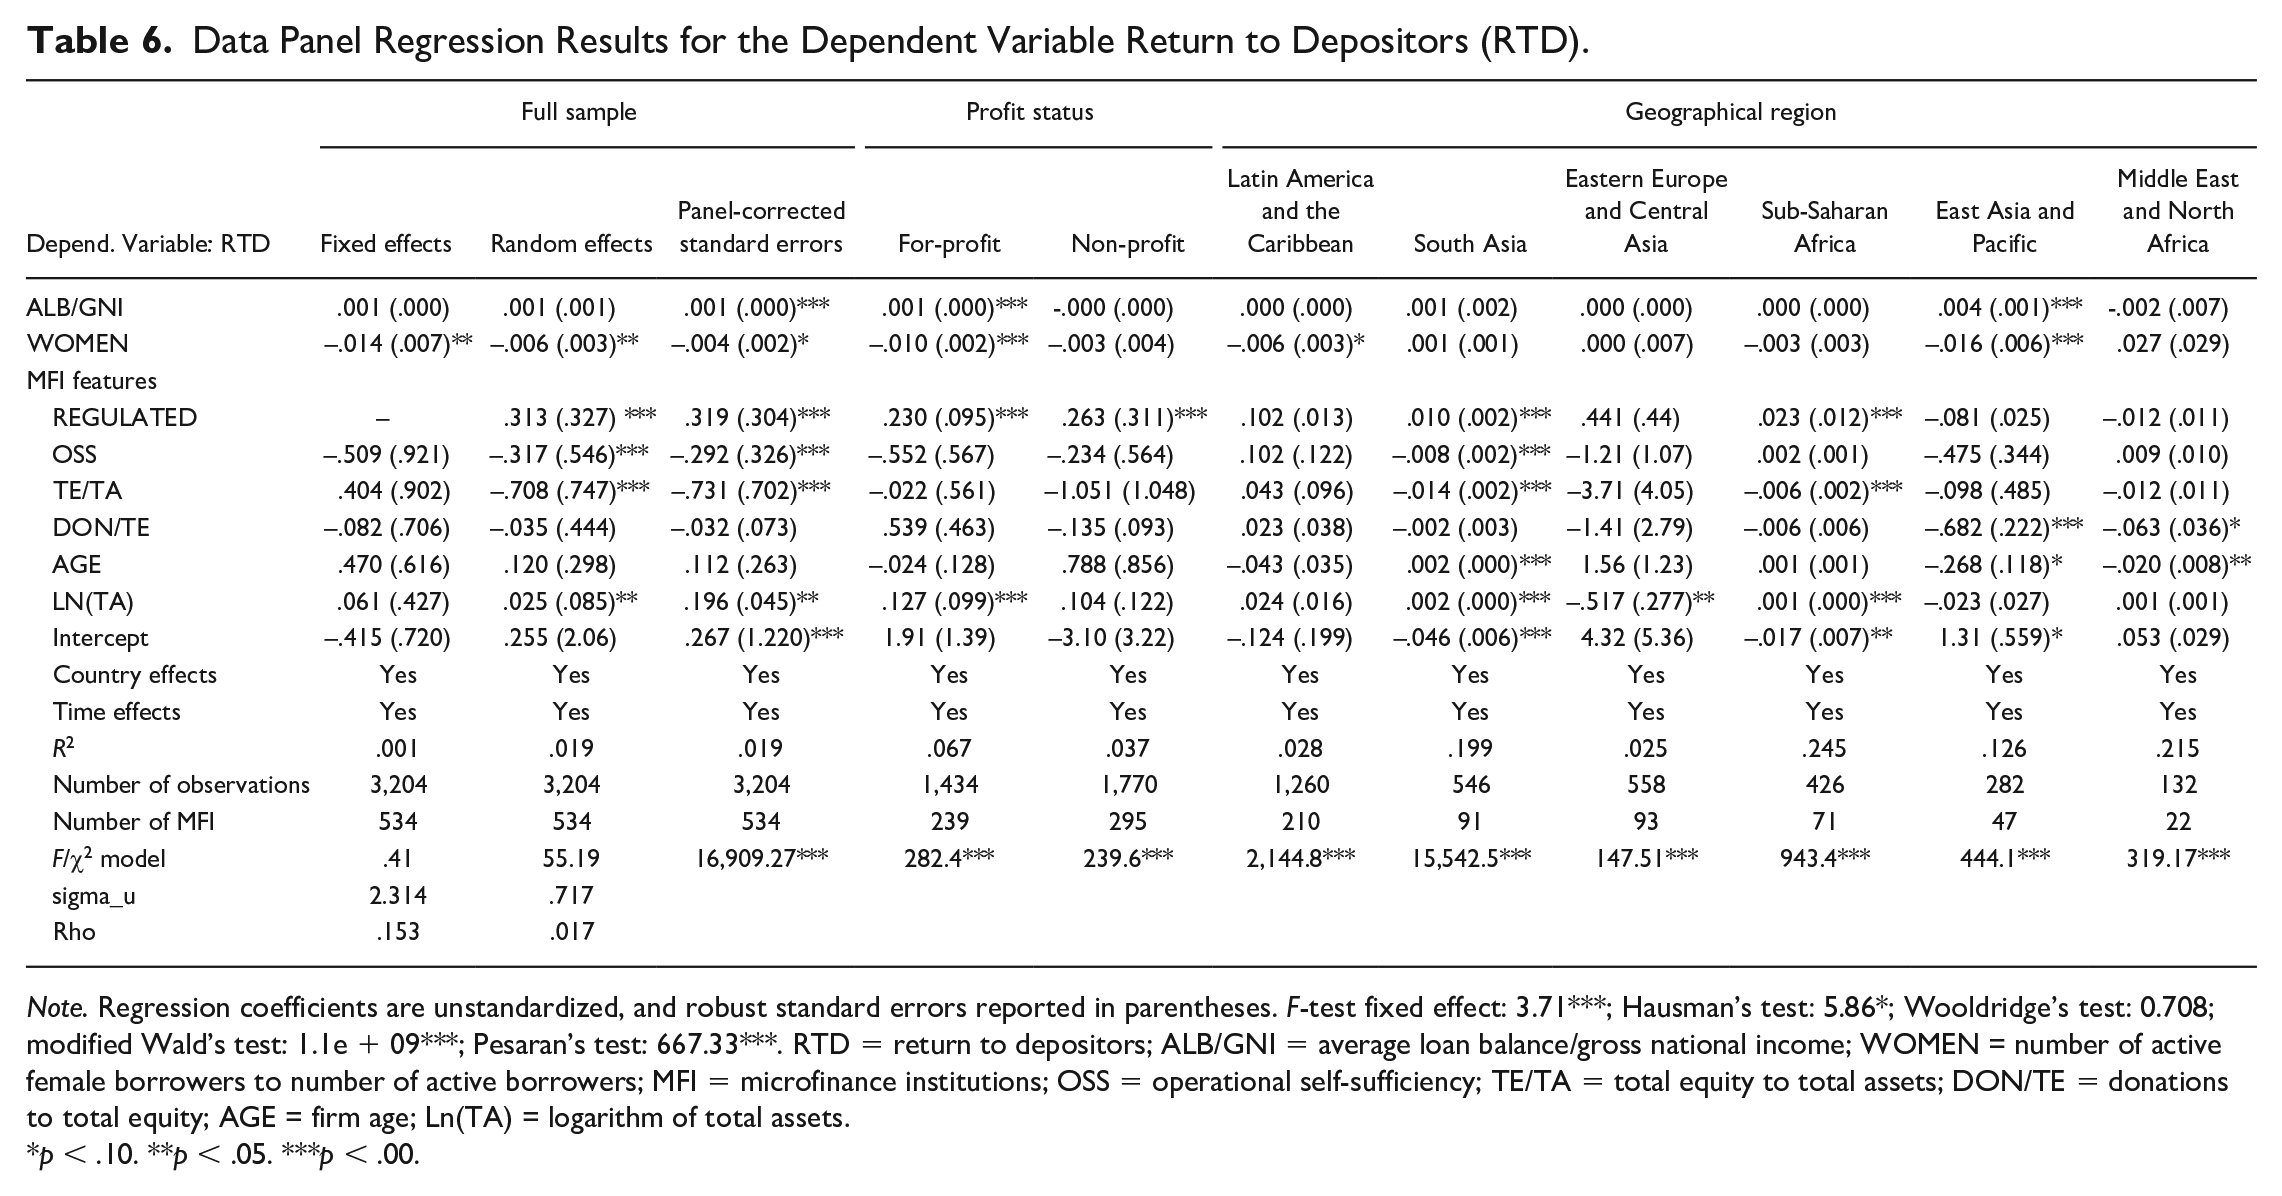
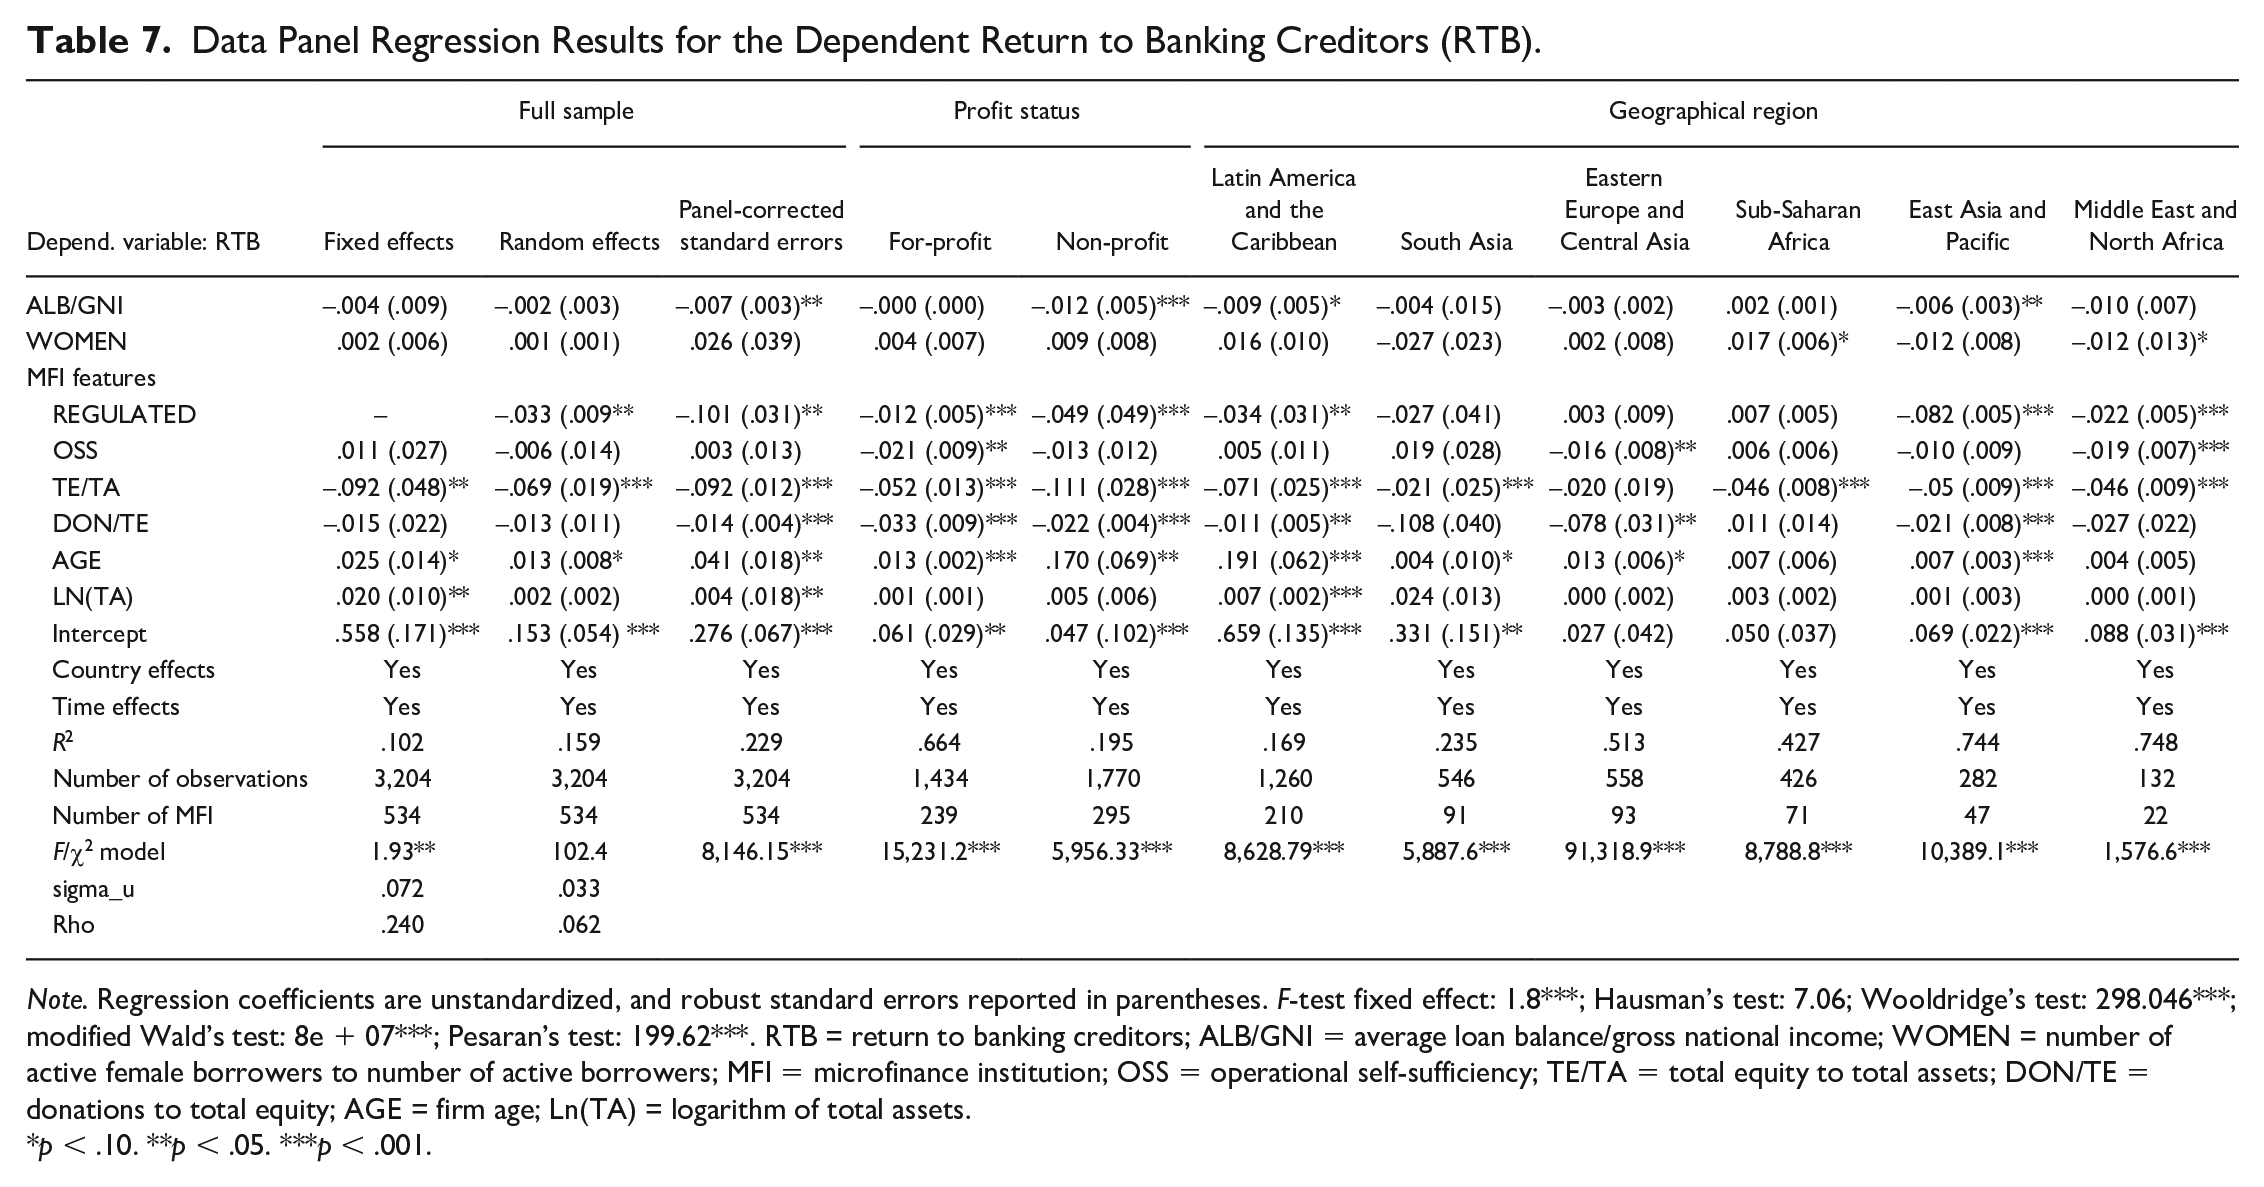
Tables 6 and 7 show the results of the models that used the financial RTD and the financial RTB as dependent variables, respectively. Data support Hypothesis 3a: a positive relationship exists between average loan size and the RTD, while the relationship between average loan size and banking creditors is negative. Hypothesis 3b is partially supported: a negative relationship exists between the percentage of loans to women and the return to depositors. Regulated MFIs pay less banking interest than unregulated MFIs because they take deposits, which are a cheaper form of financing than other liabilities. The larger the MFI, the greater the financial returns are to both depositors and banking creditors. The lower the leverage is, the lower the financial returns to both depositors and banking creditors are.
It can be conjectured that the hypothesized relationships depend on the profit status of the MFI. Therefore, we divided the sample into two subsamples (for-profit and non-profit). We also analyzed the findings to determine whether they were stable in all geographic areas. We divided the samples into six subsamples, one for each geographic area. Tables 4 to 7 show the results of the PCSE regression models. Some significant differences were found in the relationship between mission drift proxies and return to stakeholders depending on the geographic region and the profit status.
Discussion and Conclusion
This article offers additional insight into microfinance mission drift, a widely debated issue. The impact of mission drift on customers and donors is well studied (Beisland et al., 2019; Fouillet & Augsburg, 2010; Frank et al., 2008; Pedrini & Ferri, 2016), but our article analyses the effect of mission drift on employees, the government, micro-savers, and banking creditors. Our study is in line with stakeholder theory, which states that management should create value, not only for shareholders but also for the remaining stakeholders (E. Freeman, 1984). We can conclude that mission drift has effects not only on customers but also on all other stakeholders.
MFI mission drift is generally explained by transaction cost theories (Armendáriz & Szafarz, 2011) and negatively affects borrowers (Fouillet & Augsburg, 2010; Frank et al., 2008). We used the average loan size and the percentage of female borrowers as indicators to measure mission drift. On the basis of our results, we reached the following findings. First, we found a negative relationship between average loan size and RTE and a positive relationship between women borrowers and RTE, which is justified because mission-focused MFIs are labor-intensive. This is a relevant finding, given the importance of employment for the well-being of individuals and societies, particularly in countries where MFIs operate.
Second, we found a negative relationship between average loan size and RTG and a positive relationship between women borrowers and RTG, which is consistent with the stress inertia theory that predicts that organizational change causes negative effects on firm performance (Jas & Skelcher, 2005). We believe that this is another good reason for MFIs not to drift away from their mission.
Third, we found a positive relationship between average loan size and return to micro-savers, and a negative relationship between women borrowers and return to micro-savers. This is justified because mission-focused MFIs are usually unregulated non-governmental organizations (NGOs) that cannot collect savings, which undermines the goal of financial inclusion. If the poorest cannot deposit their money in an MFI, alternative ways of channeling savings include rotating savings groups, keeping money at home, or even paying private savings collectors. Deposits offer security, pay interest, and can be the first step in accessing future loans because of the relationship established with the MFI. The win–win situation would be to continue lending to the poorest but attract deposits, and the way to accomplish this is through regulation. That is, to become a regulated institution while maintaining its social mission. The transformation of an NGO into a bank can be associated with an increase in loan size and a decrease in the percentage of women borrowers (Frank et al., 2008), but this brings advantages, such as reduced costs for the institution, which then translate into decreased interest rates for customers (D’Espallier et al., 2017). However, it is not always positive for the institution to opt for regulation, and shifting goals often creates confusion and impair performance (Naranjo-Gil et al., 2008). Social capital theory justifies a positive relationship between the level of social capital in a country and the performance of the MFIs operating within it (Chmelíková et al., 2019). The country in which the MFI operates can also be expected to influence the return to stakeholders, as the results of our study show, which is explained by the fact that the country where the MFI operates plays a role in determining wages, taxes, and the payment of interest paid by MFIs.
Stakeholders should be taken into account when assessing the performance of MFIs (Mori & Mersland, 2014). However, sometimes stakeholder objectives are incompatible (Jensen, 2001), and in fact, our fourth finding is that the correlation coefficients between some of the indicators that measure the return to stakeholders are negative. The win–win MFI model would be a mission-centered institution, labor-intensive, profitable to pay taxes, and regulated to collect deposits. Not surprisingly, few MFIs match these criteria—only 12.4% of the analyzed sample (66 of 534). Managers may find it very difficult to please all stakeholders and will often have to prioritize. Lowering the financial margin benefits customers but can compromise sustainability, thus harming shareholders. In any financial institution, loan recovery practices are necessary to control delinquency, but an MFI must apply ethical limits. Efficiency gains in an MFI cannot be made at the expense of squeezing employees: a balance has to be achieved. It is difficult to combine the interests of all stakeholders, because sometimes they conflict and management has to make a choice. We agree that ethics and the fulfillment of the mission must guide any social entity and avoid any kind of abuse (Hudon, 2011).
Focusing on practical implications, a management-for-stakeholders approach requires managers to obtain indicators that measure the value created by the MFI for each of its stakeholders. However, when we reviewed the literature on microfinance assessment, we found no well-established indicators that measure the return of MFIs to stakeholders (Coupet et al., 2020; MacIndoe & Barman, 2013). Hudon and Périlleux (2014) studied the surplus that MFIs distribute to stakeholders. Our article follows their approach, as we calculated the economic value distributed by the MFIs, which could be used to review microfinance policies according to the demands of society in general and each stakeholder in particular. Social investors, public decision-makers, and microfinance managers responsive to the management-for-stakeholders approach may find both the results obtained and the indicators used in the study to be useful. We believe that it would be interesting for social rating agencies to extend their role to other stakeholders, reporting on the return that they receive and using indicators, such as those used in our study.
Our article has several limitations. Using a database with only accounting information, our study focused on financial return and not on other types of social return, such as community impact, sustainability, well-being, environmental impact, and equality. Stakeholder theory has a broader view that is related to who has a stake in decision-making. The fairness of the procedures employed for distribution is as important to stakeholder theory as the final distribution (Phillips et al., 2003). As a future line of research, we expect to incorporate non-financial returns into our model and study the procedures used for distribution and the degree of control within the process. The MixMarket database does not capture the entire microfinance sector and is subject to self-selection bias because MFIs voluntarily self-report their data. MixMarket does not provide sufficient detail for accounting items, such as the origin of the subsidies, employee compensation, training expenses, and employee benefits. Some MFIs do not have poverty alleviation or lending to women as part of their mission. It would be highly appropriate to match mission statements with actual practices of microfinance organizations because this approach avoids criticizing MIFs for not doing something they did not set out to do (Mersland et al., 2019). Even so, it is possible to argue that the microfinance sector is drifting if it deviates from desired social outcomes over time.
Another limitation of our study is that it considers all stakeholders to be of equal importance, but they are not (Phillips et al., 2003). It seems reasonable to argue that raising the savings of a poor person excluded from the financial sector and paying for those deposits is a bonus for any social MFI. This is not the same as paying interest to an international bank that lends money to the MFI. An MFI may be inefficient, unproductive, generate little profit, and pay few taxes and little interest, but it can still achieve a notable outreach to clients, have a remarkable impact on the community, and also generate local employment by hiring many credit officers. This is a multi-objective problem that could be solved by incorporating multicriteria decision-making techniques. Then, another future line of research could be to study how the return to one stakeholder is related to that of another.
Footnotes
Declaration of Conflicting Interests
The author(s) declared no potential conflicts of interest with respect to the research, authorship, and/or publication of this article.
Funding
The author(s) disclosed receipt of the following financial support for the research, authorship, and/or publication of this article: The study was funded by the Spanish Ministry of Education (code RTI2018-093483-B-I00), the European Regional Development Fund (ERDF) “A way of making Europe”, the University of Zaragoza (code JIUZ-2021-SOC-03) and by the Government of Aragon (code S38_20R).