
Abstract
Background
In computer vision, image segmentation is crucial with applications ranging from autonomous driving to medical imaging.
Objective
To provide reliable segmentation across varied datasets, this study assesses the performance of an image segmentation model based on SegNet.
Method
Using a five-fold and a K-fold cross-validation method, the SegNet model is thoroughly validated. Intersection over Union (IOU), Dice Coefficient, Precision, Recall, Accuracy, and loss metrics are measured in the study to assess how well the model performs and is optimized throughout training.
Results
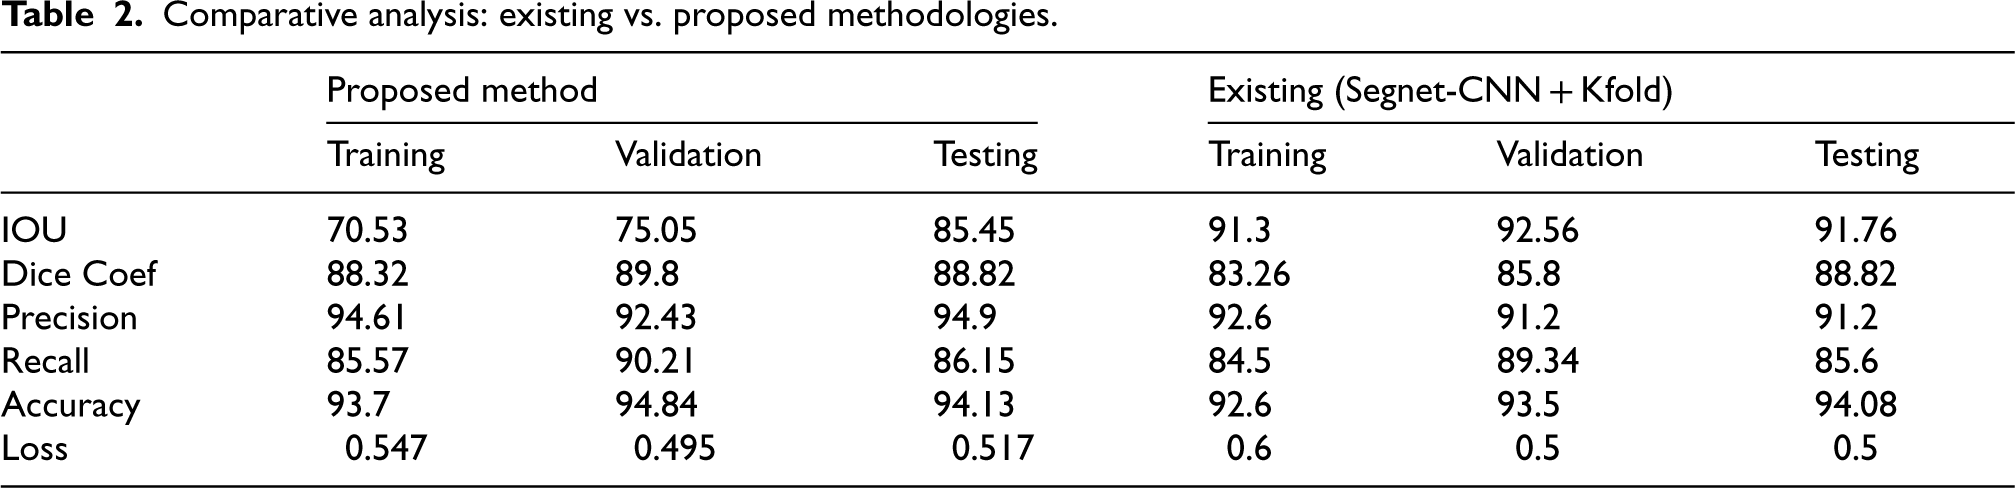
The SegNet model consistently performs well throughout the folds, with Dice Coefficient values ranging from 88.32% to 89.8% and IOU scores ranging from 94.53% to 95.05%. The model's dependability is confirmed by metrics like precision, recall, and accuracy, all of which often exceed 90%. Loss values between 0.495 and 0.547 show that training optimized the system effectively.
Conclusion
By enhancing the validation reliability, the K-fold cross-validation method highlights by what means the SegNet model segments objects in images across a range of datasets. These outcomes strengthen the confidence in the model's ability to generalize and highlight its potential for several practical uses in image segmentation.
Keywords
Introduction
The global incidence of skin cancer has seen an alarming upward trajectory, a phenomenon closely tied to several environmental factors. Excessive exposure to ultraviolet radiation, shifting climatic patterns, and the depletion of the ozone layer have been identified as significant contributors to this concerning rise. Skin cancer now holds the unfortunate distinction of being the most prevalent form of cancer worldwide. It manifests primarily in two varieties – non-melanoma and melanoma. Staggering statistics reveal that in 2018 alone, over one million new cases of non-melanoma skin cancer were reported globally, while melanoma skin cancer accounted for approximately 132,000 reported cases during the same period. Epidemiological evidence paints a grave picture, indicating that one in every three cancer diagnoses relates to skin cancer. Moreover, estimates by the highly esteemed World Health Organization suggest that a startling one in five individuals in the United States will eventually develop skin cancer over their lifetime. Advances in high-resolution imaging and artificial intelligence algorithms have made it possible for skin cancer patients in the United States to receive earlier and more accurate detection, which has a substantial positive impact on their prognosis. Timely interventions are essential for effective therapy, and these innovations make that possible.
The projected 10% depletion of the Earth's ozone layer is anticipated to trigger a substantial global increase in the incidence of skin cancers, with an estimated 4500 additional cases of melanoma and 300,000 cases of non-melanoma skin cancers. Notably, melanoma, a particularly virulent and lethal form of skin cancer, accounts for approximately 75% of all skin cancer-related mortalities, underscoring its status as a significant public health concern of grave import. To target the environmental causes of skin cancer, some actions are being taken into account, such as conducting public awareness campaigns, regulation of tanning beds, environmental protection policies, screening and early detection programs, and research and surveillance. Currently, the diagnostic paradigm for evaluating suspected skin lesions relies predominantly on manual visual examination and assessment by medical professionals. However, early detection of these malignancies can substantially mitigate the complexity and costs associated with their treatment. Recent advances in deep convolutional neural networks present a promising avenue for more effective analysis and classification of various skin cancer pathologies. This emerging artificial intelligence technology holds the potential to expedite and enhance the screening and evaluation processes for skin lesions, thereby potentially revolutionizing the field of skin cancer diagnosis and treatment modalities.
Literature survey
An advanced classifier using Convolutional Neural Networks (CNNs) was introduced by Brinker and Hekler, 1 which can accurately classify photos of skin cancer like the knowledge of dermatologists. Through the use of portable gadgets, this discovery holds the promise of life-saving diagnostics outside of hospitals. Additionally, skin lesion classification has shown CNNs to be efficacious. In comparison research, CNNs outperformed SVM, VGG16, and ResNet50, which produced accuracy rates of 83.4%, 82.4%, and 84.31%, respectively, in the diagnosis of skin cancer with machine learning algorithms, yielding an impressive 97.6% accuracy rate (reference 2 ). By figuring out a mapping from low to high resolution, Yang et al. (reference 3 ) presented a deep learning method for improving single photos. Their technique uses CNNs to perform this mapping, producing high-resolution outputs from low-resolution input images. Notably, conventional super-resolution techniques based on sparse coding can also be understood as deep CNNs. Deep CNNs provide better picture improvement capabilities despite their simplified architecture. Enhancing diagnostic accuracy, early detection, raising efficiency, scalability, diagnostic consistency, resource optimization, and cost-effectiveness are the potential benefits of integrating deep CNN-based diagnostic systems into existing healthcare workflows for skin lesion evaluation.
Convolutional neural networks employ visual texture and structure for picture classification, as demonstrated by Tamura et al. 4 They propose that preprocessing methods for image enhancement can raise the general quality of images and increase CNN efficacy. Ly et al. 5 offer CNNs that imitate picture enhancement and restoration to promote image categorization rather than human perception, in contrast to the current image enhancement strategies that typically try to improve human perception.
Medical image segmentation is an essential component of various medical analyses. Examples include skin lesion segmentation for early melanoma detection in dermoscopic images,6,7 optic disc and cup segmentation and blood vessel segmentation for identifying structural details in retinal images,8,9 breast lesion segmentation for auxiliary diagnosis in ultrasound imaging,10,11 and lung segmentation for organ localization in computed tomography (CT) scans.12,13 Traditionally, physicians manually segment these medical images, but this process is labour-intensive, subjective, and time-consuming due to the intricacies present, such as indistinct boundaries, ambiguous regions, and shadow artefacts. Consequently, there is an urgent need for highly accurate and reliable computer-aided segmentation approaches 14 to overcome these challenges.
The application of machine learning techniques for skin cancer classification has been extensively investigated in various studies, each employing different feature extraction methodologies. Certain studies extracted features using the ABCD rule, GLCM, and HOG from a dataset comprising 328 benign melanoma images and 672 melanoma images sourced from the ISIC collection. 15 Implementations of SVM classifiers yielded a high accuracy of 97.8% and an AUC of 0.94, while KNN classifiers exhibited a sensitivity of 86.2% and a specificity of 85%. 16 Other approaches explored unsupervised learning with the k-means algorithm 17 for skin cancer identification and categorization, achieving a classification rate of 52.63%. However, SVM outperformed both K-means and Back Propagation Neural Network, with accuracy levels ranging from 80% to 90%. 18 In contrast, a proposed method 19 focused on deep learning, specifically CNN methods, for skin lesion classification, utilizing transfer learning algorithms such as Inception V3, Resnet, VGG-16, and Mobilenet. Data augmentation and normalization techniques were also incorporated. 20 Supervised learning methods were employed 21 for skin lesion categorization, attaining an accuracy of 86% with computer-aided diagnosis and MAP estimate techniques. These methods encompassed lesion segmentation, hair detection, and pigment network detection. 22 The increasing number of cancer cases and fatalities highlights the critical need for early detection and treatment. Computer-assisted programs play a vital role in identifying diseased cells in high-resolution histopathological images at an early stage. Advanced segmentation techniques, including k-Means, Fuzzy C-Means, and superpixel segmentation algorithms like SLIC, Quickshift, Felzenszwalb, Watershed, and ERS, have shown improved performance over baseline methods. In particular, the Quickshift and SLIC approaches delivered outstanding results in the F-M test. 23
Methodology
Dataset
The increased incidence of melanoma has prompted the development of computer-aided diagnostic (CAD) systems specifically designed for the classification of dermoscopic images. The PH2 dataset was created to enable comparative evaluations of segmentation and classification methods for dermoscopic pictures. By benchmarking performance, training, and validation, facilitating research collaboration, supporting algorithmic development, and encouraging transparency, the development and testing of computer-aided diagnostic (CAD) algorithms for melanoma categorization are assisted by standardized datasets like PH2, which also improve patient outcomes and care The PH2 dataset comprises dermoscopic images acquired from the Dermatology Service of Hospital Pedro Hispano in Matosinhos, Portugal. This dataset is an excellent resource for dermatology and medical imaging researchers, enabling them to effectively create, refine, and evaluate their algorithms. Alternatively, it also delivers a consistent standard for the evaluation of image analysis algorithms, and it includes high-quality dermoscopic images, which are essential for the accurate diagnosis and analysis of skin lesions. A variety of skin lesions, including benign, malignant, and dysplastic nevi, have also been included in this dataset.
Image preprocessing
A critical step that is required to enhance the precision and functionality of our learning module is image preprocessing from the dataset. This process involves a series of methods for integrating, cleaning, normalising, and transforming image data.
Image pre-processing plays a crucial role in enhancing the overall accuracy and reliability of computer-aided diagnostic systems for melanoma classification through Noise Reduction, Normalization, Image Resizing, Color Space Conversion, and Segmentation. In general, these pre-processing steps can lead to extra precise and reliable melanoma detection and classification.
Figures 1 and 2 shows how our preprocessing techniques affected the Image Datasets and how they changed from their original state to the pre-processed state. The preprocessing processes outlined in the figures are as follows: Data Preprocessing Figures 3–7.
Architecture of segnet.
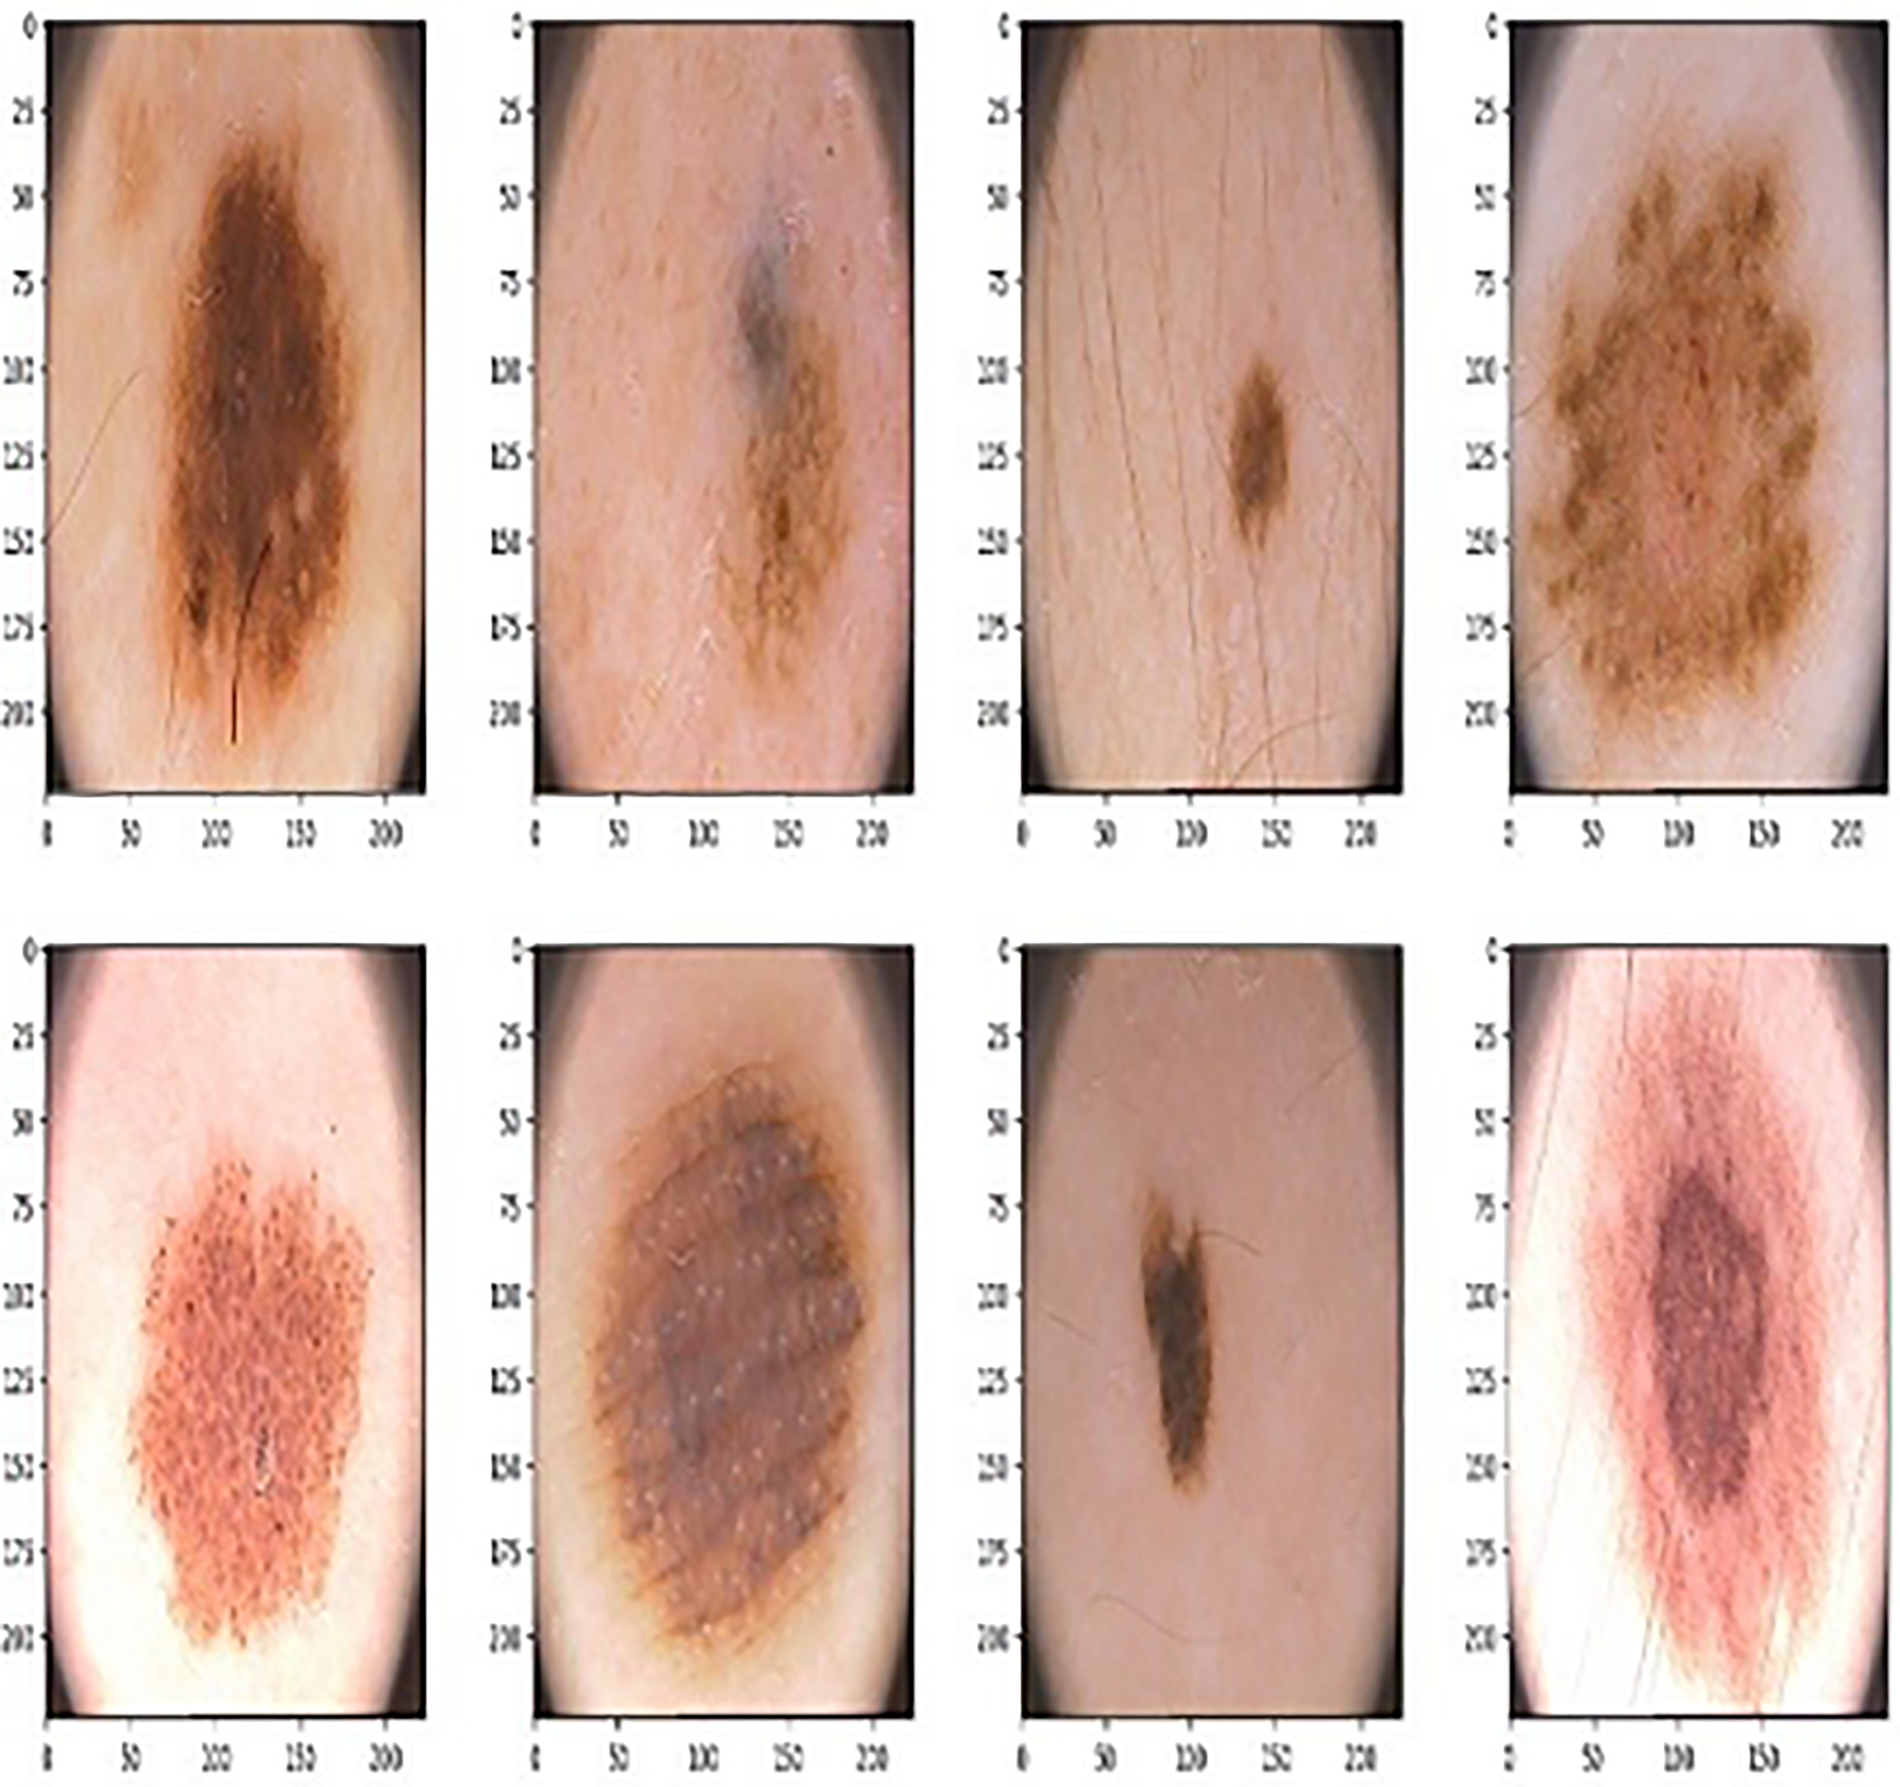
Input image dataset.
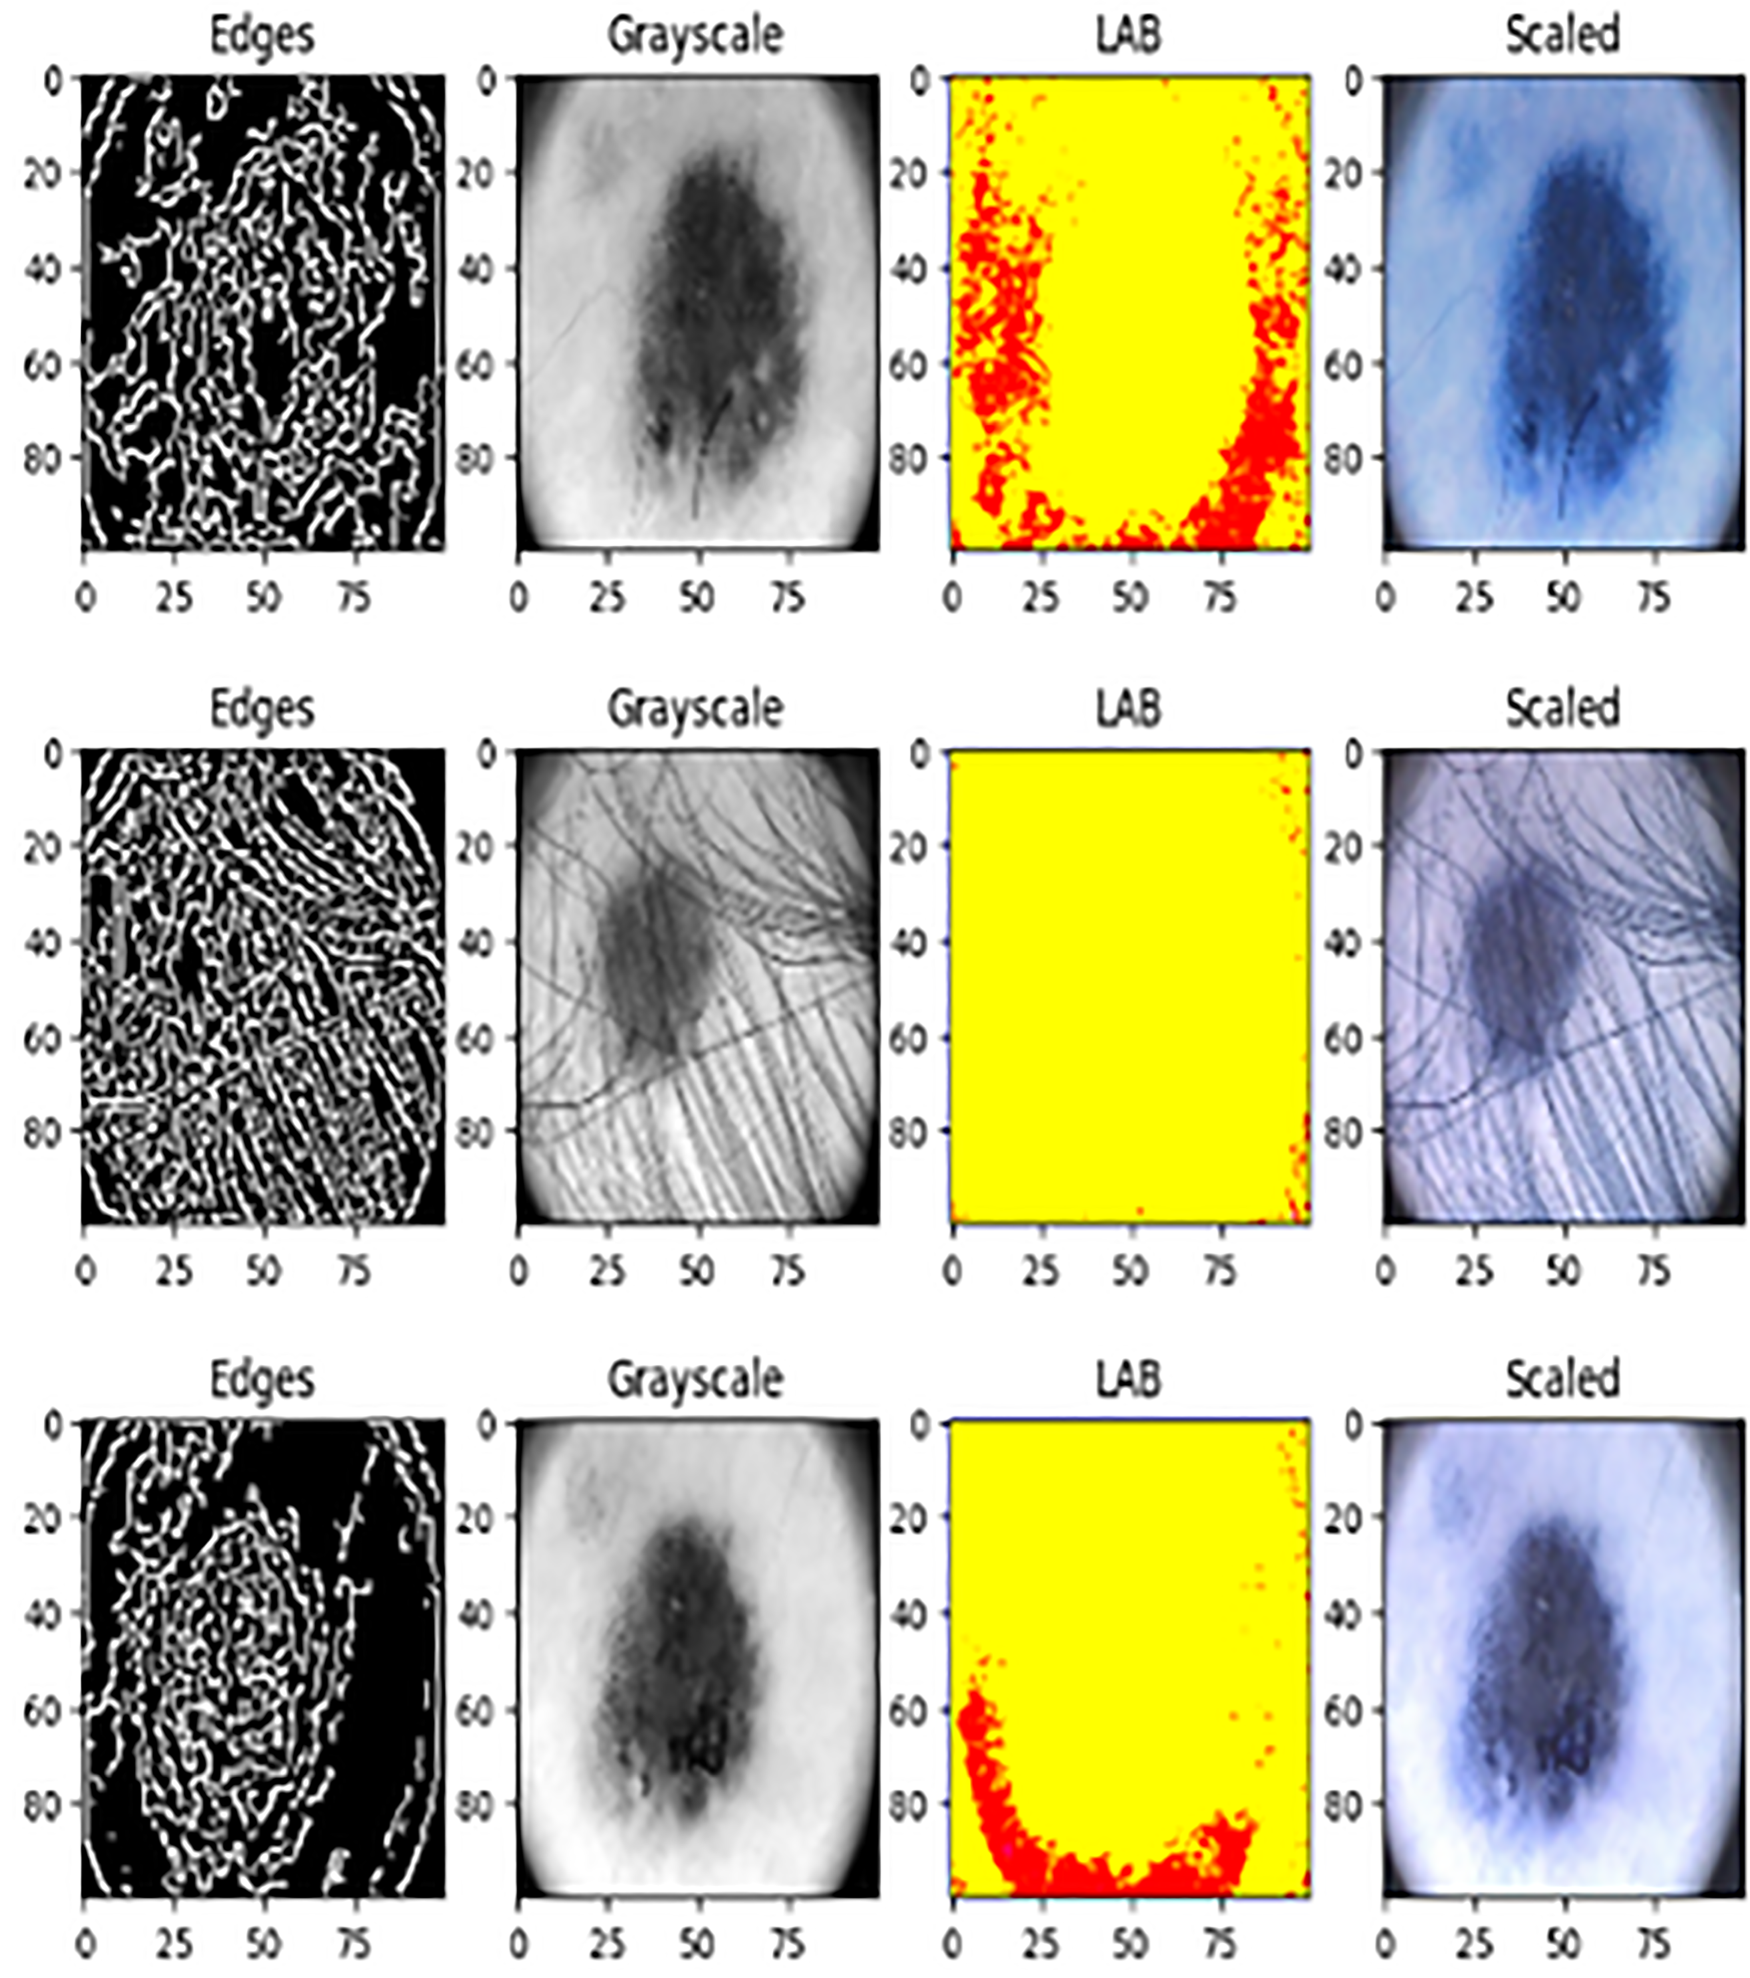
Processed image dataset.
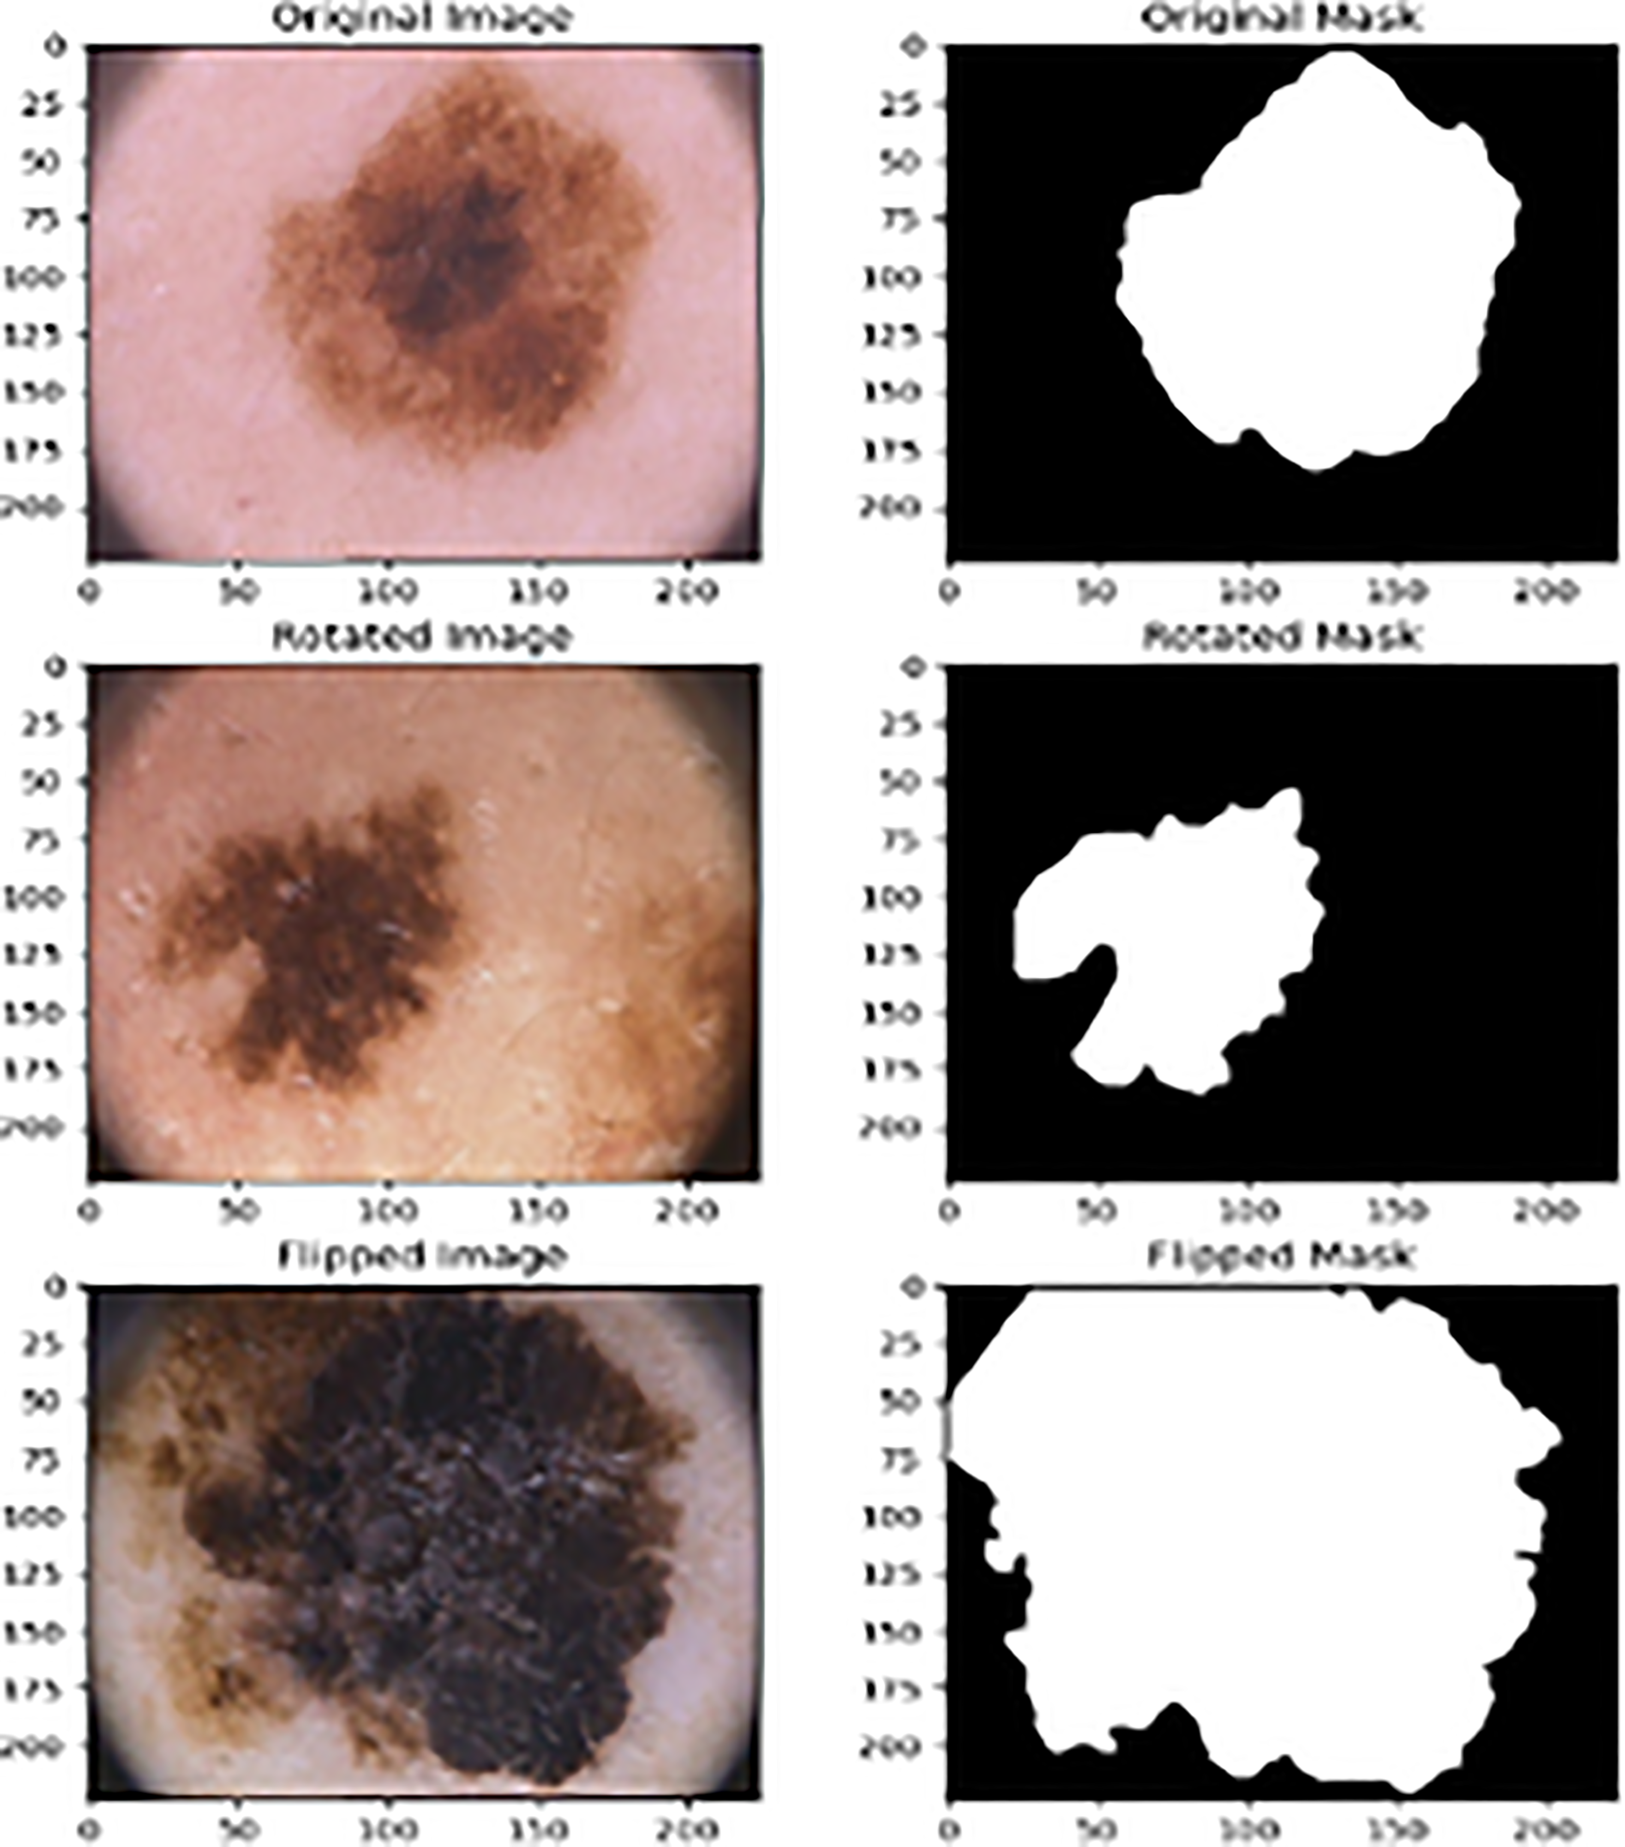
Image augumentation.

Segnet with detailed layers.
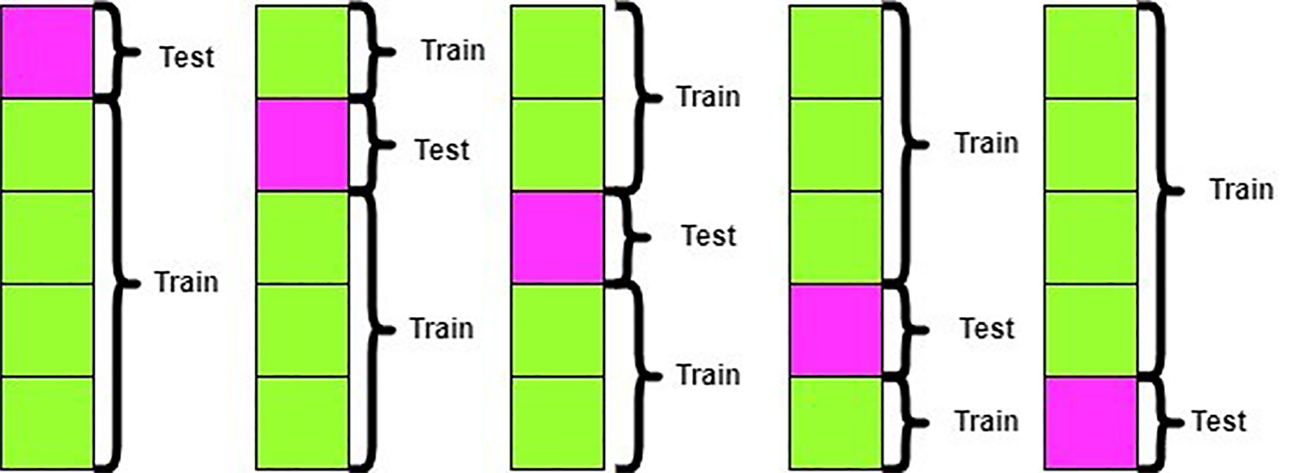
5-fold cross-validation procedure for SegNet model training and evaluation.
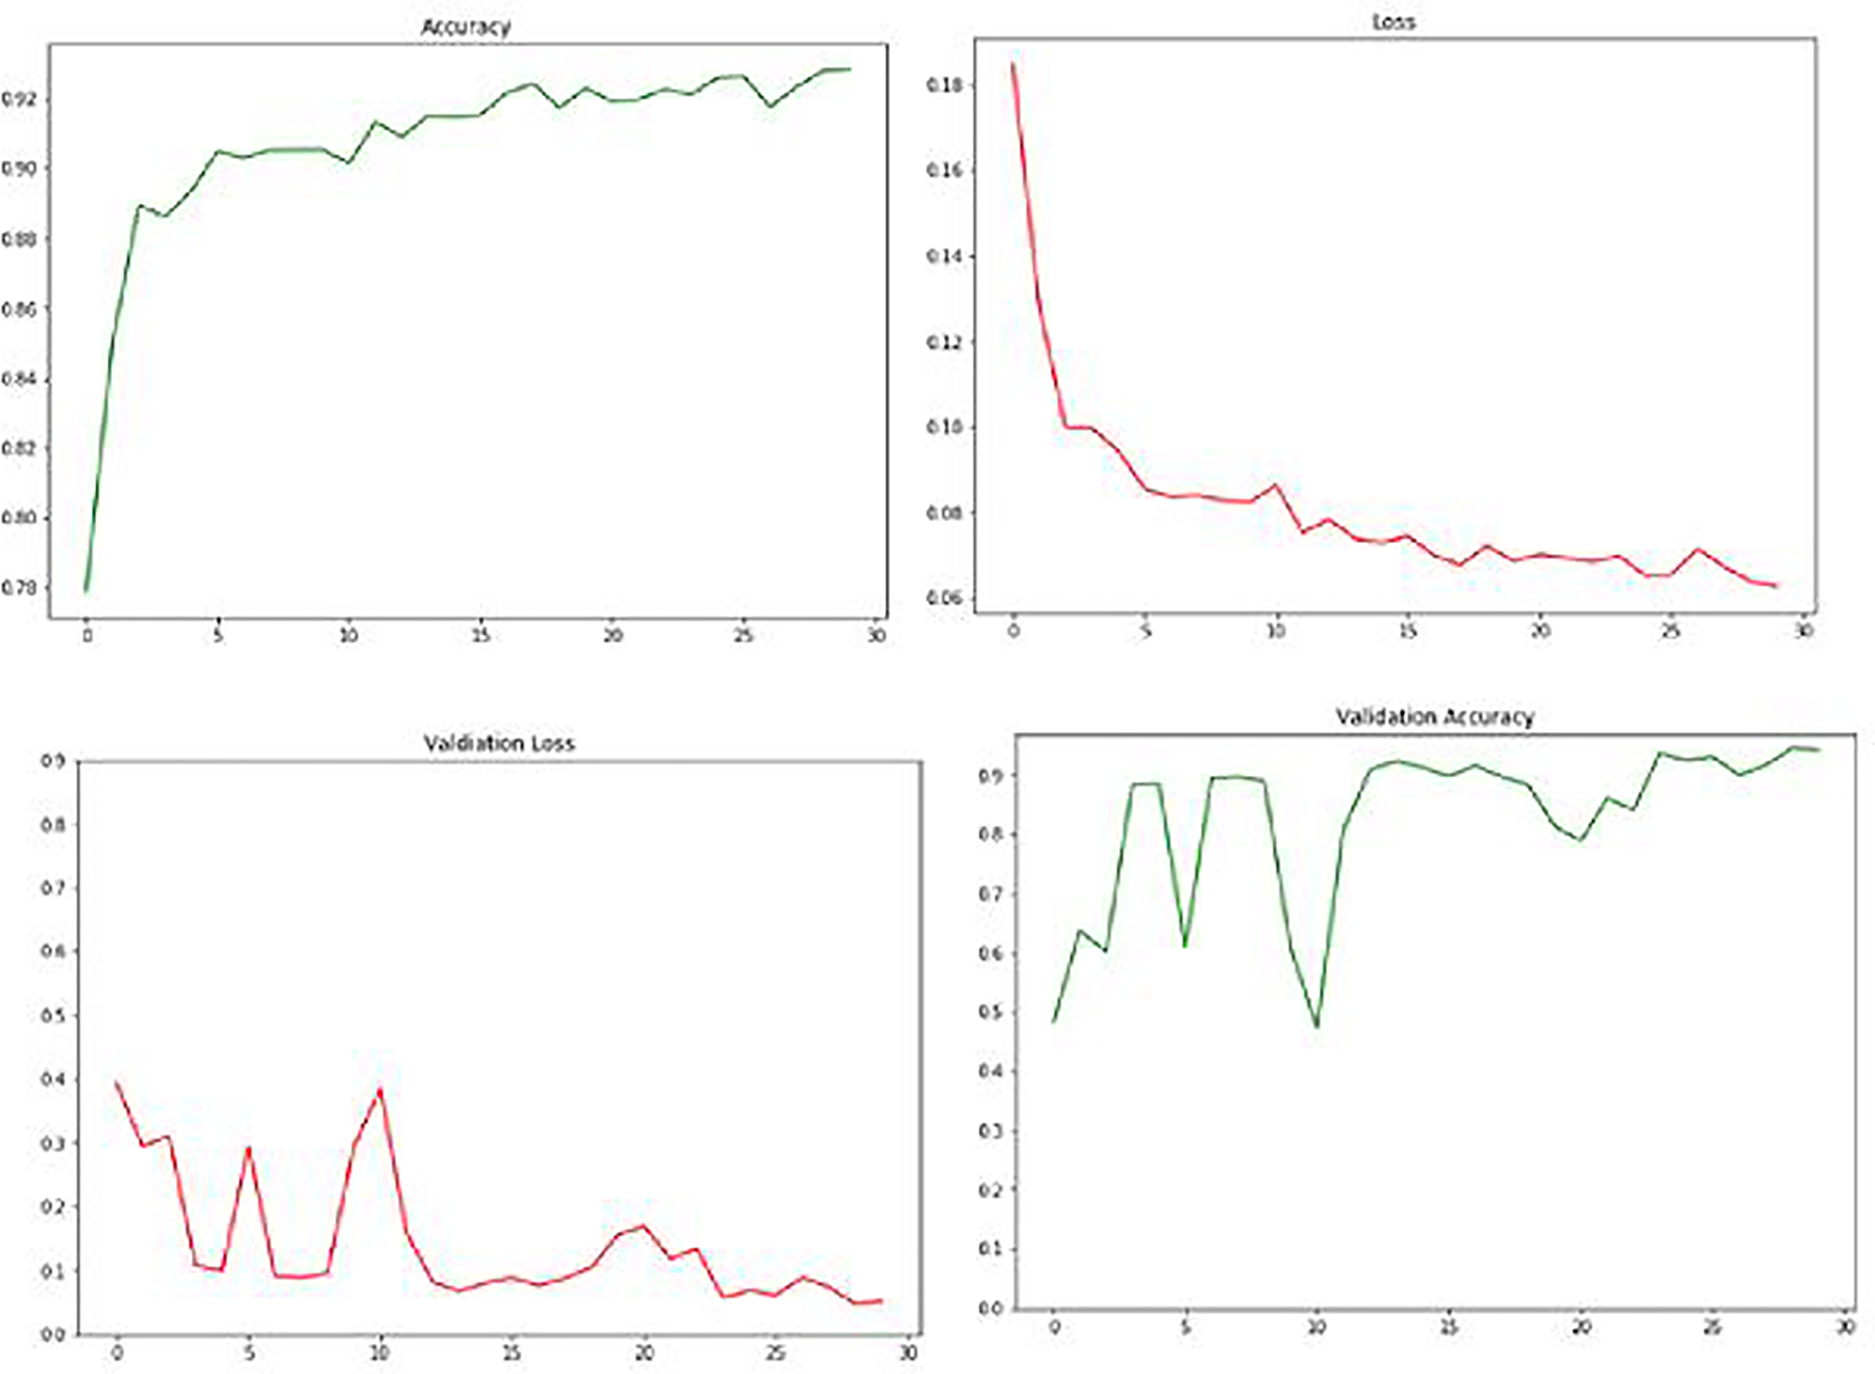
Graphical depiction of accuracy and loss.
Processed image
Normalising Picture Size: To guarantee consistent measurements, we resized every image in the collection to 256 × 256 pixels. Resizing was crucial to provide uniformity and compatibility with our selected model. 24
The goal was to decrease noise for better clarity and highlight essential components in the image by sharpening it using image filters. This approach enables the model to extract meaningful information from the data more effectively. 25
Photographs captured in the BGR colour space have been transformed into the RGB colour space. This conversion helps accurately interpret image features and ensures colour stability. Transforming the photographs from BGR to RGB color space to be compatible with image analysis programs, accurately represent color, and extract features from images. The pros of the converting the images to the RGB color space in terms of ensuring color stability is that the RGB is a commonly utilized color model, color representation is consistent on a range of platforms and devices. Conversely, the cons imply that converting from BGR to RGB may lead to slight alterations in color representation, which could affect the model's ability to learn the specific features if not appropriately handled. Though converting images to the RGB color space enhances the model performance and color stability in general, it is essential to consider the potential disadvantages associated with information loss and higher preprocessing pipeline complexity.
To ensure color stability throughout the conversion of the BGR color space into the RGB color space, the following approaches are commonly used: channel rearrangement, data type consistency, color calibration, and testing and validation.
Image scaling involves adjusting the pixel intensity levels of an image to conform to a specific range. Standardising pixel values enhances model convergence in the training process. 26
Image tagging is essential for precise and dependable supervised learning. We ensured precise categorization of the images in the dataset, a crucial step for effective model training. 27 Image tagging is important to ensure accurate and reliable supervised learning outcomes because it establishes a clear association between input data and expected outputs, improves model accuracy, supports data diversity, and enables evaluation and research.
Picture augmentation techniques like random rotation and horizontal flipping improve the resilience and generalisation abilities of deep learning models trained on image data. 28 These methods enhance model accuracy, especially when working with restricted or uneven datasets. 29
Random rotation
The
The
Image augmentation
The img\_augmentation function integrates the random rotation and horizontal flip operations to augment the dataset. Image augmentation is a critical technique in deep learning environments characterized by the limited availability of training data. Through the application of random transformations, such as rotation and flipping, to the input images, the augmented dataset presents a more diverse and representative collection of examples for training purposes. This methodology contributes to mitigating overfitting and enhancing the model's performance on unseen data.35–37 Random transformations such as rotation and flipping generate a more diverse and representative training dataset, which is critical for constructing robust models that generalize well to new, previously unknown data. This eventually leads to better performance in image segmentation and object recognition tasks.
Number of epochs (epochs\_num)
Model save name (savename)
Training images (x\_train)
Training labels (y\_train)
Validation images (x\_val)
Validation labels (y\_val)
Trained model
Training history
1.1: Define input layer with shape (192, 256, 3)
1.2: Define encoding layers with Conv2D, Batch Normalization, and ReLU activation
1.3: Apply max pooling after every two encoding layers and save the skip connections
1.4: Define decoding layers with Conv2DTranspose, Batch Normalization, and ReLU activation
1.5: Concatenate skip connections with corresponding decoding layers
1.6: Define the output layer with sigmoid activation and reshape to (192, 256)
2.1: Compile the model with SGD optimizer, binary cross-entropy loss, and evaluation metrics (iou, dice\_coef, precision, recall, accuracy)
3.1: Facilitate the model's learning process by utilizing the training data and validation data.
3.2: Define the values for the number of epochs, batch size, and verbose mode parameters during model training.
3.3: Save the training history
4.1: Save the trained model with the specified save name
5.1: Return the trained model and training history
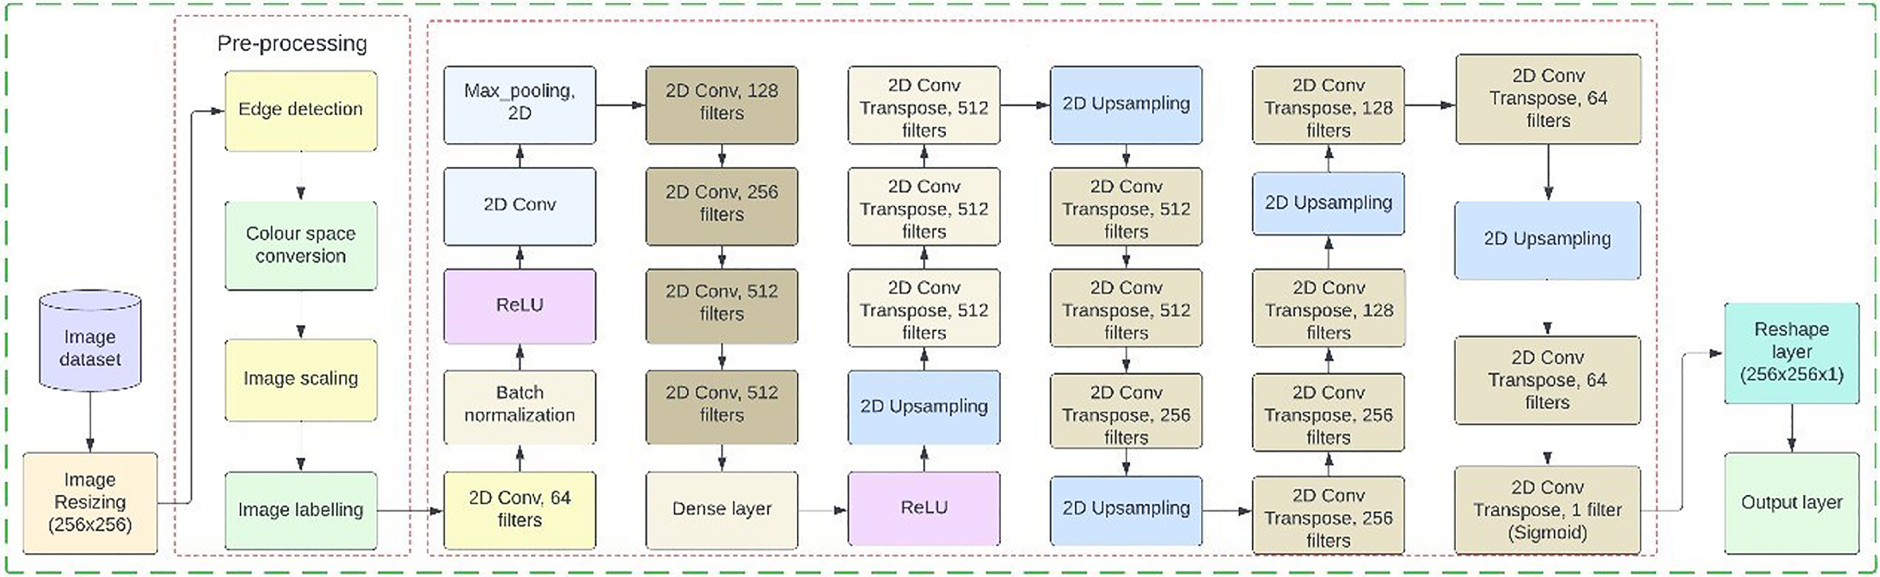
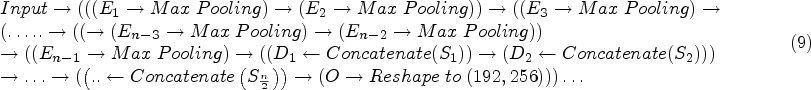
SegNet, a convolutional neural network (CNN), is designed explicitly for semantic segmentation tasks. It operates by categorizing pixels within an image into distinct classes or groups, a process known as semantic segmentation. To achieve pixel-wise segmentation, SegNet employs an encoder-decoder architecture. The SegNet framework's encoder-decoder architecture is precisely developed to provide pixel-wise segmentation by efficiently capturing and recreating features from input images. The encoder component collects hierarchical feature representations via a sequence of convolutional layers, gradually reducing spatial dimensions while increasing feature depth. This technique captures important high-level semantic information. This architecture facilitates the extraction of salient feature representations from the input image, subsequently mapping these features back.38,39 It employs convolutional layers for hierarchical feature learning, pooling for dimensionality reduction, and upsampling with skip connections for exact reconstruction of the segmented output to effectively facilitate feature extraction and mapping. The architecture allows for the effectual usage of features learned at different levels, refining the accuracy of segmentation Tables 1 and 2.
Layers of convolution and deconvolution.
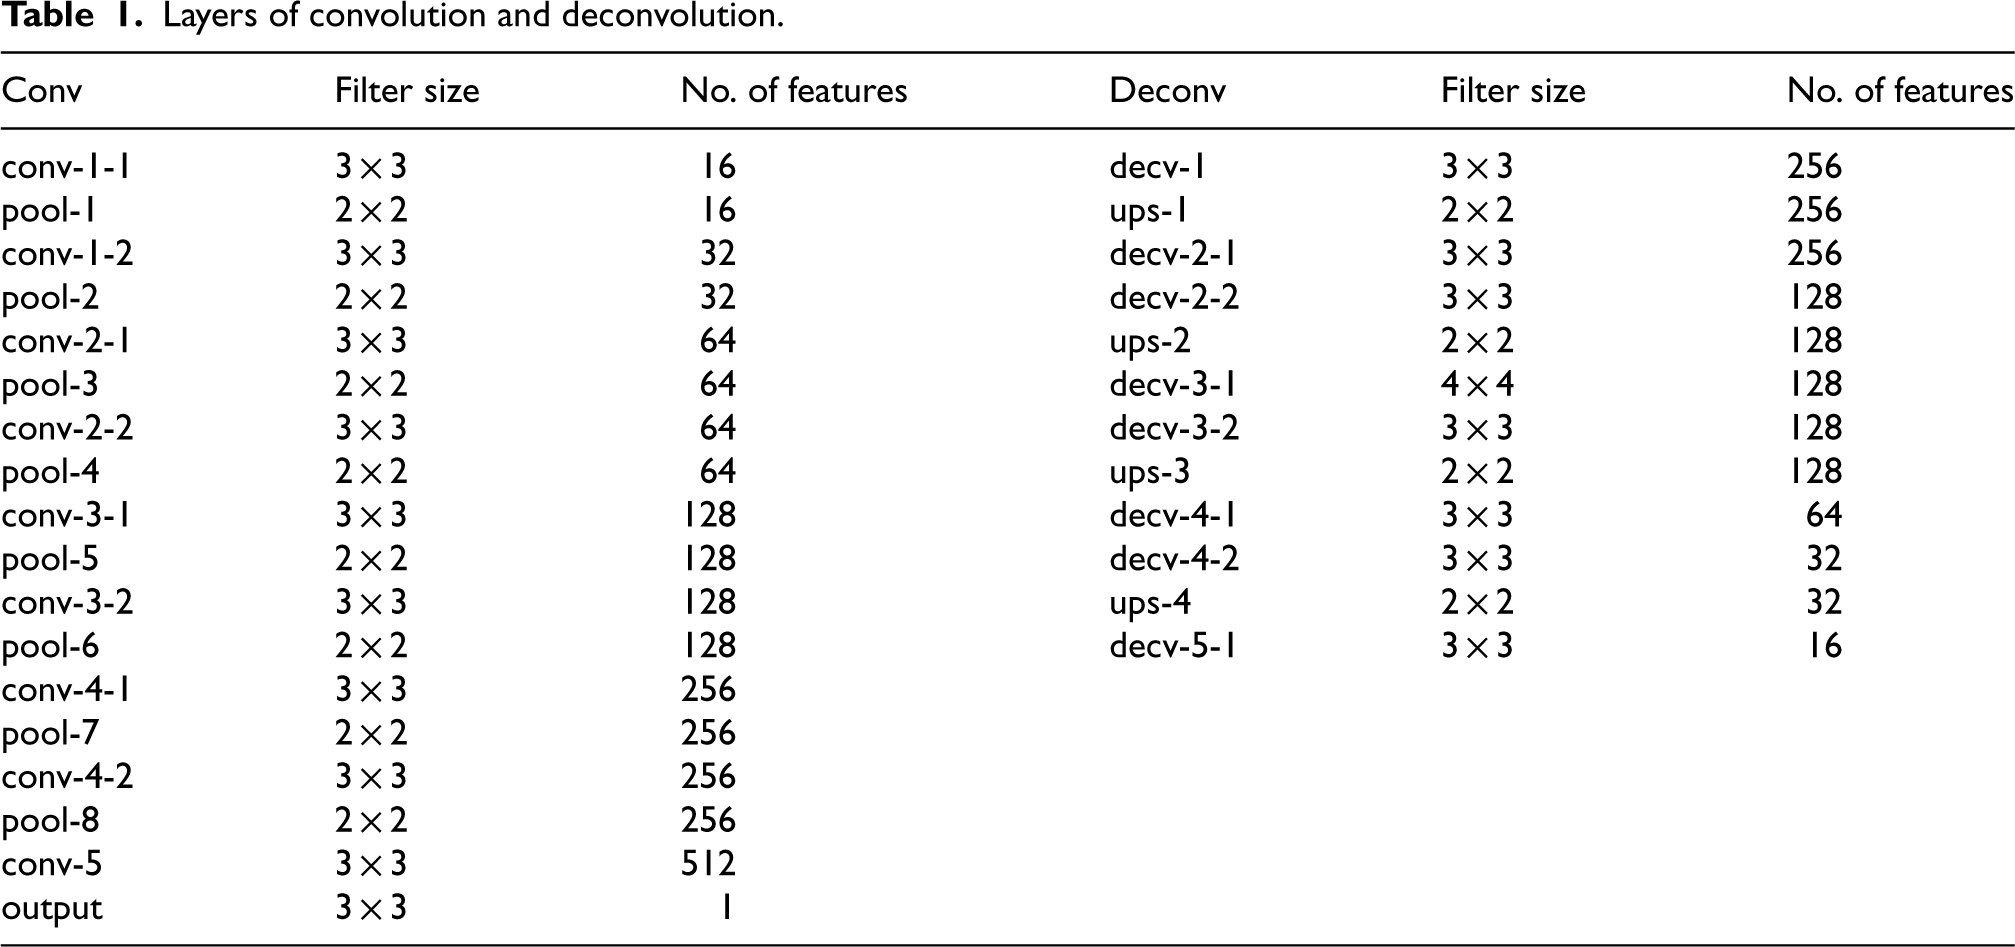
Layers of convolution and deconvolution.
Comparative analysis: existing vs. proposed methodologies.
Encoding Layer:


In the equation, 
Skip Connection:

Decoding layer:


The convolution 2D applies a convolutional filter to the input feature to extract the patterns. It is denoted as Conv2D (X, W), where W represents the learnable convolutional filter. The process of Conv2D in extracting patterns from input features is that it applies the learnable filters to the input image, convolving across its spatial dimensions (height and width). This operation produces feature maps that underscore the specific patterns. On the other hand, the central role of such a layer is that it extracts the fundamental features like edges, textures, and shapes. Overall, SegNet effectively extracts and maps features from input images, enabling precise pixel-wise segmentation by utilizing the Conv2D layers. The batch normalization normalizes such operation and normalizes the activations of the previous convolutional layer to stabilize and accelerate training. The batch normalization operation is denoted as BatchNorm(X). Its importance is that it decreases internal covariate shift by preserving constant activation distributions, helps with quicker convergence, and improves model performance. Batch normalization standardizes the outputs of the preceding convolutional layer by first computing the mean and variance of the activations across a mini-batch. The mini-batch statistics were utilized due to the inference, running averages of the mean, and calculated variance. At the same time, training is applied, ensuring consistent model behaviour is based on unseen data. This process or procedure stabilizes training, leading to faster convergence and enhancing the performance of the deep neural networks.
On the contrary, it significantly mitigates internal covariate shifts during training by standardizing the inputs to each layer, which decreases the network's sensitivity to changes in the distribution of inputs as parameters are updated. The Relu operation introduces non-linearity to the network by applying the Rectified Linear Unit (ReLU) activation function to the normalized features, denoted as ReLU (X). It permits the network to simulate non-linear interactions, which aids in the learning of complicated patterns and helps to mitigate the vanishing gradient issue during training. The central purpose of implementing non-linearity in a network, such as through the ReLU activation function, is to enable the network to learn and model complex relationships in the data. The encoding layer can be denoted as follows:
X represents the input features W represents the learnable convolutional filter E(X) represents the output feature after applying the encoding layer operations
n represents the total number of encoding layers. n//2 represents integer division, giving the index of the last encoding layer from which a skip connection is made. The arrows indicate the flow of data through the layers.
→→ denotes the encoding and max pooling operations. ←← Denotes the decoding operation. Concatenate (Si) represents concatenating the skip connection from the encoding layer with the decoding layer Di. The output layer O performs the final prediction, followed by reshaping to match the desired output shape (192, 256). Output layer definition, activation function, reshaping, final prediction generation, post-processing (if relevant), and output returns are the critical steps in the final prediction process performed by the output layer.
In the above equation,
For cross-validation of the SegNet model on the picture dataset, the dataset was split into five equal partitions to ensure a robust and reliable evaluation of the model's performance. Furthermore, cross-validation is crucial when evaluating machine learning models, such as the SegNet model used on picture datasets, because it reduces overfitting and yields a dependable estimate of generalization performance. The model was trained five times, each time using four partitions for training and the remaining single partition for validation, such that each partition was used exactly once for validation. This ensured that every dataset example was used for training and validation across the five iterations. Consequently, the model undergoes training on different data combinations, ensuring comprehensive learning and assessment across the entire dataset. Performance metrics, such as accuracy, loss, and various evaluation scores, are computed for each fold. By averaging these metrics’ overall folds, a robust estimate of the SegNet model's generalization performance is obtained, minimizing the risk of overfitting and enhancing confidence in its efficacy across diverse datasets. The SegNet model's generalization performance is closely linked to its architecture and training techniques, which collectively help minimize the risk of overfitting. The SegNet model's architecture, combined with effective data augmentation, regularization techniques, and robust validation strategies, creates a strong framework for enhancing generalization performance while minimizing the risk of overfitting. Both the existing and the proposed systems were implemented and compared below.
From the above table, these values are inferred when compared with the traditional methodology.
Defining evaluation metrics
IOU (intersection over union)
Intersection over Union (IOU) estimates the overlap between predicted and ground truth regions by measuring the intersection ratio to the predicted and ground truth regions’ union. Moreover, IoU plays a crucial role in quantifying the accuracy and precision of model predictions, mainly in tasks such as image segmentation and object detection. It is often referred to as the Jaccard index or similarity coefficient. It is widely used in information retrieval, object detection, and image segmentation.

Dice coefficient
The Dice coefficient measures the overlap between predicted and ground truth regions. It is calculated as twice the ratio of the intersection to the sum of the areas of the predicted and ground truth regions.

Precision is the ratio of correctly predicted positive observations to the total predicted positive observations.

Total True Positives- True positive predictions + false positive predictions
It's calculated as true positives divided by the sum of true and false positives.
High precision indicates that an instance predicted as positive is indeed positive. The precision values on training, validation, and testing sets are 94.61%, 92.43%, and 94.90%, respectively. These are also high values.
Recall is the ratio of true positive predictions to all actual positive instances, calculated as the ratio of true positives to the sum of true positives and false negatives.

Accuracy is the ratio of correct predictions to the total observations, calculated as the sum of true positives and negatives divided by the total number of samples.

Compared to traditional methodologies, the proposed model performed better according to these evaluation results.
The above diagram shows the Visualizations for the loss, accuracy, validation loss, and validation accuracy. From the diagram, it is inferred that the loss gradually decreases and accuracy and validation increase.
The SegNet-based image segmentation model demonstrated strong performance and was validated through extensive K-fold cross-validation. The model consistently exhibits superior performance, attaining scores exceeding the 90th percentile across evaluation metrics such as Intersection over Union (IoU), Dice Coefficient, Precision, Recall, and Accuracy measures, thereby demonstrating its proficiency and efficacy in accurately segmenting objects in photos. As indicated by the reported loss values, the optimisation process during training improves the model's efficiency. The K-fold cross-validation approach enhances validation, increasing confidence in the model's capacity to generalise across different datasets. The results highlight the SegNet model's capability as a dependable tool for image segmentation, showcasing robust performance and durability. This report comprehensively assesses the SegNet-based image segmentation model and pinpoints possible topics for further development. Firstly, evaluating the model's efficacy on larger and more diverse datasets might offer a deeper understanding of its generalization capabilities across a broad spectrum of real-life contexts. Investigating the adaptability of the SegNet model in many domains beyond those examined in this study could uncover its potential applications in a broader range of fields.
Furthermore, advanced techniques such as transfer learning or attention mechanisms could enhance the model's efficacy and efficiency. Exploring the interpretability of the model's segmentation outputs and their influence on future tasks could be a fruitful direction for future research. Ongoing research endeavours and further refinements to the SegNet model architecture carry the potential to propel advancements in the domain of image segmentation algorithms and their diverse practical applications.
Footnotes
Funding
The authors received no financial support for the research, authorship, and/or publication of this article.
Declaration of conflicting interests
The authors declared no potential conflicts of interest with respect to the research, authorship, and/or publication of this article.