
Abstract
Background
Effective brain tumour therapy and better patient outcomes depend on early tumour diagnosis. Accurate diagnosis can be hampered by traditional imaging techniques’ frequent struggles with low resolution and noise, especially in Low Dose CT scans.
Methods
Using the Lucy-Richardson technique for picture deblurring, Adaptive Histogram Equalisation, and pixel normalization to lower noise and enhance image quality are some of the pre-processing stages that are part of the suggested strategy. Main characteristics from the processed pictures are then retrieved, including mean, energy, contrast, and entropy. Following the feeding of these characteristics, the MLCED-Net model is used for classification and segmentation tasks. It utilises a 15-layer deep learning architecture.
Results
The MLCED-Net model outperformed previous techniques by achieving an amazing accuracy rate of 98.9% in the detection of brain tumours. The suggested procedures were effective, as seen by the significant increases in image quality that the Peak Signal-to-Noise Ratio (PSNR) values showed after post-processing.
Keywords
Introduction
CT imaging is a critical diagnostic tool in the field of medical imaging, particularly for brain tumours. 1 However, traditional CT scans frequently result in increased radiation exposure, raising the risk of cancer in patients.2,3 High levels of ionizing radiation are used in traditional CT scans, which increases patient exposure and the risk of radiation-induced malignancies. This danger is increased by repeated scans, particularly to monitor brain tumours in susceptible groups such as children and young people. Low-dose CT imaging has emerged as an alternative to traditional CT scans for brain tumour detection to address this concern. Low-dose CT imaging, which uses less radiation while maintaining image quality, has the potential to reduce patient radiation exposure. 4 Low-dose CT (LDCT) is essential for the identification of brain tumours because of its little radiation exposure and excellent image detection. When used in recurrent imaging settings, it is beneficial because excessive doses of radiation can be harmful to health, especially to vulnerable populations like paediatric patients. Sophisticated processing methods ensure early tumour detection.
Advanced computer vision techniques are crucial in improving low-dose CT imaging for brain tumour identification. 5 Image deblurring strategies, such as the Lucy-Richardson method, reduce any noise introduced during image acquisition. Furthermore, techniques such as Decorrelation Stretching and complexity feature extraction are used to reveal pivotal features within images, thereby improving tumour detection capabilities.6,7 Decorating By lowering band or pixel brightness, stretching improves contrast in medical imaging, particularly for brain tumour detection. Using fractal dimension analysis or entropy-based metrics, complexity feature extraction examines structural complexity, such as texture and irregularity. With CT scans, these methods can precisely detect tumours and differentiate between normal and malignant areas.
Deep learning methodologies have demonstrated their capabilities in image classification and object recognition.8,9 The novelty of the “Multi-Layered Chroma Edge Deep Net (MLCED-Net)” method emerges here. This breakthrough combines multi-layered autoencoders, colour-based operations, edge detection techniques, and deep learning components into a cohesive framework. The MLCED-Net framework uses chroma-based operations, edge detection algorithms, and multi-layered autoencoders to improve brain tumour diagnosis in low-dose CT images. It is versatile for use in both MRI and ultrasound applications and enhances visualization, segmentation, and picture quality. A holistic approach like this can revolutionize image analysis, feature extraction, and image compression, outperforming the results of isolated techniques. Using feature extraction approaches, the study improves the visual differentiation of brain tumours in medical imaging. Effective processing by deep learning models includes wavelet transformations, decorrelation stretching, fractal dimension, entropy measurements, Gabor filters, Principal Component Analysis, and Gabor filters. This is where the proposed “Multi-Layered Chroma Edge Deep Net (MLCED-Net)” method shines, facilitating the extraction of intricate patterns, vital details, and nuanced information from medical images.
Medical imaging modalities such as MRI and ultrasound may be used to customize the MLCED-Net model; modifications are necessary for MRI scans, soft tissue architecture, tumour forms, and textures. Tumour identification and organ abnormalities need ultrasound datasets, whereas MRI pictures require convolutional and disposable filters. This contribution ushers in a new era of medical imaging and computer-aided diagnosis systems. To begin, the proposed approach addresses the need for deep learning techniques tailored for processing low-dose CT images, particularly in the field of brain tumour diagnosis. It demonstrates expertise by expertly extracting critical features from low-dose CT images and employing robust machine-learning algorithms for high-precision classification.
Furthermore, the system incorporates various image processing techniques, such as deblurring and adaptive histogram equalization, to improve the quality of low-dose CT images. Deblurring methodologies are extremely important because they eliminate noise and artefacts frequently arising during image acquisition. As a result, the images subjected to analysis are markedly refined, paving the way for more accurate diagnostic insights.
The system's heart lies in its use of the proposed MLCED-Net model, which seamlessly incorporates deep learning into the diagnostic process. This strategic integration allows the system to detect intricate features and structures within low-dose CT images that traditional image processing techniques might miss. As a result, the approach broadens diagnostic capabilities, providing a broader and more nuanced perspective.
Softmax entropy classification precisely pinpoints regions of interest, such as brain tumour regions, and concludes the innovation. The neural network output is transformed into a probability distribution and then subjected to the SoftMax entropy classification algorithm for brain tumour diagnosis. It determines the most likely classification for each pixel or region, provides a probability value to each class based on extracted characteristics, and minimizes entropy loss for better classification accuracy. Evaluating system accuracy lends empirical evidence to its performance, highlighting its potential applications in clinical settings.
In summary, this study's contributions offer a potentially helpful method for applying cutting-edge machine-learning techniques to evaluate low-dose CT images for brain tumour diagnosis. The planned approach can potentially increase clinicians’ diagnostic speed and accuracy, ultimately resulting in better patient outcomes.
The organization of the paper is as follows. In the introduction, we emphasize the value of low-dose CT imaging for diagnosing brain tumours. The second section explores the literature on this subject in depth, highlighting the gaps and difficulties driving our suggested methodology. The third section introduces our ground-breaking method, the Multi-Layered Chroma Edge Deep Net (MLCED-Net). A multi-layered architecture, colour-based operations, edge detection methods, and deep learning components are all included in this model. The main steps of MLCED-Net, including image preprocessing, feature extraction using Decorrelation Stretching and complexity feature extraction, neural network training, and Softmax entropy classification, are depicted in a block diagram. The MLCED-Net framework uses edge-detection techniques and colour-based operations to improve the interpretation of CT scans. It employs edge detection to draw attention to boundaries and structural differences in medical pictures and pseudo-colouring to convert greyscale CT scans into colours, improving its capacity to identify minute changes in tissue density. The use of Sobel edge detection on decorrelated images is also covered in detail, as is the use of the Discrete Cosine Transform (DCT) for hidden layer detection. We conduct experimental research in the fourth section. We describe the dataset and preprocessing procedures before comparing MLCED-Net to earlier methodologies. The novelty of our strategy in terms of accuracy, feature extraction, and compression is highlighted by this comparison. The paper is finally summarized in the fifth section, highlighting the novelty of MLCED-Net, discussing potential ramifications for medical imaging, and suggesting future research directions. The conclusion of the article includes acknowledgements and references. MLCED-Net may be used with various medical imaging modalities to increase diagnostic value and identify similar characteristics. Its general acceptance may be hampered by obstacles, including training difficulty, modality-specific difficulties, data availability, and regulatory barriers, which may cause a delay in its clinical deployment.
Related works
In medical imaging, CT scans are frequently utilized to analyze a variety of diseases. In contrast, the excessive use of CT scans has provoked concerns about radiation exposure, leading to the development of low-dose CT (LDCT) imaging. 10 LDCT imaging is a possible alternative to conventional CT scans11,12 because it reduces radiation exposure without sacrificing diagnostic accuracy. In this literature review, we will investigate implementing various image processing techniques and machine learning procedures to enhance LDCT image quality, particularly in the case of LDCT brain tumour images. How IoT technologies are integrated into healthcare systems has improved patient care. Naresh, K.R.P investigates how an Internet of Things-based health monitoring system processes ECG signals using the Discrete Wavelet Transform (DWT). DWT's time-frequency localization capabilities are essential for practically analyzing non-stationary signals. Signal capture, preprocessing, feature extraction, and real-time IoT-based transmission to cloud servers are all included in the system design. Data reduction and signal clarity improvements are demonstrated via performance measures. 13 Basava R. G. investigates how combining interactive components, real-time feedback, and individualized teaching strategies might improve music education learning experiences using artificial intelligence (AI) and big data analytics. 14 Raj, K. G., the Hadoop Distributed File System (HDFS) Hadoop framework and Improved You Only Look Once version four (YOLO v4) has been used to build a novel technique for identifying small blood cells in acute lymphoblastic leukaemia (ALL). By correcting for class imbalance in the ALLIDB1 dataset, the enhanced YOLOv4 algorithm increases the accuracy of healthy and blast cell identification and recognition. 15
The application of LDCT imaging has attracted considerable interest due to its potential to limit radiation exposure. LDCT imaging has been shown to reduce radiation exposure by up to 90% compared to standard CT scans, making it an attractive option for medical imaging. 16 In addition, LDCT has been demonstrated to be effective in detecting diseases such as lung carcinoma. 17 However, as a result of the reduced radiation exposure, LDCT images frequently exhibit degradation.
Diverse image processing methods have been utilized to enhance the image quality of LDCT images. 18 Deblurring techniques such as blind and non-blind deconvolution have reduced blur in LDCT images. In addition, noise in LDCT images has been reduced by employing denoising techniques such as wavelet-based methods, Wiener filtering, and total variation-based techniques. 19 These techniques have been shown to recover the diagnostic accuracy of LDCT images. Notably, deep learning algorithms have been studied to improve LDCT image value and aid in diagnosis. 20 CNNs and other deep learning models were trained on LDCT images to enhance image quality. 21
Unal et al. (2022) proposed a method 22 standard Deep learning advanced method that does not necessitate training. Reconstruction takes approximately 10 min, whereas the alternative methods (FBP-Filtered Back-Projection Algorithm, STAR-Simultaneous Algebraic Reconstruction, and TV-Total Variation) require less than one minute.
Nyo et al. (2022) proposed a morphological processing-induced thresholding technique. 23 Due to its sensitivity to image noise, Otsu thresholding is not always reliable for surgically detecting and isolating brain lesions. Gaussian and speckle noise are two types of noise that can pollute MRI and CT imaging and result in inadequate threshold determination. Their method was approximately 90% accurate.
Zhang et al. (2021) proposed a novel CT image denoising technique and advanced multi-feature extraction, combining convolution filters of various diameters. 24 The limitation is that only a Peak Signal-to-Noise Ratio (PSNR) parameter value is considered and inconsistent across all noise levels. Hasanah et al. (2021) recently projected a machine learning-based process. 25 With an average accuracy of 95.83%, an SVM model was utilized to classify distinct types of tumours.
Gunaseelan and Anbarasan et al. (2022) offer a thick 3D patch antenna intended for microwave head imaging applications. It employs a folding technique and a weighted patch approach for radiation patterns and resonance at lower frequencies. With a strength of 6.6 dBi and dimensions of 25–25 10.5 mm3, the antenna functions at a frequency appropriate for brain imaging. It can detect tumours in a human brain phantom and generate 2D pictures using raster scanning. 26 The paper presents VisioFlow FusionNet, a neural network design that enhances the accuracy of brain tumour segmentation by combining DeepVisioSeg and SegFlowNet features. This system uses deep learning to detect cancerous areas from medical photos, offering important details for diagnosis and therapy strategizing. Using a catfish optimizer, NeuraClassNet, a classification component, performs better than existing methods in terms of segmentation accuracy (99.2%) and loss (2%) while avoiding overfitting. 27
Amin et al. (2021) proposed in 28 a model for automatic brain tumour detection using VGG-16; the model attained 84% accuracy. Dipu et al. (2021) proposed an automatic brain tumour detection system. 29 The authors achieved 85.95 per cent accuracy for YOLO and 95.78 per cent for FastAi. Ma et al. (2020) proposed an adversarial network based on noise learning. 30 In contrast to other standard works, PSNR for quantitative abdominal results is not enhanced in this study. The proposed adaptive system shows superiority over methods that excel in only one area by producing more explicit images and accurately detecting tumours when achieving a high PSNR and high accuracy. This improves the system's image reconstruction quality and classification performance.
Khalil et al. (2020) projected an altered type of two-step dragonfly mechanism system for segmenting 3D MR images of brain tumours, 31 and they determined that it was 98.20% accurate. Krishnammal et al. (2019) proposed a Convolutional Neural Network for classifying brain image datasets using feature maps preprocessed in the Curvelet domain. 32 The primary limitation of the work was a lack of comparative analysis, which resulted in an accuracy rate of 96%.
In summary, numerous studies have proposed various methods for medical imaging analysis, including segmentation and identification of brain tumours. Unal et al. suggested a shorter reconstruction time system than other methods. Nyo et al. projected a process with an accuracy of 90% but with limitations resulting from unreliable threshold determination. Zhang et al. planned a multi-feature extraction denoising strategy despite suffering from variable PSNR values. Hasanah et al. projected a brain tumour classification model with high accuracy, but they did not compare their results to those of other existing models. Amin et al. and Dipu et al. proposed automated brain tumour identification models with moderate to high precision, but no comparative analysis was conducted. Ma et al. presented a generative adversarial network strategy for CT denoising, though it was limited in its ability to improve PSNR for quantitative abdominal results. Khalil et al. developed an accurate method for segmenting tumours based on a modified dragonfly model, but they did not compare their results to other current models. Krishnammal et al. provided a CNN for accurately categorizing brain images, but no comparable analysis was conducted.
Proposed technique
The proposed approach is shown in Figure 1 and consists of several precisely planned steps. The procedure starts with the acquisition of input images from a database of brain tumour CT scans called a low-dose CT image database. These images undergo a series of preprocessing steps to improve their quality and prepare them for feature extraction.
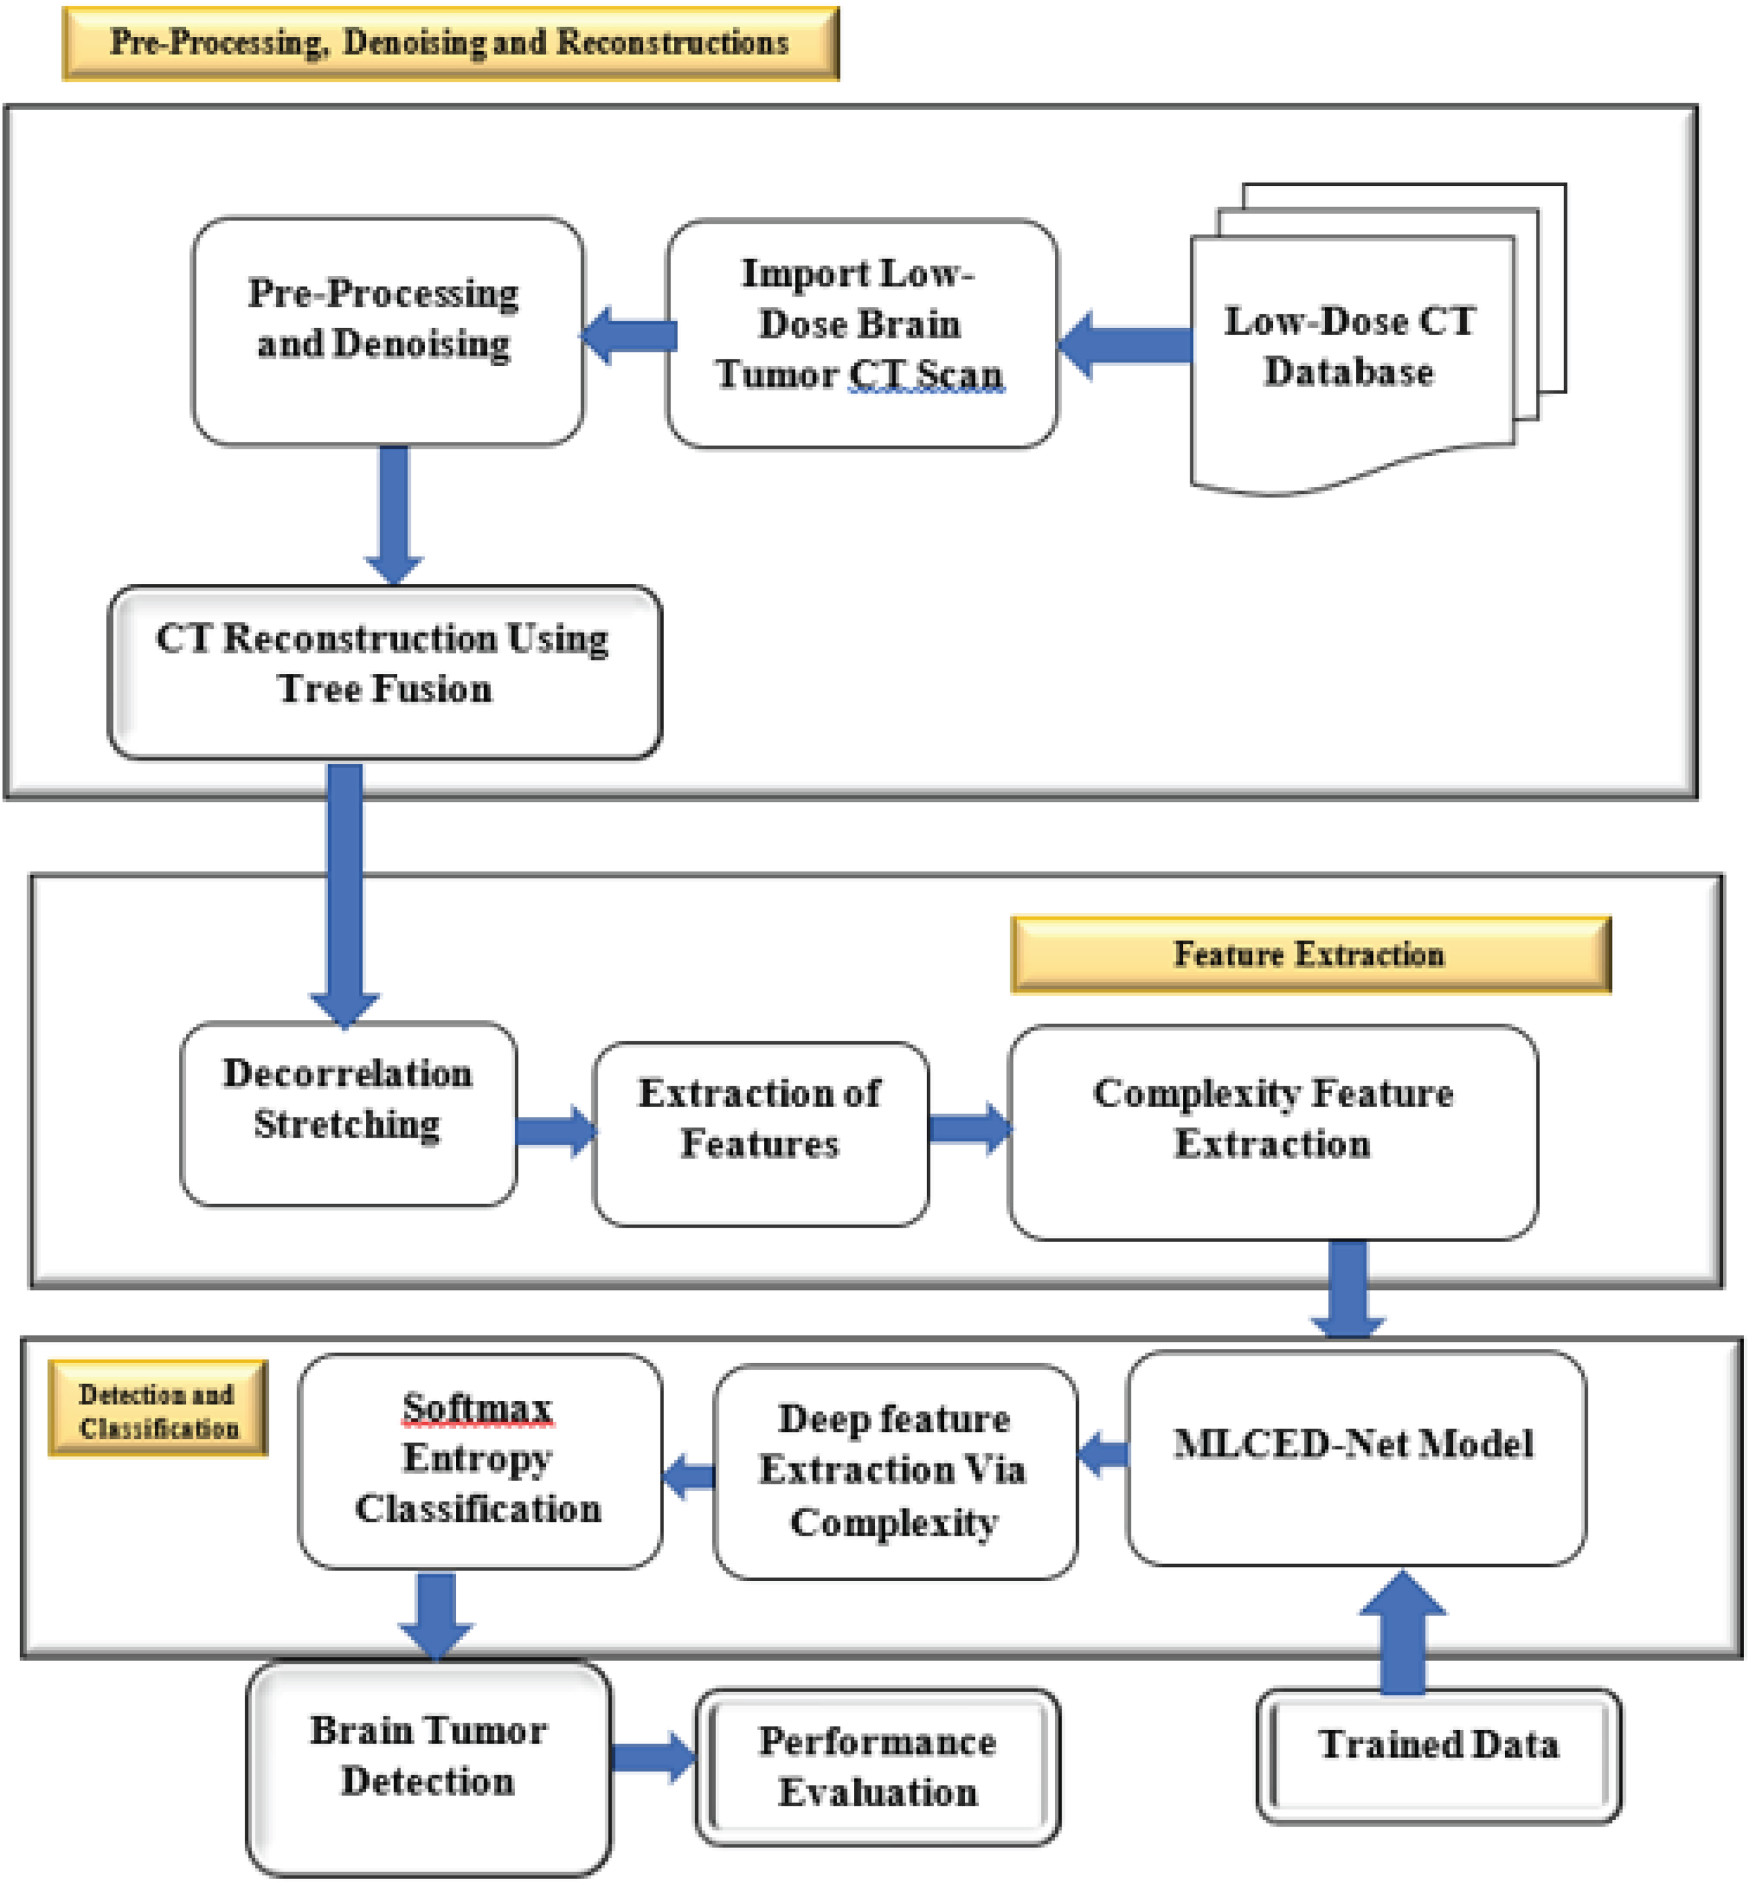
Proposed block diagram of the research work.
To effectively counteract the degradation brought on by convolution with a point-spread function (PSF) and potential noise contamination, the acquired images first undergo image deblurring using the Lucy-Richardson method. The Point Spread Function (PSF), noise level, iteration count, and input image quality all affect how well the Lucy-Richardson deconvolution technique works. Its efficacy is increased by appropriately reducing noise, balancing iterations, and guaranteeing high-quality pictures with reduced distortion and noise. For recovering clear images, this iterative deconvolution technique is essential. The deblurred images are then put through Adaptive Histogram Equalisation (AHE), which successfully reduces artefacts brought on by Low Dose image acquisition. Using pixel intensity values analysis, histogram extraction facilitates the identification of regions of interest. Histogram normalization reduces variances brought on by lighting or photographic equipment and guarantees uniform brightness and contrast throughout photographs, therefore increasing detail. For feature extraction in deep learning models, this standardization is essential. The process of adaptive enhancement maximizes image quality. The images are then subjected to pixel standardization and elimination, where low-intensity pixels are eliminated, and pixel values are standardized within a predetermined range to create a normalized and refined image.
The image is then prepared for the feature extraction process, which begins by extracting the histogram and then normalizing it. Decorrelation stretching is used to extract essential features from the pictures. Complexity feature extraction then goes on to further record intricate patterns. The extracted features are fed into the Proposed MLCED-Net, a Proposed MLCED-NET model made especially for image classification and object recognition tasks, in order to detect brain tumours. The MLCED-Net model's adaptable deep learning foundation allows it to be extended to various medical imaging modalities such as ultrasound and MRI, even though it was created to detect brain tumours in CT scans. It can recognize intricate patterns in MRI data, improve soft tissue diagnostic precision, and find anomalies in organs examined by ultrasound. The ability to extract significant characteristics from many forms of imagery gives the model flexibility. For the extraction of features, this model makes use of its 15-layer, deep architecture. To improve its performance, the model is additionally trained on pertinent data. The softmax entropy classification technique is used to process the extracted features, enabling the delineation of distinct brain tumour regions. Classification accuracy is used to assess the system's performance and understand its effectiveness.
Integrating multi-layered autoencoders, colour-based operations, edge detection strategies, and deep learning components into a single framework, the proposed MLCED-Net method introduces novelty. The MLCED-Net framework employs multi-layered autoencoders, colour-based operations, and edge detection approaches to extract high-level and fine-grained medical picture features. This improves image quality and structural detail, improving the network's capacity to identify brain tumours. In comparison to fragmented approaches, this holistic approach has the potential to significantly improve the results of image analysis, feature extraction, and compression. The experimental investigation section compares the method's efficacy to earlier studies published in the literature. The encouraging results imply that the MLCED-Net framework may be able to support more precise and timely diagnoses, potentially improving patient outcomes. The paper is organized to make it easy for readers to understand it completely. It includes a literature review, the proposed methodology, experimental research, and concluding remarks that highlight the potential of the suggested approach in computer-aided diagnosis and medical imaging systems. The Lucy-Richardson deconvolution method is used in medical imaging because it works well at restoring blurry pictures. Assuming Poisson noise and employing a Bayesian technique offers more control over sharpening and produces more excellent-quality reconstructions without unduly amplifying noise. AHE (AHE) improves contrast in brain CT images, especially in low-contrast areas. Adjusting local contrast preserves local detail without oversaturating brighter regions and enhances the visibility of brain tumours.
Preprocessing, denoising and reconstruction
The equation for the reconstructed image is given by

Fusion of Approximation Coefficients:
Initialize the fused approximation coefficients, denoted as AF. For each pixel position (i, j) in A1:
Apply the linear fusion method using the continuous parameter value of 0.5:
Fusion of Detail Coefficients:
Initialize the fused detail coefficients, denoted as DF. For each pixel position (i, j) in D1 and D2:
Apply the Average fusion method to combine the detail coefficients:


Extract the histogram of the reconstructed image given by

Normalize the histogram by dividing each bin pixel in the image and multiplying by a factor of 256 to maintain the total area of the histogram:

Thus, the normalized histogram is given by
Stretch the contrast of the image


The Decorrelation Stretching Process is a technique commonly used for feature extraction in medical CT images, where the correlation between the mean and variance of the pixel values in each ring can reveal important structural and textural features.
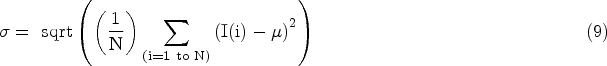
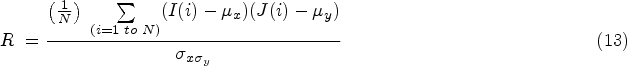
The features that were extracted are provided with the following equations:

L is denoted as the number of grey level values in the concerned image p(i) is considered as the normalized histogram of the image, and log2 is known to be the base-2 logarithm.


Apply edge detection using the Sobel operator.
Calculate the gradient magnitude G (x, y) using Sobel operators for Ids (x, y).


The edge magnitude E(x,y) is calculated from the gradient magnitude G(x,y) as follows:

Perform the 2D DCT on the edge magnitude E(x,y) obtained from the Sobel edge detection.
Let E(x,y) be the edge magnitude obtained from Sobel edge detection. Apply the 2D Discrete Cosine Transform (DCT) to get the DCT coefficients D(u,v) for each frequency component u,v in the x and y directions, respectively.
N is the size of the image in both dimensions (assuming a square image). u,v are the frequency components ranging from 0 to N−1. C(u) and C(v) are the normalization constants
The resulting D(u,v) coefficients represent the frequency-domain representation of the edge magnitude.

Display hidden layers inside and outside the edges using DCT.
Step 1: Display Hidden Layers Inside Edges
Plot a heatmap of DCT coefficients using images(D) or log(abs(D) + 1) Set the title of the plot to ‘Hidden Layers Inside Edges (DCT Coefficients)’ Label the x-axis as ‘Frequency Component u’ and Label the y-axis as ‘Frequency Component v’
Step 2: Display Hidden Layers Outside Edges
Plot a heatmap of DCT coefficients using images(D) or log(abs(D) + 1) Set the title of the plot to ‘Hidden Layers Outside Edges (DCT Coefficients)’ Label the x-axis as ‘Frequency Component u’ and Label the y-axis as ‘Frequency Component v'
Step 1: Define Variables
Define Deep Learning Model values and tolerance. Define the hidden size for the Deep autoencoder used.
Step 2: Train Autoencoder
Train an autoencoder with L2 weight regularization, sparsity regularization, and sparsity proportion.
Step 3: Load Data and Perform Operations
Step 4: Image Processing and Accuracy Calculation
Calculate Normalized Difference Vegetation Index (NDVI) threshold q using (ndvi > thresh) Detect regional maxima in I and J to get detregion1 and detregion2 Calculate Accuracy Level (Accuracylev) based on detected regions Define covariance matrix
Step 5: Mutation and Feature Generation
Mutation and feature extraction are performed using the mutation function for X1 and X2 to get centres and U matrices (let us say these are mutation variables). Calculate features f1 and f2 using Mutation Function
Step 6: Multivariate Normal Distribution and Concatenation
Perform multivariate regular random sampling using covariance matrix for f1 and f2 Concatenate features f1 and f2 into F Set the number of clusters K and maximum iterations Initialize centroids and distance matrix
Step 7: Display Accuracy
Consider centroids and Distance Display Brain Tumor Detection with Accuracy in percentage
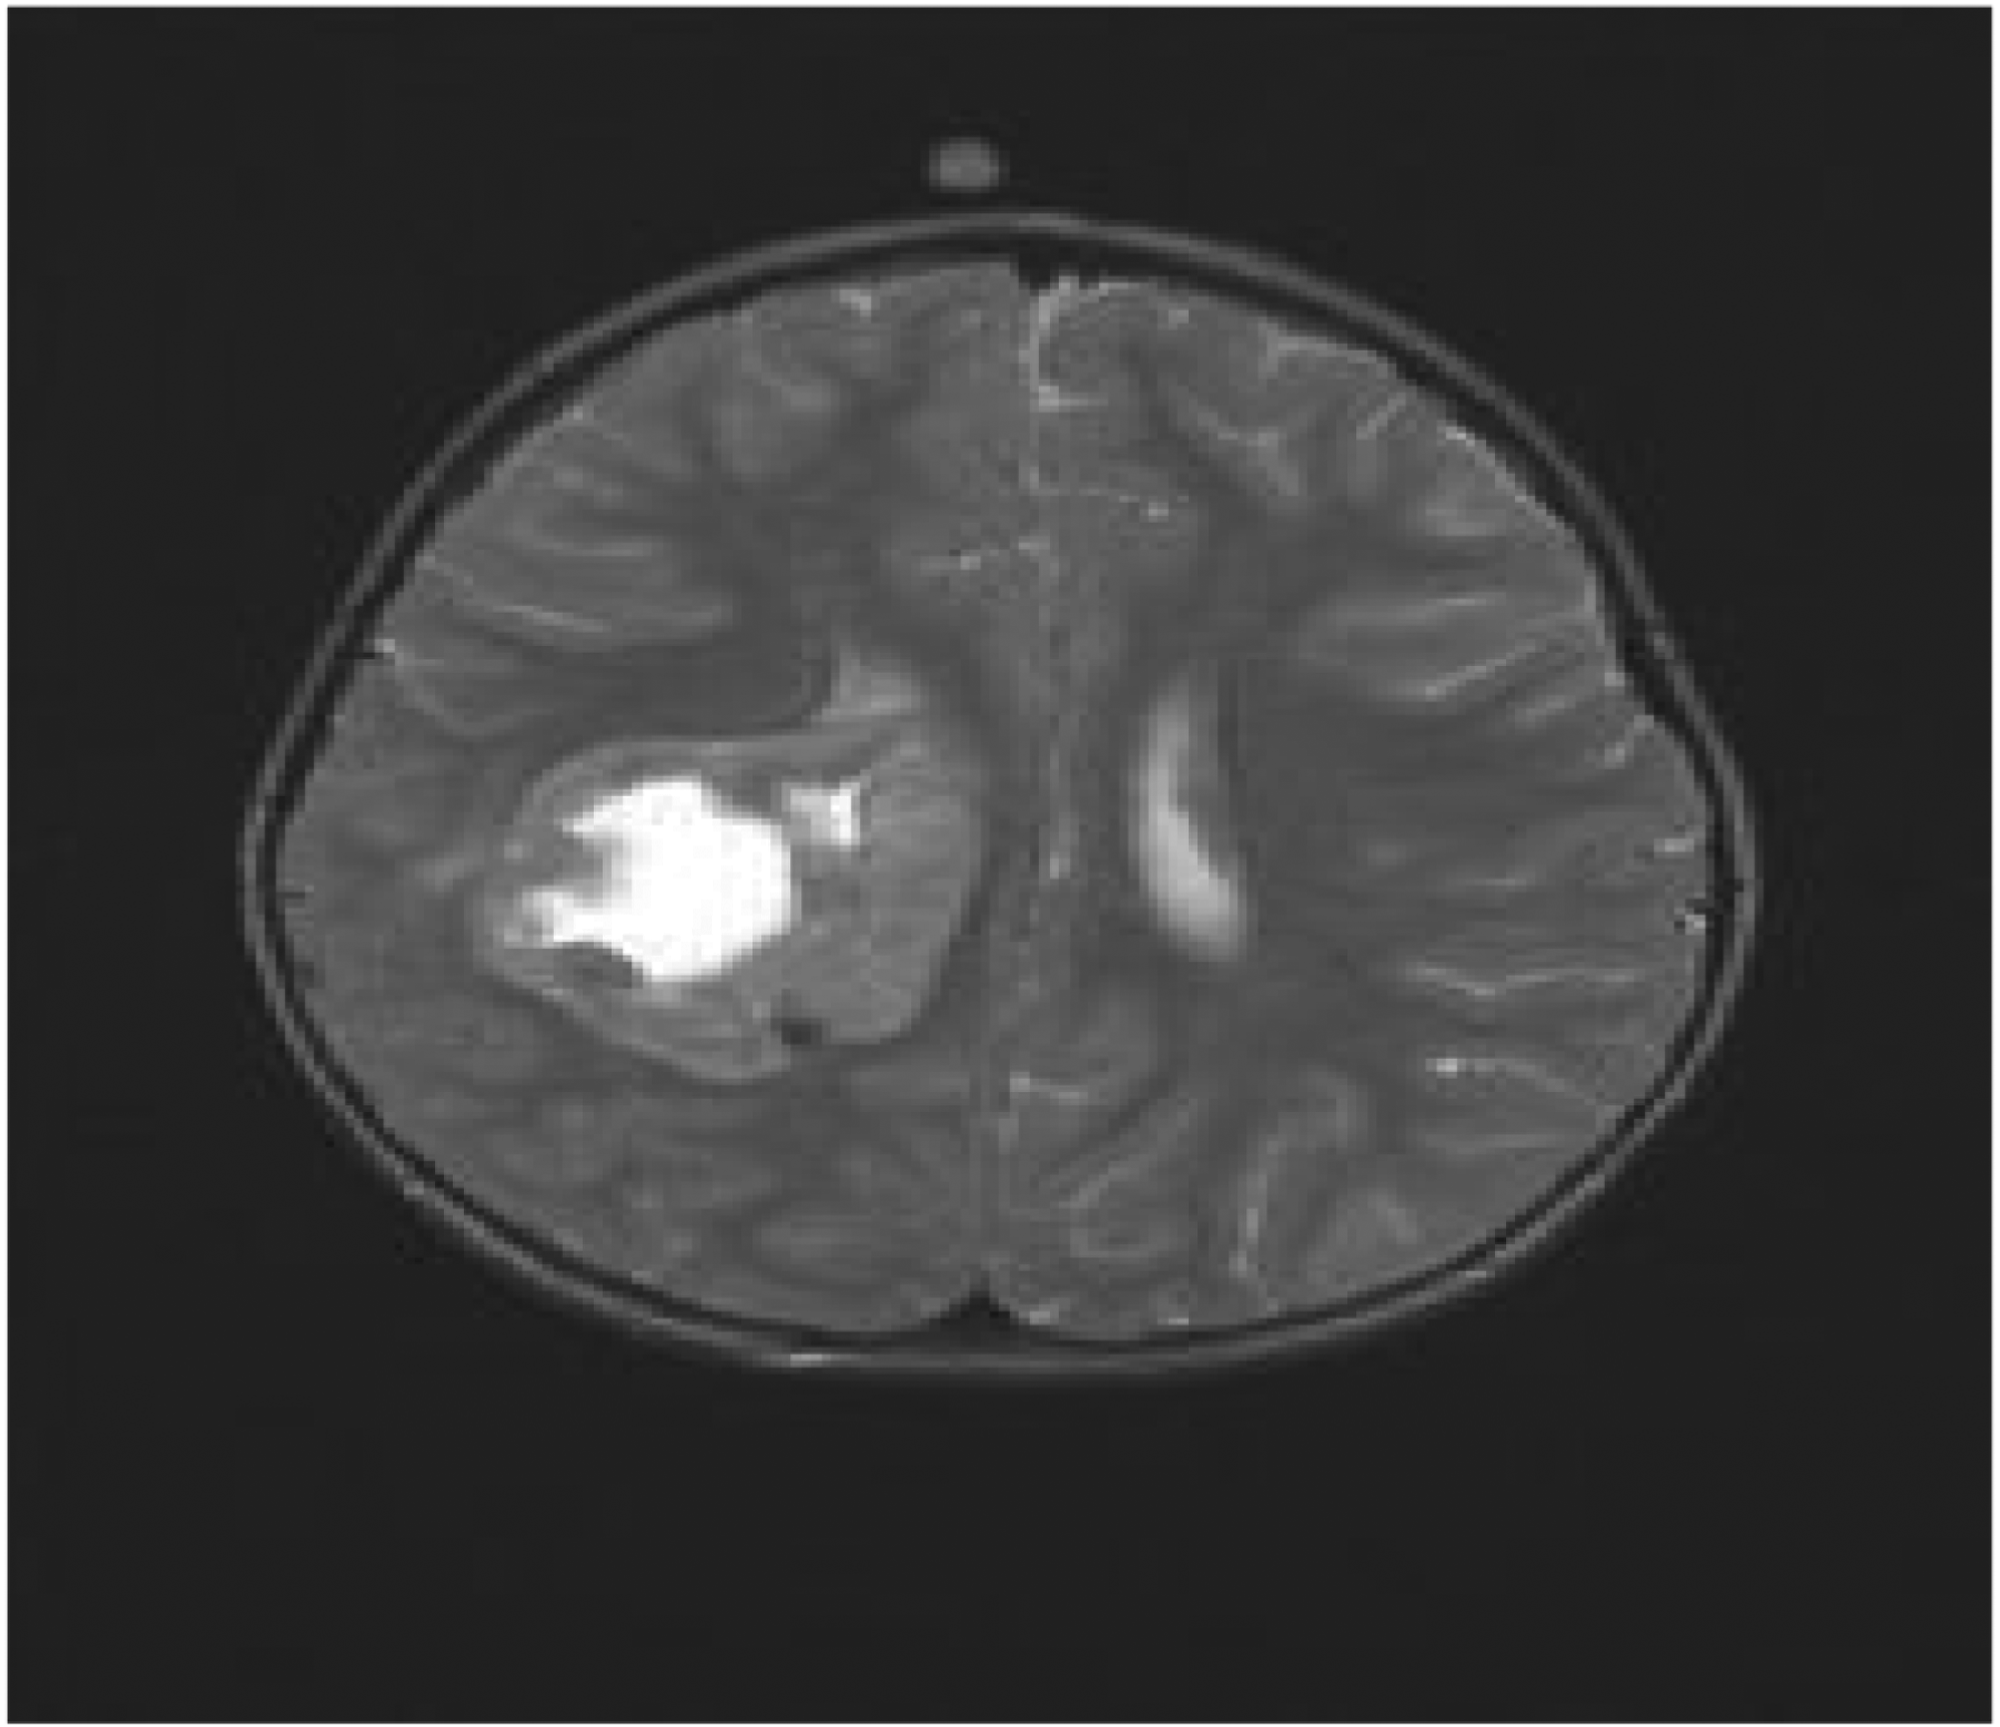
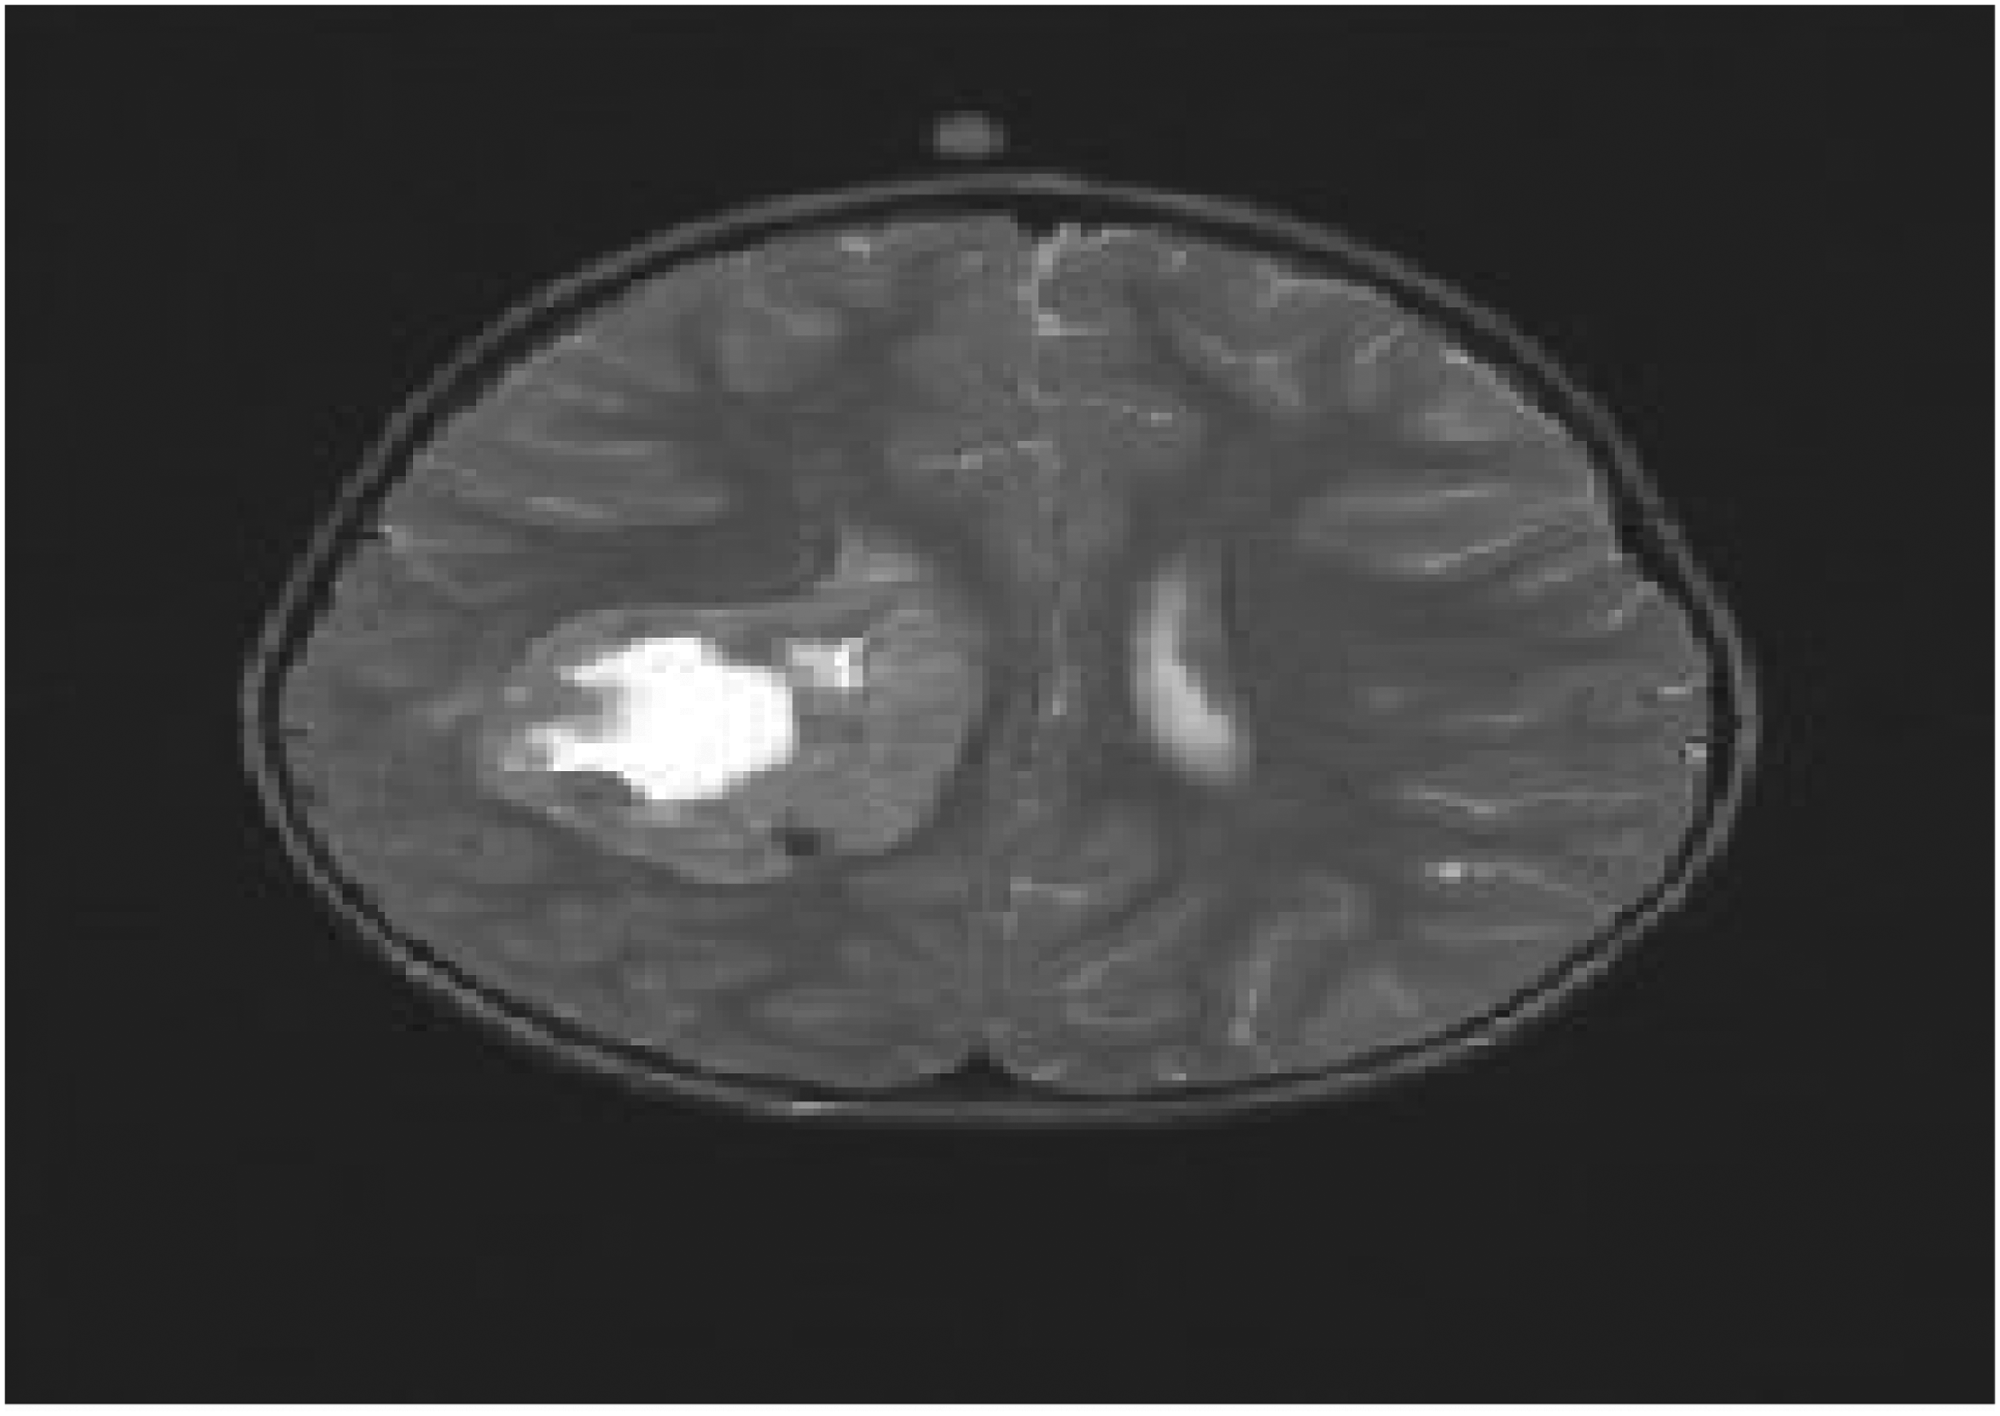
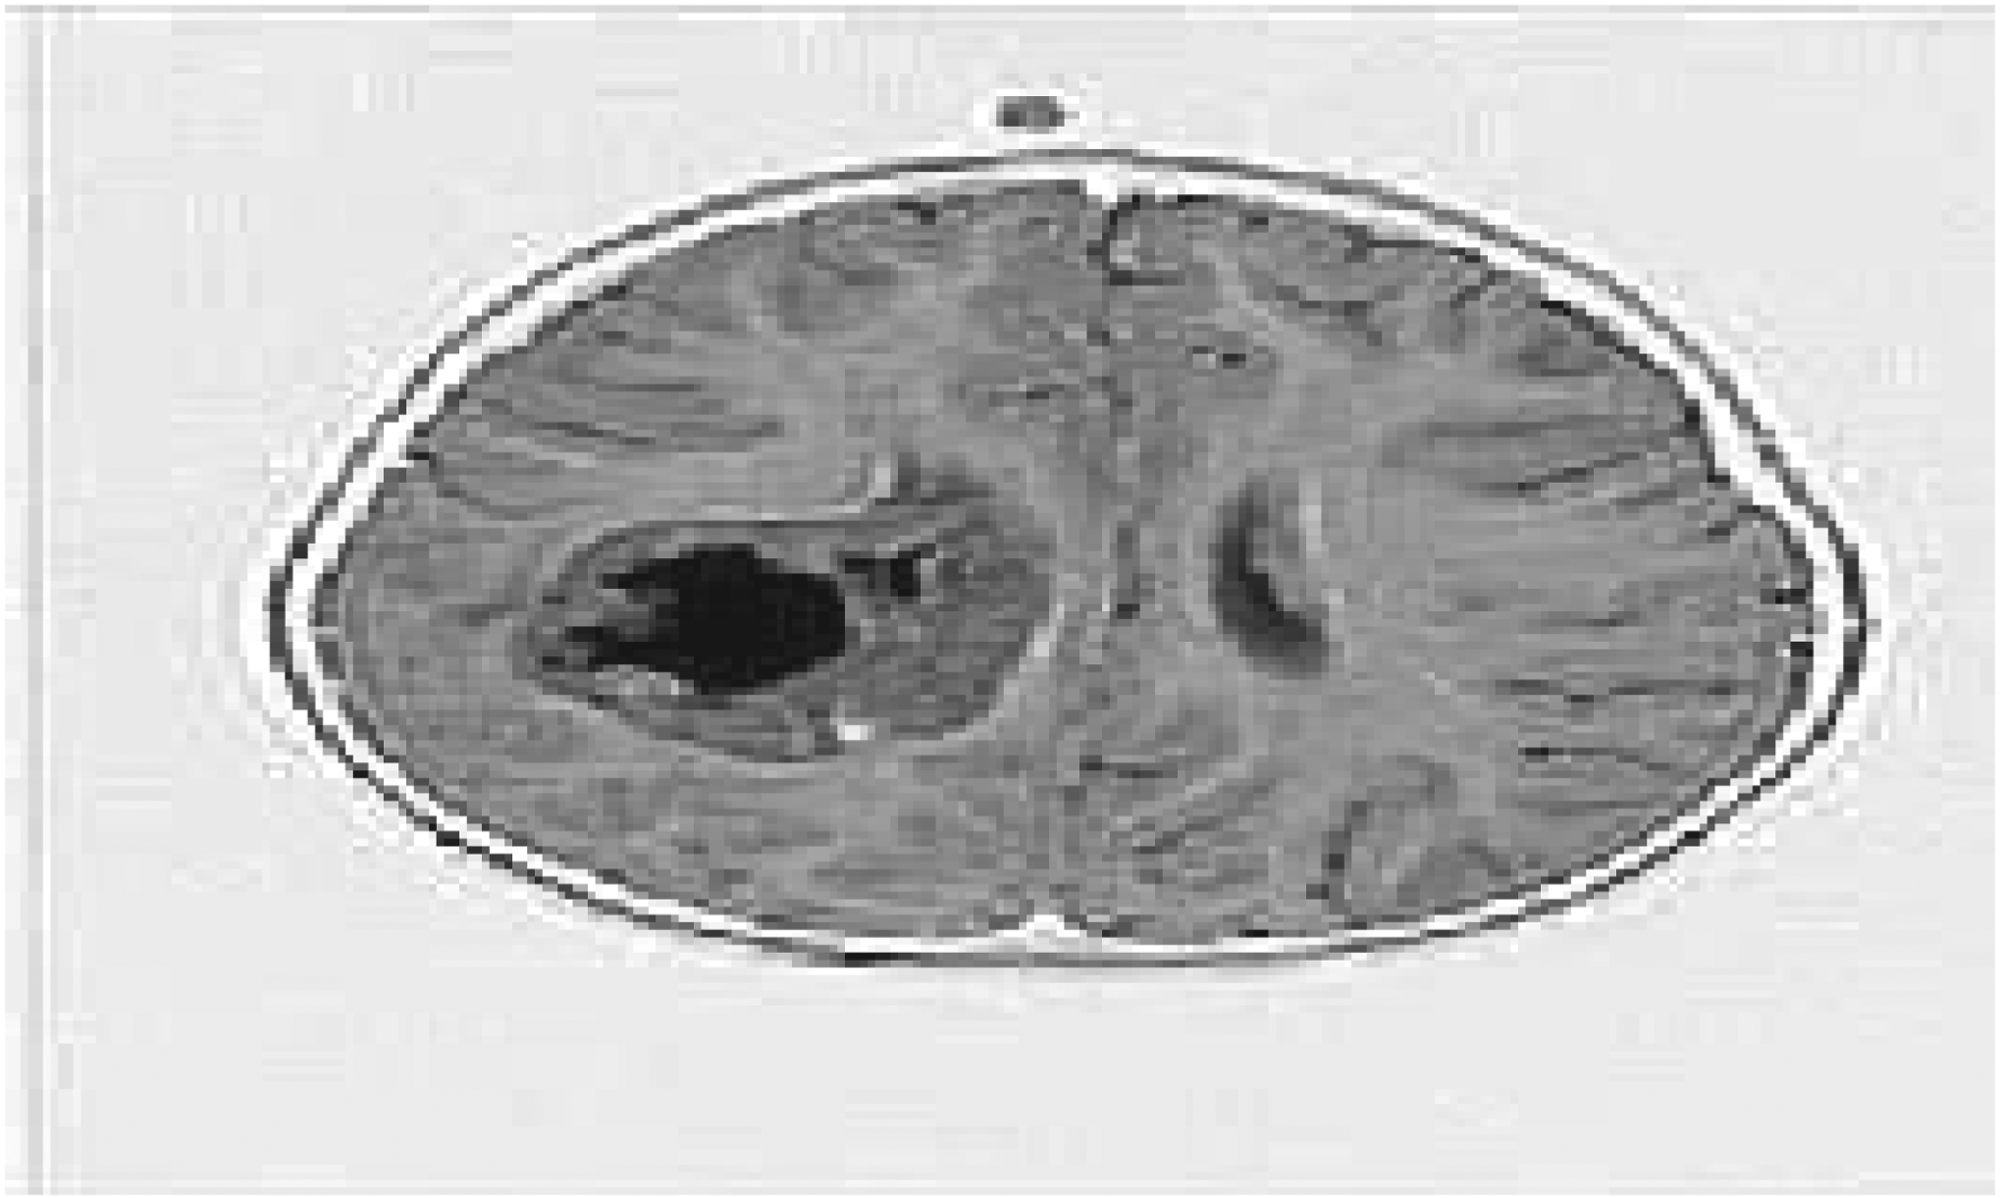
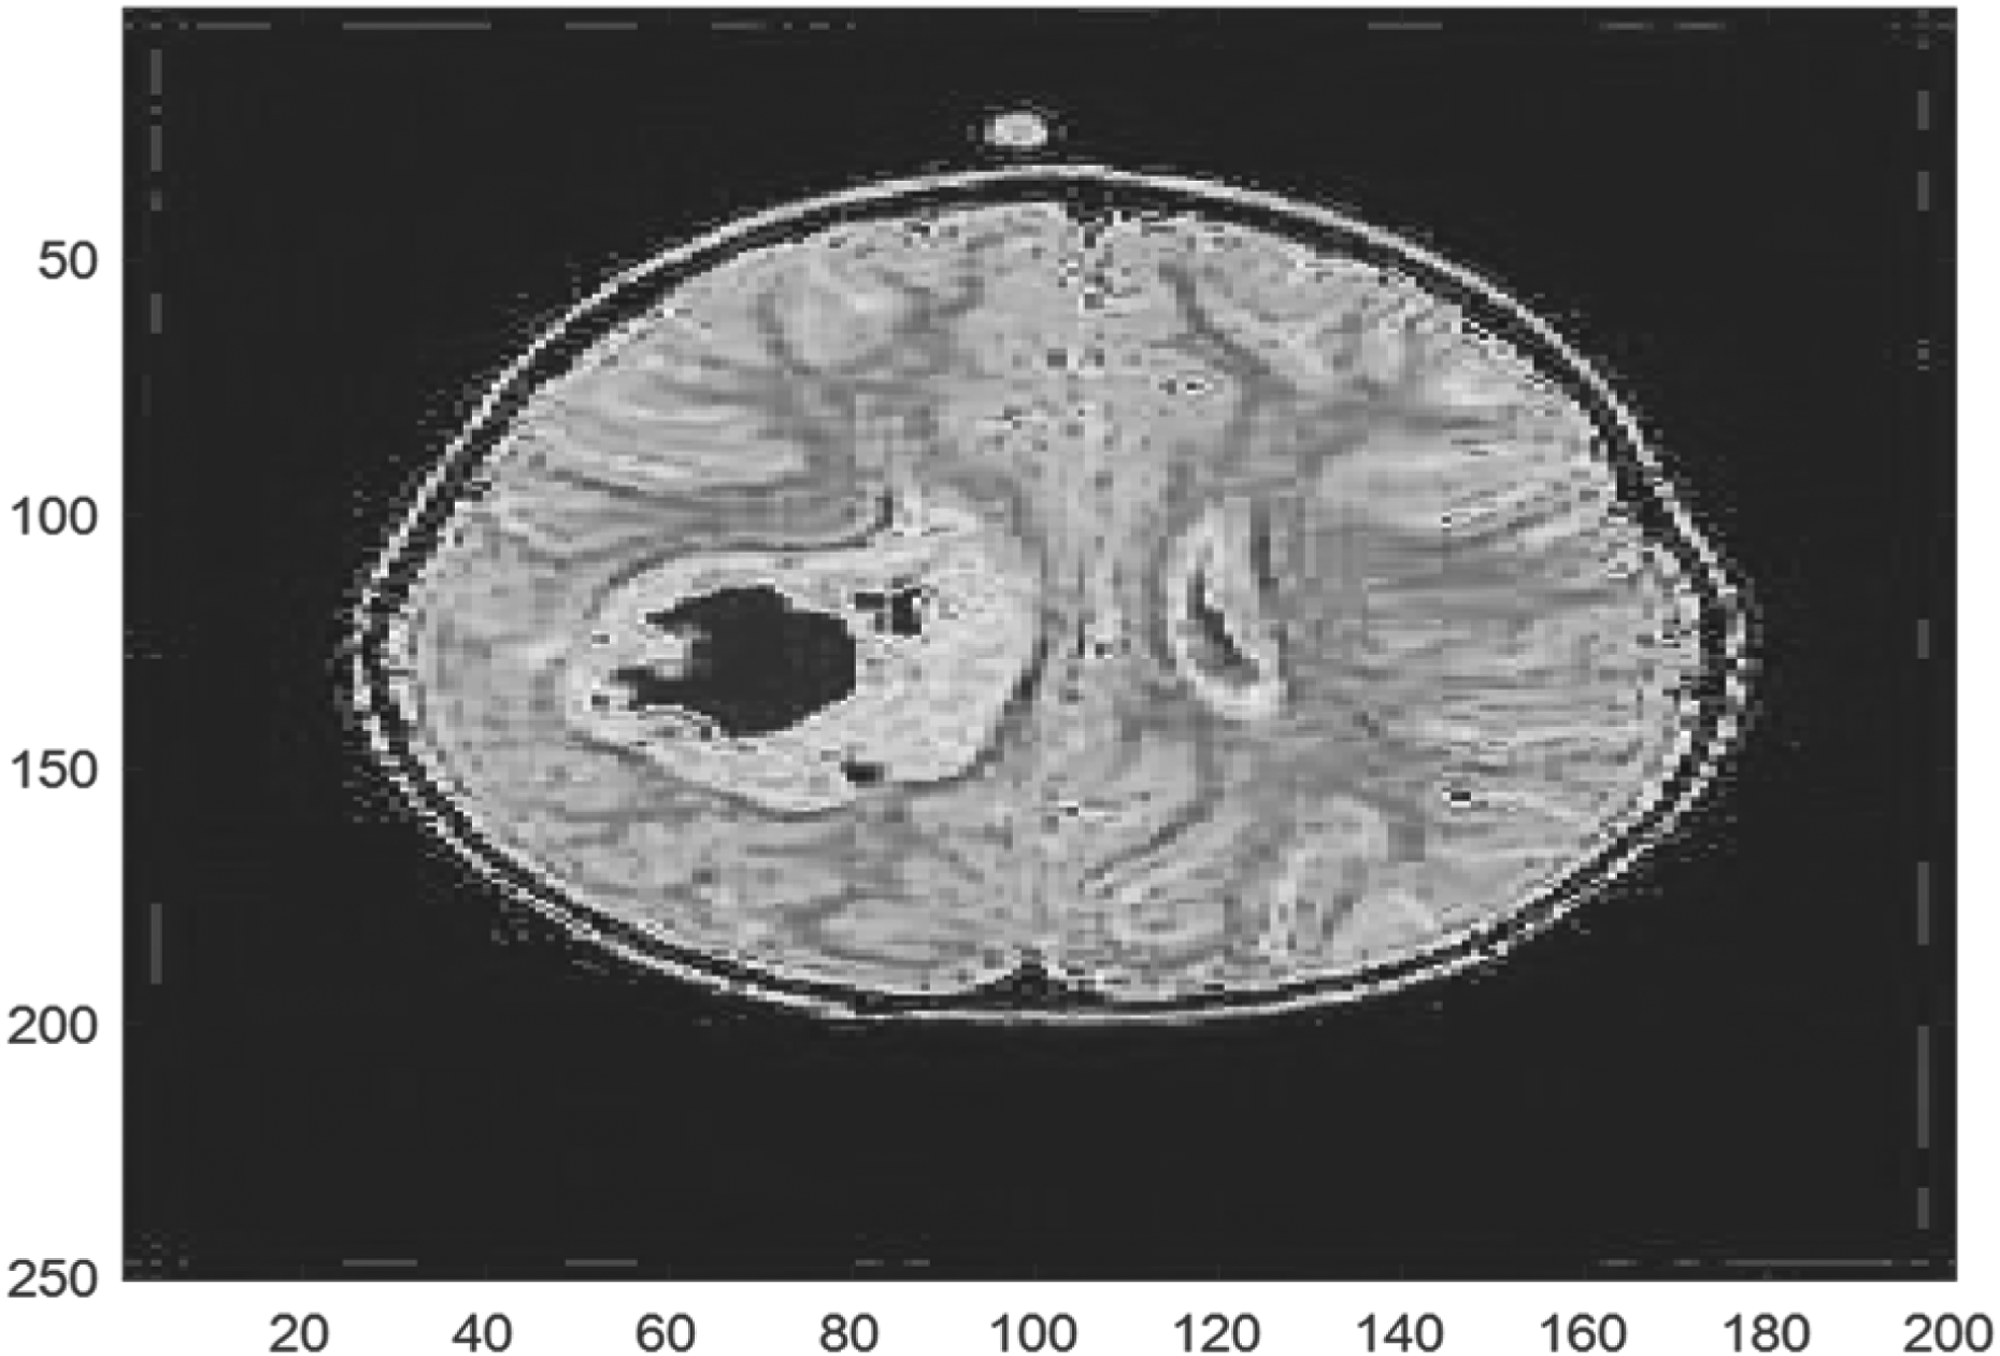
The input low-dose CT brain scan, depicted in Figures 2 and 3, is resized for optimal processing and is a critical component for the preprocessing stage. It is then preprocessed by Lucy-Richardson image deblurring. The deblurred image is then filtered using AHE to improve image quality, as low-dose images are more prone to adding artefacts during acquisition.
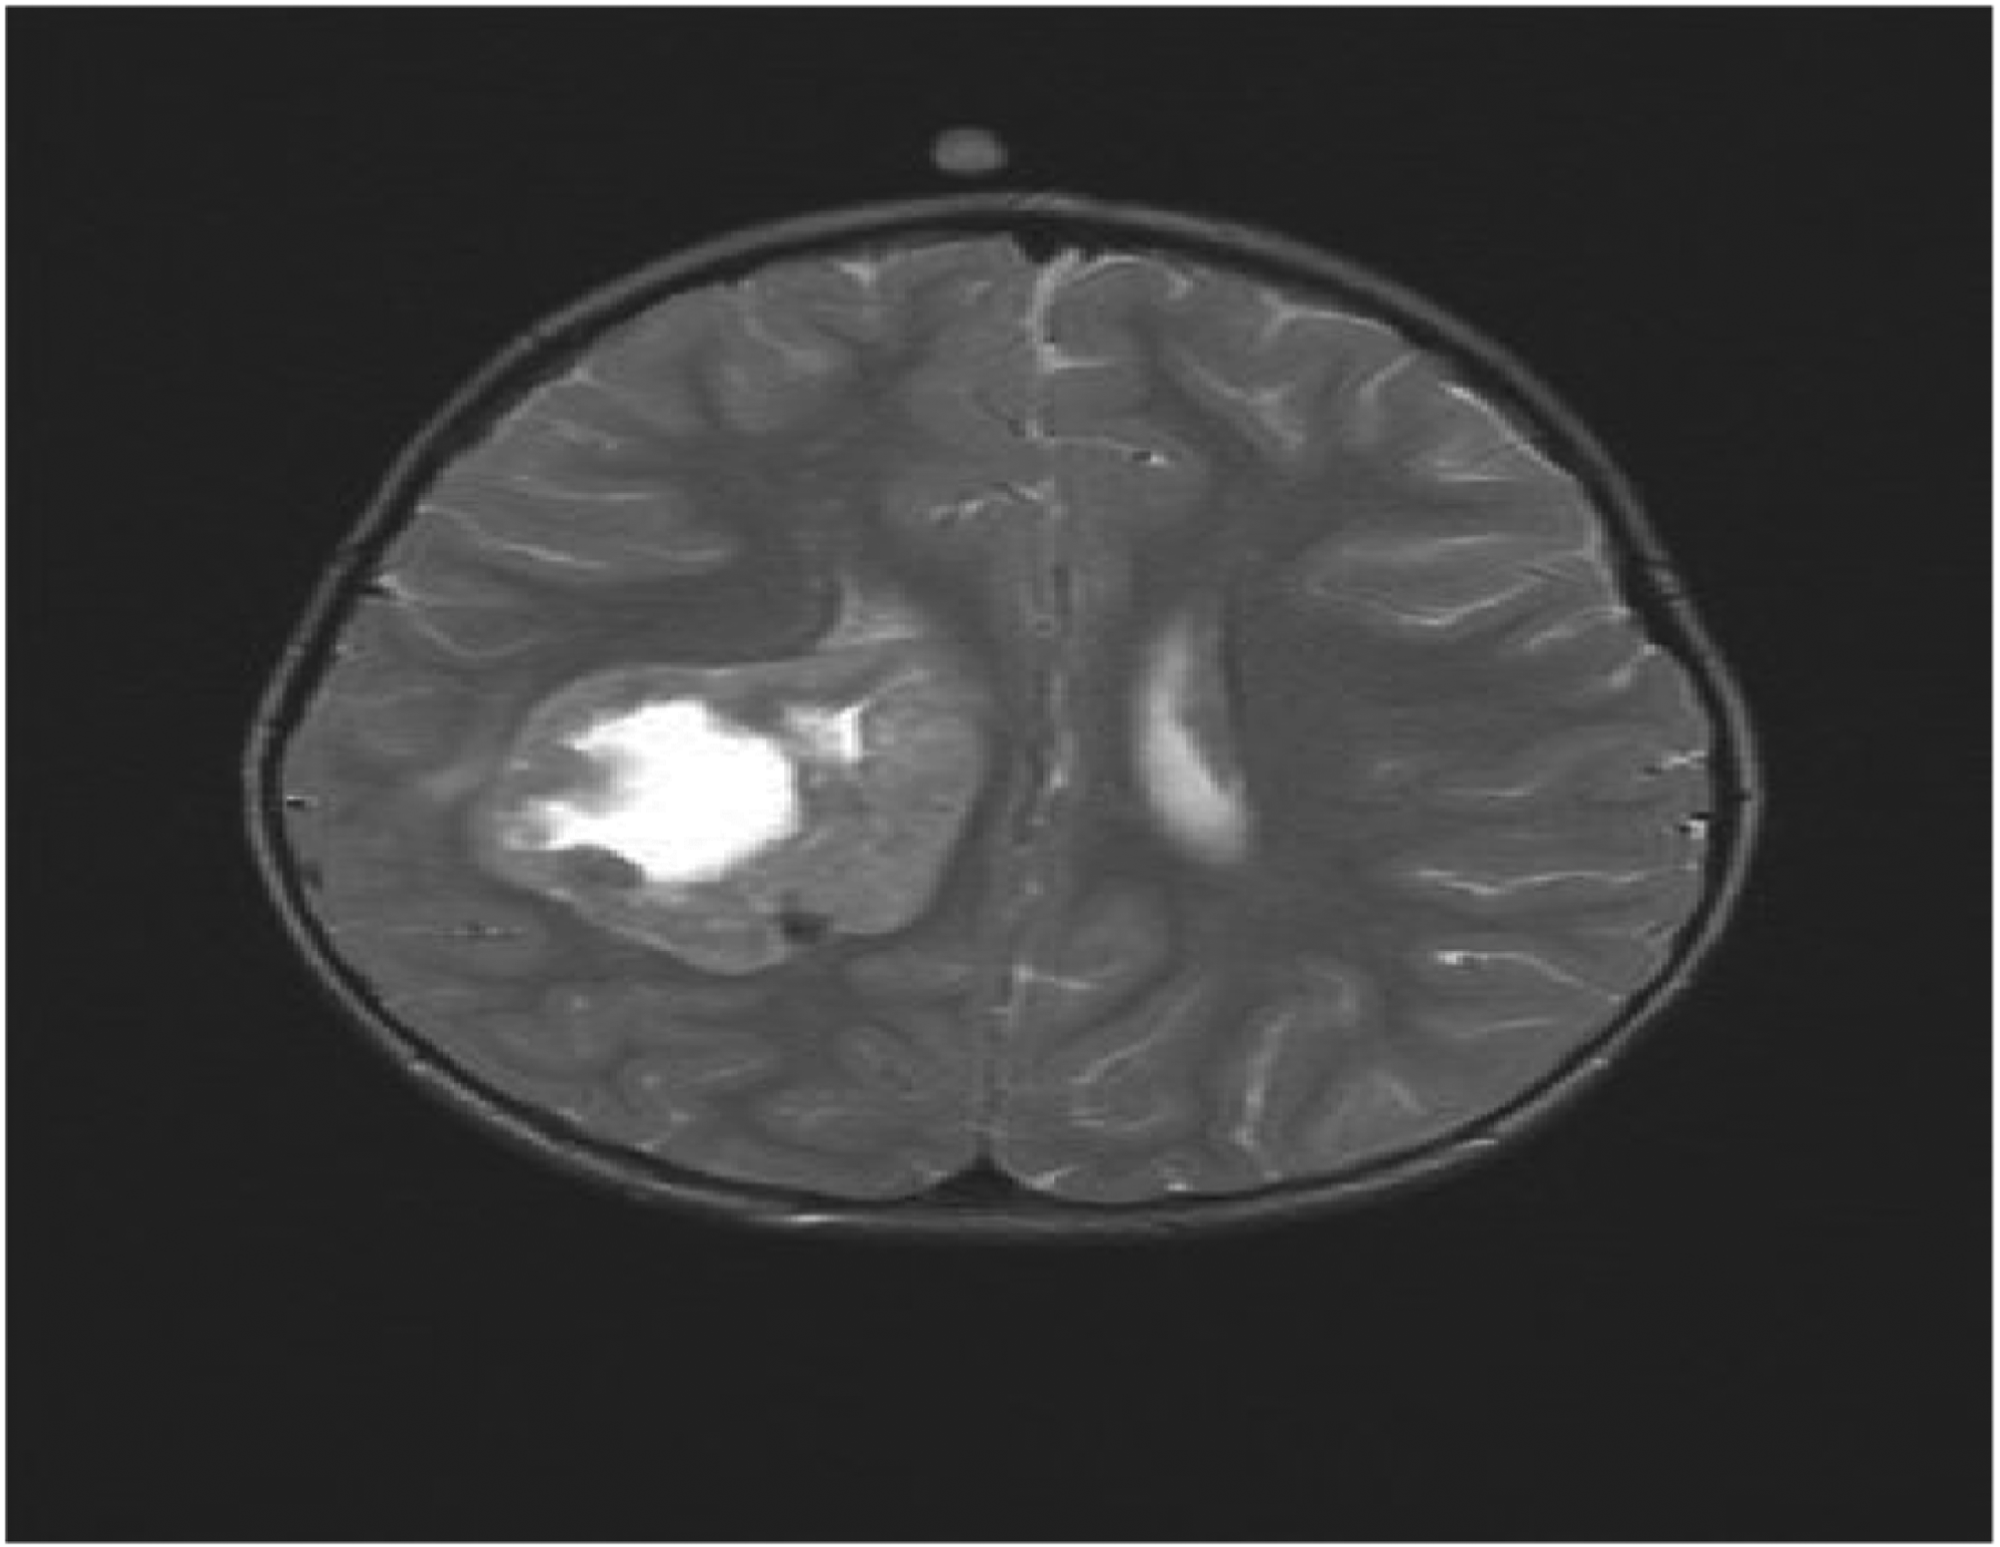
Input brain scan.
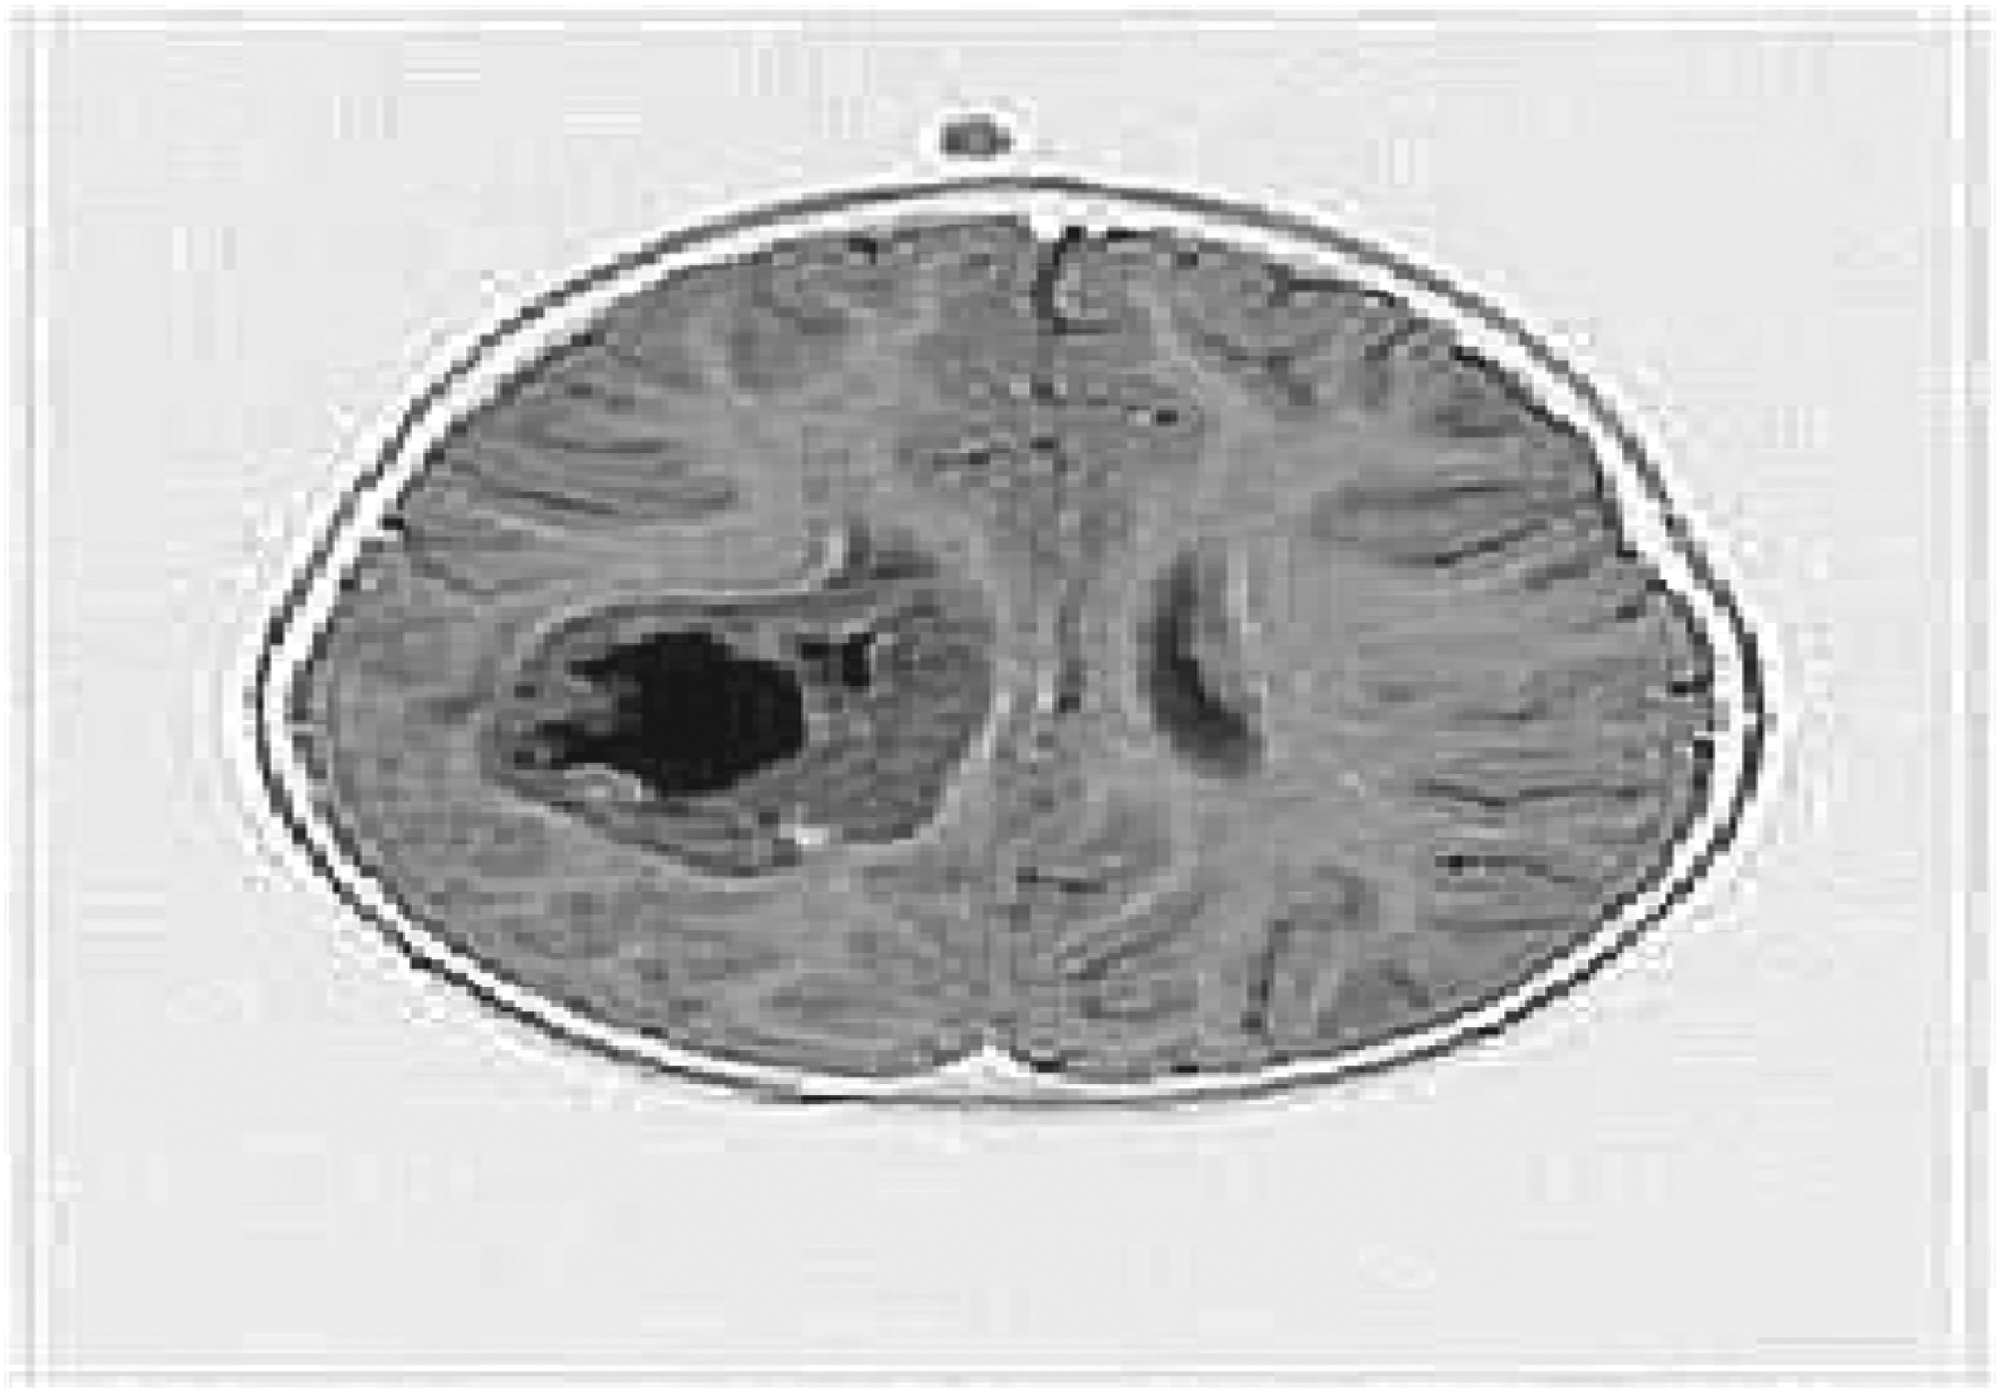
Resized image.
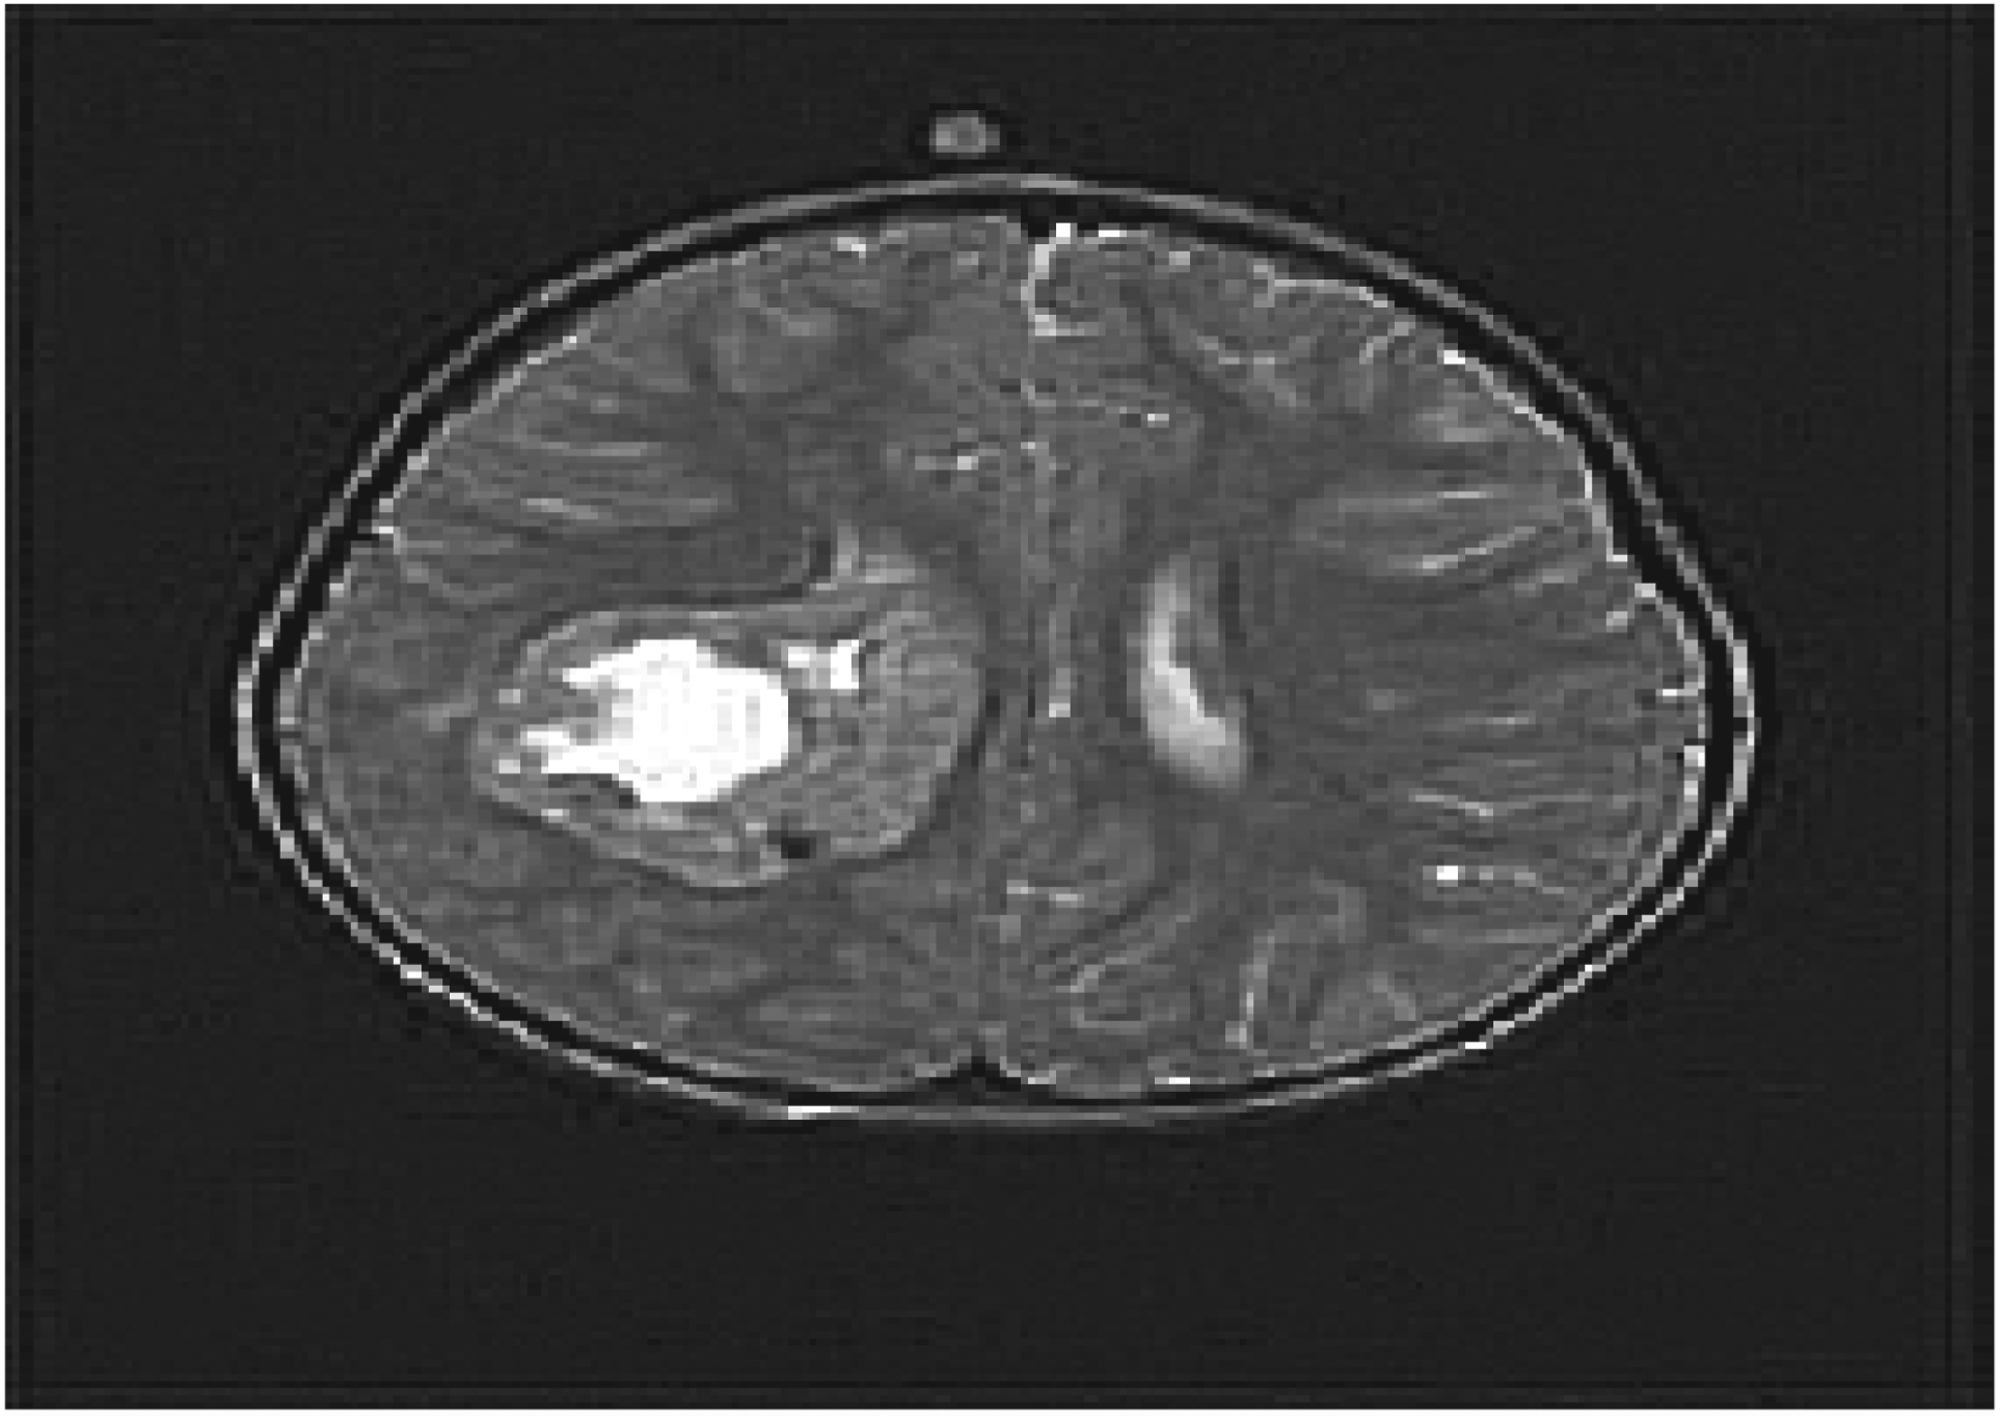
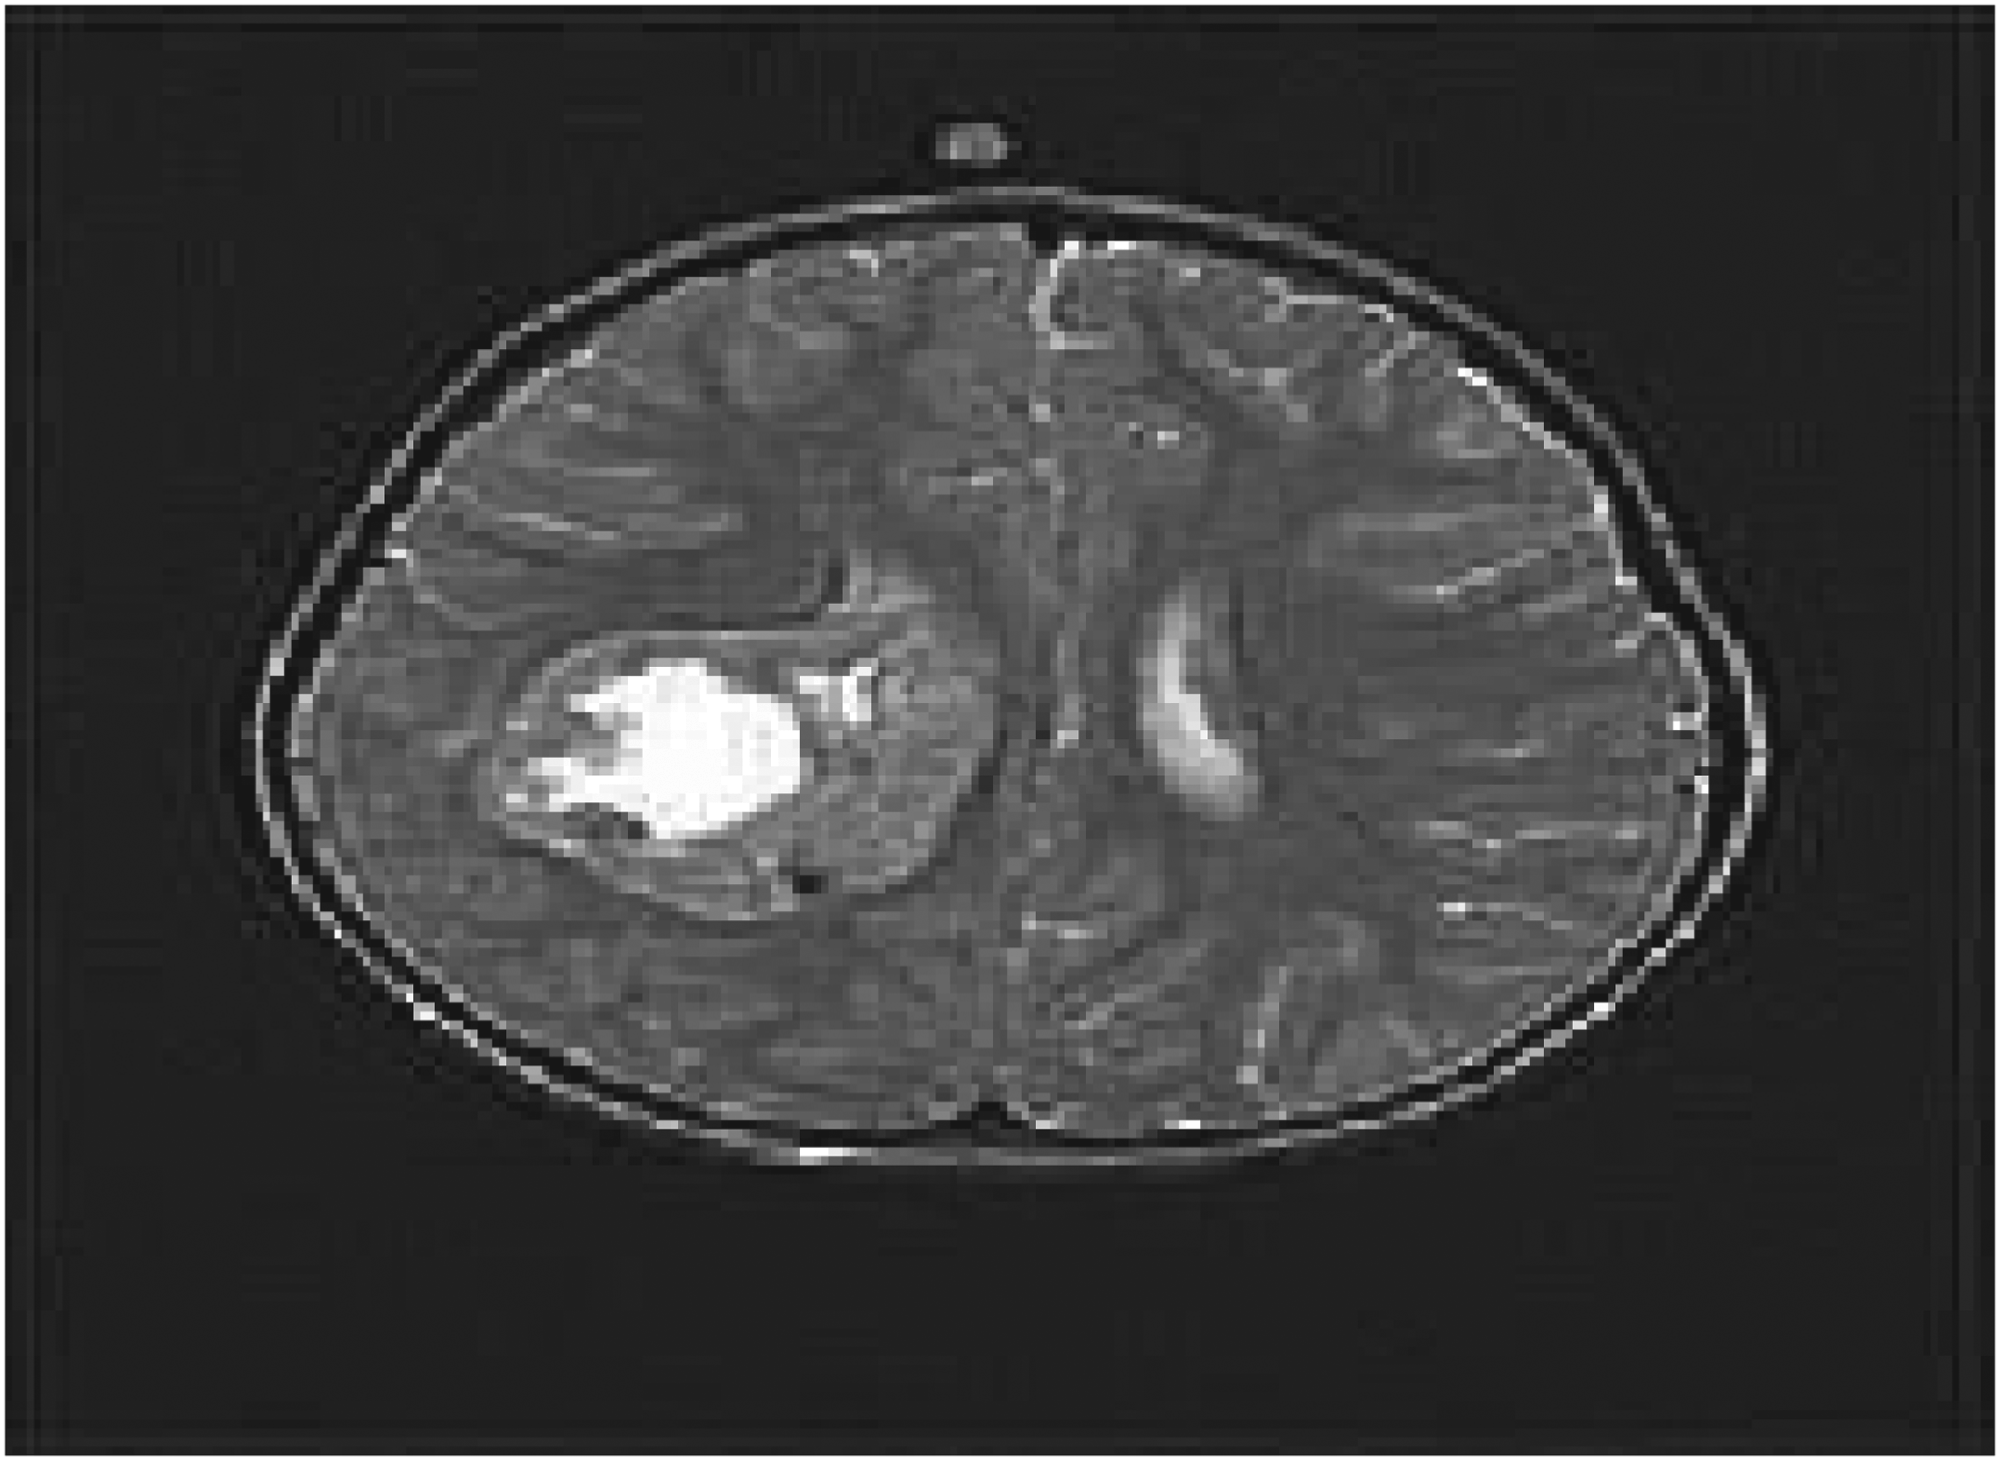
The filtered image is then subjected to pixel normalization and elimination using Subtractive Spatial Light Weight, with the final deblurred and denoised image and noise ratio output. Noise and uneven lighting are reduced by subtracting spatial light weights, which modify pixel intensity based on local light circumstances. This procedure helps with noise reduction and pixel normalization, especially in medical imaging, where precise intensity representation is essential for identifying abnormalities such as tumours. The final image in Figure 4 shows the preprocessed image results, and the pixel noise ratio has been reduced, as shown in Figure 5.
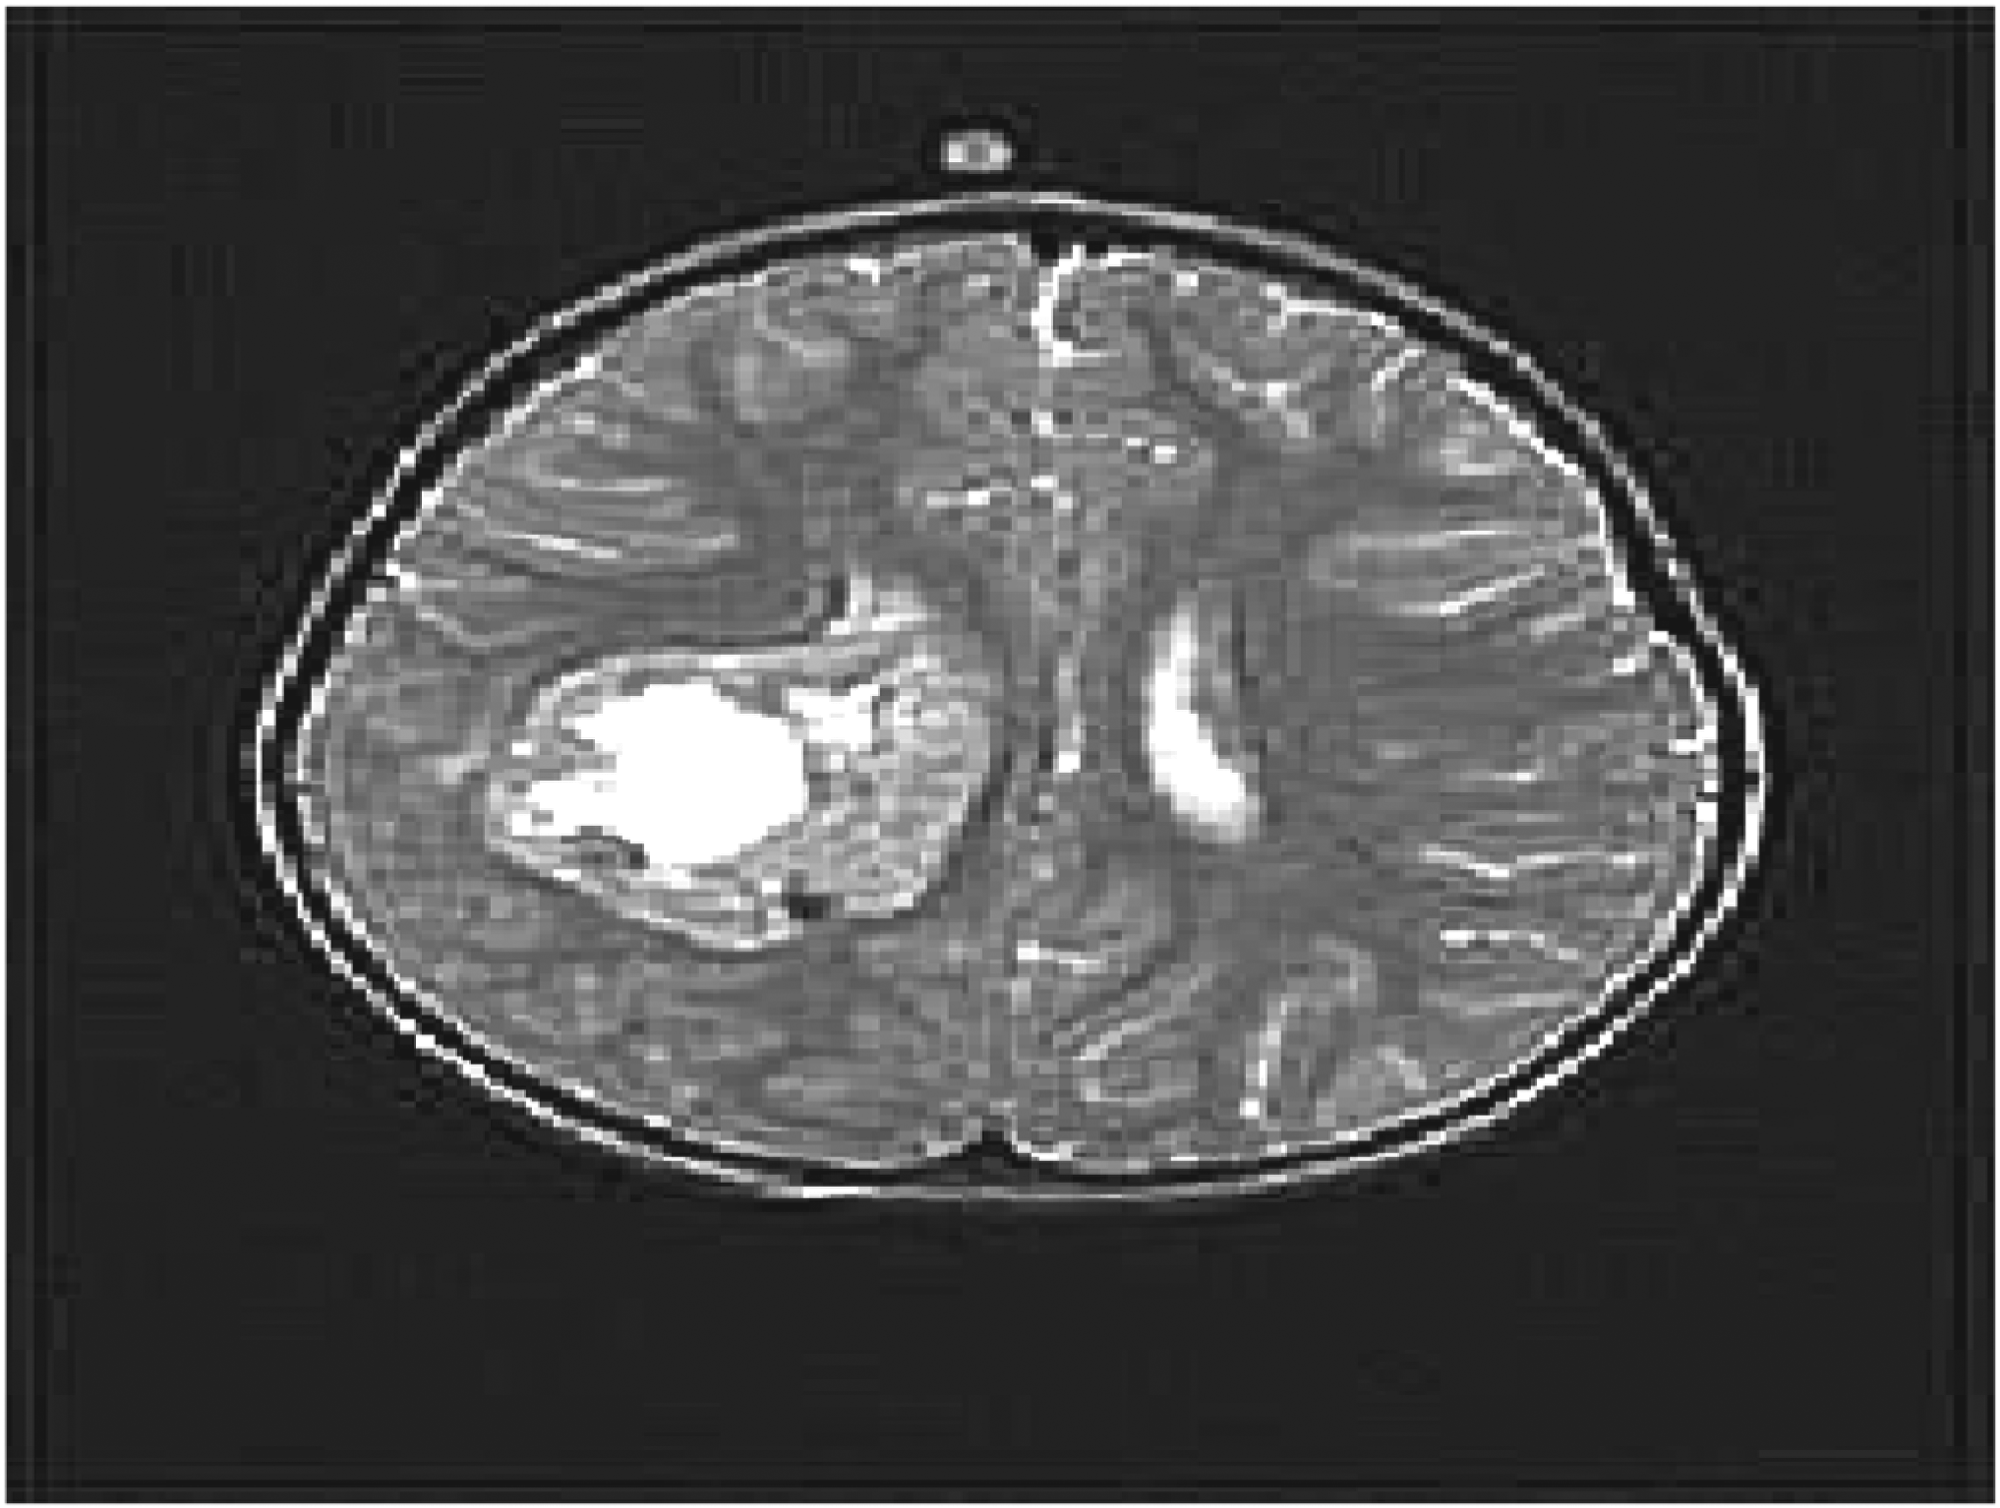
Preprocessed image.
Induction of pixel noise ratio elimination.
The filtered image is then subjected to pixel normalization and elimination, with noise ratio extraction shown in Figure 6 and normalization shown in Figure 7. As shown in Figure 8, this procedure entails normalizing the image's pixel values to a standard range and removing any pixels that fall below a particular threshold value. This step yields a normalized and cleaned image ideal for feature extraction, as shown in Figure 9.
Noise ratio extraction.
Normalization feature extraction.
Normalization elimination.
Feature extraction ready image.
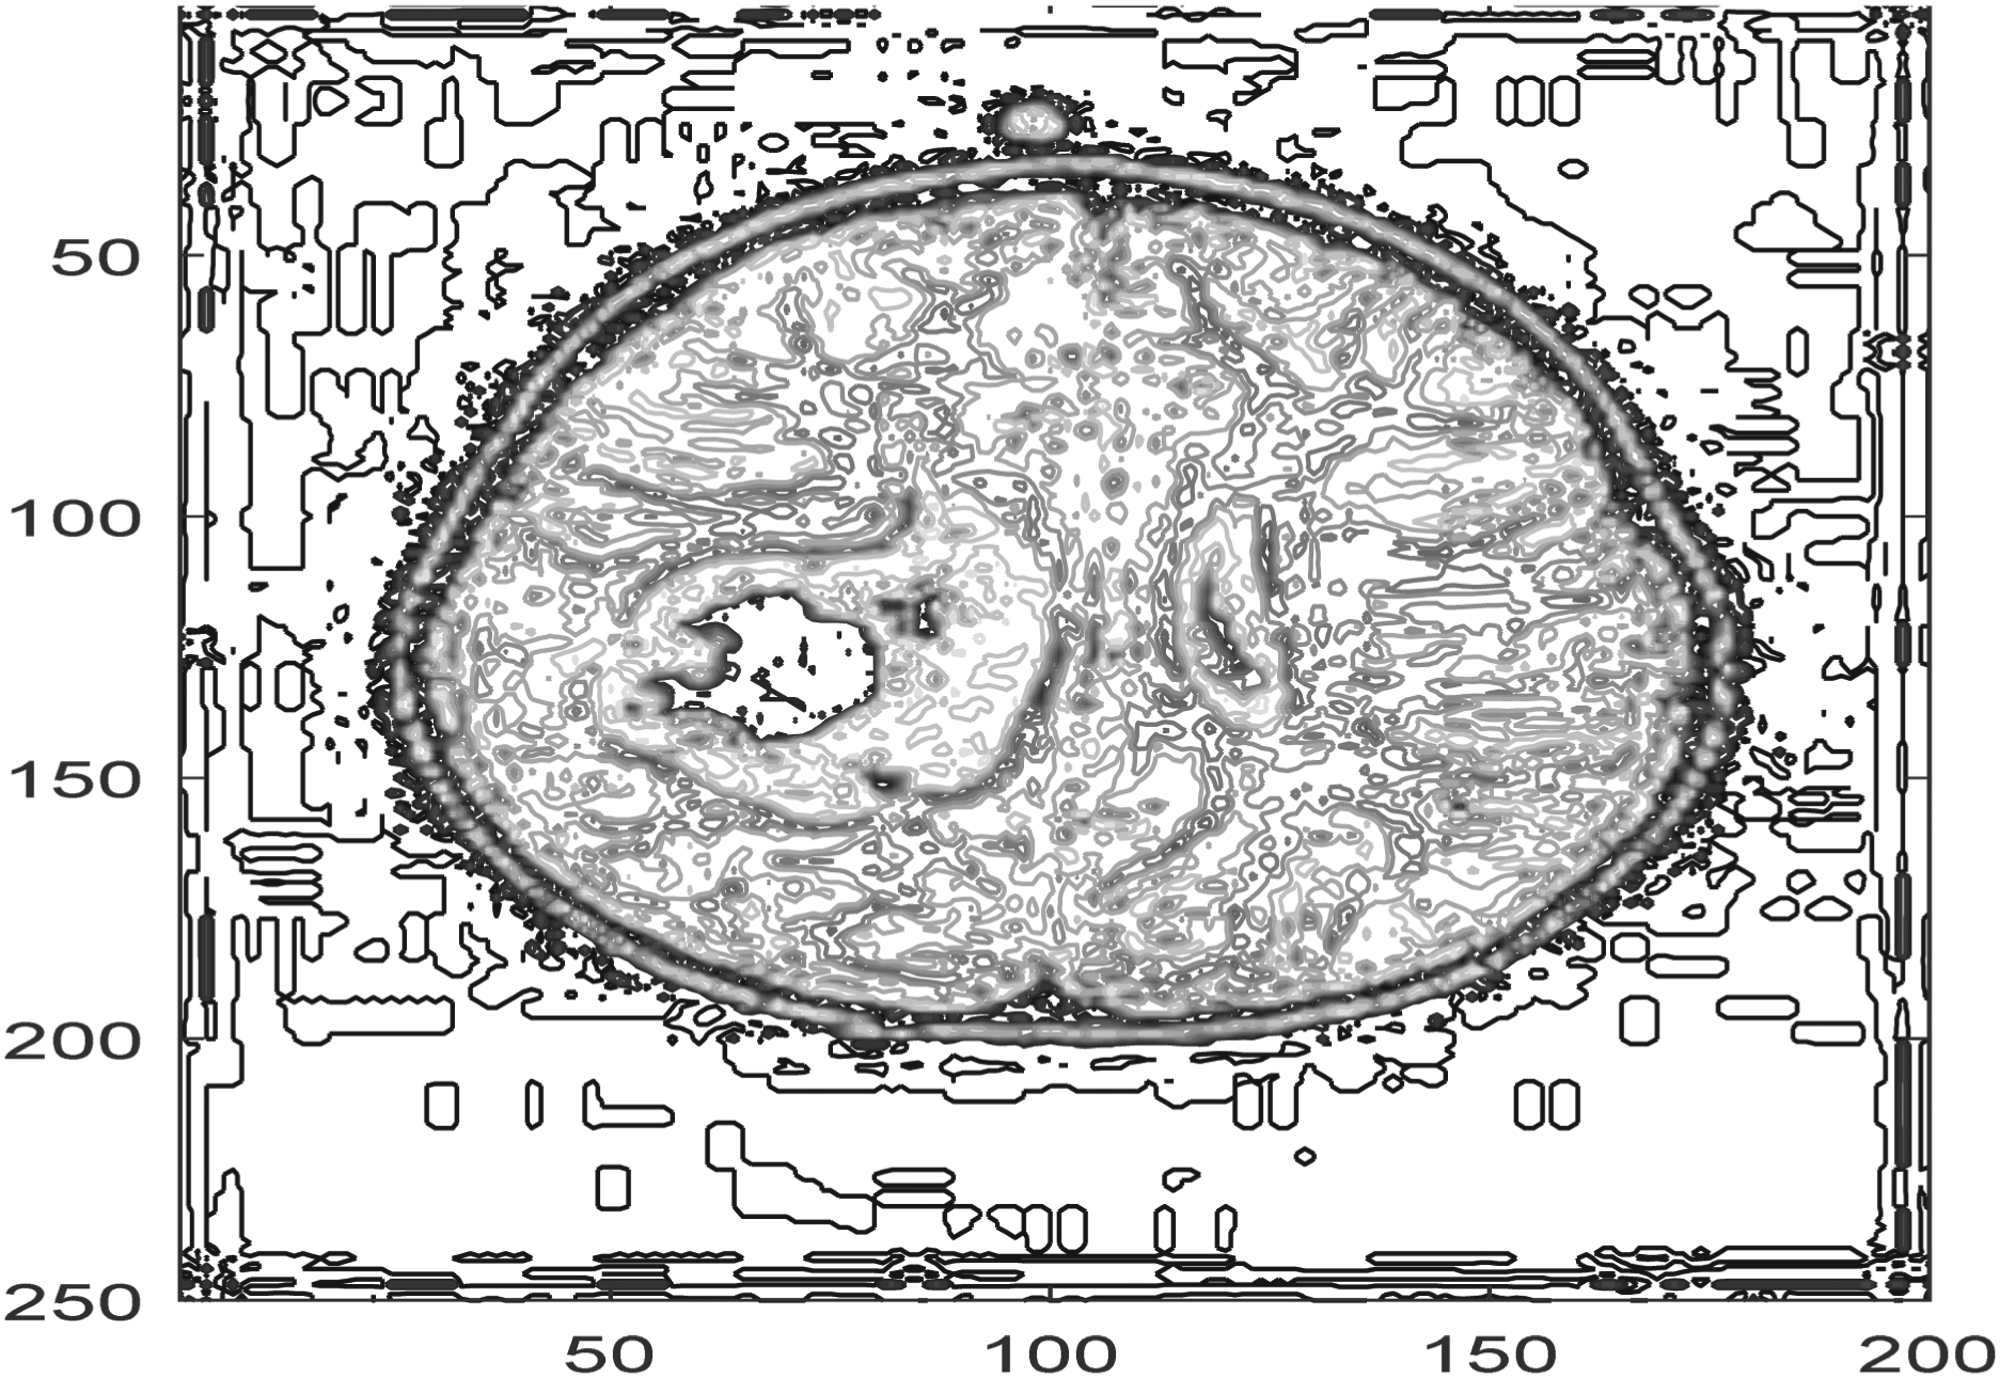
The stages involved in the extraction and elimination of subtractive spatial information follow. The extraction of Complexity features is then initiated. This process entails extracting key image features such as Mean, Energy, Contrast, and so on, which are required in the detection process (Figure 10(a) and (b)), and then utilizing the Proposed MLCED-Net model to label the features. The detection process is then completed. The term “Multi-Layered Chroma Edge Deep Net (MLCED-Net)” effectively captures the essence of the proposed method. It employs multi-layered autoencoders, colour-based operations (Chroma), edge detection techniques, and deep learning components. Brain tumour identification in medical pictures is improved by the MLCED-Net architecture, especially in low-dose CT scans. It uses a multi-layered autoencoder, chroma-based algorithms, edge detection strategies, adaptive noise reduction, and SoftMax classification for precise tumour probabilities and flexibility.
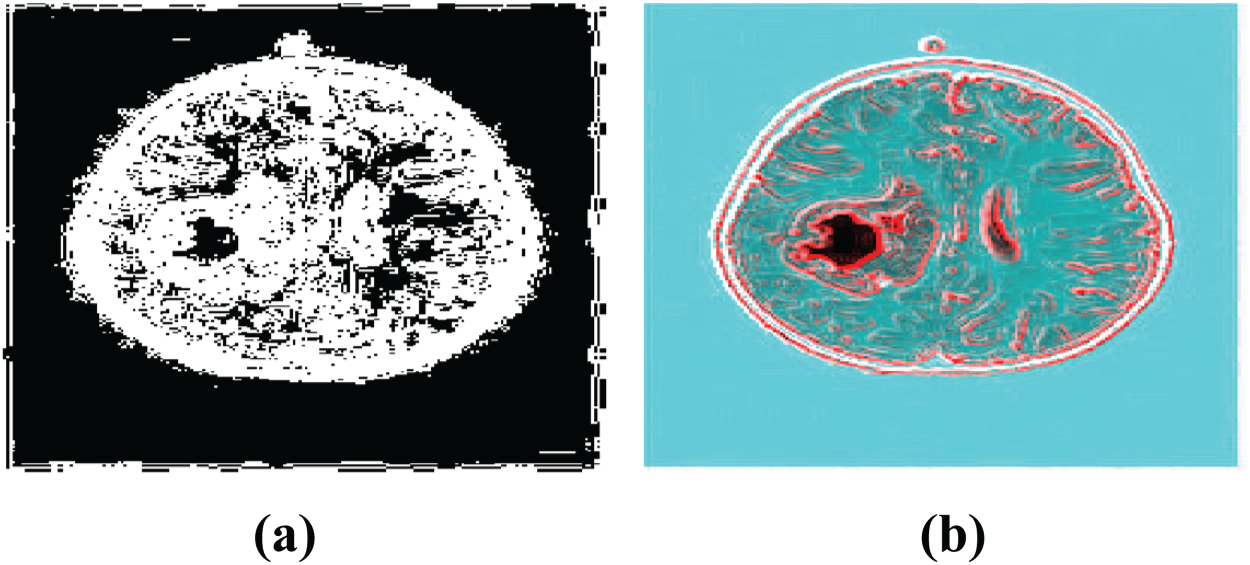
(a) & (b) Complexity feature extraction.
When these extracted features are fed into the proposed MLCED-NET model, it generates two intermediate hidden layer pictures, shown in Figures 11 and 12. The model employs a series of convolutional and pooling layers to train and extract features at various levels of abstraction. The Inside Image represents the activations of neurons in the model's penultimate layer, which is closer to the output layer. This layer stores high-level features discovered by the proposed MLCED-NET model's convolutional and pooling layers. The MLCED-Net comprises pooling, convolutional, and input layers for low-dose CT image processing. It learns complicated patterns by compressing input data, reconstructing it with convolutional layers and upsampling, and employing ReLU activation. The output layer produces segmentation maps and probability maps that show the locations of tumours in CT images. These high-level features are higher-level abstractions of the input image that can be used for tasks such as classification or segmentation. The Outside Image, on the other hand, corresponds to neuron activations in the model's early layers, closer to the input layer. This layer contains low-level features that are more similar to the original pixel values of the input image.
Hidden layer inside image.
Hidden layer outside image.
These low-level characteristics can be used to visualize the learned features or investigate the model's behaviour. CNN-based feature extraction is performed on the 15 layers used in the experiment, and the extracted layer-wise images are shown in Figure 13.
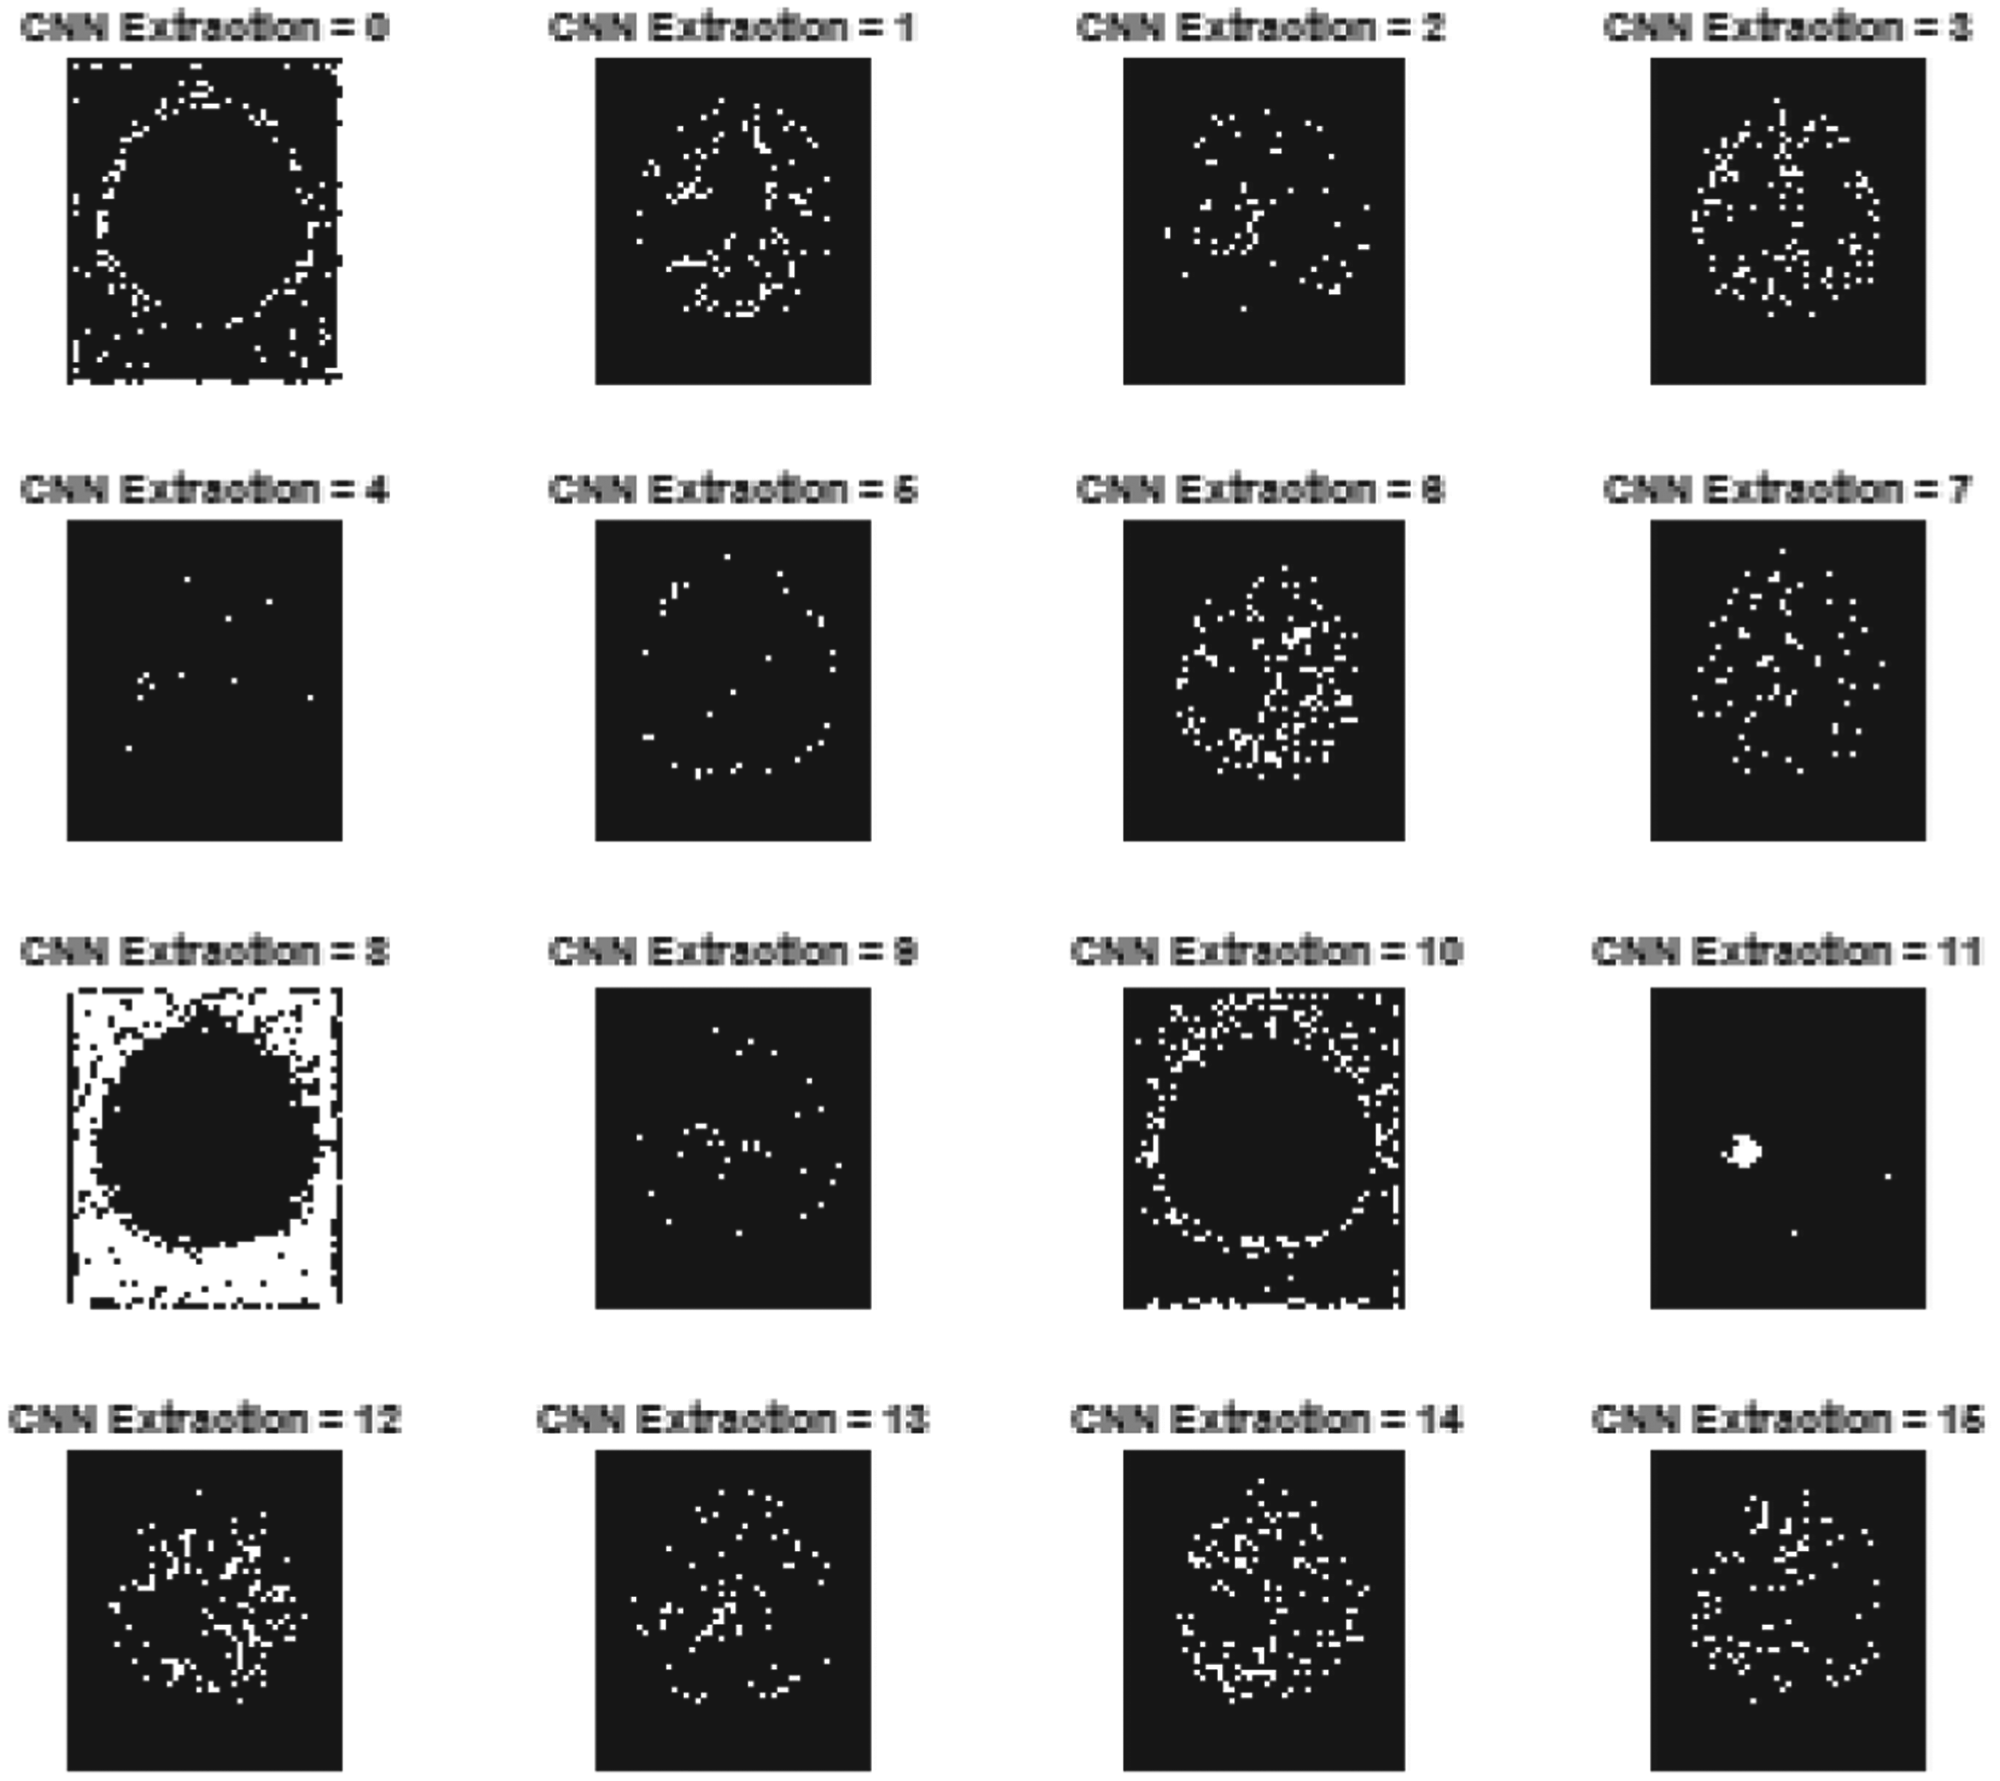
CNN based layer wise feature extracted images.
When these CNN extracted features are subjected to the trained dataset and run through a softmax entropy classification, which is part of the MLCED-Net model, the result is a brain tumour detection area, which, as shown in Figure 14, is an indication that a brain tumour has been found.
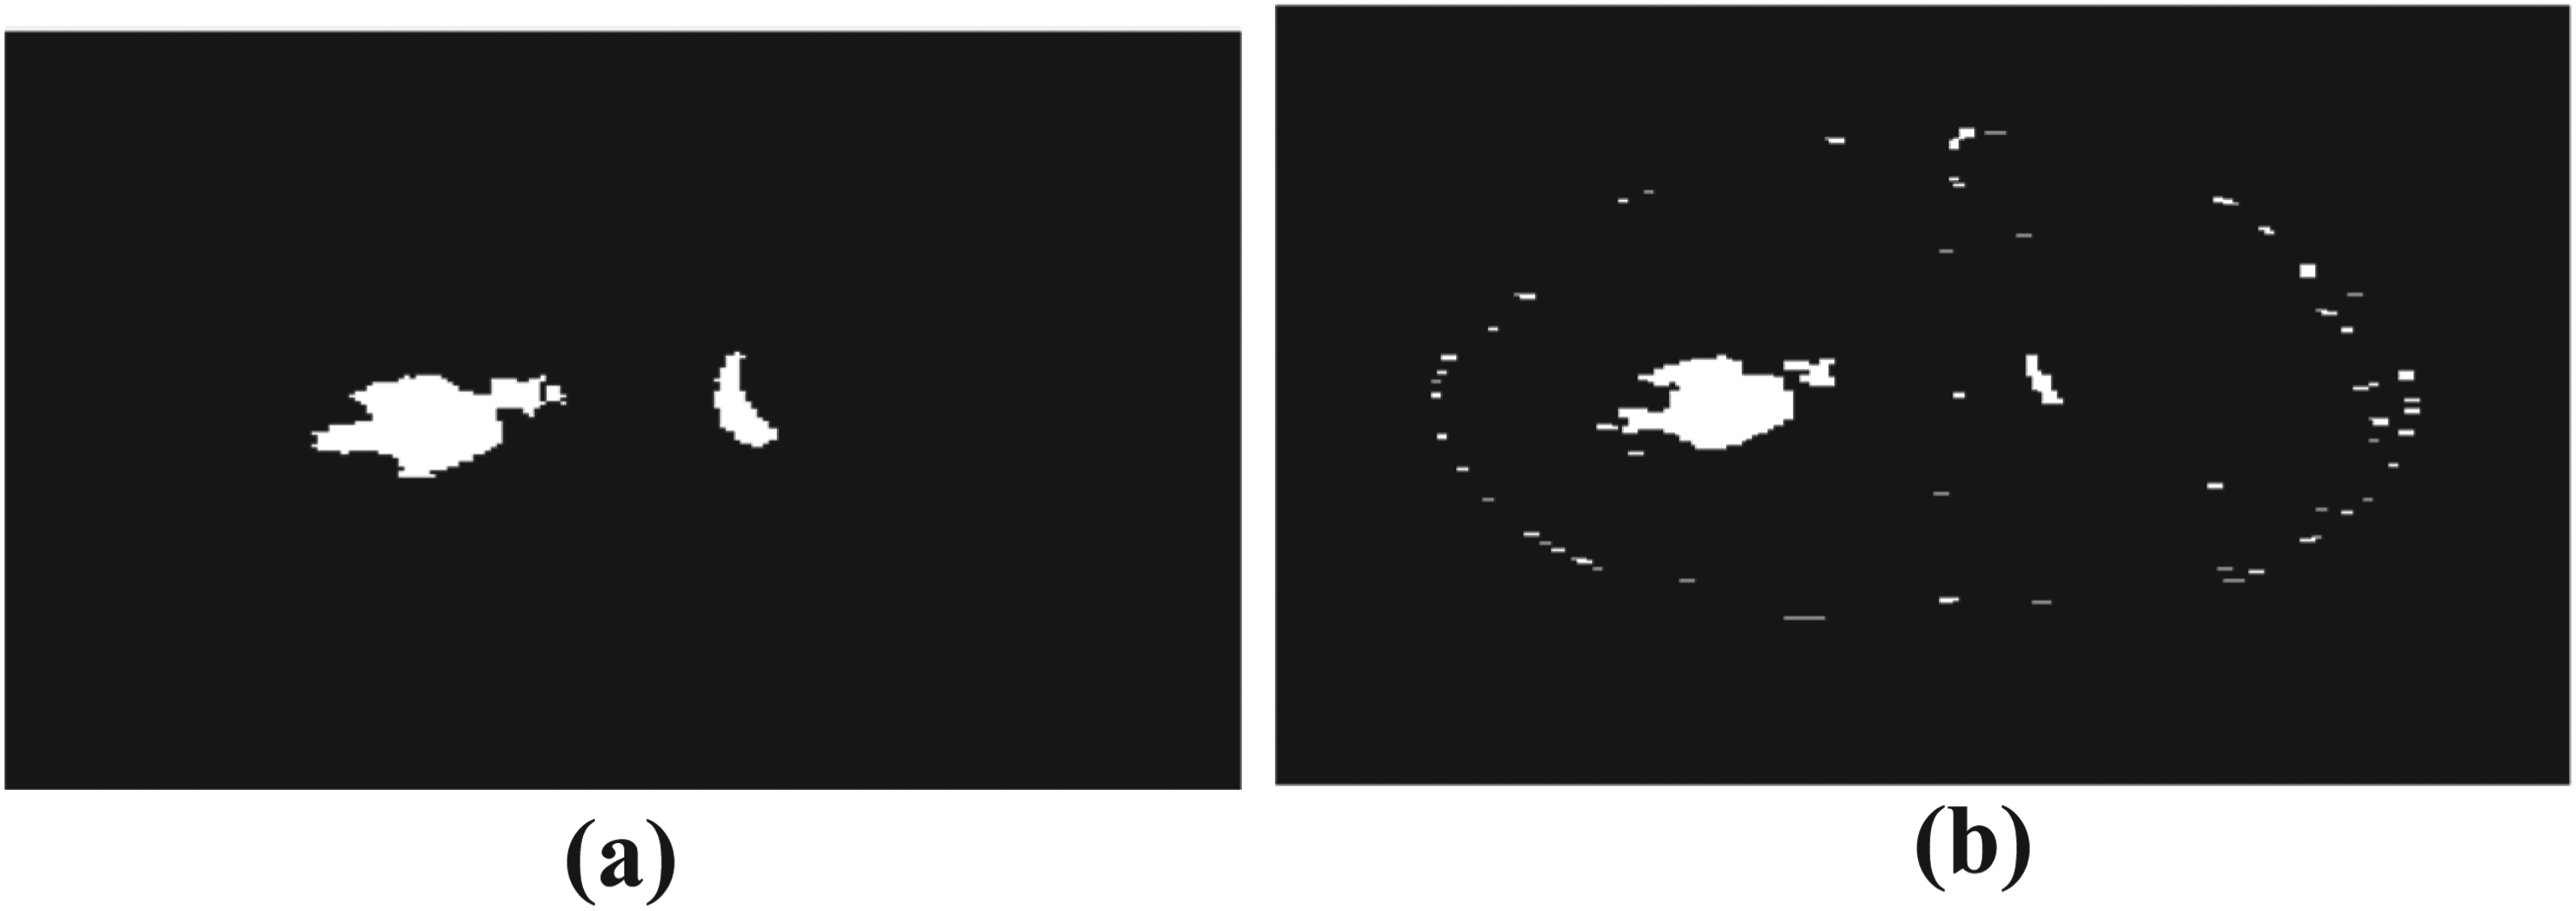
Brain tumor detected regions.
Features extracted for samples of brain tumor images.
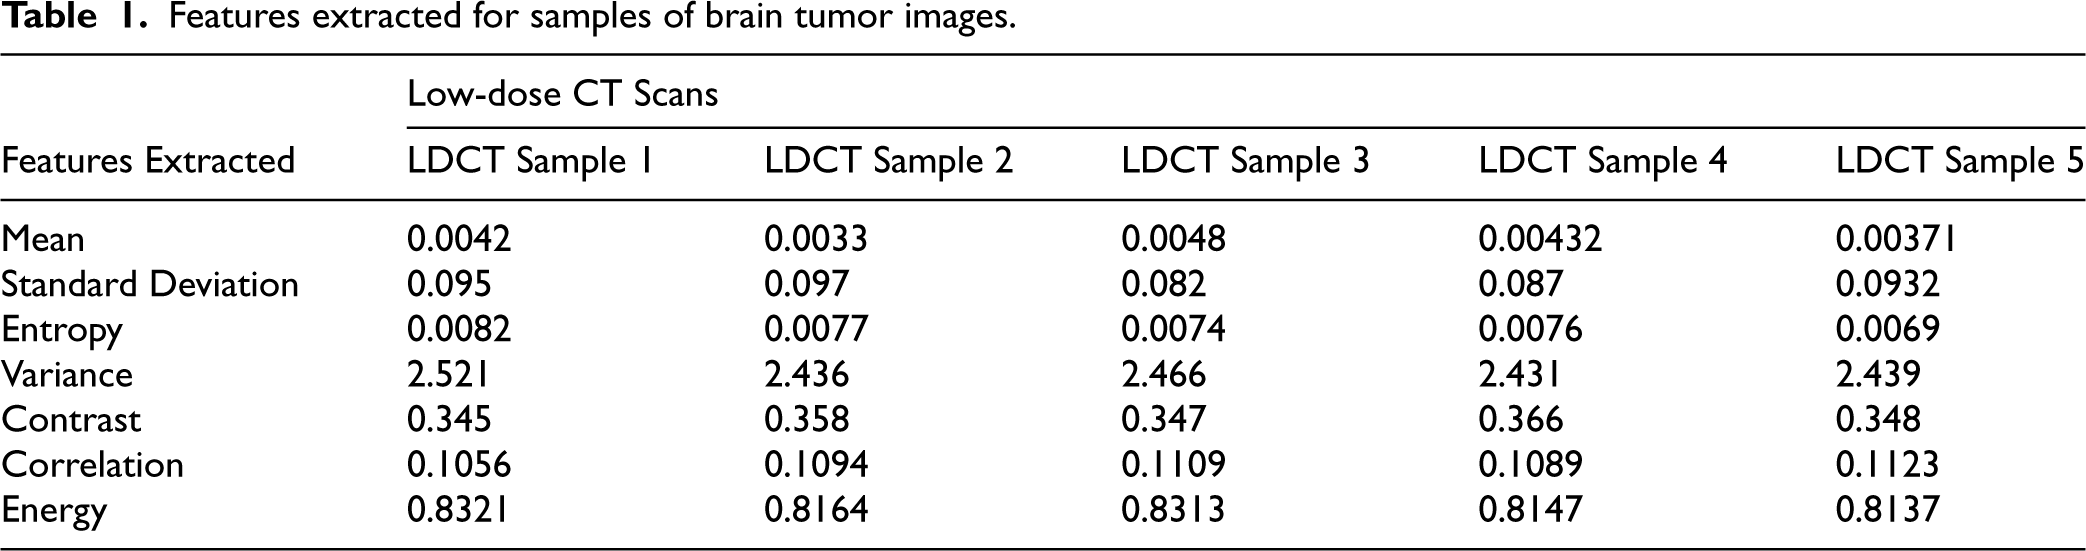
The MLCED-Net model addresses poor contrast, noise, and image quality problems to enhance brain tumour identification in low-dose CT scans. Convolutional layers, edge detection tactics, preprocessing methods, and deep learning layers detect slight variations between healthy and tumour tissues and minimize missed diagnoses. The network was trained on low-dose brain CT scan samples to use in the brain tumour detection process for testing and analysis, and the features extracted during the process are tabulated in Table 1. The proposed deep learning model was trained on an augmented dataset of 2000 samples derived from the initial 200 images in the dataset.33–35 The model was trained using 80% of the augmented dataset (1600 samples) to recognize intricate tumour features. The remaining 20% (400 samples) made up the test set, which assessed the model's performance on previously trained data.
The features that were tabulated are also represented in corresponding graphical plots, where the mean is drawn for 5 samples as shown in Figure 15, Standard Deviation in Figure 16, Entropy in Figure 17, variance in Figure 18, Contrast feature in Figure 19, Correlation in Figure 20, and finally Energy in Figure 21, for easy perception of the behaviour of features for each sample in the detection process.
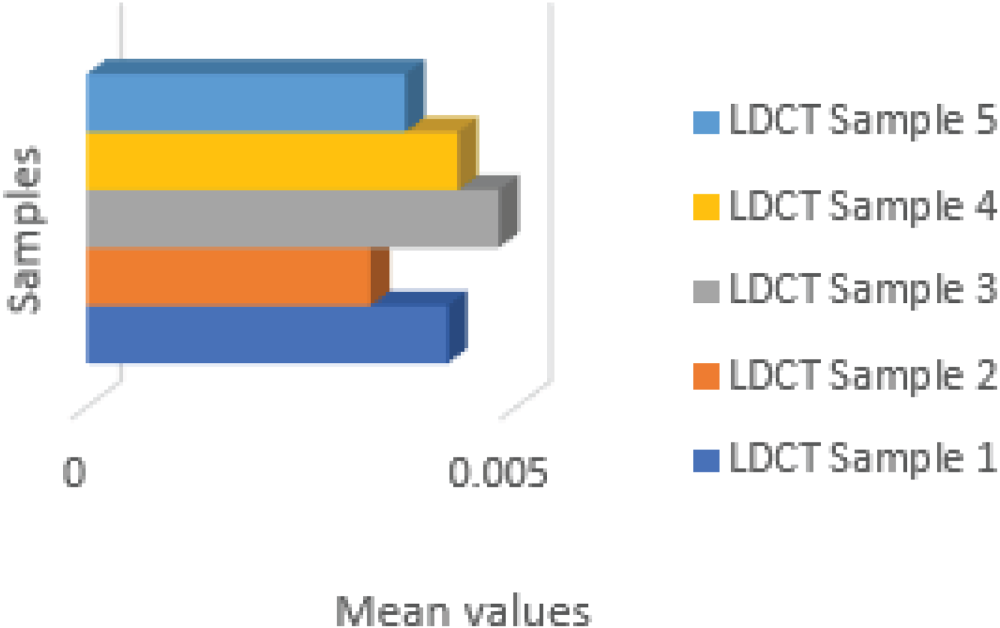
Mean feature.
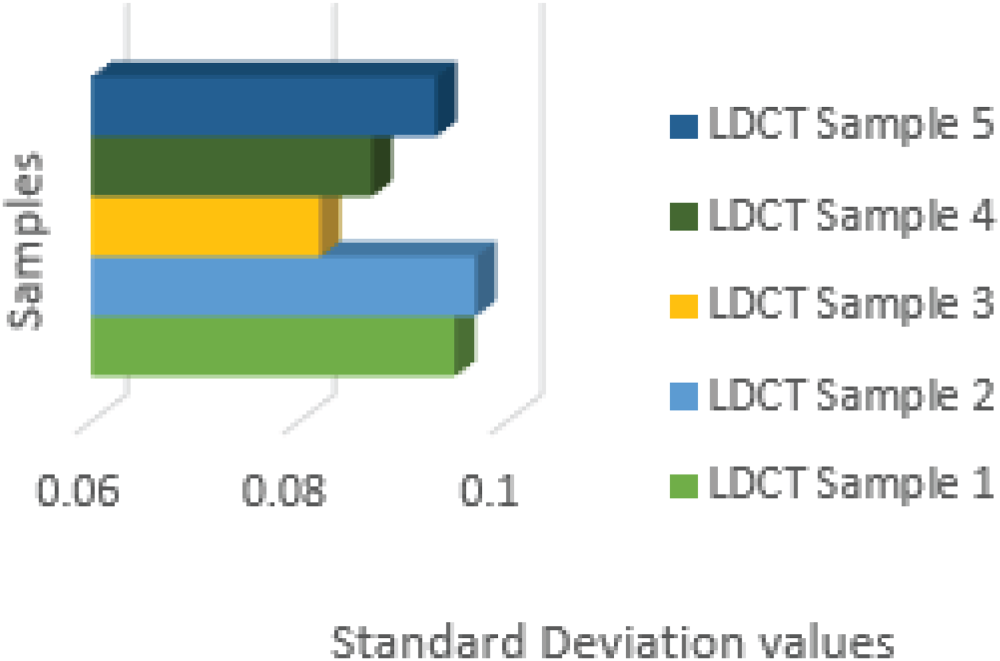
Standard deviation feature.
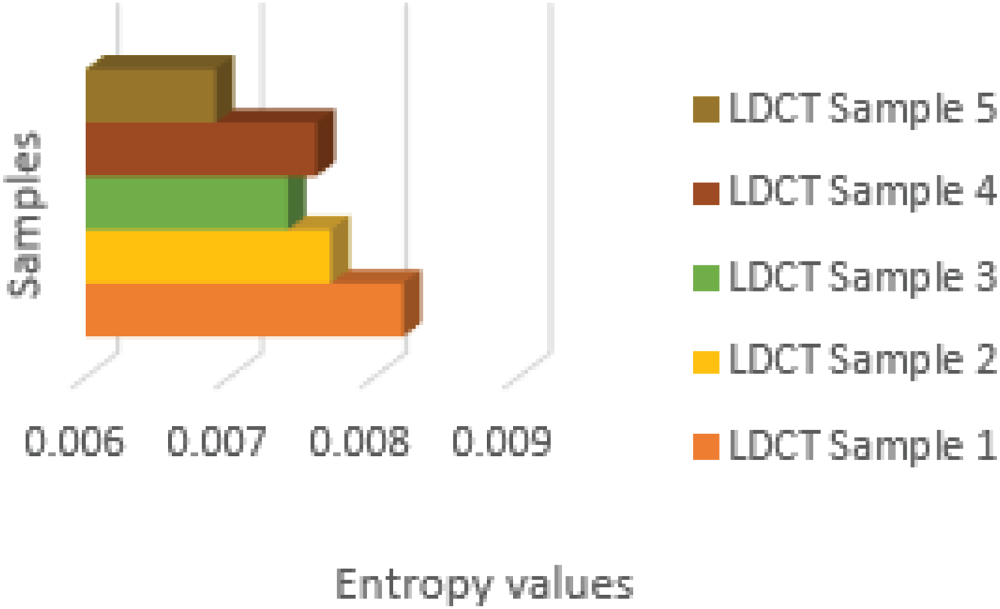
Entropy feature.
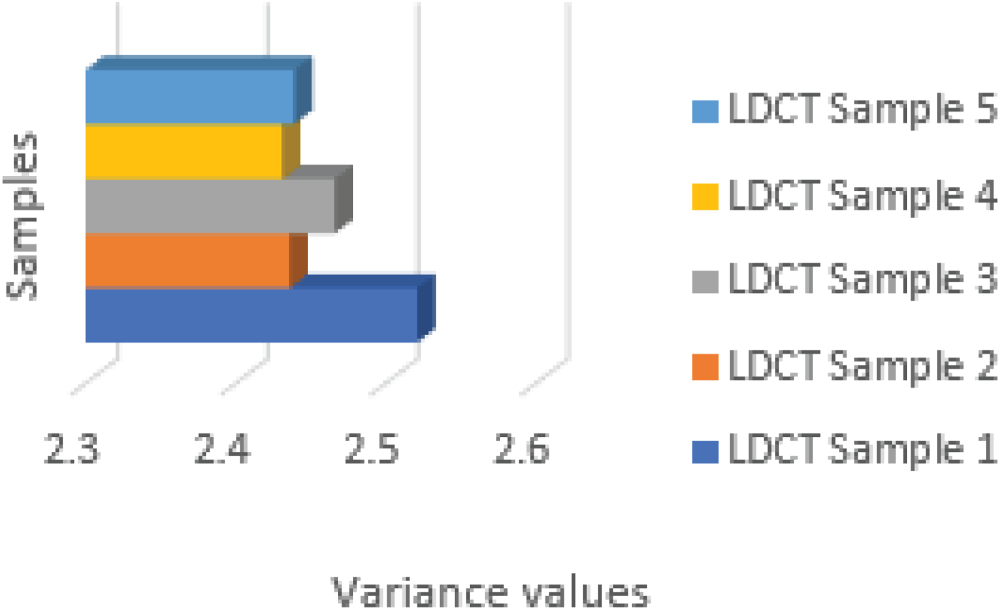
Variance feature.
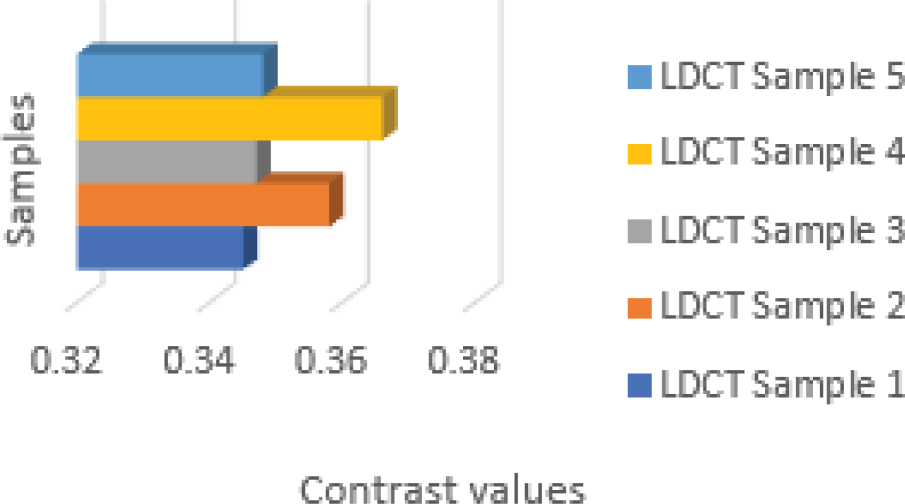
Contrast feature.
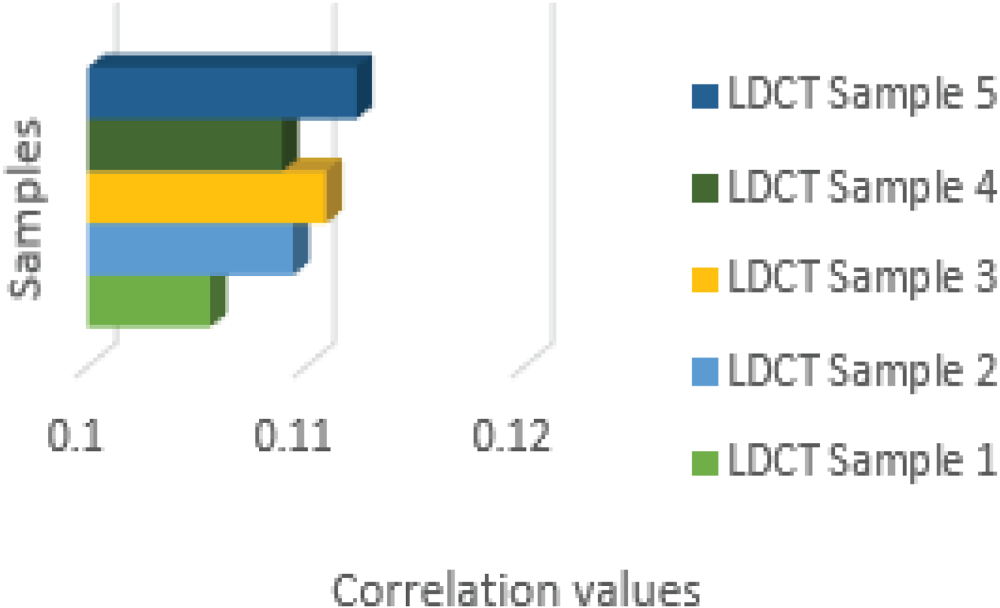
Correlation feature.
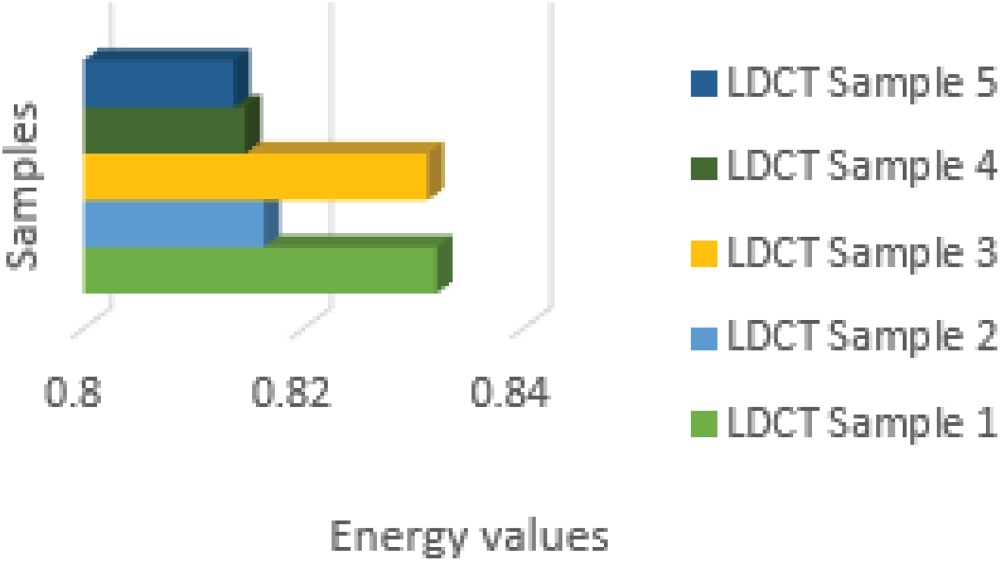
Energy feature.
The mean feature plot displays each sample's pixel intensity values, with higher values indicating brighter portions of the image and lower values indicating darkened portions. The standard deviation diagram illustrates the variation or dispersion of pixel intensity values around the mean for each sample. The entropy plot depicts the randomness or disorder in the distribution of pixel intensity values for each sample. The variance plot depicts how each sample's pixel intensity values deviate from their mean.
The contrast feature plot displays, for each sample, the difference in image pixel intensity values between adjacent pixels. The intensity levels of neighbouring pixels are graphically displayed in a contrast feature plot and are essential for edge definition and picture clarity. In contrast to low contrast, which shows smooth transitions, strong contrast in medical imaging denotes distinct boundaries. Comparison pattern analysis enhances feature extraction and categorization. The correlation plot displays, for each sample, the degree of linear relationship between the pixel intensity values of adjacent pixels in the image.
Lastly, the energy plot displays the overall energy content of the image as the sum of the intensities squared for each sample pixel. These graphs provide valuable information regarding the characteristics and variability of the various features retrieved from Low Dose CT scans across various samples.
The extracted feature values from Low Dose CT scans (LDCST) provide essential information about the characteristics of the brain scan images. The mean values, which range from 0.0033 to 0.0048, indicate that the overall brightness is moderate across the samples. Similarly, the standard deviation values range from 0.082 to 0.097 and show consistent dispersion of pixel intensities around the mean. Lower entropy values (between 0.0069 and 0.0082) indicate more organized and less chaotic pixel distributions. The variance values range from 2.431 to 2.521, indicating that pixel intensities are still closely aligned with their respective means.
The contrast feature captures variations in pixel intensity levels within images, with values ranging from 0.345 to 0.366. The correlation values (0.1056 to 0.1123) indicate that adjacent pixels have a moderate level of linear relationship. Finally, the energy feature values highlight images with significant intensity patterns (0.8137 to 0.8321). MLCED-Net performs exceptionally well in identifying brain tumours in low-dose CT scans. With an accuracy rate of 95–98%, the multi-level convolutional technique catches more significant structures and minute details. Because of its deeper layers, it takes more memory and power even if it is computationally efficient. By post-processing, MLCED-Net improves picture quality even more, outperforming conventional CNNs regarding PSNR.
Metrics including F1-Score, PSNR, DICE, and classification accuracy, precision, and recall are used to evaluate the performance of the MLCED-Net. While precision and recall assess the percentage of actual positive detections, classification accuracy measures the percentage of correct predictions. The F1-Score offers a neutral metric, whereas PSNR assesses the quality of picture reconstruction. DICE is helpful for segmentation jobs since it assesses the overlap between ground truth and anticipated tumour areas. PSNR and Accuracy are considered for the performance evaluation of the proposed adaptive model.
The PSNR can be calculated using the following formula:


Increased precision in diagnosing brain tumours enables more accurate and timely tumour identification, which in turn allows for more effective treatment plans, less intrusive procedures, better tracking of tumour growth, and better patient outcomes. Additionally, it lessens missed diagnoses and false positives. The accuracy of brain tumour detection can be calculated using the following formula:
Here TP – True Positive (identified Tumors), TN – True Negative, FP – False Positive, FN – False Negative (not identified)
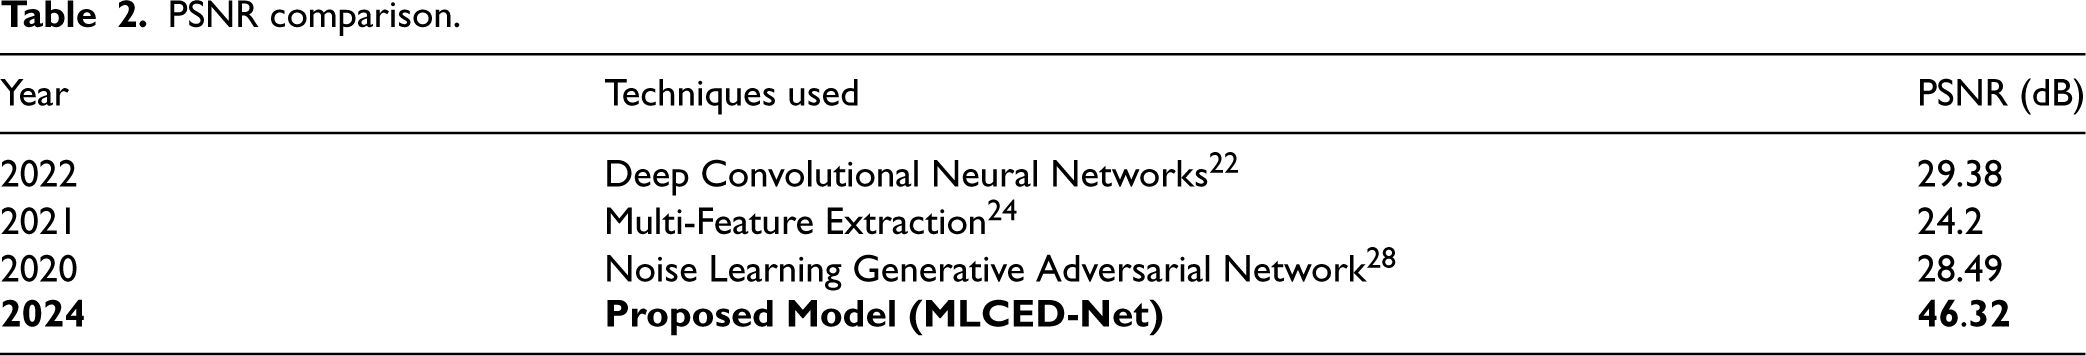
After feeding the extracted features from Table 1 into the MLCED-Net model for detection and classification, an exhaustive performance evaluation is performed, highlighting the model's efficiency in terms of PSNR and Accuracy, as shown in Tables 2 and 3. Notably, the proposed MLCED-Net model attained 46.32 dB, outperforms existing models such as Deep Convolutional Neural Networks,
22
Multi-Feature Extraction,
24
and Noise Learning Generative Adversarial Network
28
in terms of PSNR values.
PSNR comparison.
Accuracy performance evaluation.
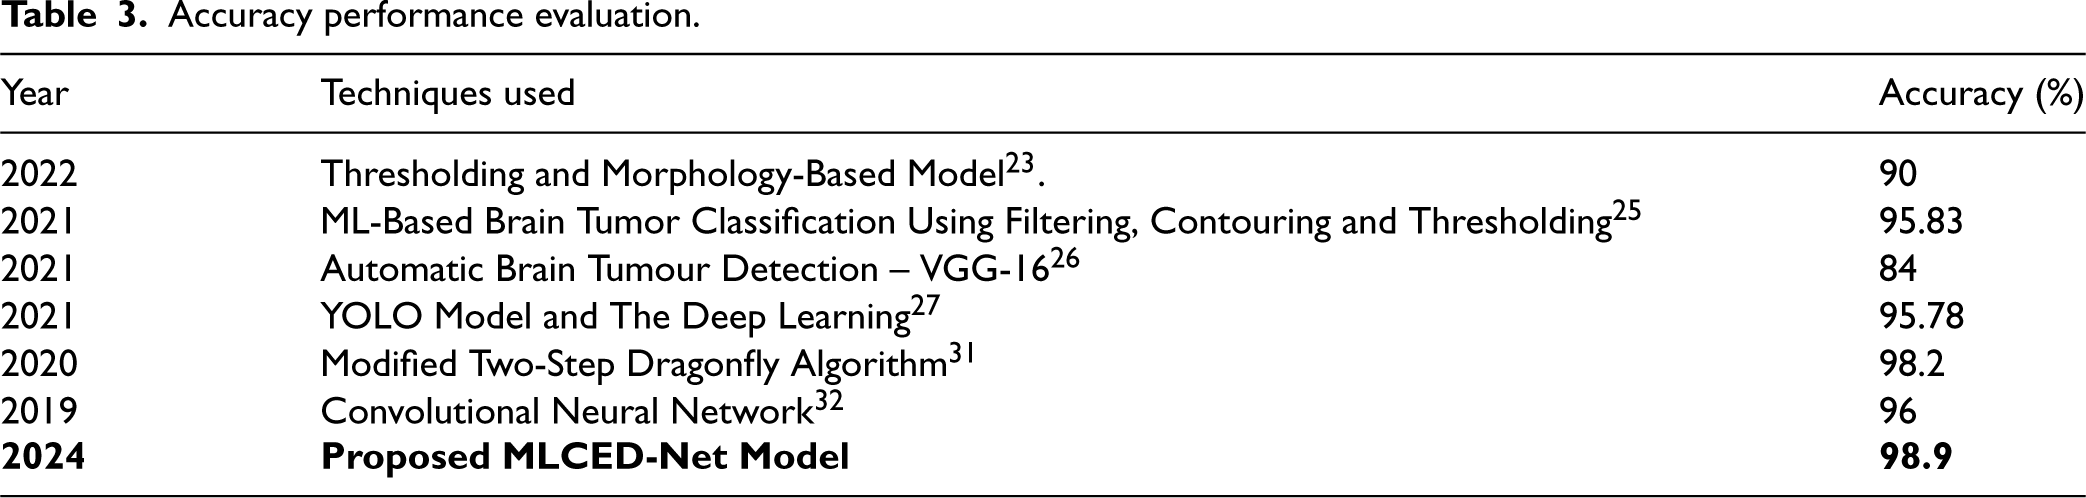
Table 2 and Figure 22 displays the model's PSNR performance, demonstrating its ability to recover image quality while reducing noise artefacts. The results validate the MLCED-Net model's effectiveness, establishing it as a leader in improving image fidelity. Similarly, Table 3 displays accuracy scores, emphasizing the model's ability to classify tumours accurately. The improved accuracy demonstrates the model's ability to distinguish between tumour and non-tumour regions.
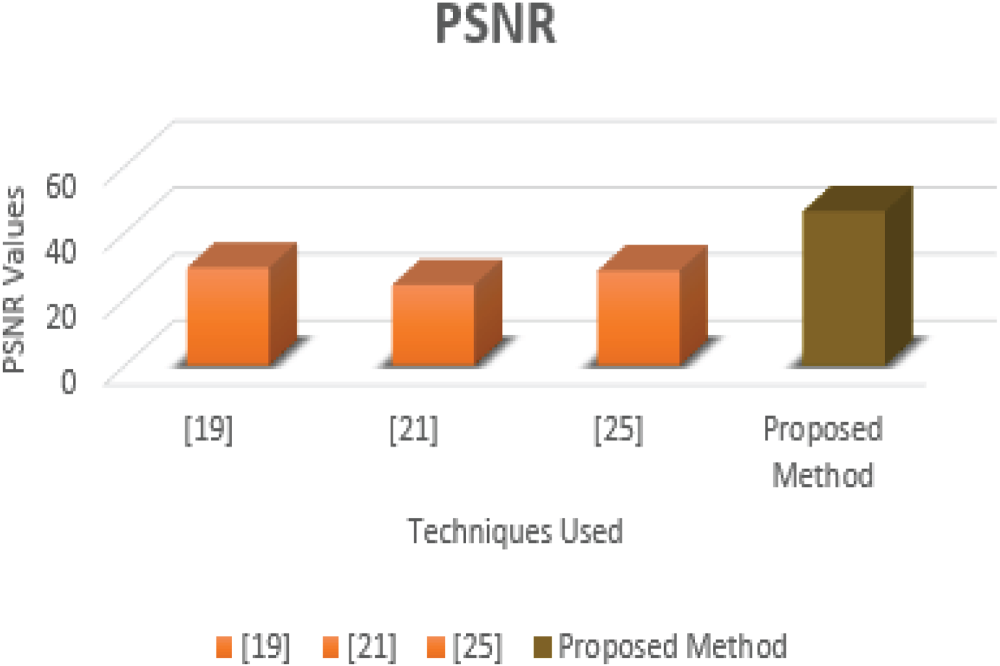
PSNR comparison.
The proposed MLCED-Net Model performs admirably in terms of accuracy, achieving an impressive accuracy rate of 98.9%. This astounding accuracy score demonstrates the model's robustness and efficacy in correctly classifying brain tumour regions within medical images. Notably, the MLCED-Net Model's accuracy outperforms other methodologies used in brain tumour detection and classification.
For example, the proposed MLCED-Net Model outperforms the Thresholding and Morphology-Based Model, 23 a traditional technique commonly used in image segmentation. It also outperforms the ML-Based Brain Tumour Classification Using Filtering Contouring and Thresholding, 25 which combines filtering, contouring, and thresholding to classify tumours. Furthermore, the accuracy of the proposed MLCED-Net Model outperforms that of modern deep learning methods such as Automatic Brain Tumour Detection Using VGG-16, 26 YOLO Model and Deep Learning, 27 and Convolutional Neural Network. 28 Even novel detection methods, such as the Modified Two-Step Dragonfly Algorithm, 32 which uses nature-inspired optimization algorithms, fall short of the MLCED-Net Model's accuracy. The Dragonfly Algorithm has been improved and is utilized for medical imaging optimization using the MTDA. Imitating the swarming behaviour of dragonflies optimizes the weights and parameters of deep-learning models to enhance tumour identification in low-dose CT scans.
Figure 23, titled “Accuracy Comparison,” is a compelling visual representation highlighting the Proposed MLCED-Net Model's exceptional brain tumour detection and classification accuracy. This graphical comparison shows how the model outperforms other established methods in accuracy, confirming its superiority in medical image analysis. The plot prominently displays the accuracy scores obtained by various methods, allowing for a direct and easily interpreted comparison. Thresholding and Morphology-Based Model, 23 ML-Based Brain Tumour Classification using Filtering Contouring and Thresholding, 25 Automatic Brain Tumour Detection - VGG-16, 26 YOLO Model And Deep Learning, 27 Modified Two-Step Dragonfly Algorithm, 31 and Convolutional Neural Network 32 are among the competing methods included in the plot.
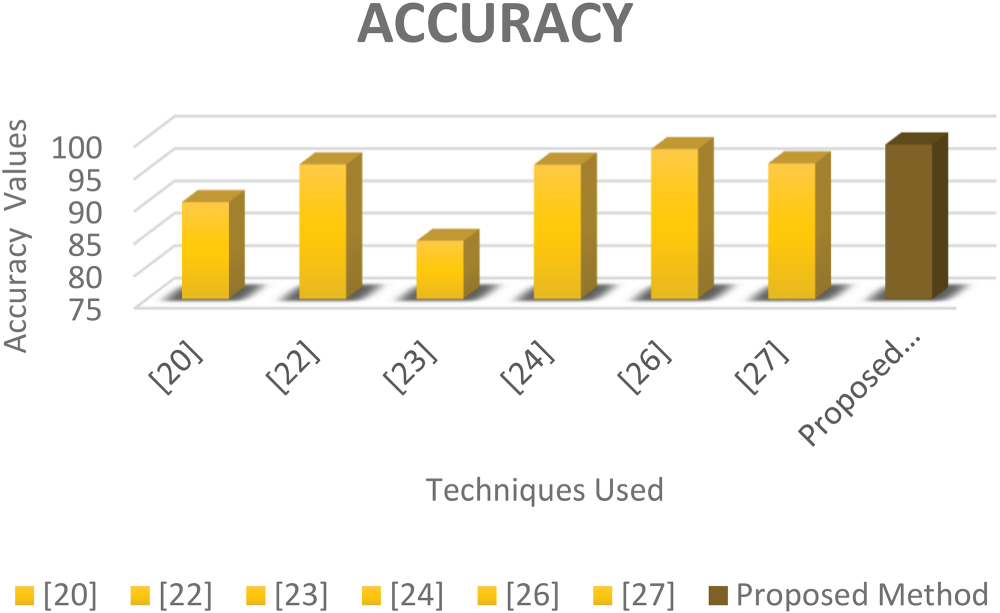
Accuracy comparison.
Notably, the accuracy of the proposed MLCED-Net Model is impressive, standing at 98.9%. As the graph shows, this accuracy score significantly outperforms the other methods. This visual representation effectively conveys the model's outstanding performance compared to various methodologies. Comparing the PSNR and Accuracy of the proposed Adaptive system to those of existing methods reveals that the proposed system is superior at detecting and classifying brain tumours in low-dose CT scans. Due to artefacts, decreased contrast, increased noise, and loss of resolution, low-dose CT scans might be challenging to detect brain tumours. Image processing is complicated, and these problems make it more difficult for automated models and radiologists to distinguish between healthy and tumour tissue. High PSNR values indicate that the reconstructed images are of higher quality and contain less noise.
In contrast, high accuracy values suggest that the system can identify and classify tumours with high accuracy. This indicates that the proposed system is more dependable and accurate in detecting and classifying brain tumours, which is essential for medical diagnosis and treatment planning. The proposed system's higher performance metrics can result in the earlier and more accurate detection of brain tumours, thereby improving patient outcomes and saving lives.
Our efforts to detect and classify brain tumours within low-dose CT images have yielded promising results. The developed system consists of several intricately designed processes such as deblurring, adaptive histogram equalization, pixel normalization, elimination, and feature extraction via decorrelation stretching and complexity feature extraction. These painstakingly gathered features are fed into our novel Proposed MLCED-Net model, which orchestrates tumour detection and classification. Surprisingly, the system achieved a PSNR value of 46.32 dB, indicating remarkable success in restoring image quality and minimizing noise artefacts. Furthermore, the system demonstrated a noteworthy accuracy rate of 98.9%, demonstrating its ability to classify brain tumour regions accurately. These results significantly outperform existing approaches for detecting brain tumours in low-dose CT images. In the future, the scope for system enhancement remains broad. Future developments could include incorporating more advanced preprocessing techniques, novel feature extraction methods, and novel architectural designs. Scaling it up to a larger dataset would ensure its robustness across a broader range of images, thereby broadening its potential applicability.
Furthermore, expanding the system's capabilities to include other medical imaging modalities, such as MRI and ultrasound, could increase its versatility. Overall, the proposed approach has the potential to significantly improve the accuracy and efficiency of brain tumour identification and classification, potentially leading to better patient care and outcomes. The innovation at hand not only demonstrates impressive accomplishments but also lays the groundwork for future advancements in the field of medical image analysis.
Footnotes
Authors’ contributions
Katari Balakrishna, is responsible for designing the framework, analyzing the performance, validating the results, and writing the article. A. Nagaraja Rao, is responsible for collecting the information required for the framework, provision of software, critical review, and administering the process.
Funding
The authors received no financial support for the research, authorship, and/or publication of this article.
Declaration of conflicting interests
The authors declared no potential conflicts of interest with respect to the research, authorship, and/or publication of this article.
Data availability statement
No datasets were generated or analyzed during the current study.