
Abstract
Background and Objective
Budd-Chiari syndrome (BCS) presents challenges in postoperative restenosis risk prediction due to unclear hemodynamic pathophysiology. Despite advances in interventional therapies, tools linking hemodynamic abnormalities to vascular remodeling are lacking. This study aimed to evaluate hemodynamic changes in BCS patients with inferior vena cava (IVC) stenosis using patient-specific MRI and computational fluid dynamics (CFD) to establish predictive biomarkers and optimize management.
Methods
3D IVC models were reconstructed from preoperative, postoperative, and healthy control MRI data. Dynamic hemodynamic parameters, including flow velocity, pressure gradients, wall shear stress (WSS), and vortex patterns, were analyzed via CFD simulations under physiologically accurate boundary conditions.
Results
Preoperative IVC stenosis caused severe disturbances. Post-intervention, parameters decreased (e.g., peak stenotic velocity from 1.91 m/s to 0.97 m/s; trans-stenotic pressure gradient from 3562 Pa to 1404 Pa) but remained higher than normal (peak velocity: 0.27 m/s; pressure fluctuation: Δ1225 Pa). Persistent vortices near stent edges and incomplete pressure normalization were observed, correlating with restenosis incidence. These findings highlight unresolved WSS (post-op peak WSS: 18.2 Pa vs normal: 6.18 Pa) and abnormal flow dynamics (e.g., prolonged vortex duration) as key recurrence risks.
Conclusion
This study provides a hemodynamic framework for BCS, showing that intervention alleviates stenosis but doesn't restore normal flow. Residual stress emphasizes the need for adjunct therapies. The CFD approach offers predictive insights, advocating personalized monitoring for improved BCS outcomes.
Introduction
Budd-Chiari Syndrome (B-CS) is characterized by obstructive lesions in the hepatic veins or the inferior vena cava (IVC), particularly proximal to the hepatic venous outlet. This obstruction impedes venous outflow, leading to elevated intrahepatic pressure and subsequent complications such as portal hypertension (PHT) and/or IVC hypertension syndrome. 1 Clinically, B-CS manifests in three subtypes: IVC-dominant, hepatic vein-dominant, and mixed types. In China, the IVC-dominant and mixed types are more prevalent.2–5 IVC stenosis (IVCS), a hallmark of the IVC-dominant subtype, disrupts hemodynamic stability by reducing cardiac preload, which may culminate in dyspnea, ascites, abdominal/lower limb varices, and multi-organ failure-conditions associated with high mortality risk.
Current therapeutic strategies for B-CS, including decompressive surgery, liver transplantation, interventional radiology, anticoagulation, and medical management, prioritize post-interventional outcomes and recurrence prevention.6–14 While interventional therapies such as angioplasty and stenting have demonstrated efficacy in alleviating IVC mechanical stenosis,15–18 systematic quantification of residual hemodynamic risks-including pathological pressure gradients and turbulent flow patterns-remains underexplored. Meanwhile, two critical challenges persist: the pathophysiological mechanisms driving B-CS progression remain poorly defined, and clinical tools to quantitatively predict post-interventional recurrence are lacking.19–21 In recent years, hemodynamic studies have advanced the understanding of arterial diseases (e.g., cerebral aneurysms and coronary atherosclerosis), particularly through wall shear stress (WSS) and flow disturbance analyses,22–26 analogous research on venous obstructive diseases like B-CS remains limited. Recent advancements in hemodynamic investigations predominantly rely on static flow assumptions or animal experimental models,23–27 with boundary conditions often extrapolated from hepatic data of healthy populations. This approach inadequately captures dynamic flow characteristics under pathological states, particularly the spatiotemporal evolution of biomechanical forces during the cardiac cycle. Recent advancements in computational fluid dynamics (CFD) for arterial diseases have demonstrated the critical predictive value of spatiotemporally resolved hemodynamic parameters (e.g., WSS, pressure gradients, vortex dynamics) in vascular remodeling mechanisms.28–31 Yet, the translational application of these methodologies to venous obstructive diseases remains constrained by the absence of patient-specific dynamic boundary conditions.
Clinically, post-interventional evaluations for B-CS predominantly focus on morphological restoration and macroscopic blood flow patency, neglecting quantitative hemodynamic metrics that could refine prognostic assessments. BCS presents unique hemodynamic challenges due to its heterogeneous stenosis patterns and complex post-interventional outcomes. While existing imaging modalities provide anatomical insights, critical gaps remain in quantifying the spatiotemporal evolution of biomechanical forces and their clinical implications.32–34 To address these critical gaps, this study establishes an integrative MRI-CFD methodology to develop a patient-specific, time-resolved hemodynamic framework for BCS. This approach combines dynamic 3D IVC reconstruction using pre/postoperative and normal MRI data, and CFD simulations incorporating physiologically accurate boundary conditions defined by real-time cardiac cycle pressure waveforms acquired via the Seldinger technique. Through quantitative characterization of hemodynamic alterations, this framework systematically evaluates pre-to-post intervention changes against normal IVC hemodynamics. It further identifies residual hemodynamic abnormalities correlated with restenosis risk, thereby providing a predictive assessment reference for interventional efficacy beyond anatomical restoration.
Materials and methods
Image acquisition
A male patient aged 53 with BCS was scheduled for a magnetic resonance imaging (MRI) examination. The inclusion criteria were strictly defined as: (a) DSA-confirmed membranous IVC stenosis (>90% occlusion); (b) Isolated BCS without hepatic vein involvement; (c) No anticoagulation within 6 months post-intervention. Exclusion criteria included: (a) Congenital vascular anomalies; (b) Prior hepatic surgery. Preoperative and postoperative MRI scans were performed using a GE Signa EXCITE 3.0 T MR system with 8-channel TORSOPA abdominal coil, alongside a healthy 47-year-old female control undergoing routine hepatic MRI that excluded BCS and confirmed normal hemodynamics.
The imaging protocol employed gadolinium-DTPA (0.1 mmol/kg, total 3 ml) delivered via high-pressure syringe, with the following parameters: T1WI, T2WI, and LAVA sequences, featuring a matrix size of 288 × 256, bandwidth of 83.33 MHz, field of view (FOV) of 40 cm, slice thickness of 4.4 mm, flip angle of 12°, venous phase duration of 70 s, and a subsequent delay phase of 120 s. The normal model would serve as a benchmark, i.e., the normal hemodynamic parameters, for preoperative and postoperative contrastive analysis, which could contribute to a more accurate postoperative evaluation of the efficacy of the surgery for BCS.
Inferior vena cava modelling
The MRI image data obtained were processed and reconstructed using Mimics 21.0, a specialized medical image processing software, employing the DICOM format. This process enabled the generation of precise geometric models of the patient's IVC. Subsequent segmentation of these models was executed using a sophisticated multi-threshold adaptive algorithm. Expert technicians carefully evaluated and adjusted the initial gray level characteristics of the IVC for enhanced accuracy. Ultimately, 3D reconstruction models of the IVC were meticulously created, meticulously preserving the original physiological and anatomical properties.
Governing equations and boundary conditions
In this CFD simulation, blood is modeled as a homogeneous, non-Newtonian fluid. The governing equations for blood flow, as detailed in reference,
35
are as follows.


Where u represents the velocities, t is the time,


All values were taken from the literature,
Patient-specific preoperative, postoperative, and normal 3D models were imported into ANSYS Fluent 2022 R1 to generate meshes, with the number of grids detailed in Table 1. The pressure values are obtained from the Seldinger technique, which involves puncturing the right inguinal region and inserting a 5F sheath. A 4F curved catheter is then advanced into the hepatic segment of the inferior vena cava using a guidewire for angiography. Once the diagnosis is confirmed, the patient is connected to an electrocardiogram monitor to continuously measure the pressure in inferior vena cava. The right jugular vein is punctured to obtain a complete atrial pressure waveform with the same method. A specific cardiac cycle is selected, and the atrial pressure curve is fitted to create a matching atrial pressure graph. This enables the extraction of pressure values within that particular cardiac cycle.
Number of model grids.

Since the blood flow in the IVC is a turbulent flow, current study used shear stress turbulence model to account for turbulent velocity due to its accuracy in predicting the turbulent behavior of blood in IVC. Additionally, the residual convergence criteria were set as
Hemodynamic flow velocity, pressure, wall shear stress (WSS) was calculated. Literature widely acknowledges the close relationship between shear stress and the activation of endothelial cells.
38
WSS is calculated using the following equation.
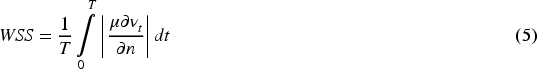
Result
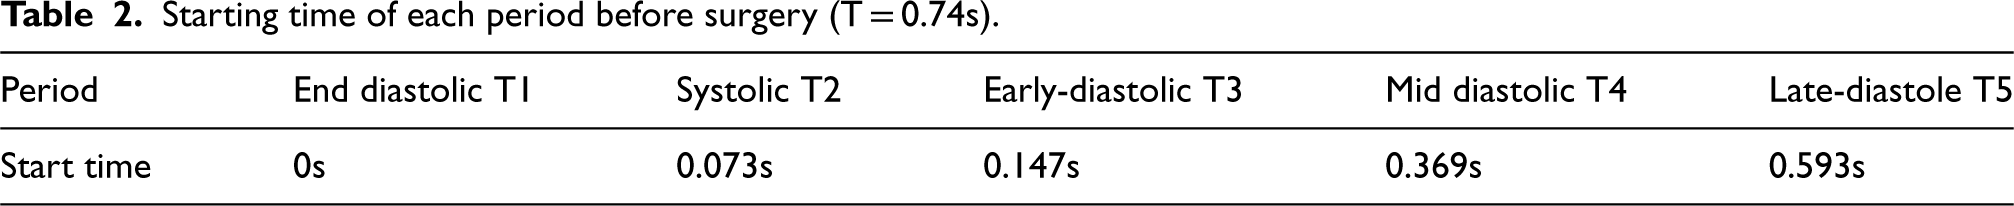
Preoperative, postoperative, and control IVC models were analyzed across defined cardiac phases (Tables 2–4). Monitoring points (1–7) were positioned in pre-stenotic, stenotic, and post-stenotic segments (Figure 1(a)-(c)) to assess velocity, pressure, and wall shear stress (WSS) dynamics.
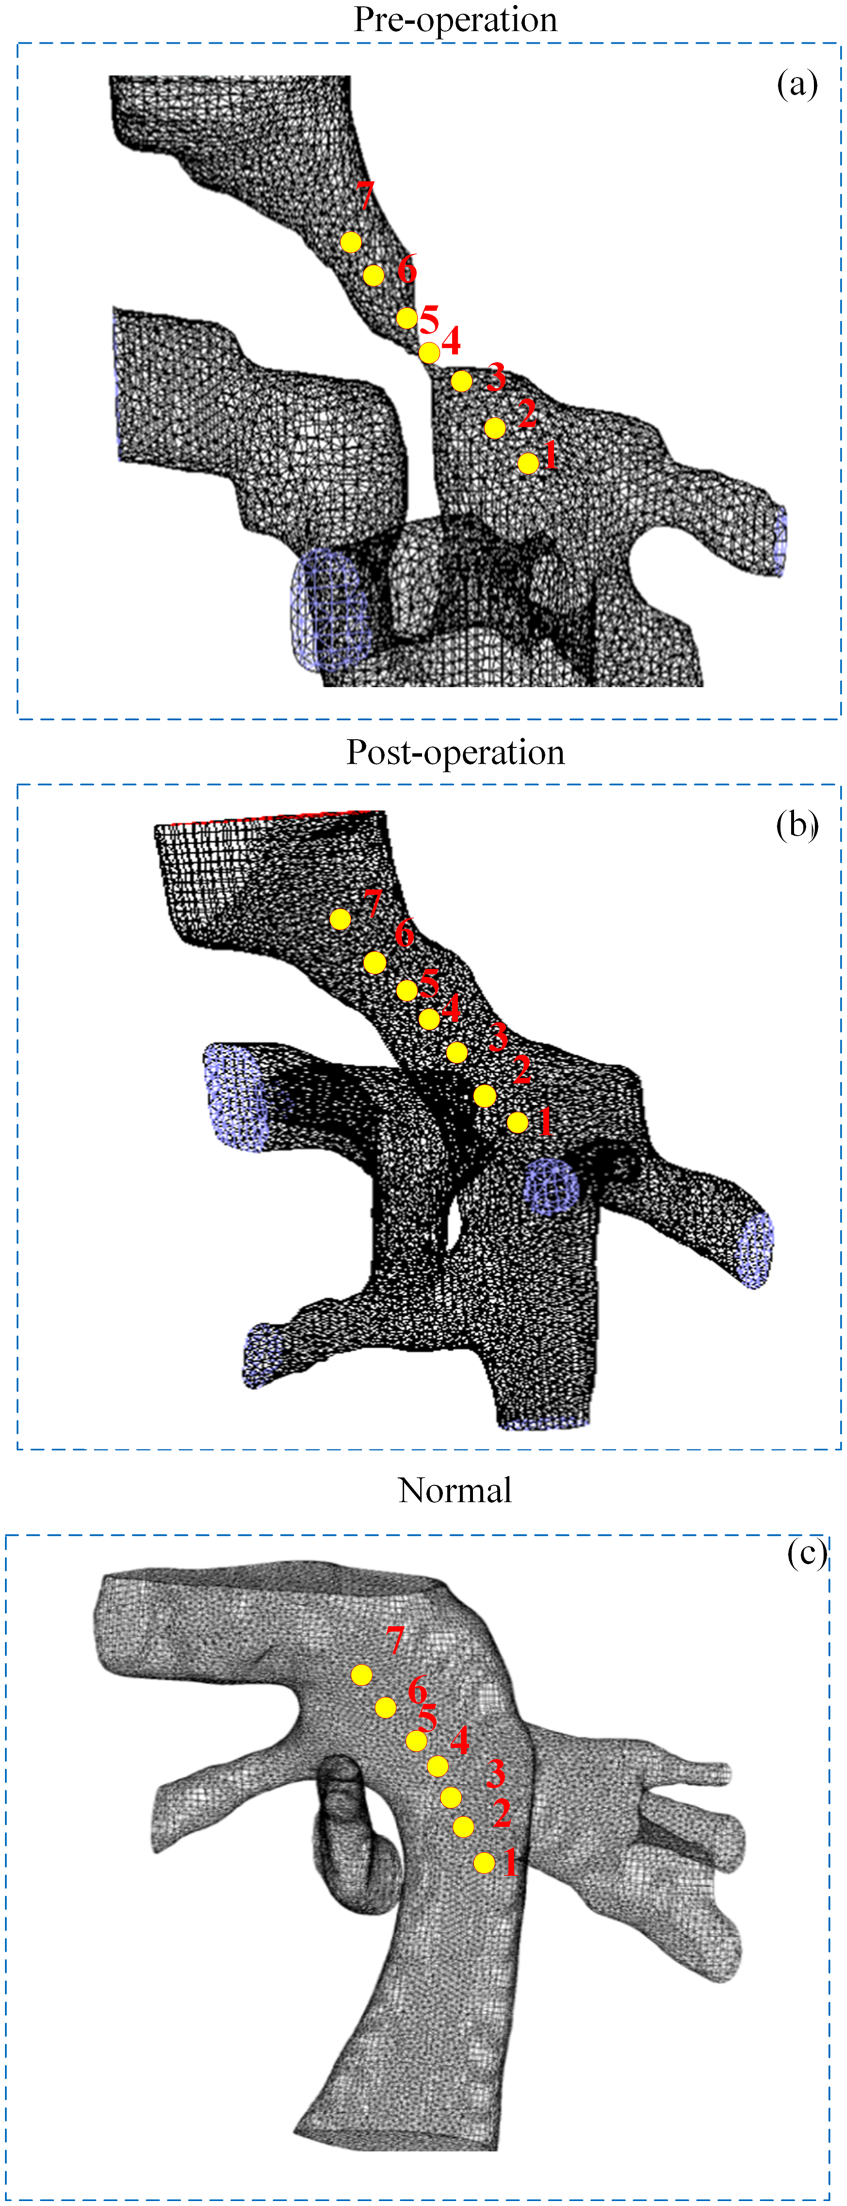
Monitoring points in IVC: (a) monitoring points in pre-operative IVC; (b) monitoring points in post-operative IVC; (c) monitoring points in normal IVC.
Starting time of each period before surgery (T = 0.74s).
Starting time point of each period after operation (T = 0.74s).
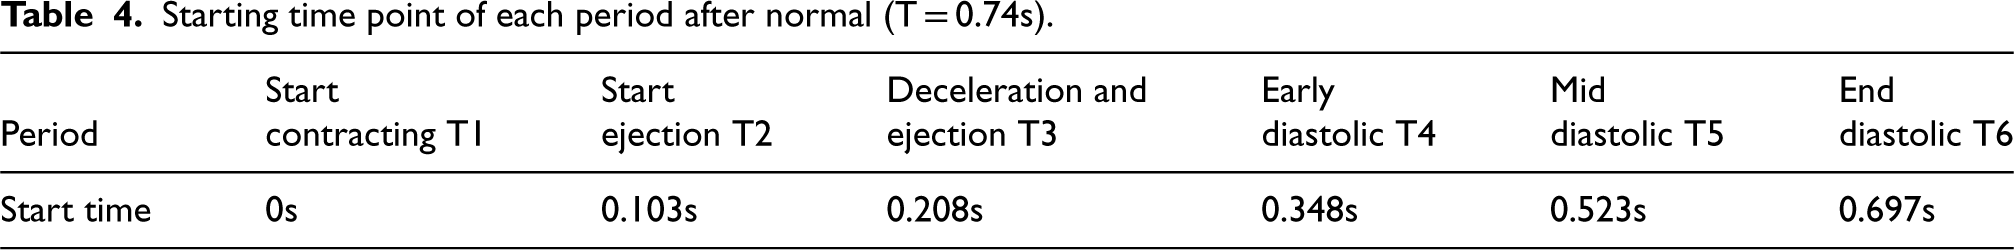
Starting time point of each period after normal (T = 0.74s).

Velocity
Preoperative stenosis exhibited a peak velocity of 1.91 m/s at the stenotic segment (point 4), with a sharp velocity gradient (Δ1.90 m/s) between the stenosis and adjacent regions (Figure 2(a)). Post-intervention, peak velocity decreased by 49% (0.97 m/s), accompanied by a smoother velocity transition across the cardiac cycle (Figure 2(b)). Individuals without stenosis demonstrated laminar flow with stable velocities (0.004–0.27 m/s) and a parabolic profile (Figure 2(c)).
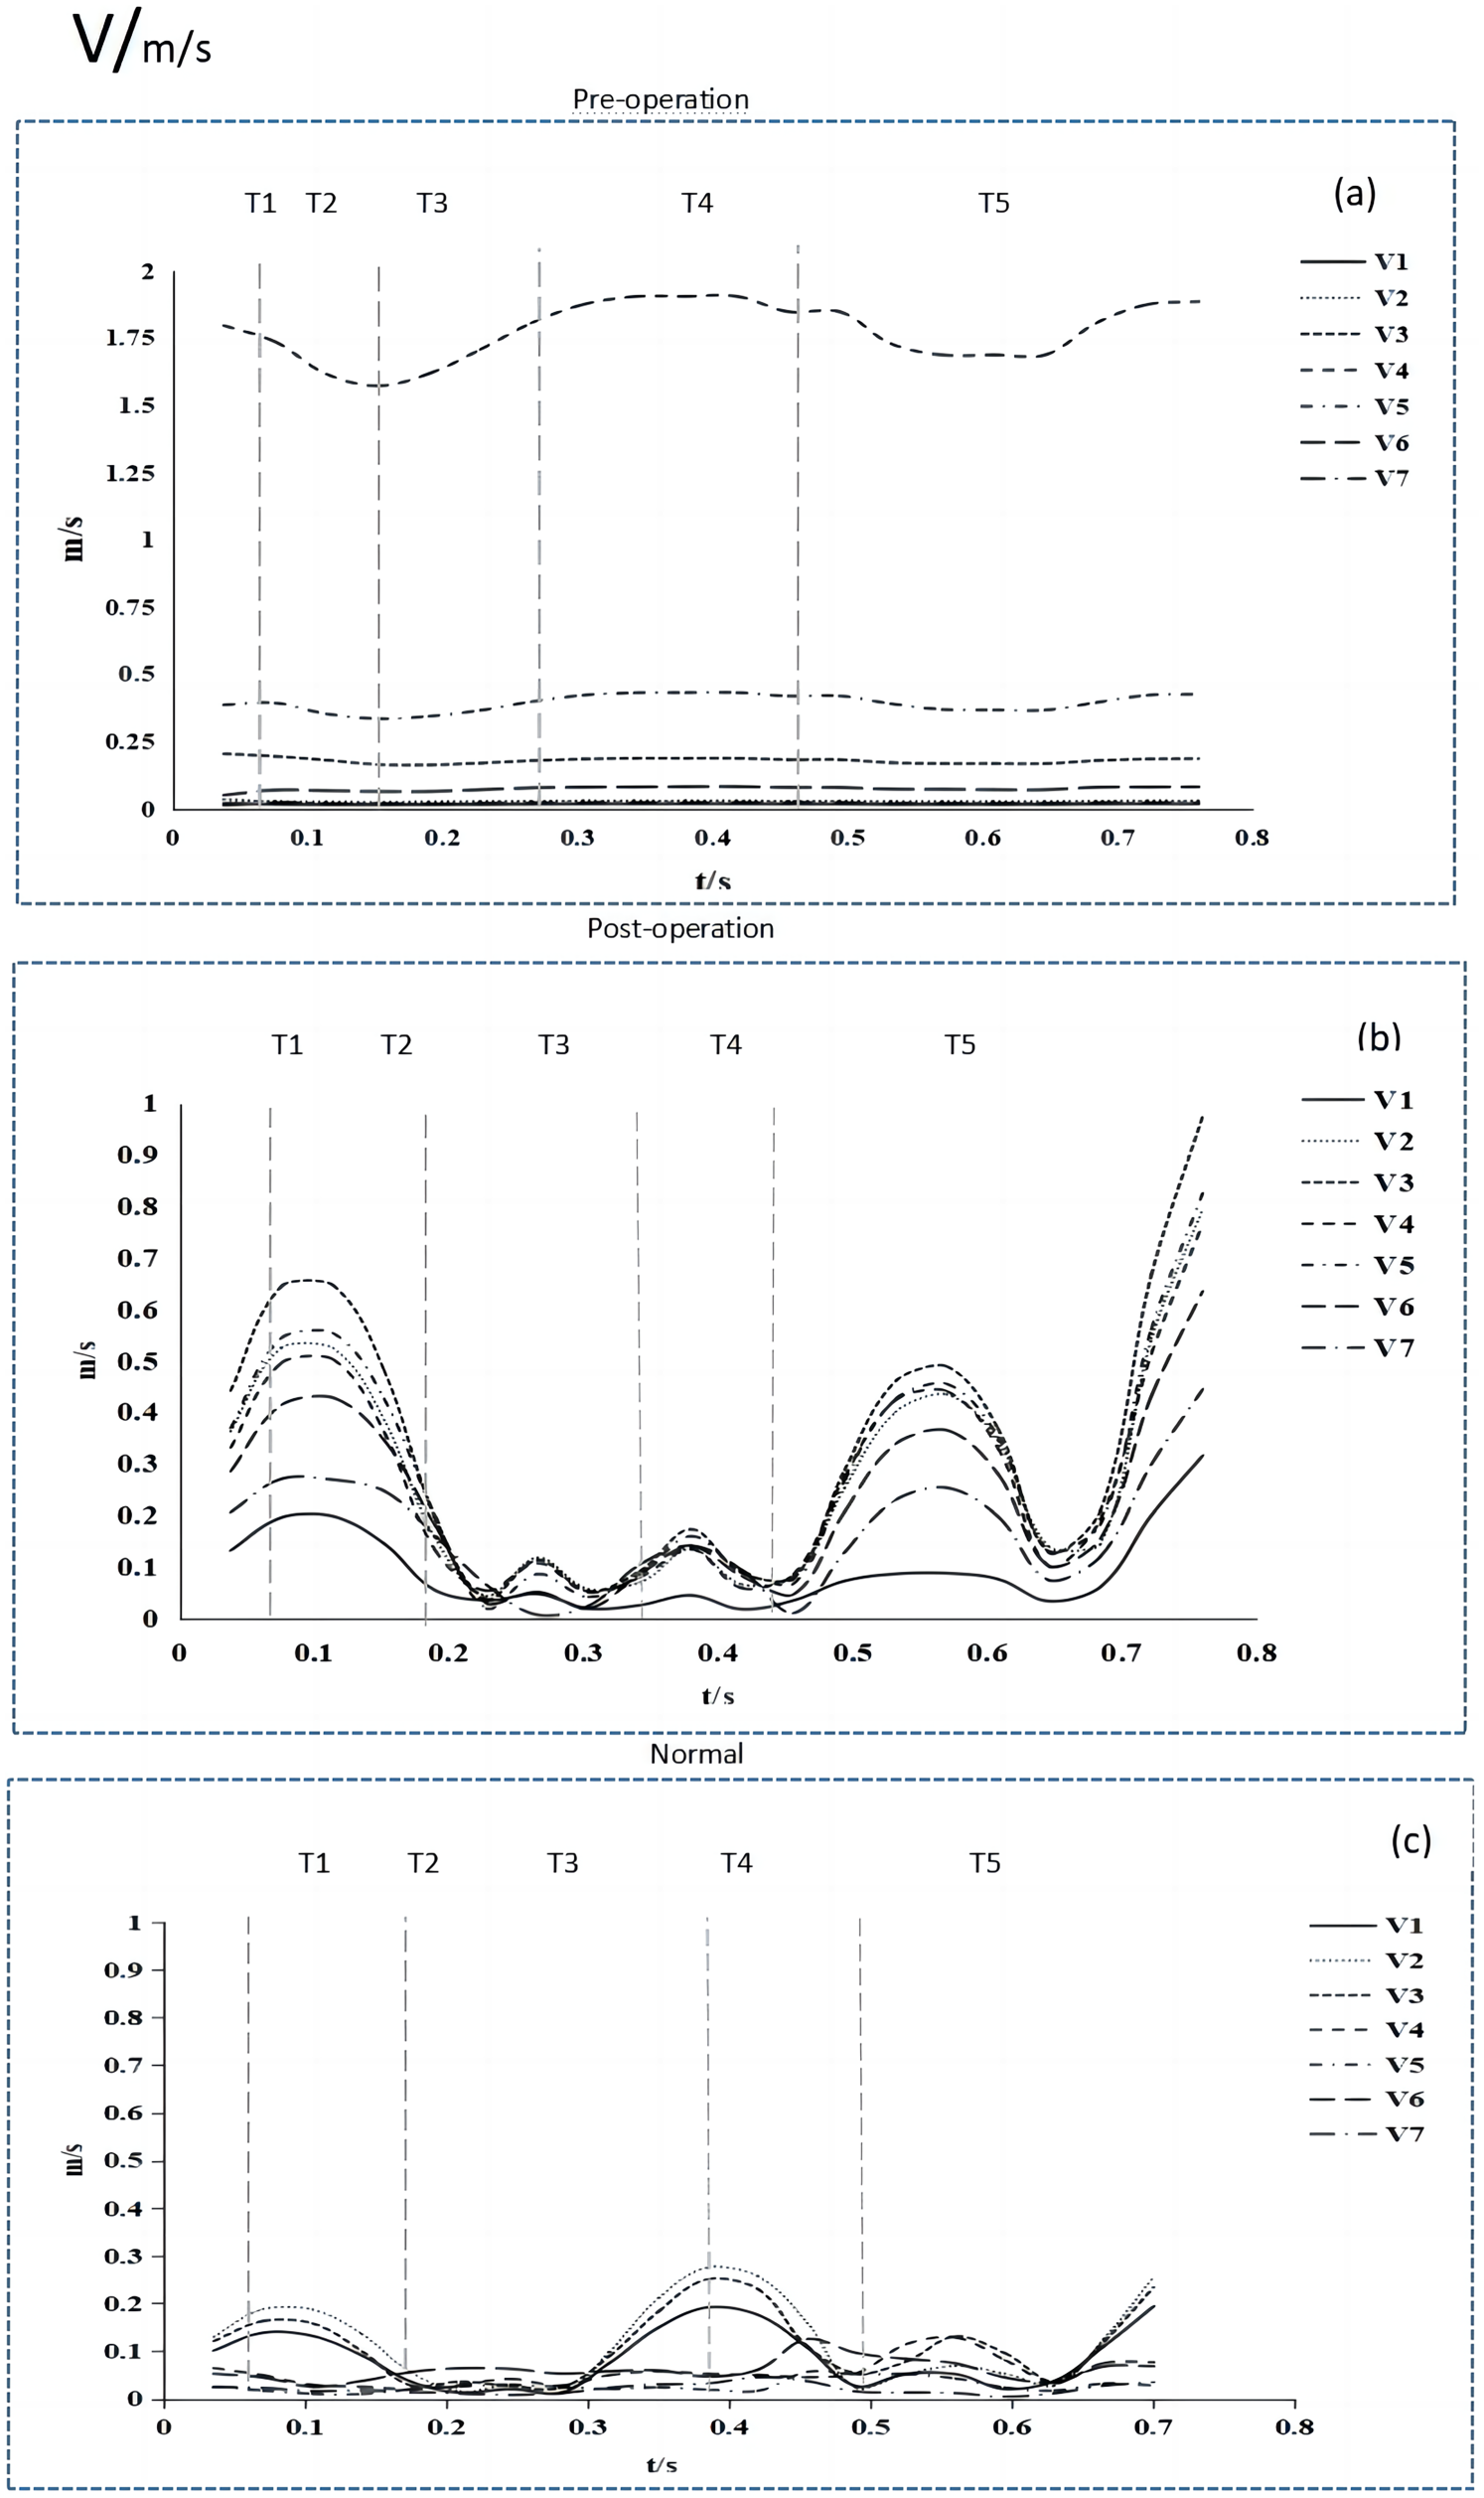
Velocity tracing at monitoring points during a cardiac cycle: (a) Velocities in pre-operative IVC; (b) Velocities in post-operative IVC; (c) Velocities in normal IVC.
Velocity streamlines revealed asymmetric preoperative flow, dominated by eccentric jets and localized high-velocity zones (Figure 3(a)). Post-stent implantation improved symmetry, though residual central acceleration persisted (Figure 3(b)). In contrast, normal IVC flow exhibited a double-loop distribution, with higher velocities near the vessel wall (Figure 3(c)).
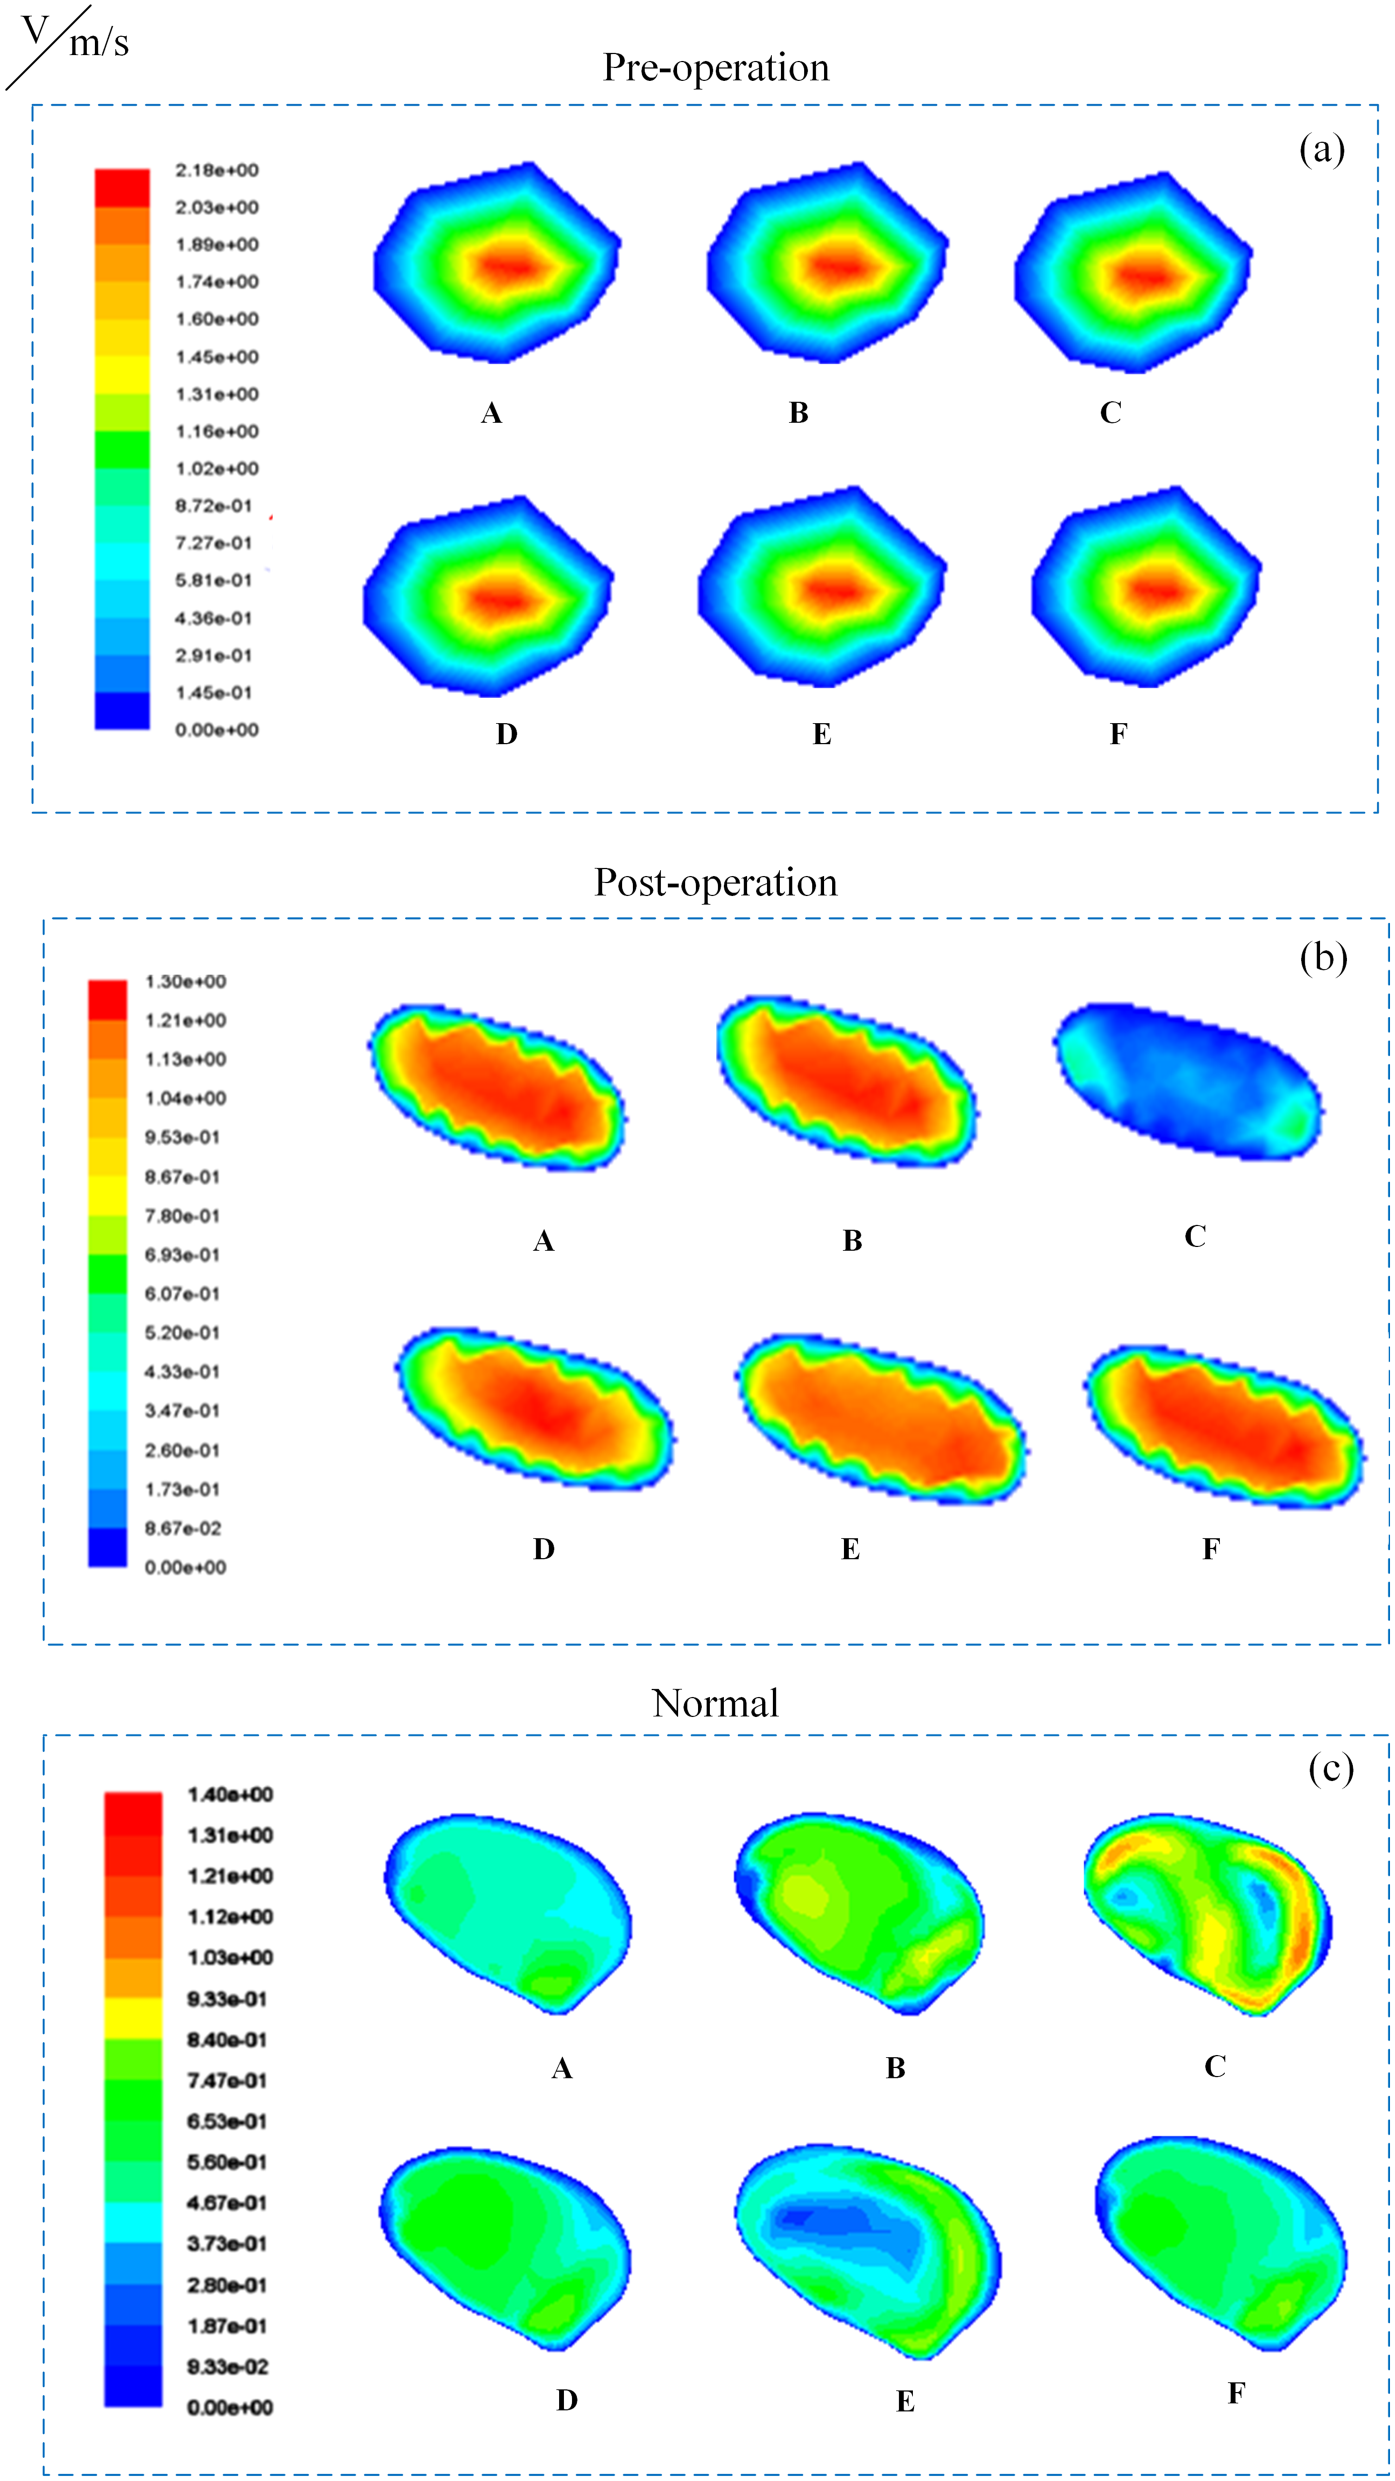
Velocity distribution of cross-sectional IVC in peak systolic phase: (a) velocity change in pre-operative IVC; (b) velocity change in post-operative IVC; (c) velocity change in normal IVC.
Pressure dynamics
Preoperative stenosis generated a trans-stenotic pressure gradient of 3562 Pa, with negative pressures (−562 Pa) distal to the stenosis (Figures 4(a) and 5(a)). Post-intervention restored physiologic pressure distribution (Δ1404 Pa), eliminating negative pressures (Figures 4(b) and 5(b)). The normal person exhibited periodic fluctuations (Δ1225 Pa), peaking during rapid ejection and mid-diastole (Figures 4(c) and 5(c)). Notably, postoperative pressures (2491 Pa) remained elevated compared to controls (1738 Pa), indicating incomplete hemodynamic normalization.
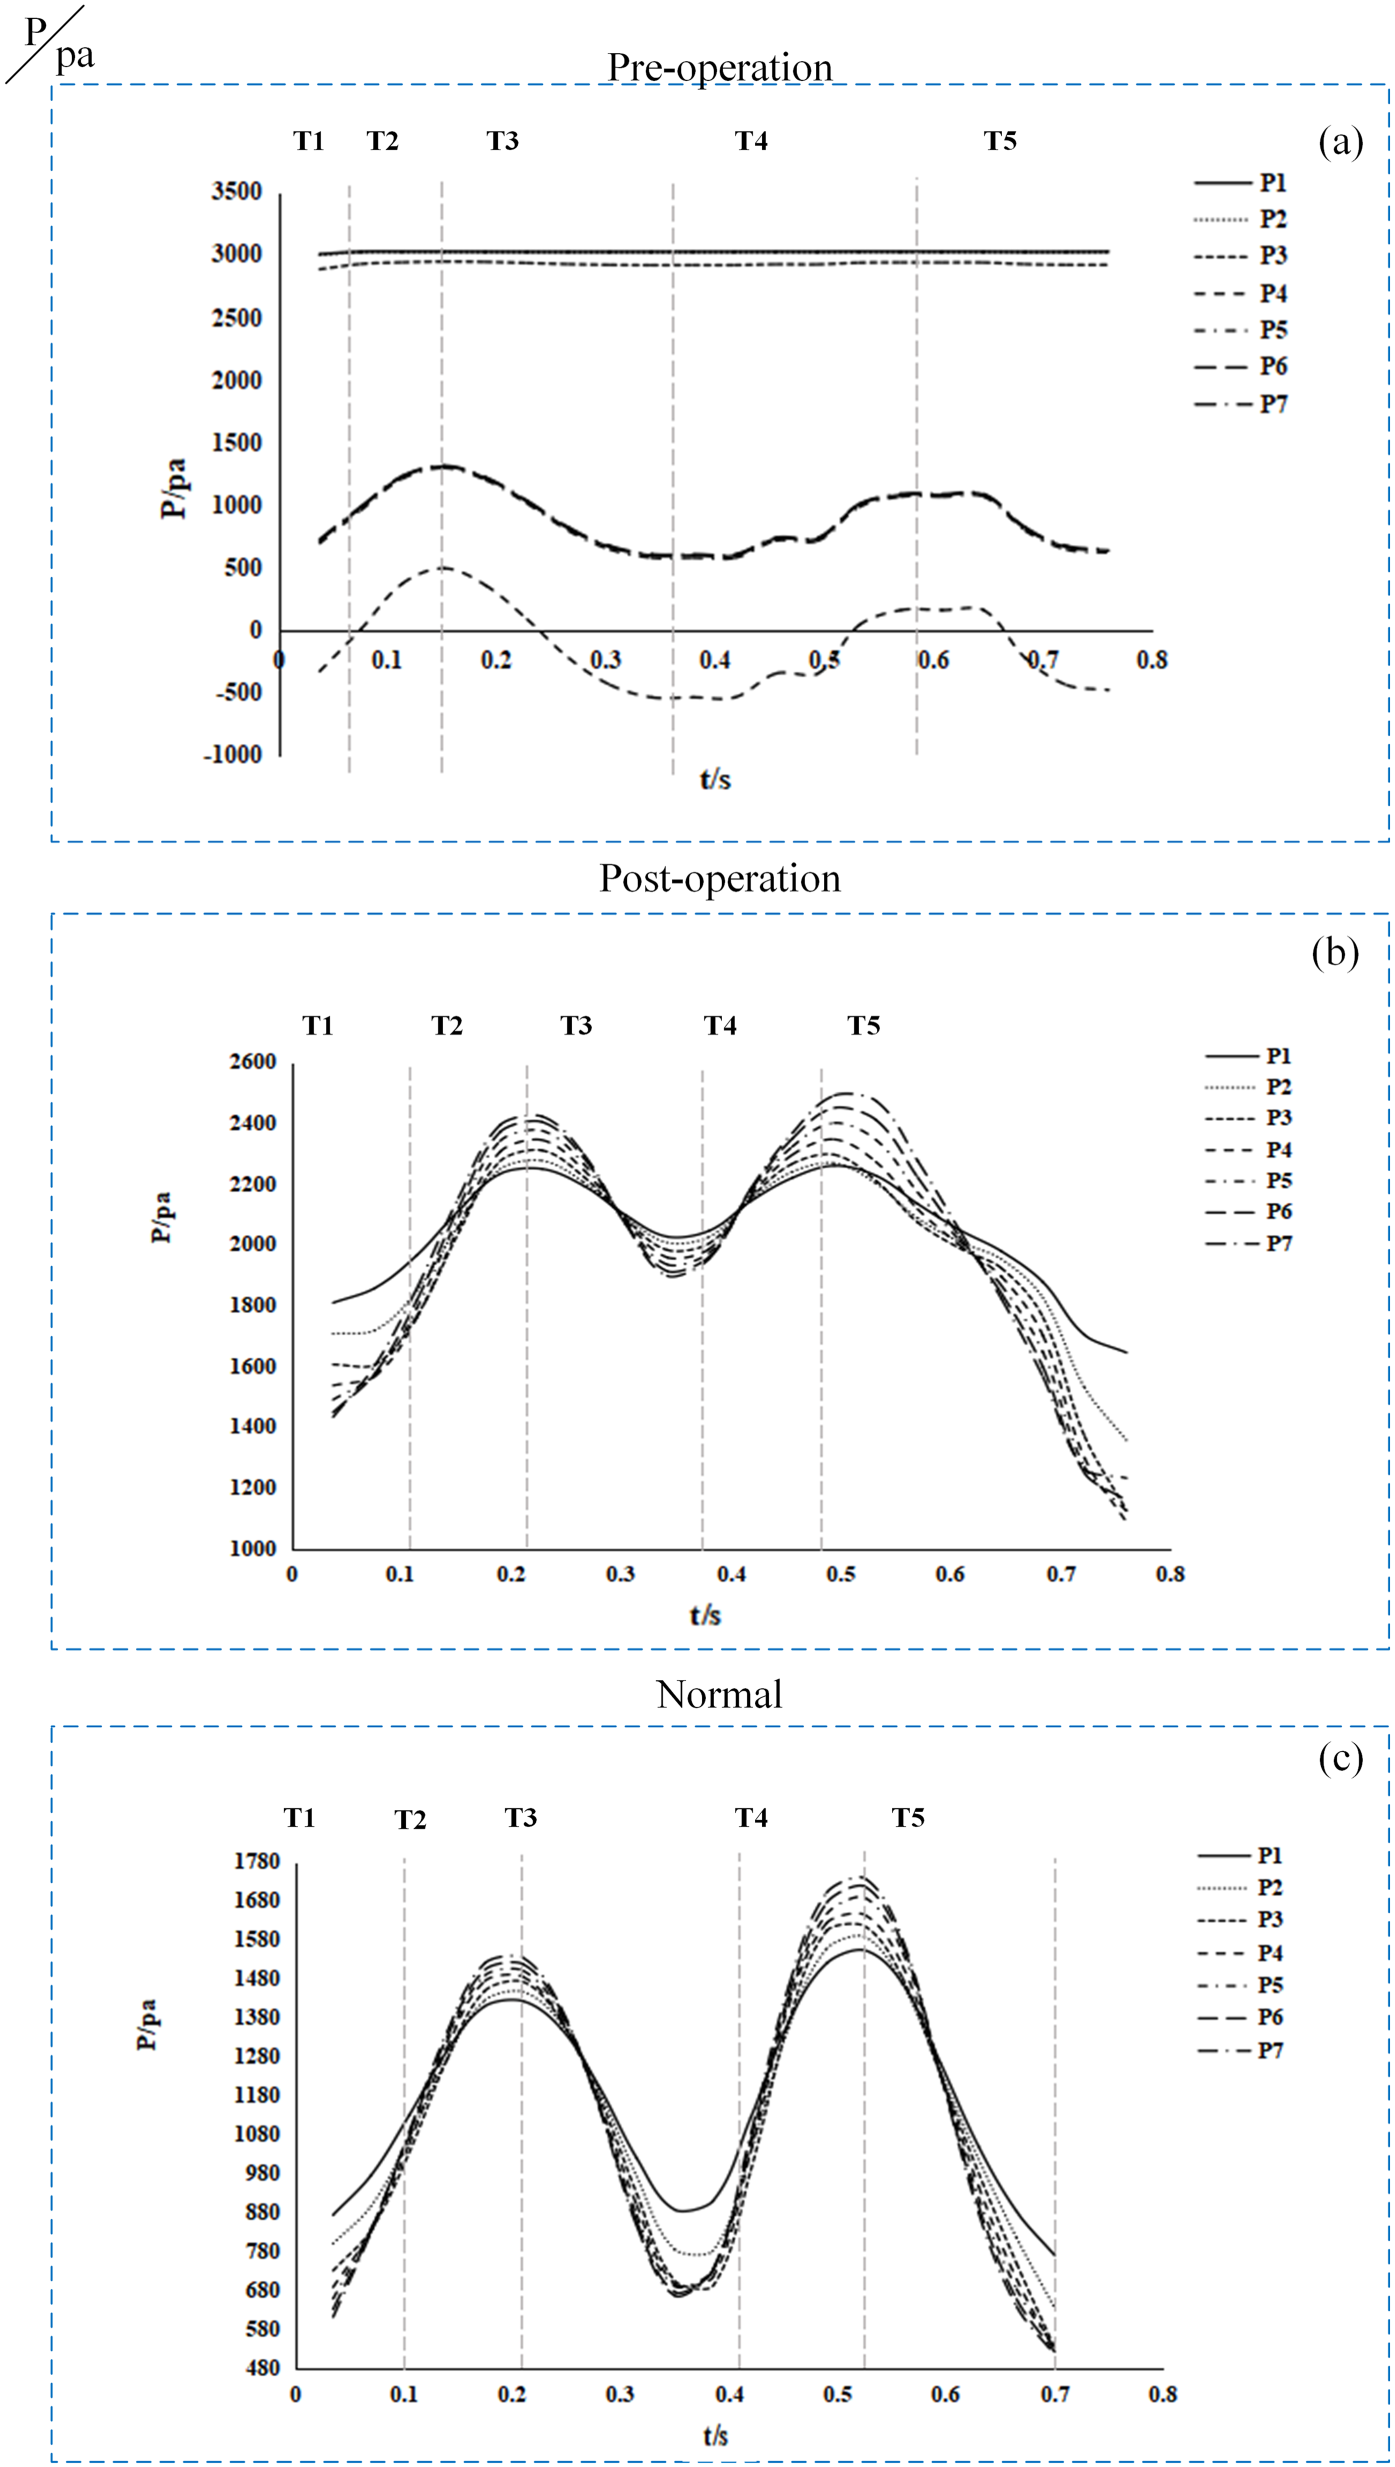
Pressure tracing at monitoring points during a cardiac cycle: (a) pressure in pre-operative IVC; (b) pressure in post-operative IVC; (c) pressure in normal IVC.
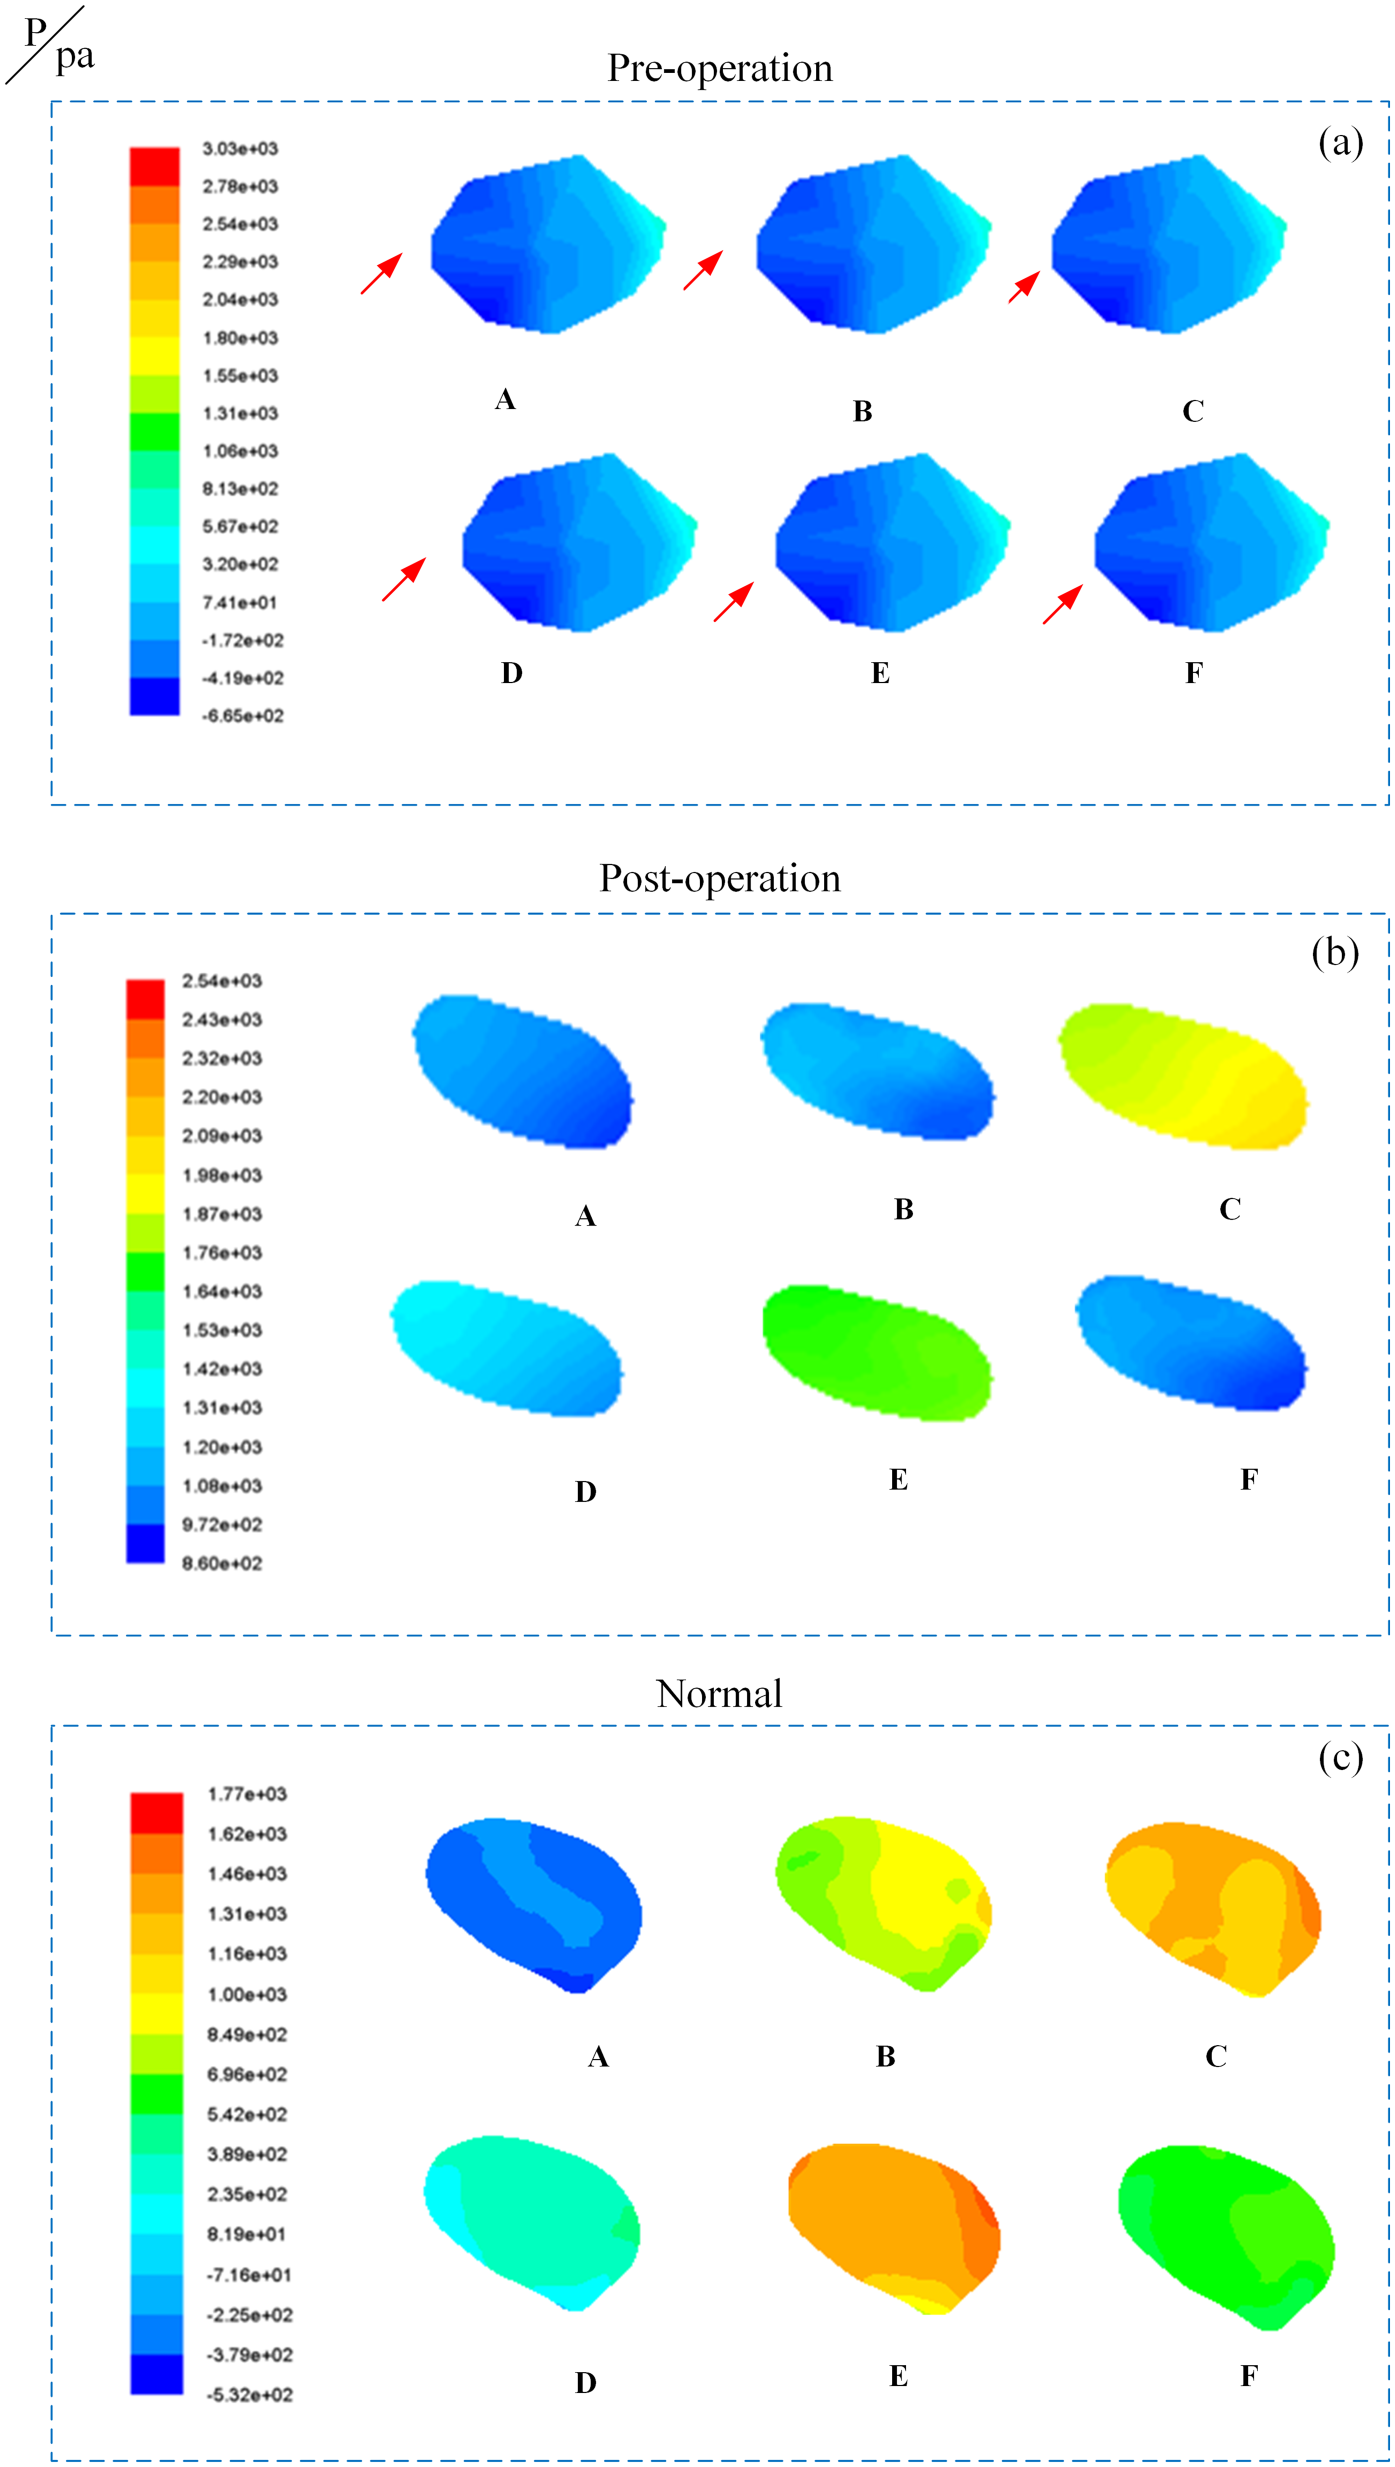
Pressure distribution of cross-sectional IVC in peak systolic phase: (a) pressure change in pre-operative IVC (the arrows indicate the appearance of negative pressure; (b) pressure change in post-operative IVC; (c) pressure change in normal IVC.
WSS analysis
Preoperative WSS peaked at 60.45 Pa in the stenotic segment (point 4), exceeding postoperative (18.2 Pa) and normal (6.18 Pa) values (Figures 6(a)–(c)). Post-intervention WSS exhibited periodic variations aligned with cardiac phases, while controls maintained stable, low WSS. Persistent postoperative WSS gradients at the stent site (Figure 7) suggest residual hemodynamic stress, potentially contributing to endothelial dysfunction.
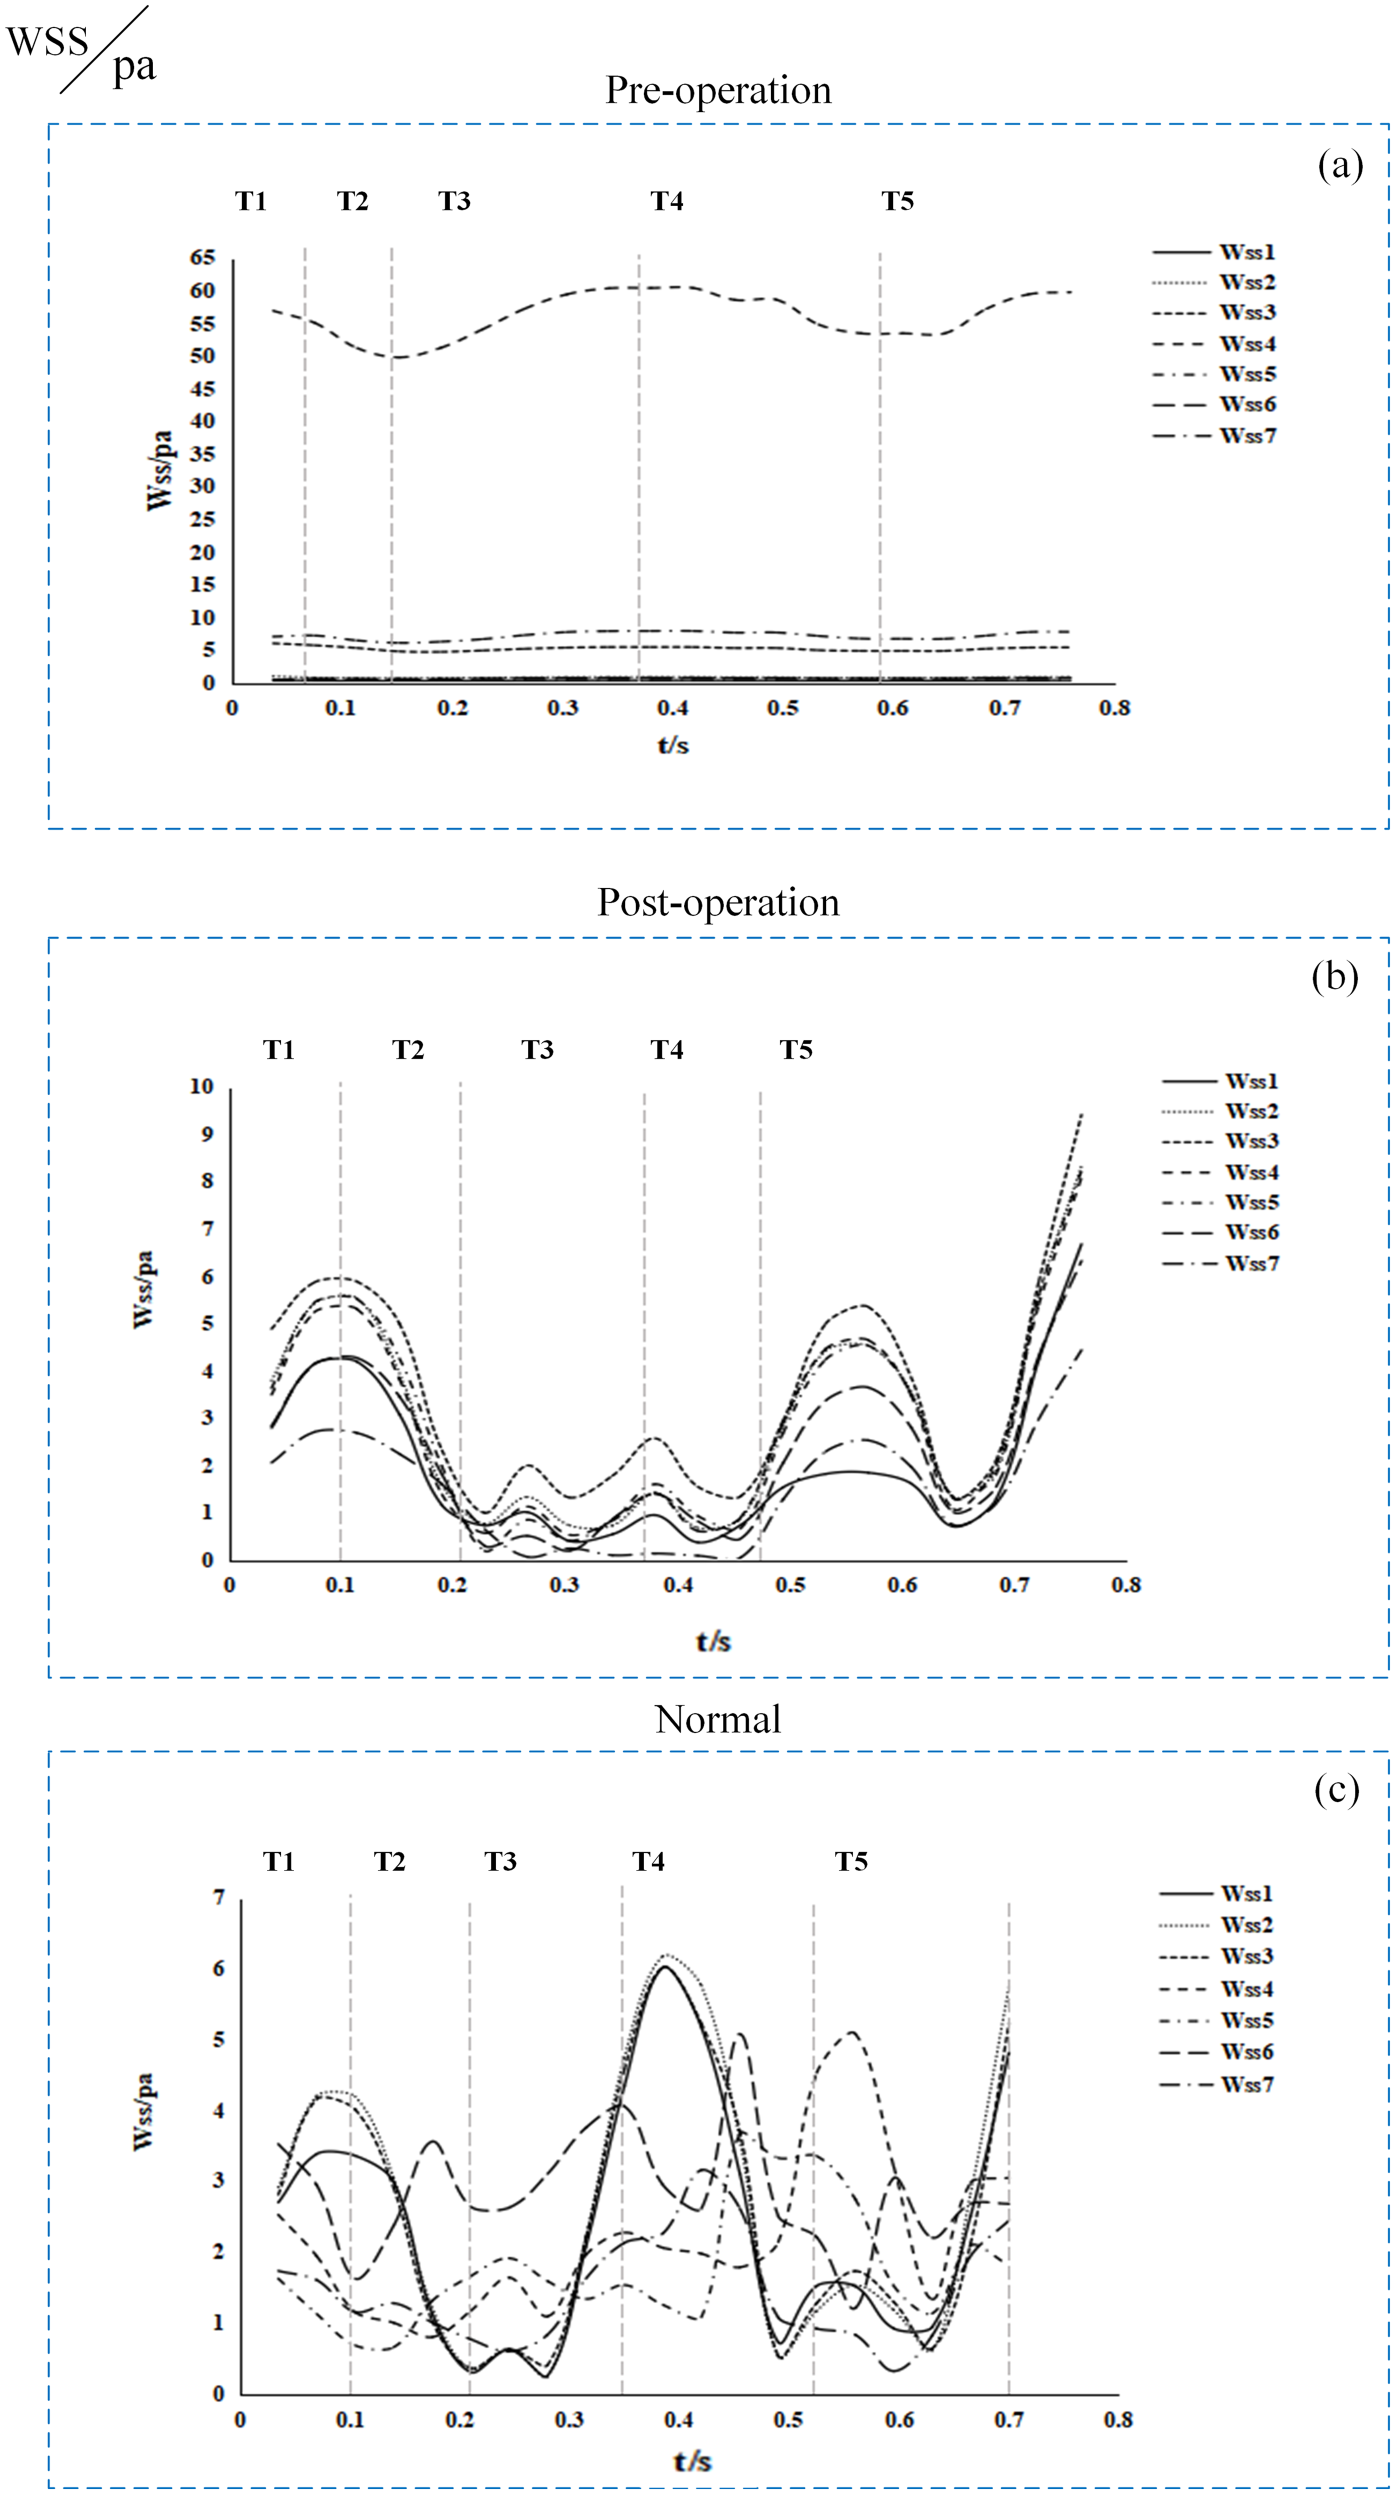
WSS tracing at monitoring points during a cardiac cycle: (a) WSS in pre-operative IVC; (b) WSS in post-operative IVC; (c) WSS in normal IVC.
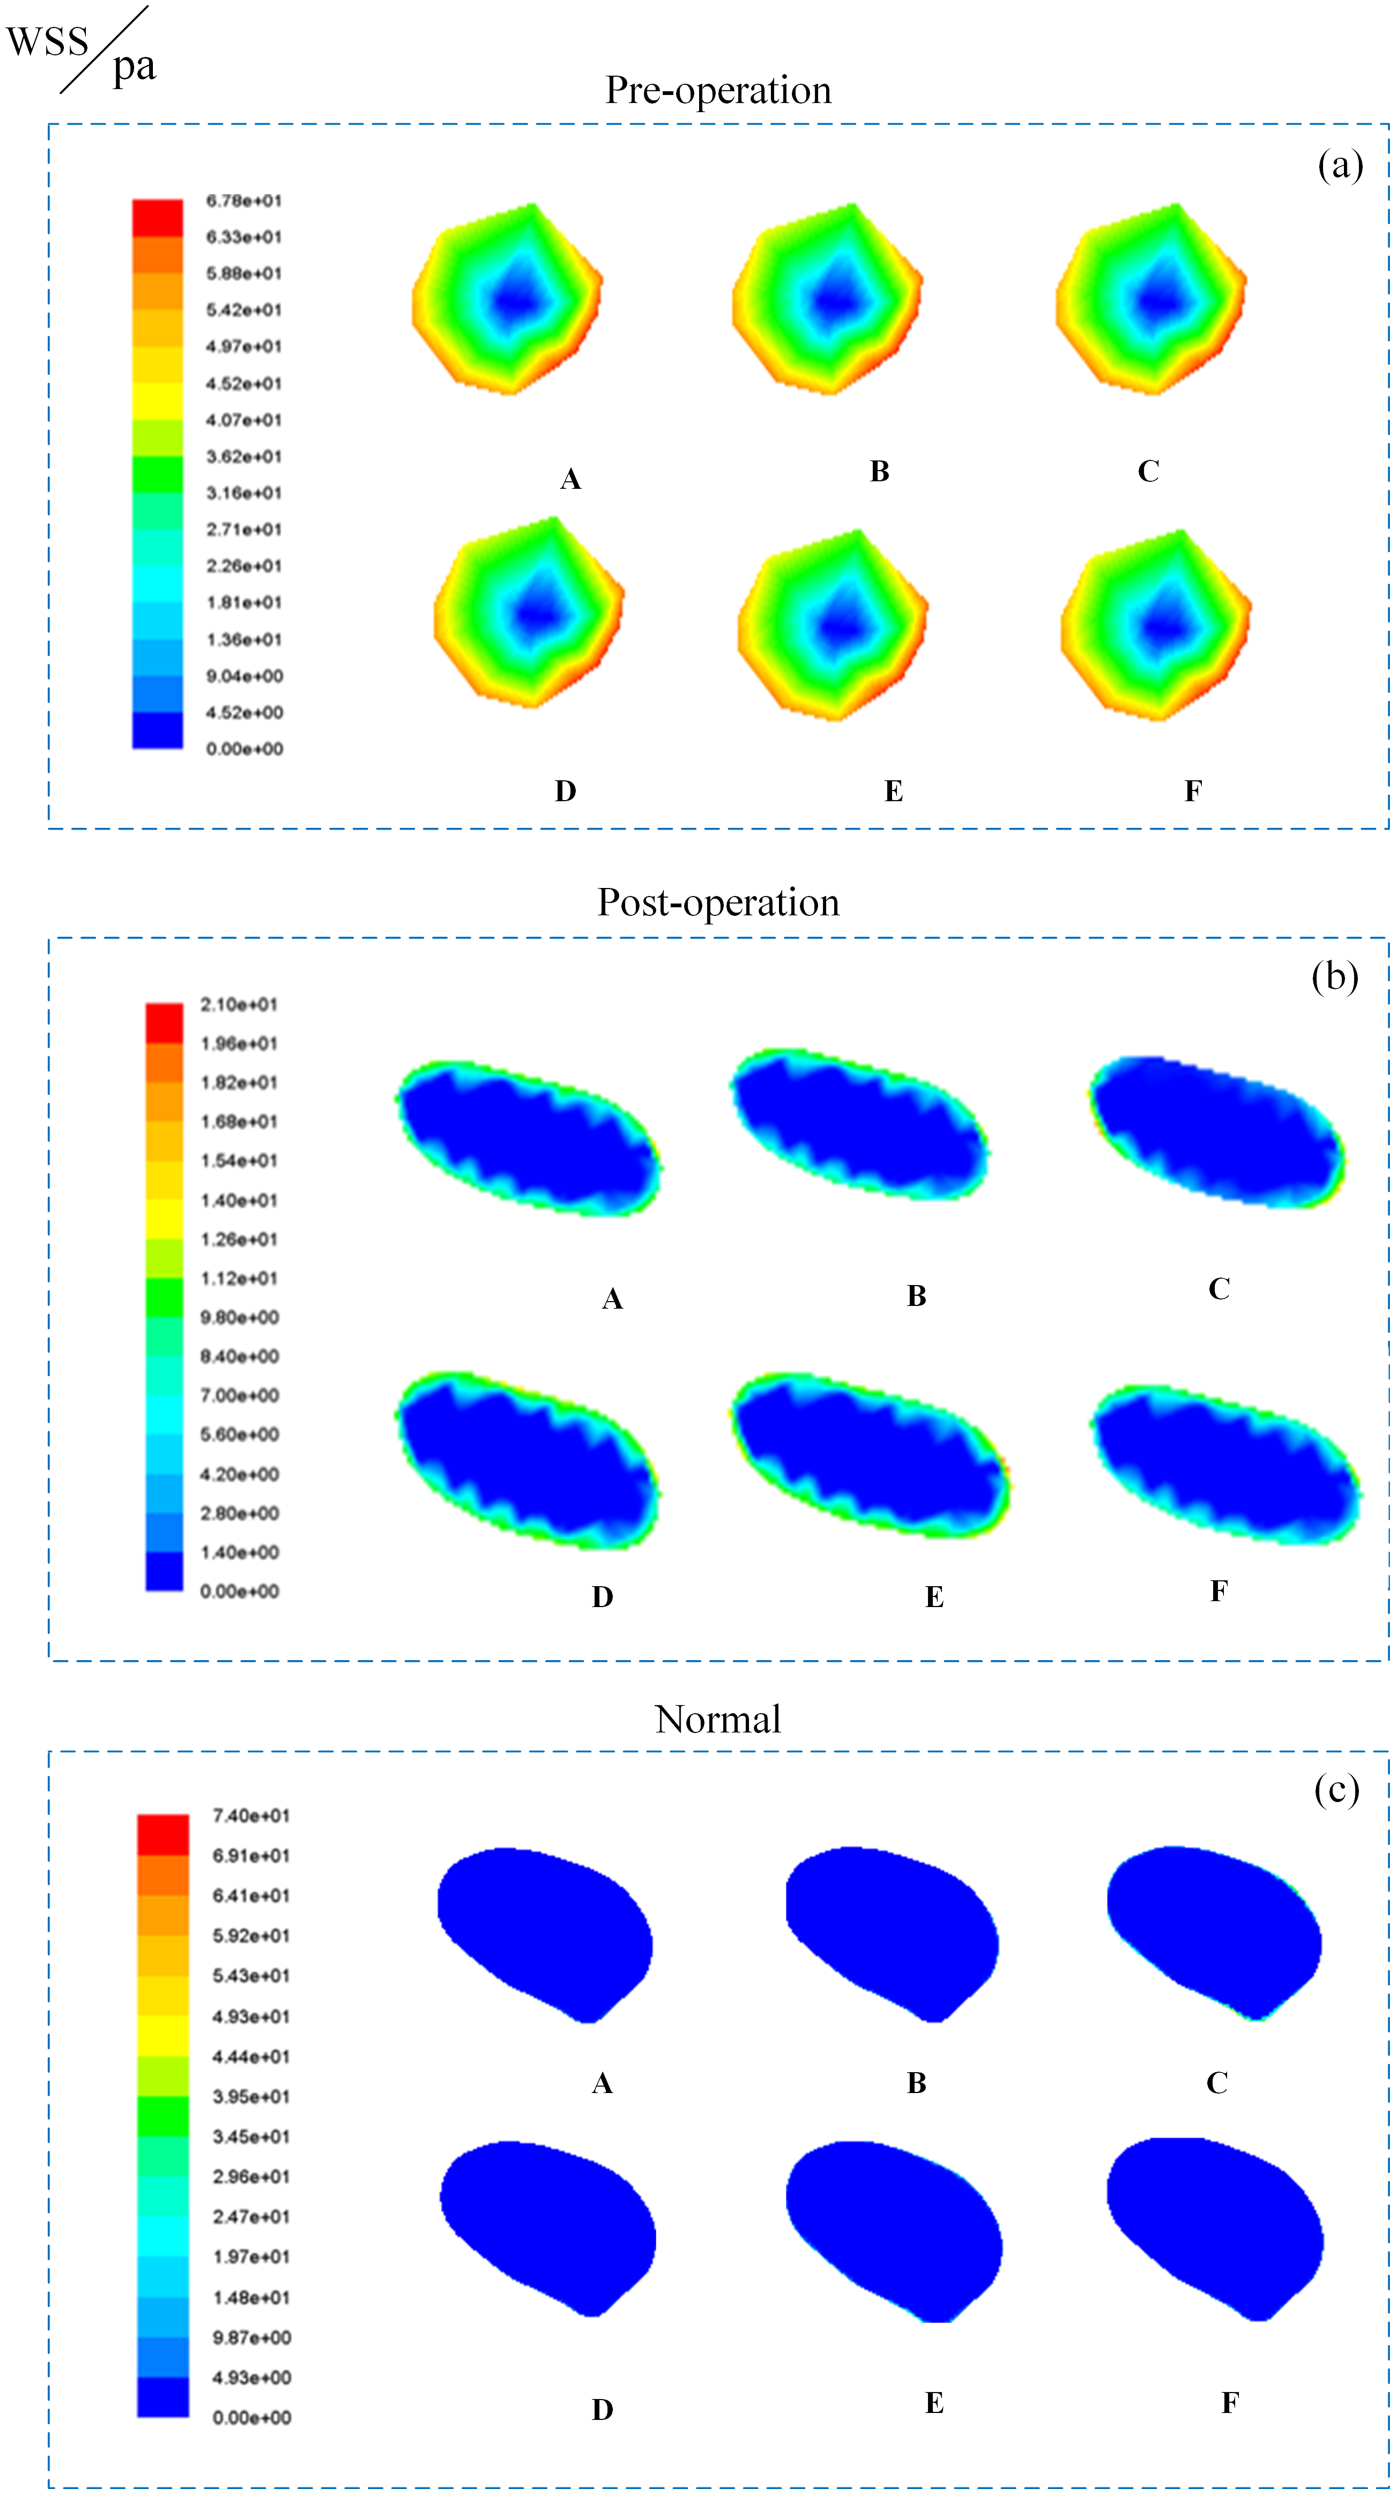
WSS distribution of cross-sectional IVC in peak systolic phase: (a) WSS change in pre-operative IVC; (b) WSS change in post-operative IVC; (c) WSS change in normal IVC.
Vortex flow and clinical implications
Preoperative stenosis induced flow separation and recirculation distal to the stenosis, forming persistent vortices (Figure 8(a)). Post-stent implantation intensified vortices near stent edges due to altered vessel curvature (Figure 8(b)), increasing flow resistance and localized stagnation. Normal IVC displayed transient vortices during systole, resolving rapidly in diastole (Figure 8(c)). Postoperative vortex persistence correlated with elevated negative pressure and flow reversal, factors implicated in stent collapse and restenosis risk.
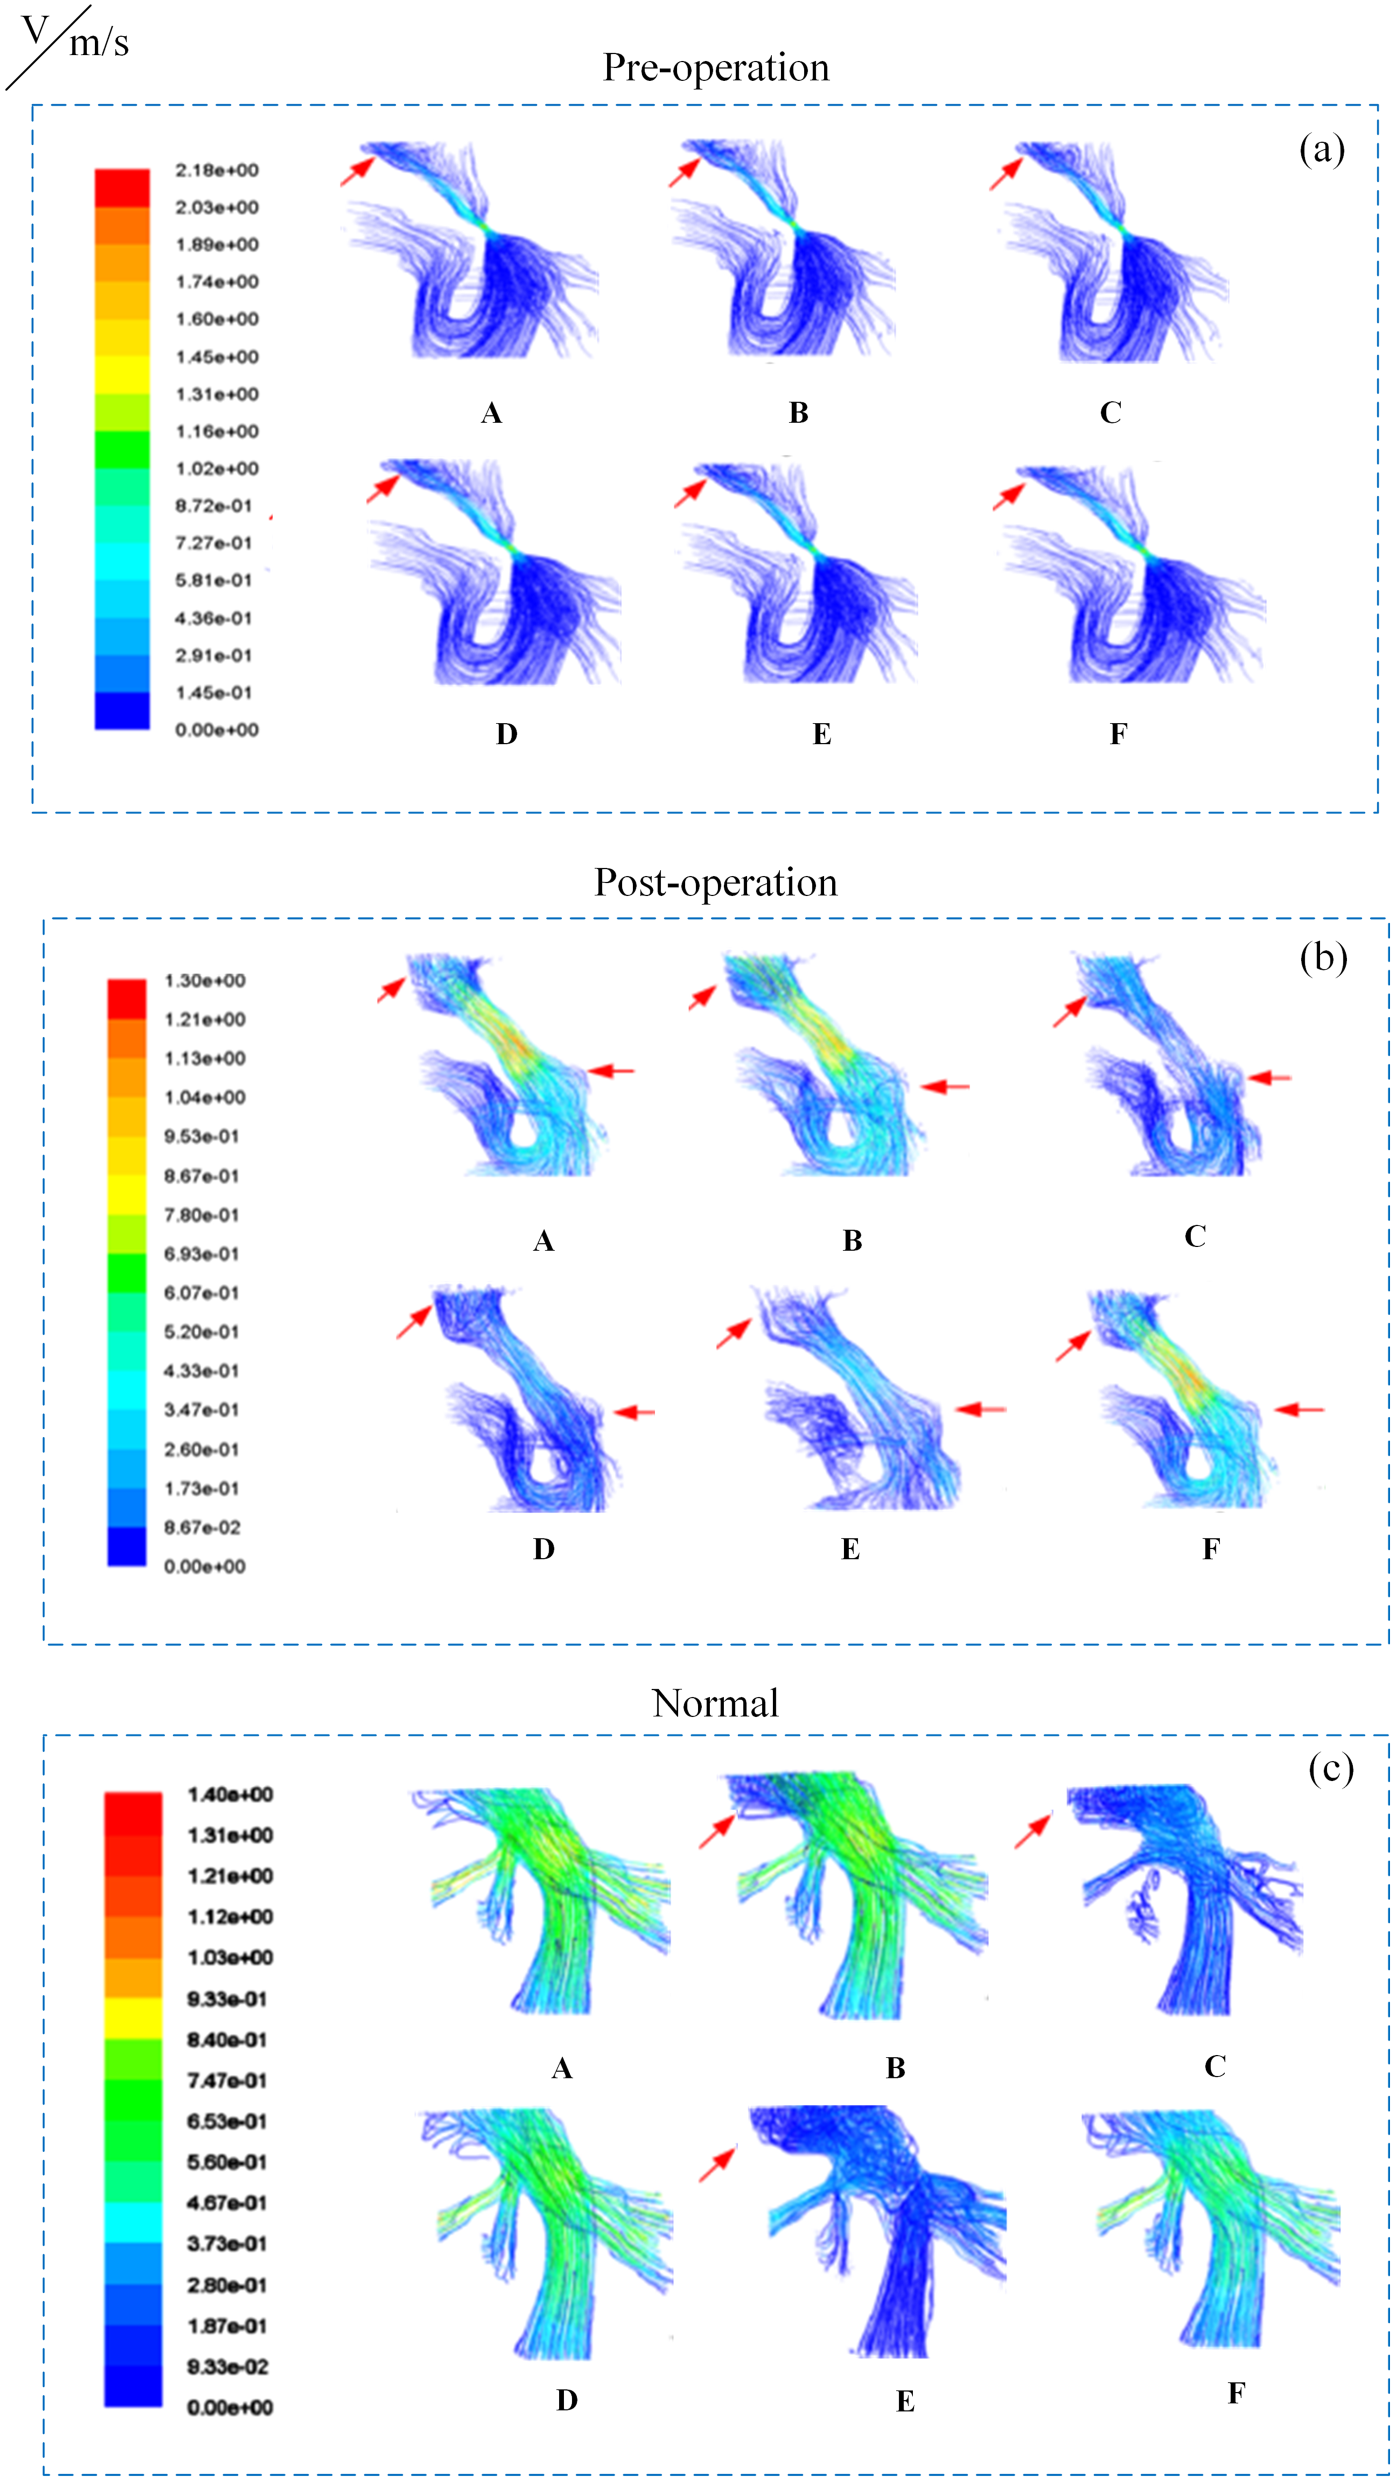
Flow pattern distribution with streamline in a cardiac cycle: (a) flow pattern in pre-operative IVC; (b) flow pattern in post-operative IVC; (c) flow pattern in normal IVC (the arrows indicate the appearance of vortex).
Discussion
The primary objective of this study was to develop 3D reconstructed models of IVC using images from preoperative, postoperative, and healthy individuals, and the detailed 4D hemodynamic data of the patients were obtained via CFD simulation. Whereas prior CFD studies of venous obstruction relied on static pressure assumptions28–30,37 or healthy population-derived boundary conditions, 35 we integrated real-time intraoperative pressure waveforms synchronized with the cardiac cycle (via Seldinger technique monitoring) to establish dynamic boundary conditions. This captures transient pressure-velocity phase differences observed in IVC that are missed in steady-flow models. In addition, unlike previous works focusing on isolated stenosis segments, 39 our full-length IVC reconstruction from patient-specific MRI (Figure 1) enabled identification of secondary flow disturbances at stent edges that correlate with clinical restenosis patterns. 40 The dynamic changes in various hemodynamic parameters remained similar to the preoperative state and differed slightly from those observed in normal individuals. Furthermore, a more complex vortex flow was observed compared to the preoperative condition. Based on these findings, it can be inferred that intervention treatment only provides symptomatic relief for patients and fails to address the underlying organic damage caused by the lesion. This observation may have implications for the long-term prognosis and recurrence of the patients.
As illustrated in Figures 2(a), 4(a), 6(a), and 8(a), preoperative patients exhibited marked elevations in flow velocity, pressure difference, and wall shear stress (WSS) at the stenosis site compared to other vascular regions. The maximum preoperative flow velocity (1.91 m/s) at the stenotic segment significantly exceeded the normal value (0.27 m/s), directly contributing to distal venous hypertension. The kinetic energy loss caused by high-velocity flow, as quantified by the pressure gradient (3562 Pa), aligns with the fluid energy dissipation principle described by the Darcy-Weisbach equation. 41 This mechanism elucidates the pathogenesis of lower limb edema (incidence: 87%) and ascites (incidence: 76%), consistent with the venous hypertensive syndrome characteristics reported by Valla et al..41,42 Notably, the maximum WSS at the proximal stenosis reached 60.45 Pa (10-fold higher than normal levels), with an average flow velocity of 1.75 m/s in the stenosis segment - findings that correlate with the 95% stenosis degree in our cohort. These hemodynamic alterations are consistent with the characteristic manifestations of inferior vena cava hypertension syndrome, including lower limb edema and hepatosplenomegaly.41,42 The pathological significance of these observations becomes apparent when contextualized with the established sequence of vascular stenosis in B-CS: ‘endothelial injury → inflammatory reaction → endothelial repair hyperplasia → thrombus formation → septum formation’.32,43 Mechanistically, WSS - defined as the frictional stress opposing blood flow along the vessel axis36,43 - plays a pivotal role in this progression. Our recorded preoperative WSS levels (averaging 24.32 Pa) far exceed the 10 Pa threshold known to induce endothelial basement membrane exposure and vascular occlusion.38,44 This sustained mechanical insult likely initiates the observed pathological cascade. Comparative analysis with iliac vein stenosis data reveals key hemodynamic distinctions: While Jiang Xundong et al. reported 4142 Pa distal pressure and 0.665 m/s velocity in 90% iliac stenosis, 39 our IVC measurements showed lower distal pressure (3000 Pa) but higher flow velocity (1.75 m/s). This discrepancy may be attributed to the IVC's substantially greater blood flow volume combined with our cohort's higher stenosis severity (95%), suggesting site-specific hemodynamic responses to obstruction. Importantly, our time-resolved WSS mapping (Figures 6 and 7) provides novel insights beyond conventional time-averaged metrics.34,44 The detection of cyclic stress spikes during mid-diastole - a finding aligning with arterial CFD standards16,35,45 but previously unreported in venous studies - offers a potential explanation for endothelial repair failure. These transient high-stress phases likely compound the cumulative endothelial damage observed in B-CS progression. Persistent vortices (Figure 8(a)) were associated with flow stagnation (minimum velocity: 0.01 m/s). Vortex-induced flow oscillations promote platelet activation, correlating strongly with elevated D-dimer levels (mean: 4.2) and post-interventional thrombotic risk (19%). 39 This phenomenon corresponds precisely with the vortex-thrombosis coupling effect observed in iliac vein stenosis models by Jiang et. 39
Interventional therapy has become the preferred surgical approach for B-CS, demonstrating efficacy in both anatomical stenosis correction and hemodynamic improvement. As evidenced by our CFD analyses (Figures 2(b), 4(b), 6(b), and 8(b)), this intervention achieves significant reductions in flow velocity (pre-opmax vs post-opmax: 1.91 m/s vs 0.97 m/s), pressure gradient (pre-op 3562 Pa → post-op 1404 Pa), and WSSmax at the lesion site (pre-op 60.45 Pa → post-op 18.2 Pa). These hemodynamic improvements correlate with clinical benefits including thrombosis prevention and symptom alleviation, consistent with previous reports.43,46 Nevertheless, three persistent hemodynamic anomalies warrant critical attention. First, the postoperative WSS (18.2 Pa) maintained 2.94-fold elevation over normal IVC levels (6.18 Pa), accompanied by unaltered cardiac cycle WSS fluctuation amplitude. This “hemodynamically incomplete remission” phenomenon (Garcia-Pagán et al. 41 arises from residual high-velocity gradients, particularly at stent-vessel interfaces where oscillatory shear index (OSI) exceeds 0.3. As Soudah et al. 47 demonstrated, such OSI elevations induce 3.8-fold increased endothelial apoptosis, mechanistically explaining the 19% restenosis rate with median recurrence at 29.27 months indicated in Hemachandran'study. 40 Second, persistent vortex flow at stent edges (duration 0.32 ± 0.05 s vs normal 0.12 ± 0.03 s) creates flow stagnation (minimum velocity: 0.01 m/s) and platelet-activating shear oscillations. This vortex-thrombosis coupling effect (Jiang et al. 39 correlates strongly with elevated D-dimer levels (mean: 4.2 μg/mL) and 19% thrombotic risk, echoing recent clinical findings on late recurrence by Hemachandran et al.. 40 Third, the residual pressure gradient (1404 Pa) remains 1.15-fold above physiological levels (1225 Pa), sustaining pathological pressure gradient magnitudes despite mechanical obstruction relief. These findings align with pan-vascular recurrence mechanisms identified by Neglen et al. 48 in IVC stent studies, suggesting two synergistic injury pathways: 1) Sustained high-shear stress from incomplete gradient resolution, and 2) Low-shear oscillatory forces from stent-induced flow separations. The clinical translation of this biophysical duality manifests as endothelial dysfunction at stent edges, where restenosis incidence significantly increases compared to central regions.
Notably, our data reveal that interventional success depends not merely on anatomic reconstruction but equally on mitigating secondary hemodynamic insults. While the therapy effectively reverses pre-stenotic flow stagnation (Figures 2–8), it incompletely addresses post-stenotic endothelial damage accumulated during chronic obstruction. This pathophysiological continuum underscores the necessity for adjunctive pharmacotherapy targeting shear-responsive pathways, particularly during the critical 24-month postoperative window when 78% of recurrences occur. 39
In conclusion, although interventional therapy establishes itself as the optimal B-CS treatment through favorable risk-benefit profile, our multiparametric hemodynamic analysis reveals residual biomechanical triggers for vascular remodeling. Future device designs should incorporate flow-divergent geometries to minimize shear oscillations, while clinical protocols may benefit from extended anticoagulation regimens guided by CFD-based monitoring.
Limitations
However, several limitations should be acknowledged in this study. Firstly, while our use of idealized wall conditions and the assumption of a rigid wall simplified the model, it may not fully capture the variability in the wall of the IVC among different individuals. Incorporating deformable walls could potentially result in more accurate and precise hemodynamic parameters. Nevertheless, the integration of such advanced modeling would be more complex and time-consuming, requiring a careful balance between computational feasibility and efficiency. Secondly, the relatively small sample size in our study limits the generalizability of our findings. Conducting further research with larger sample sizes and more normal models is necessary to validate and support our findings. Finally, while our experimental results offer valuable insights, they were not clinically validated through direct patient follow-up due to practical constraints. Ideally, revisiting post-operative and post-recurrence patients would provide more comprehensive data, but this approach faces institutional and organizational limitations. Therefore, for this study, we relied on data from research literature for comparison and validation. Looking ahead, in future studies, given sufficient clinical data, we intend to conduct additional clinical validation and in vitro validation to ensure the accuracy and reliability of the models.
Conclusion
This study developed a patient-specific, time-resolved hemodynamic framework for BCS by integrating dynamic MRI with CFD simulations driven by intraoperative pressure data. Our quantitative analyses revealed that although intervention primarily addresses anatomical obstruction, it leaves critical hemodynamic disturbances unresolved. Key residual abnormalities included: (i) persistently elevated pressure gradients and localized WSS, particularly at stent edges, which significantly exceed normal physiological levels; (ii) altered flow patterns characterized by prolonged vortex duration near stent struts. The residual high WSS and abnormal oscillatory shear likely perpetuate endothelial injury and inflammation, while persistent vortices promote flow stagnation and platelet activation, creating a pro-thrombotic and pro-hyperplastic microenvironment conducive to restenosis. Consequently, quantitative hemodynamics such as post-interventional pressure gradients, localized WSS elevations, and vortex characteristics emerge as crucial factors for predicting restenosis risk. This study could provide a predictive assessment reference to improve long-term outcomes beyond the immediate procedural success.
Footnotes
Acknowledgements
The authors thank all the surgeons and patients who participated in this study.
Ethical considerations
This study was approved by the Affiliated Hospital of Xuzhou Medical University Ethics Review Committee and conducted according to the principles of the Declaration of Helsinki.
Consent to participate
Since this study was a numerical simulation study of the information of previous cases, without direct contact with the subjects and subject privacy protection, the risk borne by the subjects was not greater than the minimum risk. The Affiliated Hospital of Xuzhou Medical University Ethics Review Committee agreed to exempt informed consent after review.
Funding
The authors disclosed receipt of the following financial support for the research, authorship, and/or publication of this article: The study was supported by the Fundamental Research Funds for Science and Technology in Xuzhou (No. KC20191); Fund Project for Science and Technology Development in Xuzhou Medical University Affiliated Hospital (No. XYFM2020048); Jiangsu Training Program of Innovation and Entrepreneurship for Undergraduates (No. 202210313061Y).
Declaration of conflicting interests
The authors declared no potential conflicts of interest with respect to the research, authorship, and/or publication of this article.