
Abstract
Background
Cardiovascular disease, especially heart failure, is a substantial global health issue. By integrating PHR with machine learning, early disease detection could be made possible.
Objective
In this study, an attempt was made to develop and fine-tune an AI model that would forecast the likelihood of heart failure based on patient data in PHRs.
Methods
Data from 1025 patients and 12 clinical/demographic criteria were used. An untuned multilayer perceptron (MLP) with two hidden layers (10 and 5 neurons) was first trained (1000 epochs). Then, using the same dataset, we performed systematic hyperparameter tuning (grid search with 5–fold cross–validation) for Logistic Regression, Random Forest, SVM, and an enhanced MLP. Performance metrics included accuracy, precision, recall, F1–score, MCC, and ROC–AUC with 95% confidence intervals.
Results
The original untuned MLP gave a mean accuracy of 0.7244 (±0.0245) and mean ROC–AUC of 0.724 (±0.038). After tuning, Random Forest achieved the highest performance (AUC = 0.959, 95% CI 0.924–0.986; accuracy = 0.890). The tuned MLP reached AUC = 0.830 (CI 0.763–0.893), outperforming the untuned version and showing comparable performance to Logistic Regression (AUC = 0.824) and SVM (AUC = 0.842).
Conclusion
These results suggest potential use of AI models to anticipate the risk of heart failure from a subject's medical history and provide an avenue toward scalable and personal medicine, resulting in improved early prevention and treatment of cardiovascular disease.
Keywords
Introduction
The cardiovascular system plays a vital function in the proper operation of important organs such as the brain, kidneys, and liver. 1 CVD constitute a vast category of heart diseases and a major source of morbidity and mortality globally. 2 CVD was ranked in 2007 as the leading killer in nations such as the United States, the United Kingdom, Canada, and Wales, representing an enormous and ongoing public health burden. 3 By 2030, CVD is estimated to be responsible for about 23.6 million deaths worldwide due to the pressing necessity for novel prevention and treatment methods. 4 In Europe, CVD accounted for approximately 49% of fatalities in 2016, while in the United Kingdom, CVD hospitalization occurred approximately 1.7 million times in 2017, costing in excess of £9 billion and causing 167,000 deaths.5,6 In Iran, CVD is already identified as the leading cause of mortality, with 46.04% of fatalities attributable to it between 2006 and 2010. 7
These dramatic figures highlight the urgent requirement for effective preventative interventions, screening, and full-blown management protocols for CVDs. Evidence currently estimates that around 50% of cardiovascular presentations may be explained by modifiable risk factors such as hypertension, diabetes, physical inactivity, and diet. 5 Thus, an understanding and intervention in these areas represent a crucial component in limiting the burden of cardiovascular disease across the globe. 8
Health Information Systems (HIS) are key in enhancing healthcare delivery, facilitating effective planning, management, and collection of data. 9 Personal Health Records (PHR) have also been found to be a revolutionary tool through which patient-centered access to personal health information is facilitated. Research has established that PHRs can revolutionize health indicators, with evidence showing an overwhelming level of patients perceiving them as necessary for efficient management of healthcare and likewise indicating demand for standard formats. 10 Strategic integration of PHRs holds vast potential for speeding up cardiovascular disease prevention and early intervention in all healthcare settings.
Artificial Intelligence (AI), in the guise of Artificial Neural Networks (ANNs), has also demonstrated revolutionary potential in predictive medicine. ANNs can process complex data sets and uncover patterns that elude conventional statistical models. 11 ANNs have been employed to predict and diagnose a number of cardiac diseases, including coronary heart disease and arrhythmias. Particularly, the capability of ANN to learn and process complex physiological information can detect such severe conditions in the initial phase, for example, arrhythmias, allowing early and beneficial clinical interventions. 12 All this is a huge leap for developing computer-assisted automated systems that assist in diagnosing diseases like CHD, a matter of huge concern across global health forums. 13
Different research studies have proven the validity of AI approaches to heart disease risk stratification and preventive strategy development. For instance, use of neural networks has shown incredible accuracy with some models having reportedly achieved almost a hundred percent prediction accuracy in outcomes of heart disease based on clinical variables. 1 Multilayer neural networks and genetic algorithms have made it possible for high-performance predictive models to achieve unparalleled capability for risk prediction, 14 witnessing the growing maturity of computational methodology in cardiovascular medicine. 15 Throughout more recent decades, back-propagation multilayer perceptron-design neural networks have been shown to be extremely accurate at classifying heart disease risk, and have considerable potential for use in the clinical setting.16,17
Despite the extensive amount of research work, there is a specific lacuna within the literature of studies designed for specific geographical regions, i.e., Iran, in which unique environmental, lifestyle, and cultural conditions contribute significantly towards determining health outcomes. The majority of the current studies are mostly reliant on clinical and paraclinical data, with limited emphasis on including individual patient data in prediction models. This observation offers the potential for specialized research to make up the deficiency in today's knowledge on the use of AI in peculiar geographic environments. 13
This study proposes a new direction by developing an intelligent neural network-based model specific to measure the risk of heart complications in a specialized PHR system for cardiovascular disease. Unlike earlier studies that were focused primarily on plain predictive accuracy, this study emphasizes the incorporation of clinical information of patients in Ahvaz, Iran. Using a very advanced AI-powered app for data collection, it attempts to facilitate early and accurate diagnosis across different types of clinical setups. In addition, this paper is a seminal contribution in Khuzestan province, for the first time integrating local Iranian patient data within a predictive modeling exercise. Such a method not only lends contextual validity to the findings but also to the global discourse on tailored healthcare solutions, yielding insights that can inform the design of culturally responsive health programs in various global territories.
This study addresses the following main research questions: How can an optimized multilayer perceptron neural network be developed to predict heart failure risk using selected clinical and demographic parameters from PHRs? What is the predictive performance (accuracy, precision, recall, specificity) of this model when applied to PHR data from patients in Ahvaz, Khuzestan province, Iran? How can such a model be integrated into a mobile PHR application for real-time risk prediction?
Methodology
Study population
This study was conducted in the format of a non-interventional analytical study in 1025 patients with heart failure symptoms visiting medical clinics in Ahvaz, the capital city of southwestern Iran's Khuzestan Province. Data collection was facilitated using a special mobile app designed specifically for performing this very task. Of the patients enrolled in the study, 499 were classified as healthy, while 526 were diagnosed with heart failure by trained health workers. Although the dataset was nearly balanced (49% healthy, 51% heart failure), we addressed potential imbalance by using stratified splitting and reporting precision-recall metrics. Inclusion criteria were the adult patients (≥18 years) presenting with symptoms suggestive of heart failure (e.g., dyspnea, fatigue, peripheral edema) who provided written informed consent. Moreover, patients with acute coronary syndrome, severe valvular heart disease, congenital heart disease, or a history of heart transplantation. Also excluded were pregnant women and individuals unable to complete the data entry process.
Participants provided written informed consent. All methods were performed in accordance with the relevant guidelines and regulations and the research methodology was approved by the Ethics Committee of Ahvaz Jundishapur University of Medical Sciences, Ahvaz, Iran (IR.AJUMS.REC.1401.586).
Application design
The diagnostic application for heart failure comprises two primary components: the front-end and the back-end. The front-end interface was developed utilizing the Flutter framework, with Dart as the programming language, allowing for a responsive and intuitive user experience across multiple mobile platforms. The back-end was built using Python, employing the Django framework, which supports robust and scalable web application development. This strategic integration of technologies resulted in an efficient, user-friendly system that enables accurate and rapid diagnostics of heart failure, thus enhancing clinical workflow and patient management.
Figure 1 shows the user registration page, enabling new users to sign up within the application, be added to the system, and subsequently access their user accounts.

User registration page for the heart failure PHR application. Left: registration form with input fields; Right: confirmation screen after successful registration.
The design of the application was informed by a comprehensive review of existing research literature. Key functionalities were developed to enhance the collection and processing of data related to heart failure, drawing on clinical data and insights from prior studies, notably those conducted by Eriksson et al. These studies emphasized the necessity of creating intelligent and efficient predictive systems for the management of heart diseases, which significantly guided the design and development of our application.
The application enabled the collection of user data directly. Patients were asked to record information related to their health status and medical history in the provided forms. The application was developed to facilitate data collection directly through smartphones or similar devices. This method not only simplified and expedited the data collection process but also enhanced the accuracy and comprehensiveness of the data obtained.
After logging into their accounts, users are directed to the main application page. On this page, a central button allows users to proceed to the next steps. By clicking the main button, users are taken to the data entry section, which consists of eight different forms, each collecting specific information from the user (Figure 2).

User interface overview of various application pages.
Once all forms are completed, the system accesses the prediction model, which is based on the MLPClassifier algorithm, via an API. The user-submitted data is processed, and the final result—predicting heart failure—is displayed to the user (Figure 3).

An overview of the model prediction page.
This program, employing artificial intelligence and advanced programming techniques, cannot only collect and analyze clinical data but also make an accurate prediction of the users’ heart health status. This feature can serve as a beneficial tool for physicians and patients, which can help improve the process of diagnosis and treatment of heart failure.
Initial data collection
For the purpose of this study, the parameters on which heart failure was predicted were identified through an extensive review of literature, interviews with cardiology specialists, and examination of markers related to heart failure risk indicators. For this purpose, 12 key parameters were retrieved from the patient's Personal Health Records (PHR), which included a combination of demographic information, medical history, and clinical and laboratory test results. Table 1 demonstrates the features extracted and the scale of measurement of the prediction model.
Parameters and measurement scales of the predictive model.
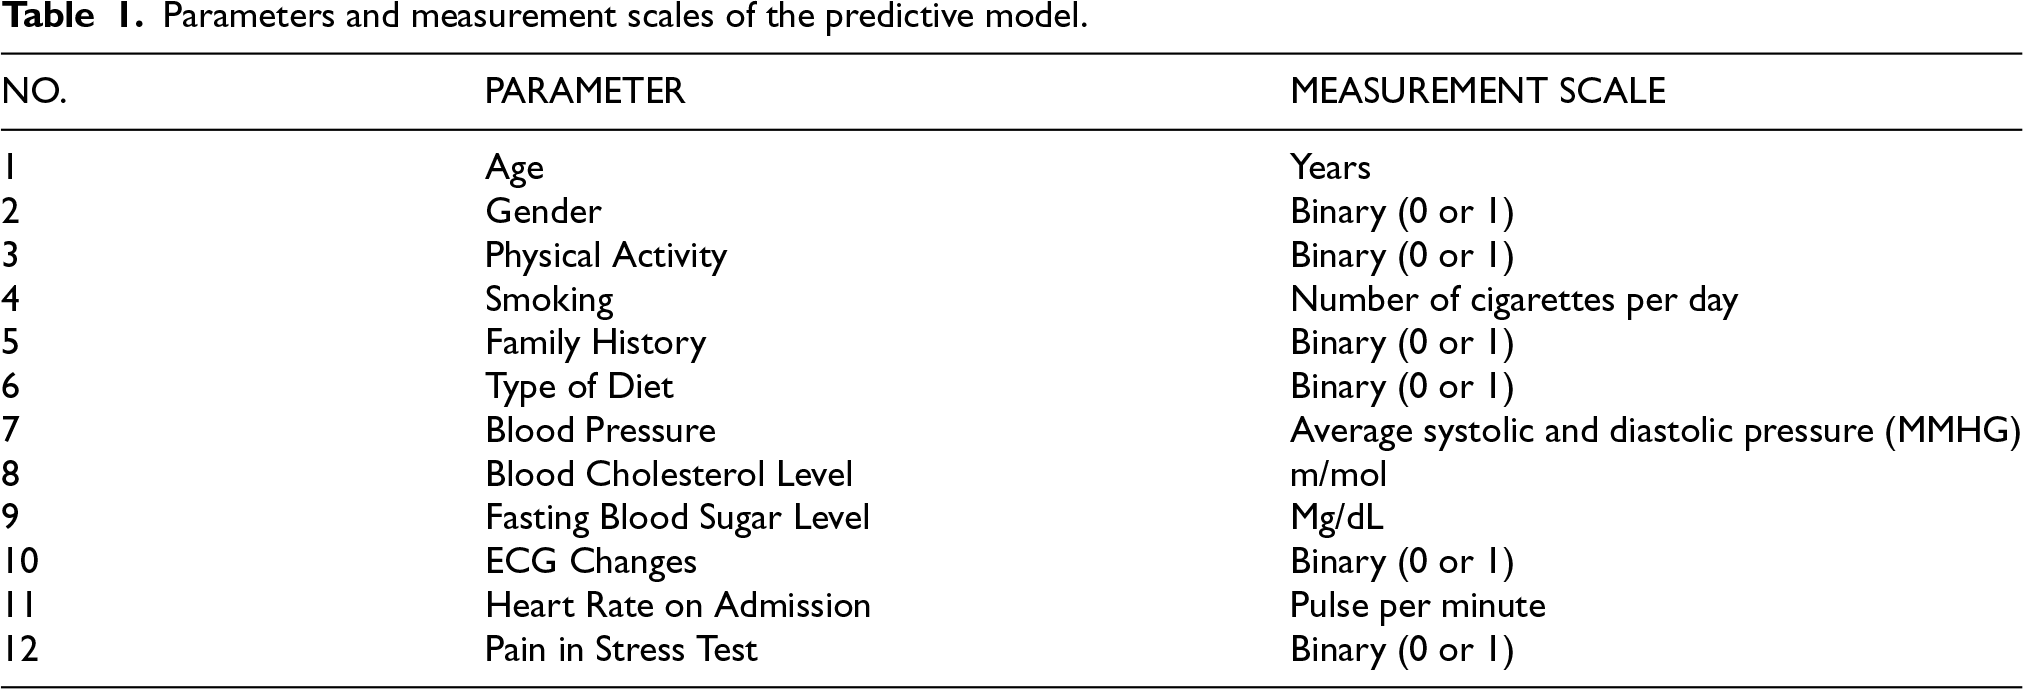
Demographic variables such as gender and age were initially selected, as they have been found to contribute significantly to heart failure in the majority of previous research studies. Male gender and increasing age are among the determinants of heart failure development or exacerbation.
Data quality verification and target data identification
Before conducting data mining, an effort was made to select variables for which the values were as accurate as possible; that is, they were from tests rather than being self-reported by patients.
Data preprocessing
Data preprocessing was carried out after reading the data. Qualitative variables were converted to quantitative and binary variables in order to simplify the data to be read by the model.
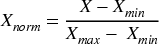
Data were also analyzed for input into the dataset. The strategy in preprocessing in this study is as follows: Missing data were first quantified per variable. Variables with >10% missing values would be considered for removal, but none met this threshold. For all variables, mean imputation was applied. Variables with <10% missing values were reviewed to possibly find the real values. After imputation, 1025 cases were retained. Data were then normalized using min-max scaling (formula provided). Finally, outliers present in the dataset were detected and capped at the 1st and 99th percentiles. Normalization was performed after data splitting to avoid data leakage.
19
The formula used:
Intelligent model design
No systematic hyperparameter tuning was conducted for the initial MLP. The model architecture consisted of two hidden layers, with 10 neurons in the first layer and 5 neurons in the second, both using the ReLU activation function. The output layer contained a single neuron with a sigmoid activation function. The input layer comprised 12 neurons. Other parameters: Optimizer Adam (lr = 0.001), binary cross–entropy loss, batch size 32, L2 regularization (α = 0.0001), training for up to 1000 epochs with early stopping (patience = 10). The data were split into 70% training, 15% validation, 15% testing. Experimental trials were run 8 times to assess stability.
Comparison with baseline models
To benchmark the MLP against standard machine learning approaches, we additionally trained and evaluated Logistic Regression (LR), Random Forest (RF), and Support Vector Machine (SVM). Hyperparameter tuning was performed for all models (including an enhanced MLP) using GridSearchCV with stratified 5–fold cross–validation (shuffled, random state 42) and ROC–AUC as the scoring metric. The search spaces were:
The same train/validation/test split (70/15/15) was used. After selecting the best parameters, final evaluation was performed on the test set.
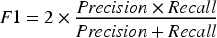
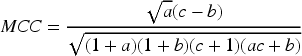
Model evaluation
Heart failure was a binary classification (positive/negative). Model performance was evaluated using standard classification metrics. The metrics - including accuracy, precision, sensitivity, specificity, F1-score, ROC-AUC, and the Matthews Correlation Coefficient (MCC) - were calculated using functions from the scikit-learn machine learning library in Python.20–23 For the tuned comparative models, we calculated 95% confidence intervals using bootstrap (1000 iterations). Permutation importance (10 repeats) was derived for the best–performing model. Cross–validation stability was reported as mean ± SD of ROC–AUC over the 5 folds. True Positive (TP): The amount of heart failure patients correctly diagnosed by the computer diagnosis system. False Positive (FP): The number of heart failure patients incorrectly diagnosed as not having heart failure by the computer diagnostic system. True Negative (TN): The number of non-heart failure patients correctly diagnosed as not having heart failure by the computer diagnostic system. False Negative (FN): The number of non-heart failure patients incorrectly diagnosed as having heart failure by the computer diagnostic system.
Precision, Sensitivity, specificity, and accuracy were calculated as follows:


Where
Results
Descriptive profile of demographics of study members
Age distribution
Figure 4 illustrates the age distribution of the sample. The most representation occurs in the “50–54” age group, which can indicate some trends regarding heart health, for instance, increased risk of heart failure within this group. Conversely, the reduced representation of the young and elderly age groups can inform prevention and treatment strategies for these groups.
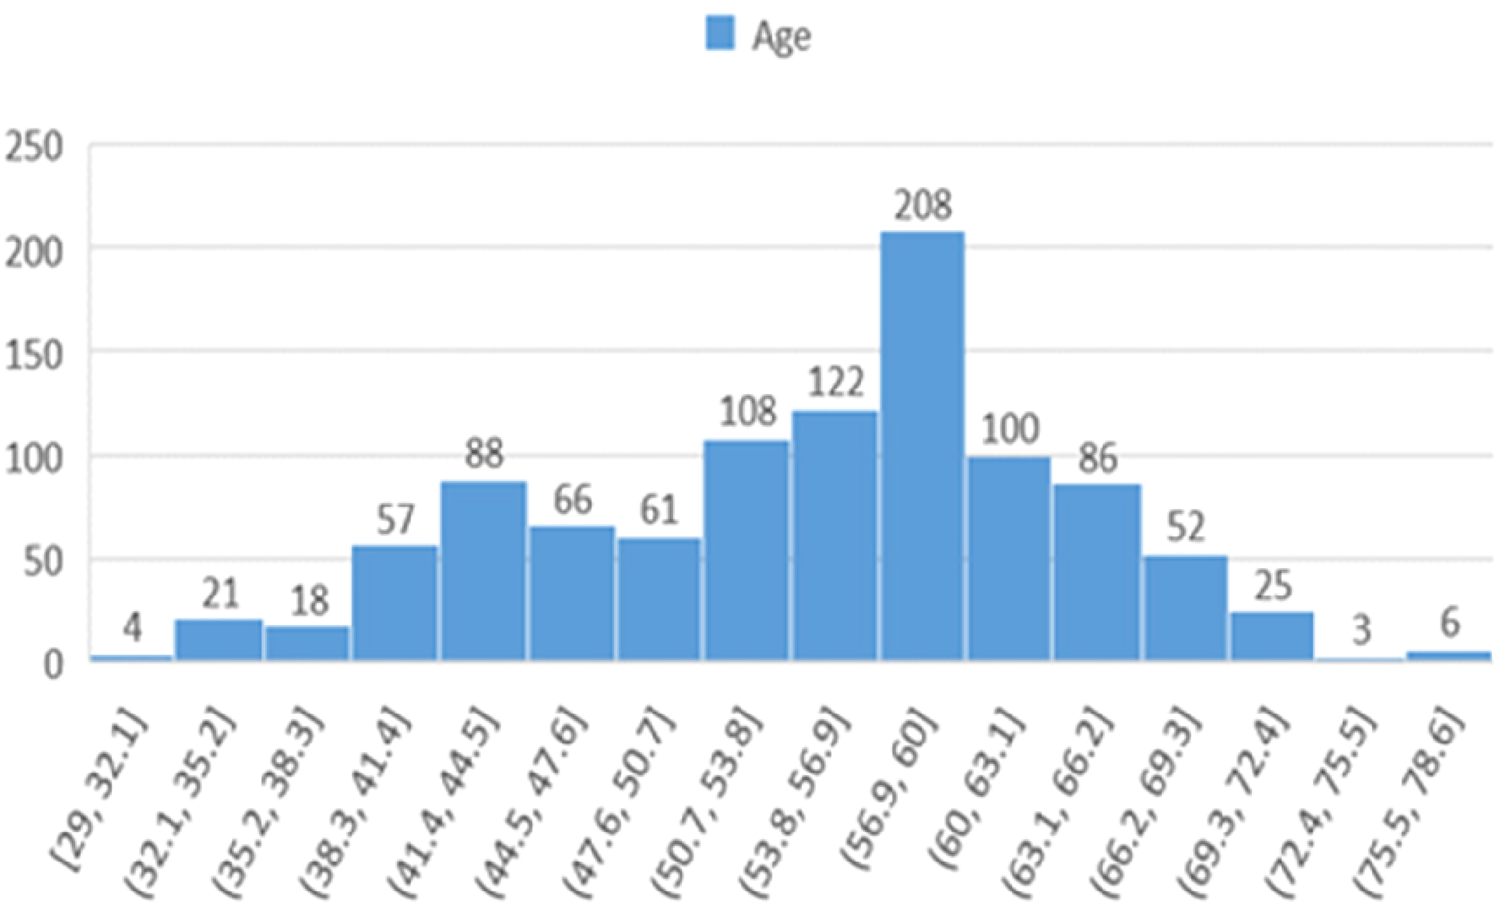
Histogram showing the age distribution of participants in the study across different age ranges.
Gender distribution
Figure 5 presents the gender distribution of participants, revealing a notable imbalance that could influence analyses related to heart failure outcomes.
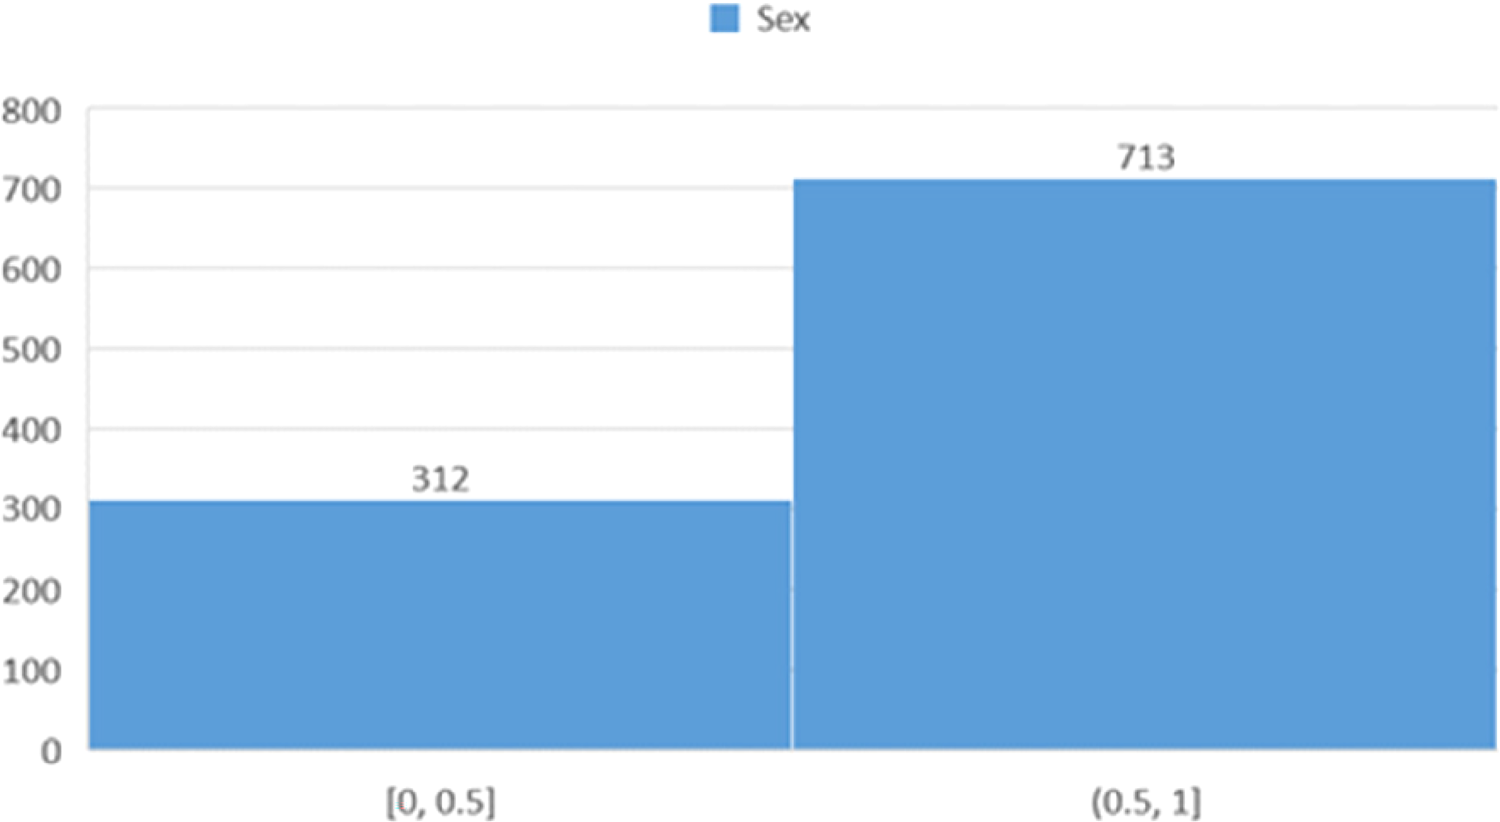
Histogram showing the distribution of participants based on gender.
Physical activity patterns
Figure 6 depicts the physical activity levels among participants, which can provide valuable insights for further analysis regarding the impact of physical activity on heart health and the development of health promotion programs.
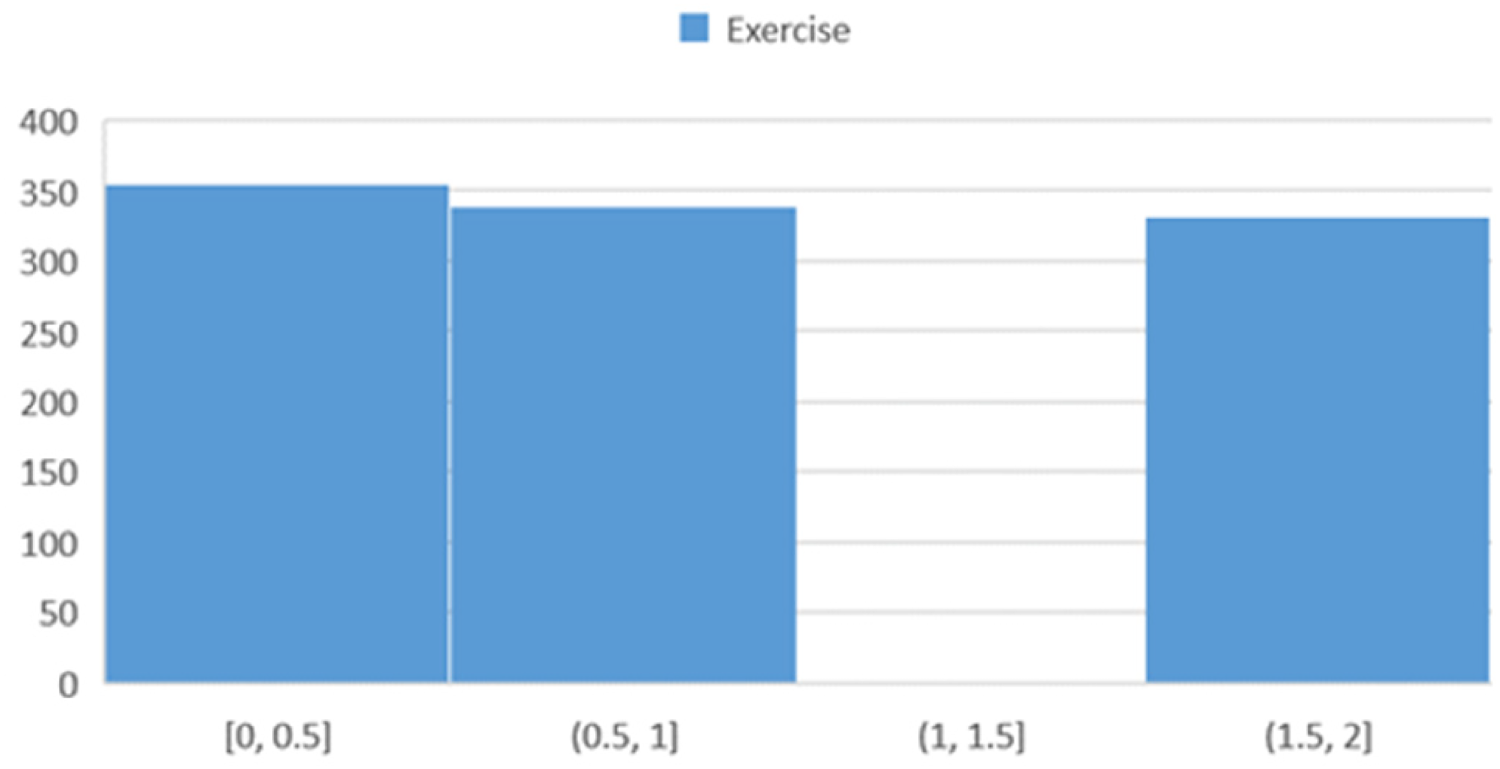
Histogram showing the distribution of participants based on physical activity.
The large proportion of the “50–54” age group may be attributed to physiological alterations with aging or risk factors of cardiovascular well-being in lifestyle and the environment. In addition, the observed gender imbalance, with women being more represented, may refer to biological or socio-economic factors on heart well-being. 18 Most of the participants reported low to moderate levels of physical activity, and thus there is a requirement for community interventions promoting increased physical activity to reverse the risk of heart failure. 24
Cigarette smoking
Figure 7 illustrates the distribution of participants based on the number of cigarettes smoked per day.
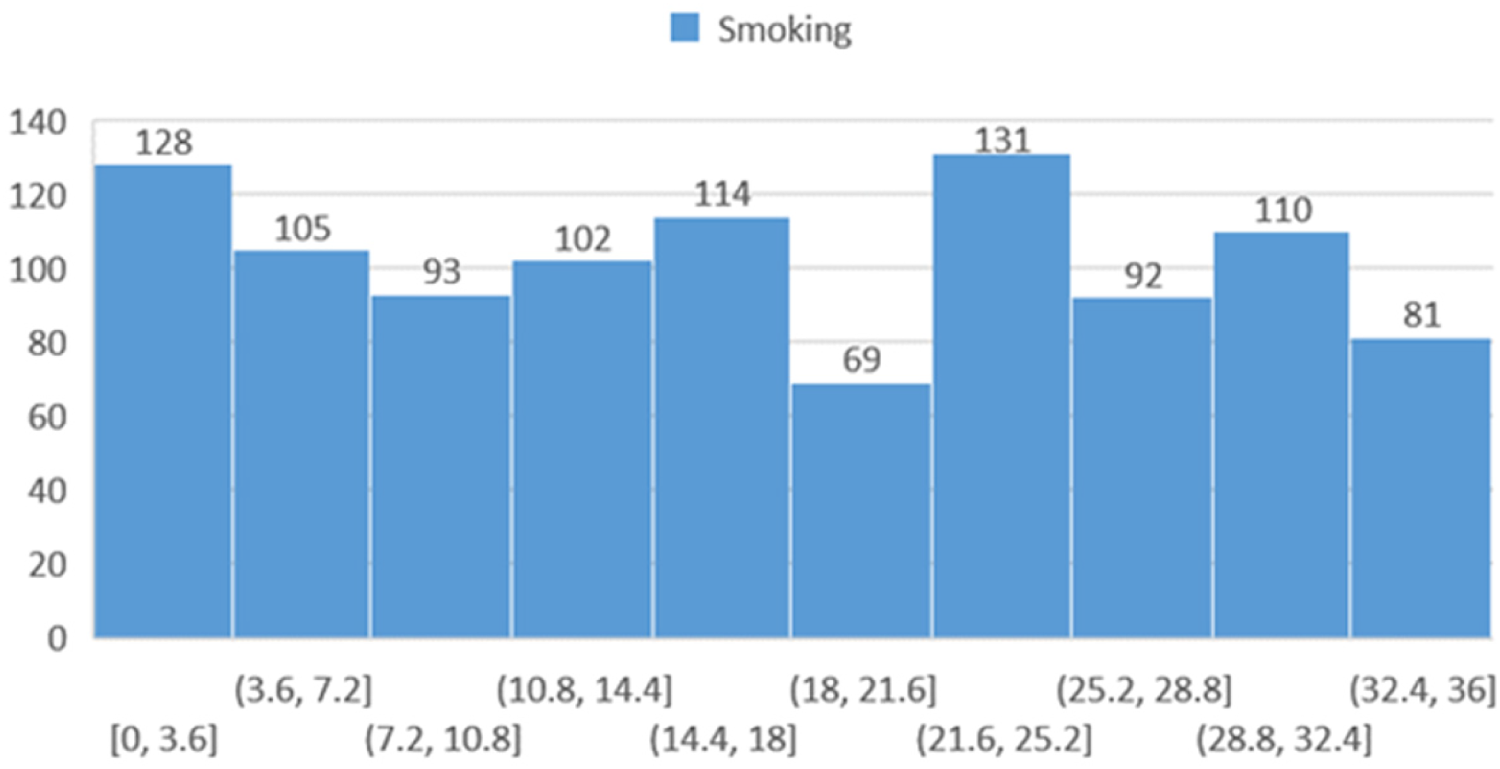
Histogram showing the distribution of participants based on the number of cigarettes smoked per day.
Family history of heart disease
Figure 8 demonstrates the distribution of participants with a family history of heart disease.
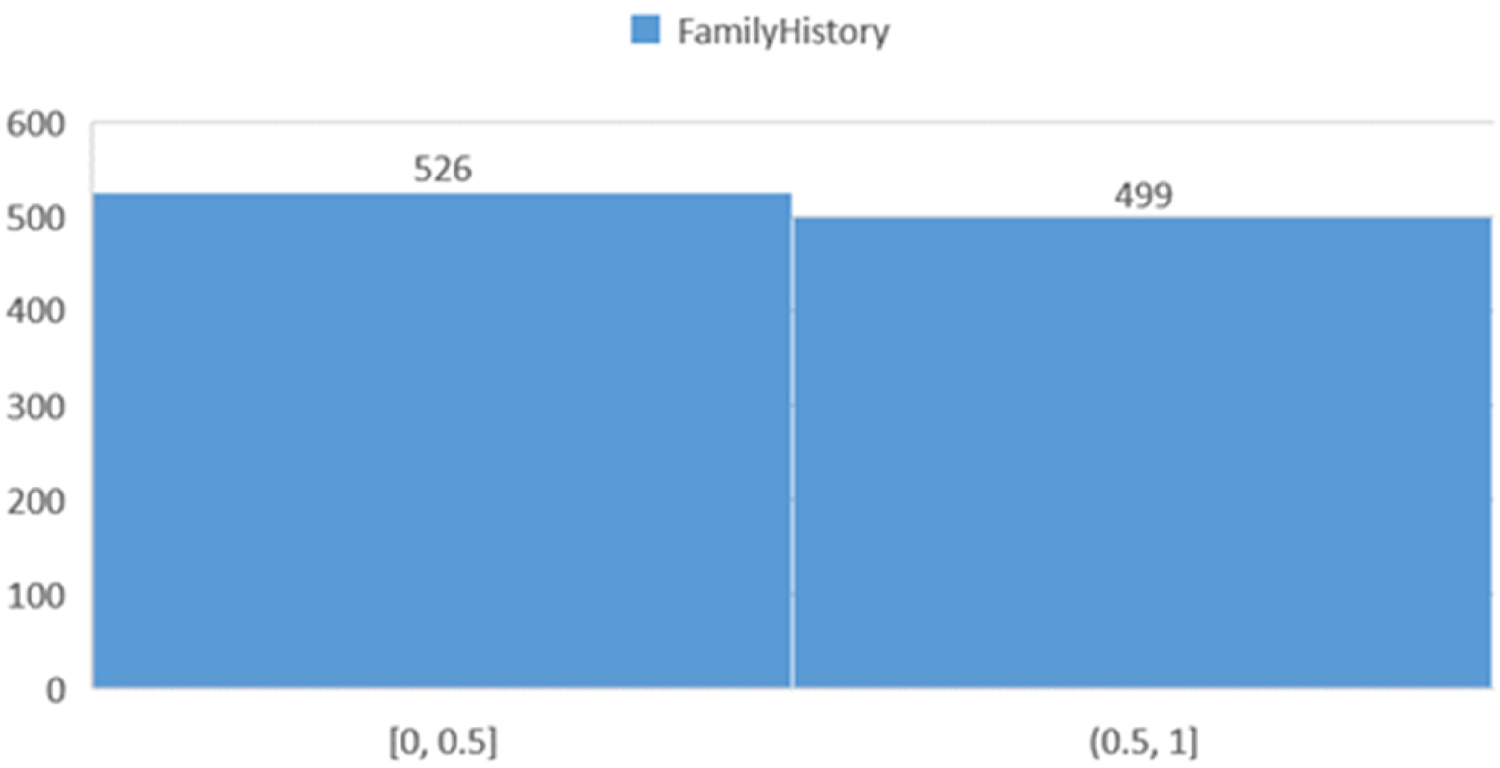
Histogram showing the distribution of participants based on a family history of heart disease.
Dietary patterns
Figure 9 presents the dietary habits of the study population. The categories are defined as follows: the “zero” group represents individuals with no specific dietary restrictions, the “one” group includes those following a specific diet, and the “two” group comprises individuals adhering to a different or more restrictive diet.
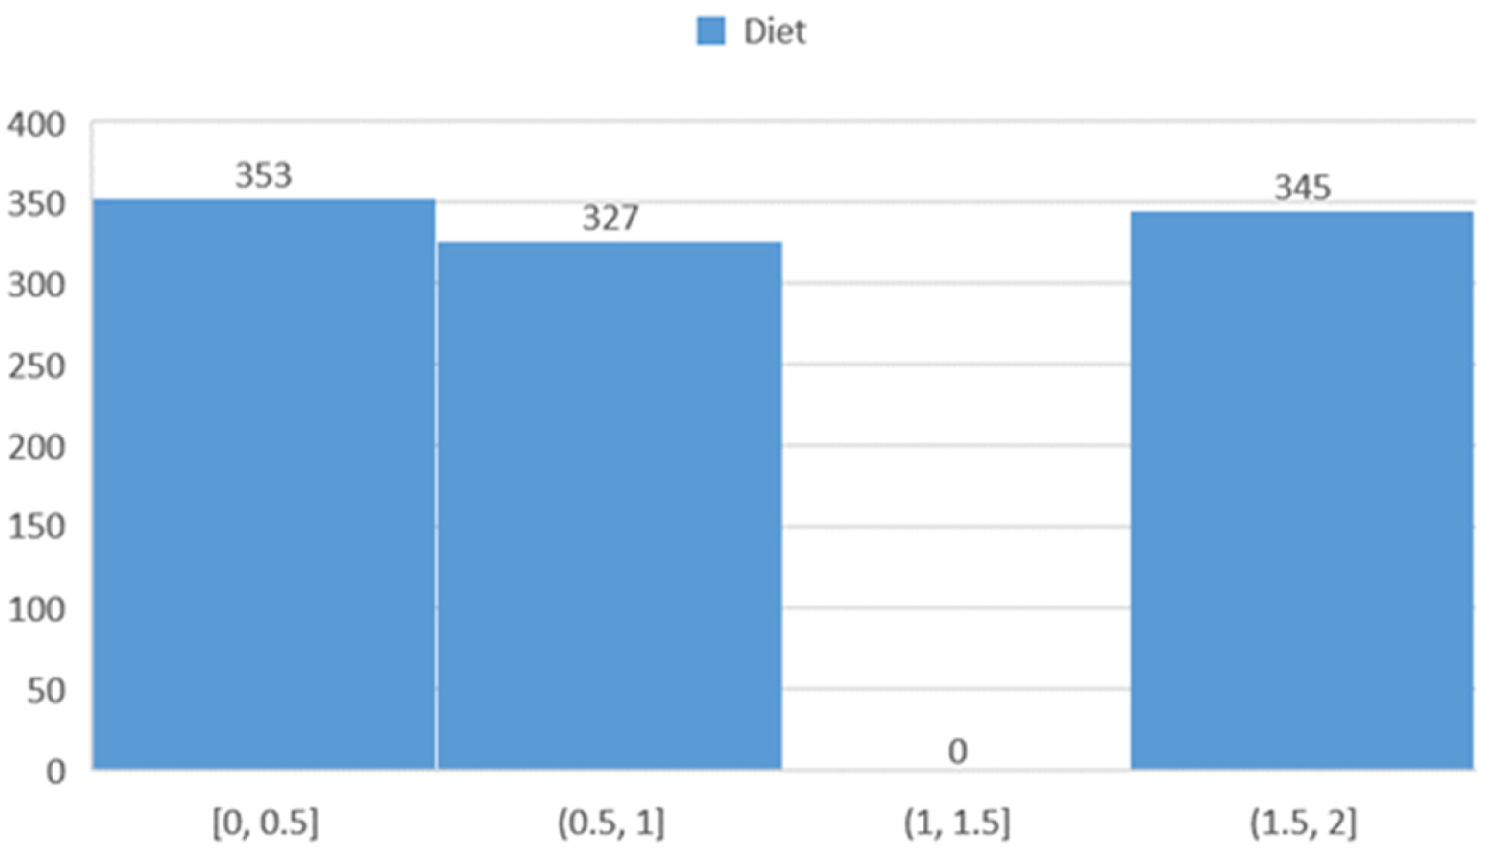
Histogram showing the distribution of participants based on dietary habits.
Blood pressure distribution
Figure 10 illustrates the distribution of blood pressure values among participants.
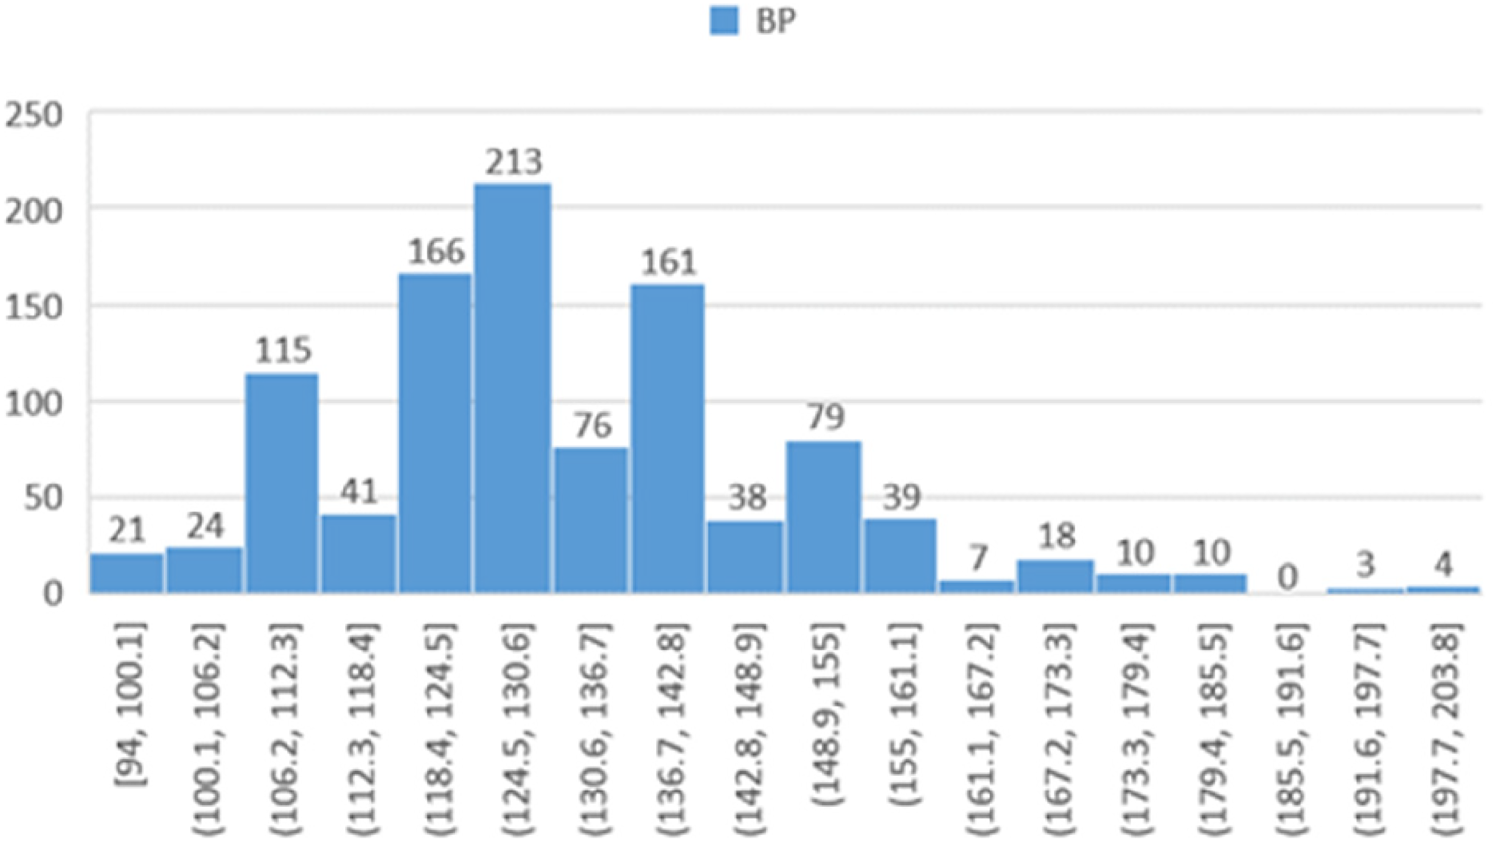
Histogram showing the distribution of participants based on blood pressure.
Cholesterol levels
Figure 11 displays the frequency distribution of cholesterol levels within the study population. The chart categorizes cholesterol levels as low (126 to 144 mg/dL), moderate, and high.
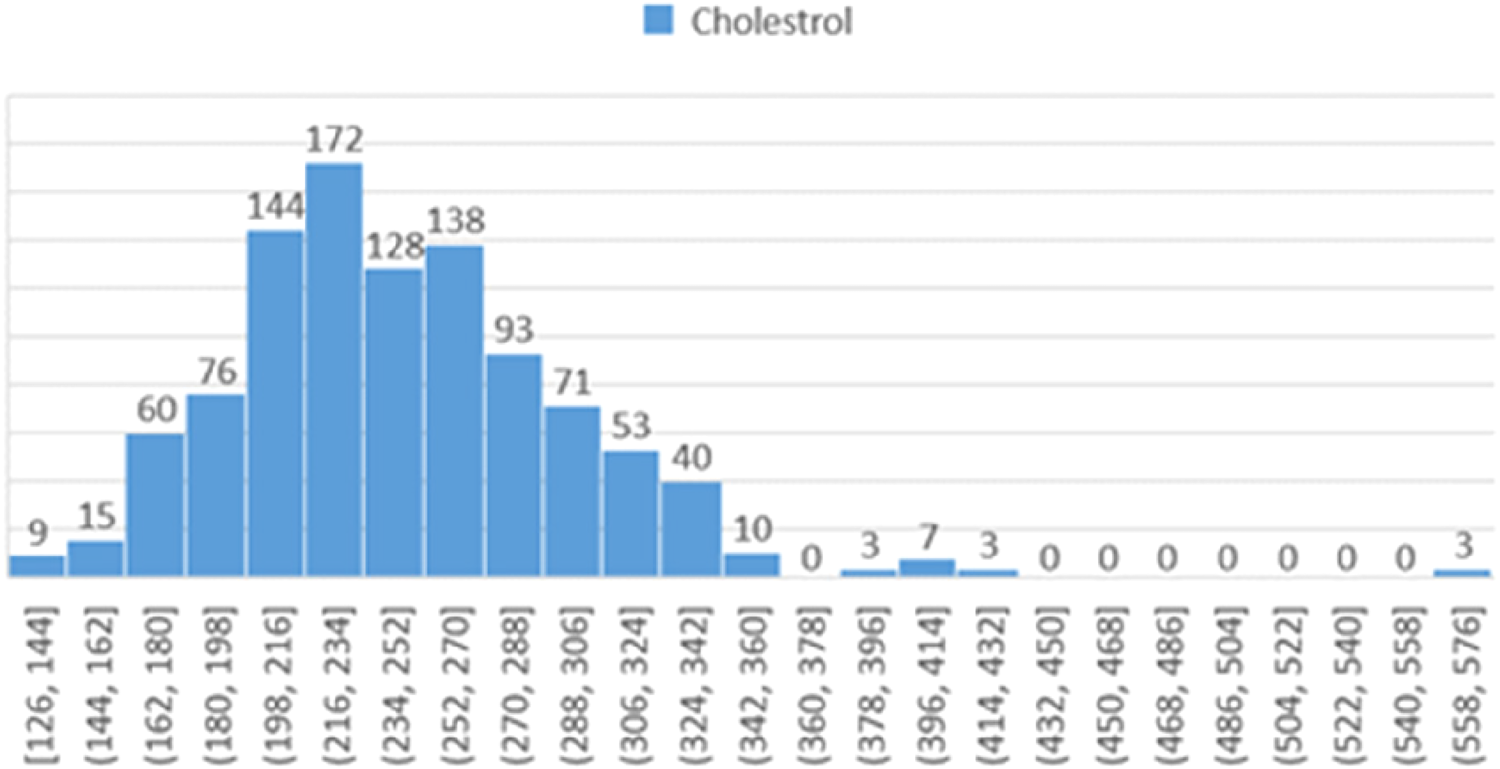
Histogram showing the distribution of participants based on cholesterol levels.
Fasting blood sugar levels
Figure 12 depicts the distribution of fasting blood sugar (FBS) levels. This distribution reveals significant differences between groups and can be instrumental for further analysis of the relationship between FBS levels and heart failure risk.
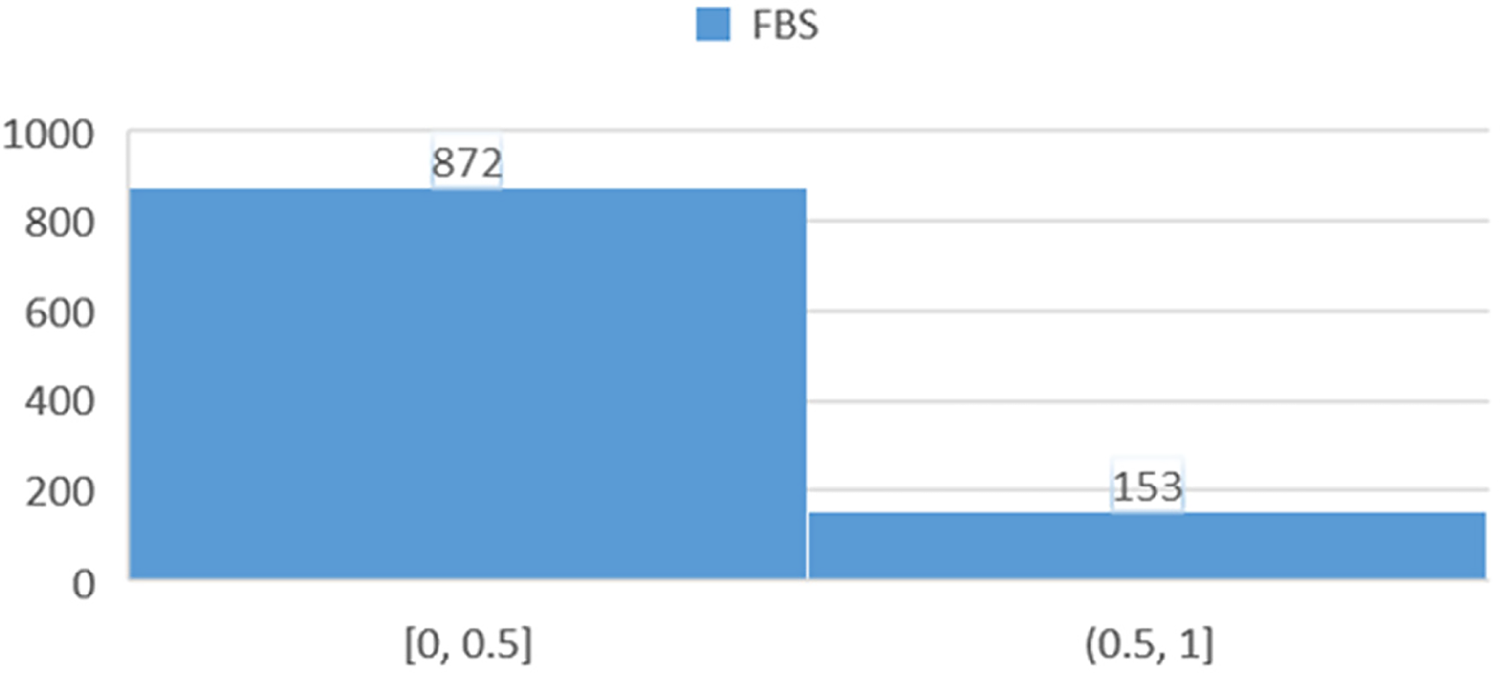
Histogram showing the distribution of participants based on fasting blood sugar (FBS) levels.
Electrocardiogram (ECG) results
Figure 13 shows the distribution of participants based on ECG findings, categorized into three main groups: (0) individuals with normal or no abnormal ECG signs, (1) those with mild abnormalities, and (2) individuals with more severe or prominent ECG abnormalities. This classification aims to assess the severity of cardiac anomalies detected through ECG.
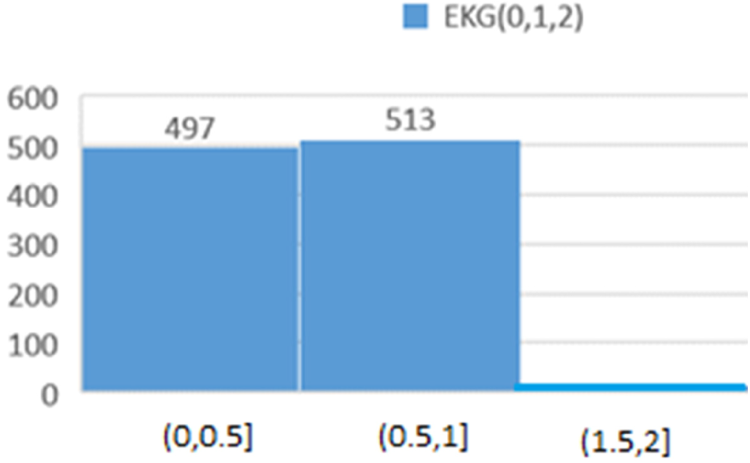
Histogram showing the distribution of participants based on ECG results.
Heart rate distribution
The “Pulse” chart (Figure 14) illustrates the frequency distribution of heart rates across various ranges. The data indicate that the highest number of participants fall within the heart rate ranges of “[123, 135]” and “[135, 143]”, with frequencies of 148 and 136, respectively. This information is valuable for medical analyses related to heart health and exercise planning.
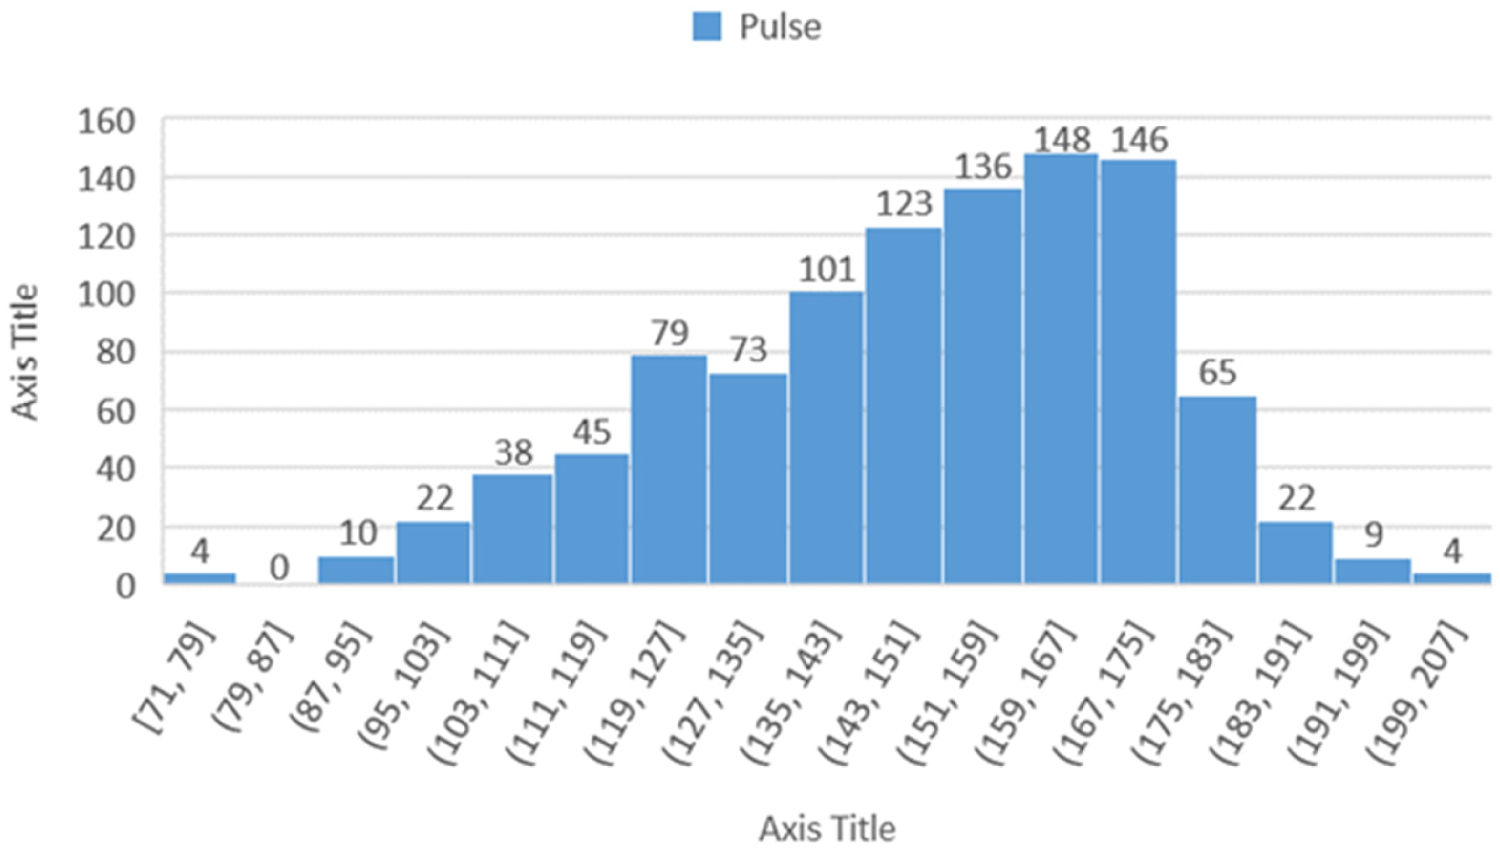
Histogram showing the distribution of participants based on heart rate (pulse).
Pain in stress test
Figure 15 displays the distribution of participants based on results from the Pain in Stress Test, indicating that the number of cases in the first range is higher than in the second. This discrepancy may suggest an imbalanced data distribution, reflecting either natural variability or genuine differences in the characteristics studied.
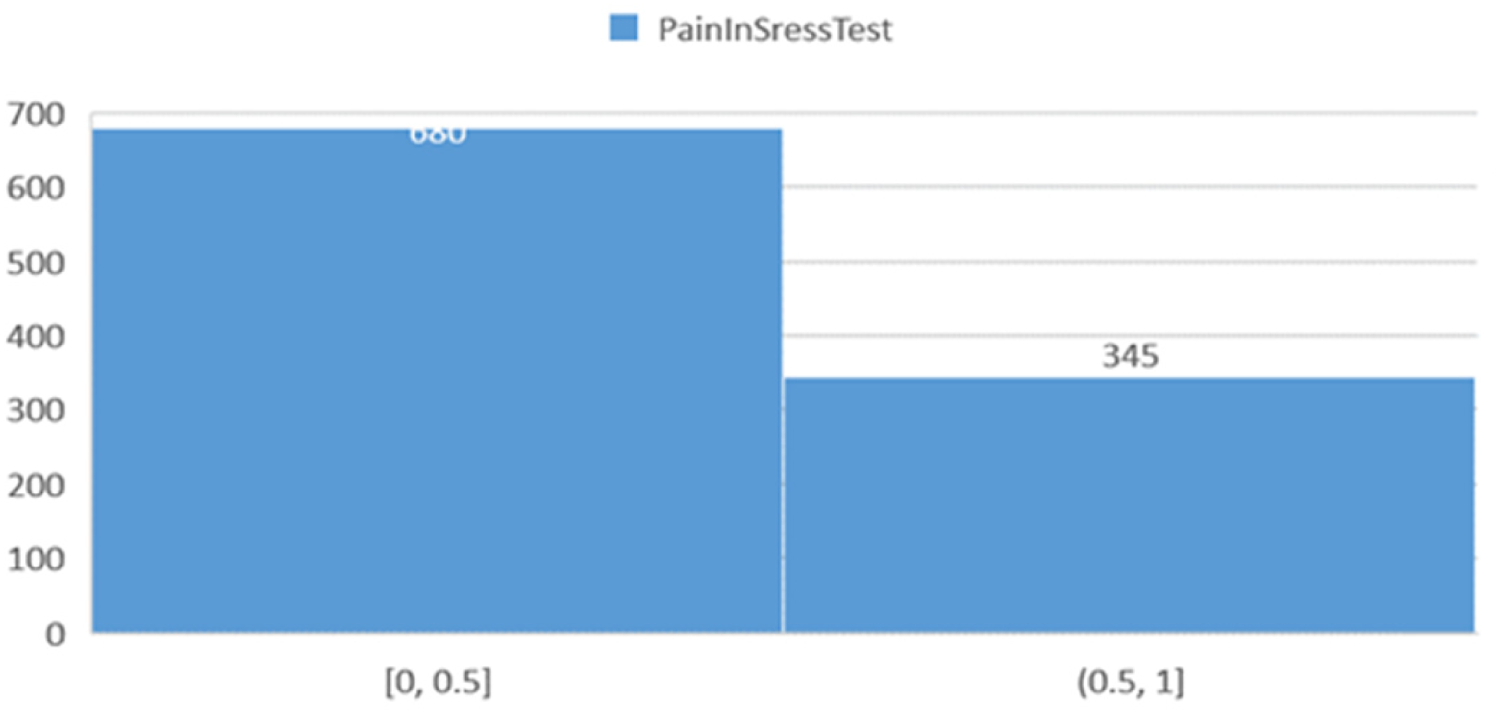
Histogram showing the distribution of participants based on pain in stress test results.
Model performance evaluation
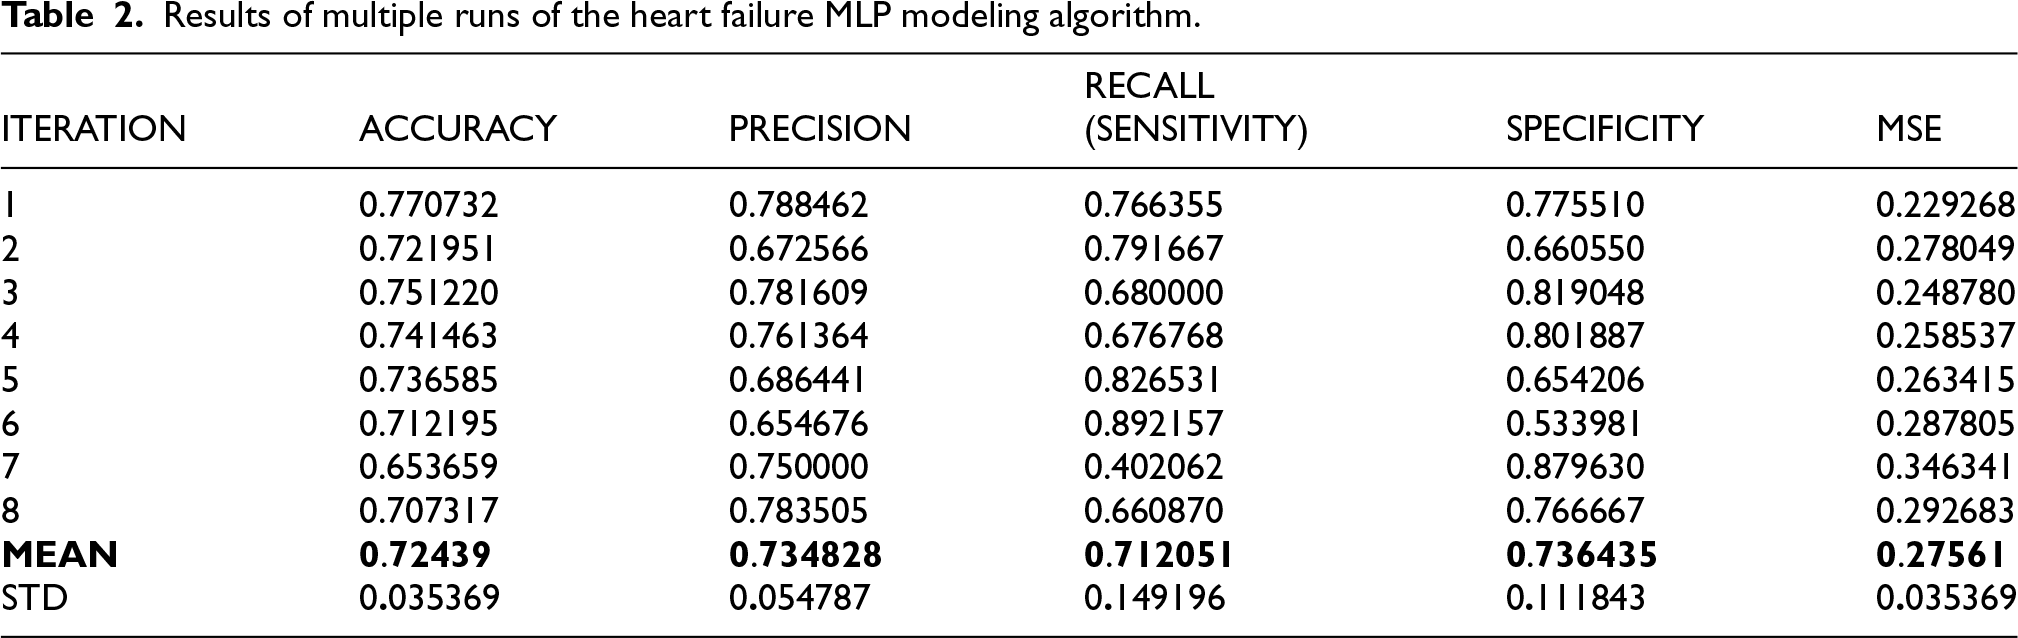
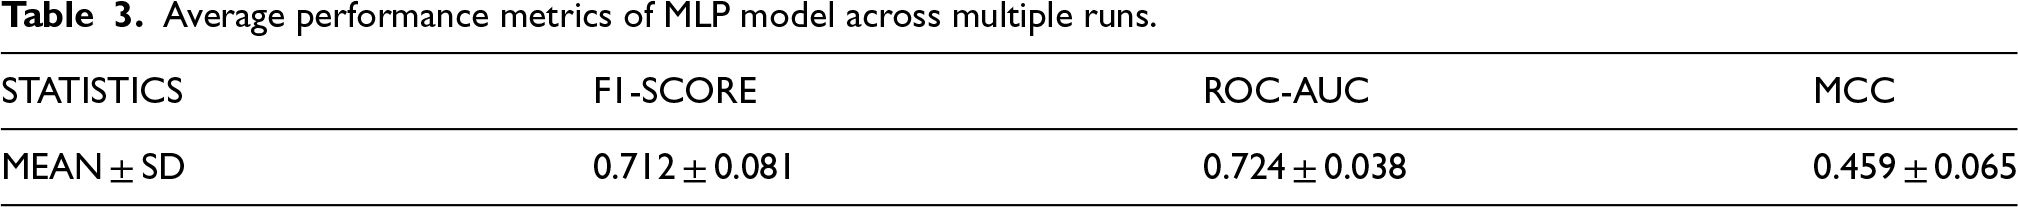
Table 2 presents the findings of the MLP model's performance across various experiments. Accuracy ranged between 0.6537 and 0.7707, with a mean of around 0.7244. Precision ranged between 0.6547 and 0.7885, with a mean of around 0.7349, indicating the reliability of the model in predicting positive instances. Sensitivity was best at 0.8922, with a mean of 0.7120, indicating inconsistencies in identifying positive cases across various trials. Furthermore, Specificity ranged from 0.5340 to 0.8796, with a mean of 0.7365, showing the model's precision in predicting negative cases. Mean squared error (MSE) varied from 0.2293 to 0.3463, showing good performance with varying iterations. Table 3 estimated the mean values of F1-score, AUC, and MCC across multiple runs. Figure 16 graphs the error curve, which shows the variation of the prediction error throughout the training. The error value is very high at the start, almost 17.5, but decreases significantly as the number of iterations increases, ultimately approaching zero towards the end of the training. This behavior reflects the learning and optimization of the model with time. Error curves are widely utilized in machine learning to decide the efficiency and effectiveness of algorithms, which indicates that the model is constantly improving its prediction accuracy.
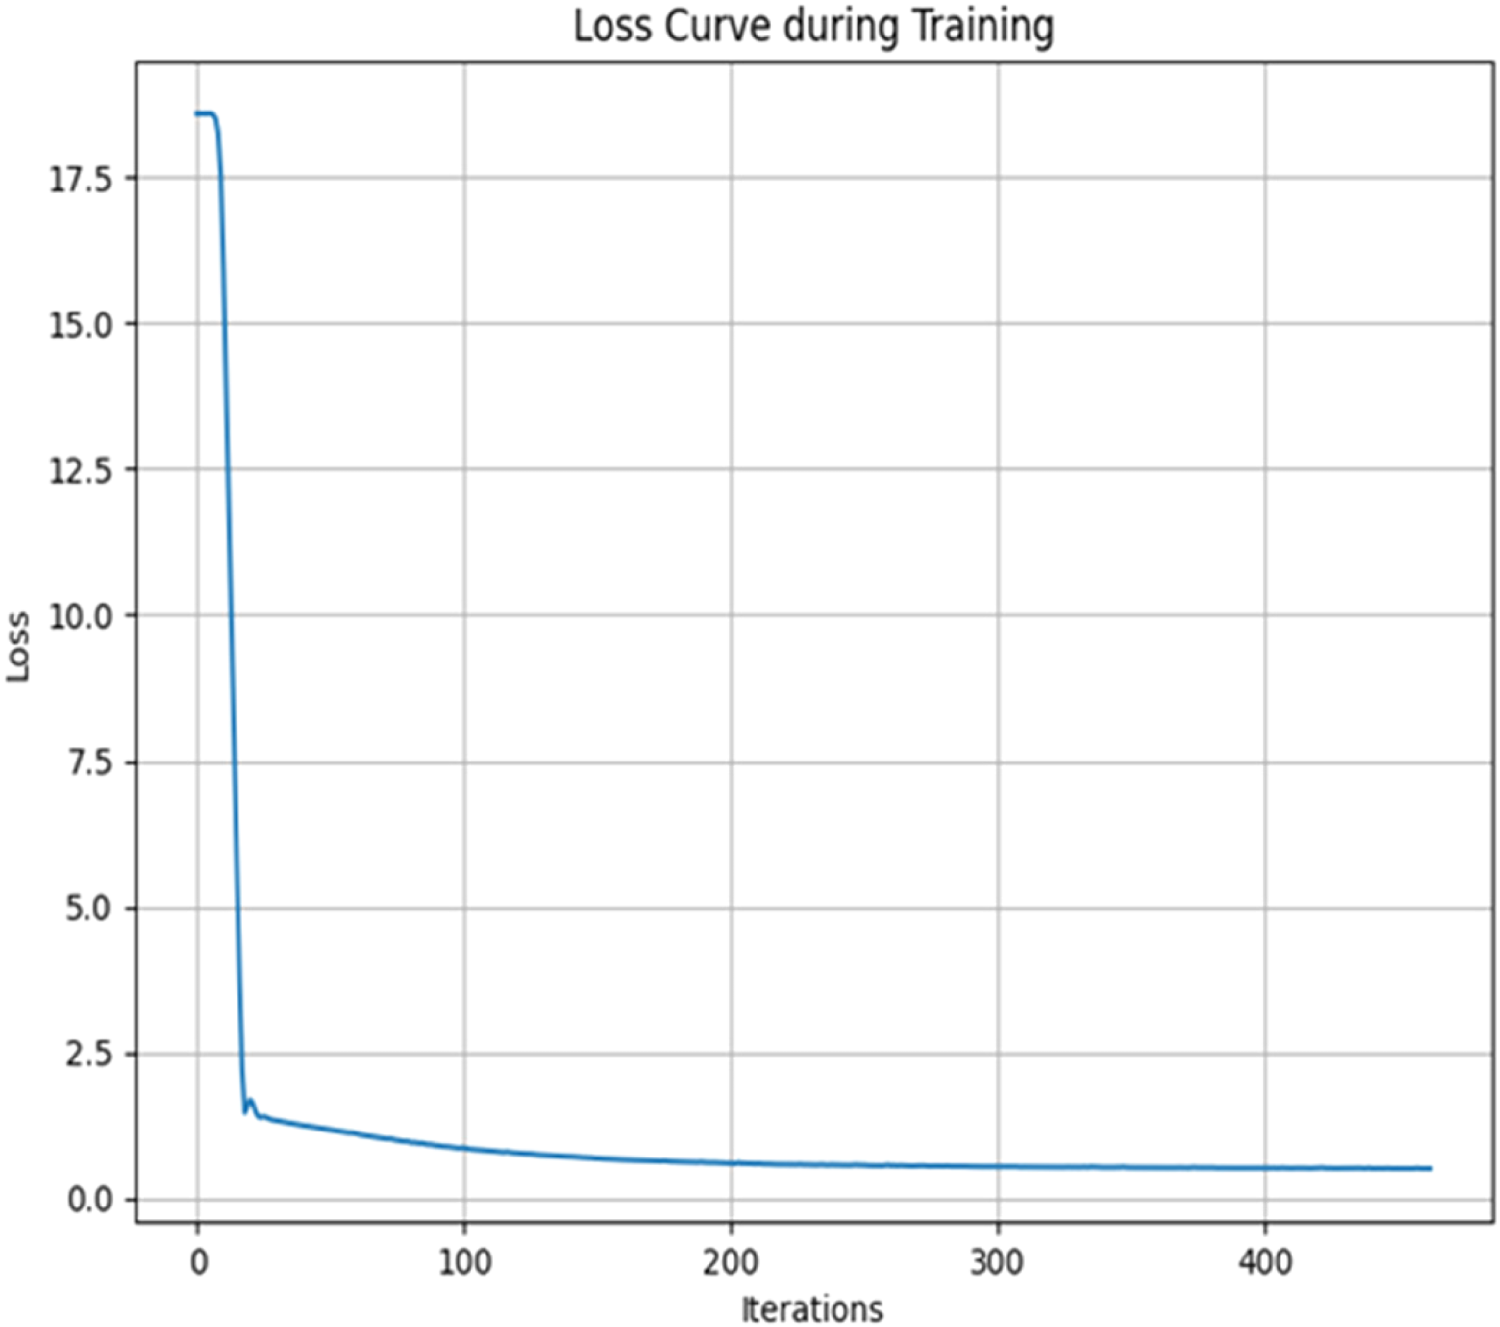
Error curve over training.
Results of multiple runs of the heart failure MLP modeling algorithm.
Average performance metrics of MLP model across multiple runs.
Based on the results shown in Table 2, 95% confidence intervals for the mean of the metrics were estimated as follows. Accuracy: 0.7244 ± 0.0245 (95% CI: 0.6999–0.7489); Precision: 0.7348 ± 0.0379 (95% CI: 0.6969–0.7727); Sensitivity: 0.7121 ± 0.1032 (95% CI: 0.6089–0.8153); Specificity: 0.7364 ± 0.0774 (95% CI: 0.6590–0.8138).
Table 4 summarizes the performance of the tuned models (Logistic Regression, Random Forest, SVM, and enhanced MLP) on the test set. Random Forest clearly outperformed all others, achieving accuracy 0.890, recall 0.911, F1 0.894, MCC 0.779, and ROC–AUC 0.959 (95% CI 0.924–0.986). The enhanced MLP (best architecture: hidden layers (50,25), ReLU, Adam, learning rate 0.01) reached ROC–AUC 0.830 (CI 0.763–0.893), which is a notable improvement over the original untuned MLP (AUC 0.795 on the same test split). Logistic Regression and SVM gave moderate performance (AUC 0.824 and 0.842, respectively). Cross–validation stability (5–fold ROC–AUC mean ± SD) was: LR 0.841 ± 0.024, RF 0.966 ± 0.010, SVM 0.845 ± 0.018, MLP 0.852 ± 0.023.
Performance comparison of baseline machine learning models and the tuned MLP on the test set.
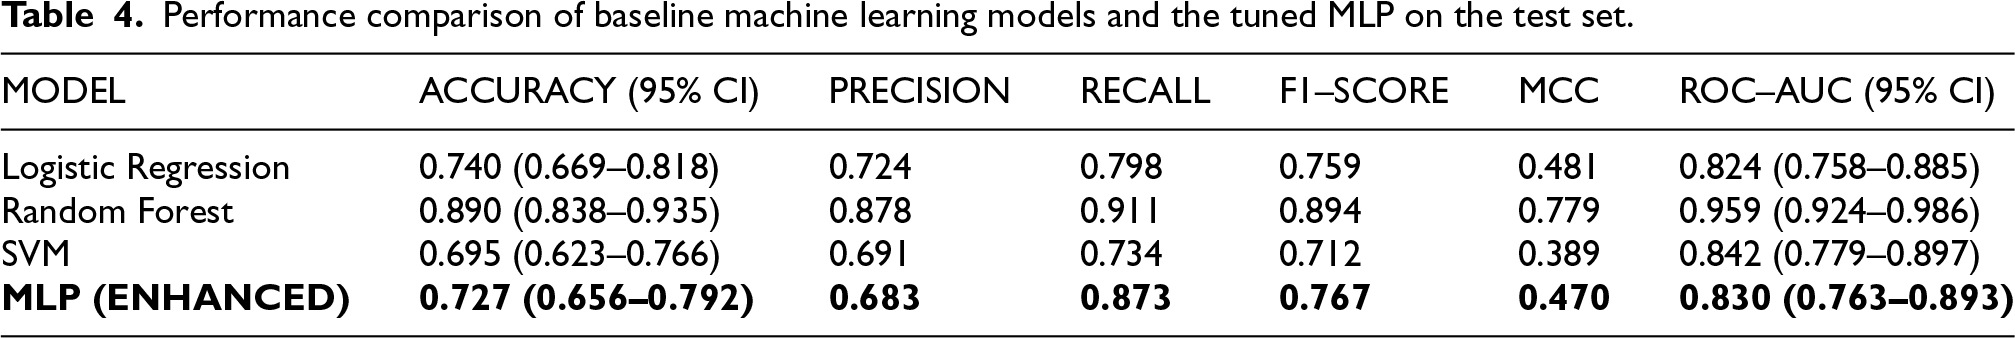
Figure 17 shows the full ROC curves of all four tuned models in this study. Figure 18 and Figure 19 present permutation importance for tuned MLP model and RF, respectively. The features with the longest bars in the tuned MLP model are Pain_Stress_Test, Pulse, and Sex, while in the best-performing Random Forest model, they are Pulse, Age, and Pain_Stress_Test. Figure 20 shows the confusion matrix of Random Forest (65 true negatives, 10 false positives, 7 false negatives, 72 true positives).
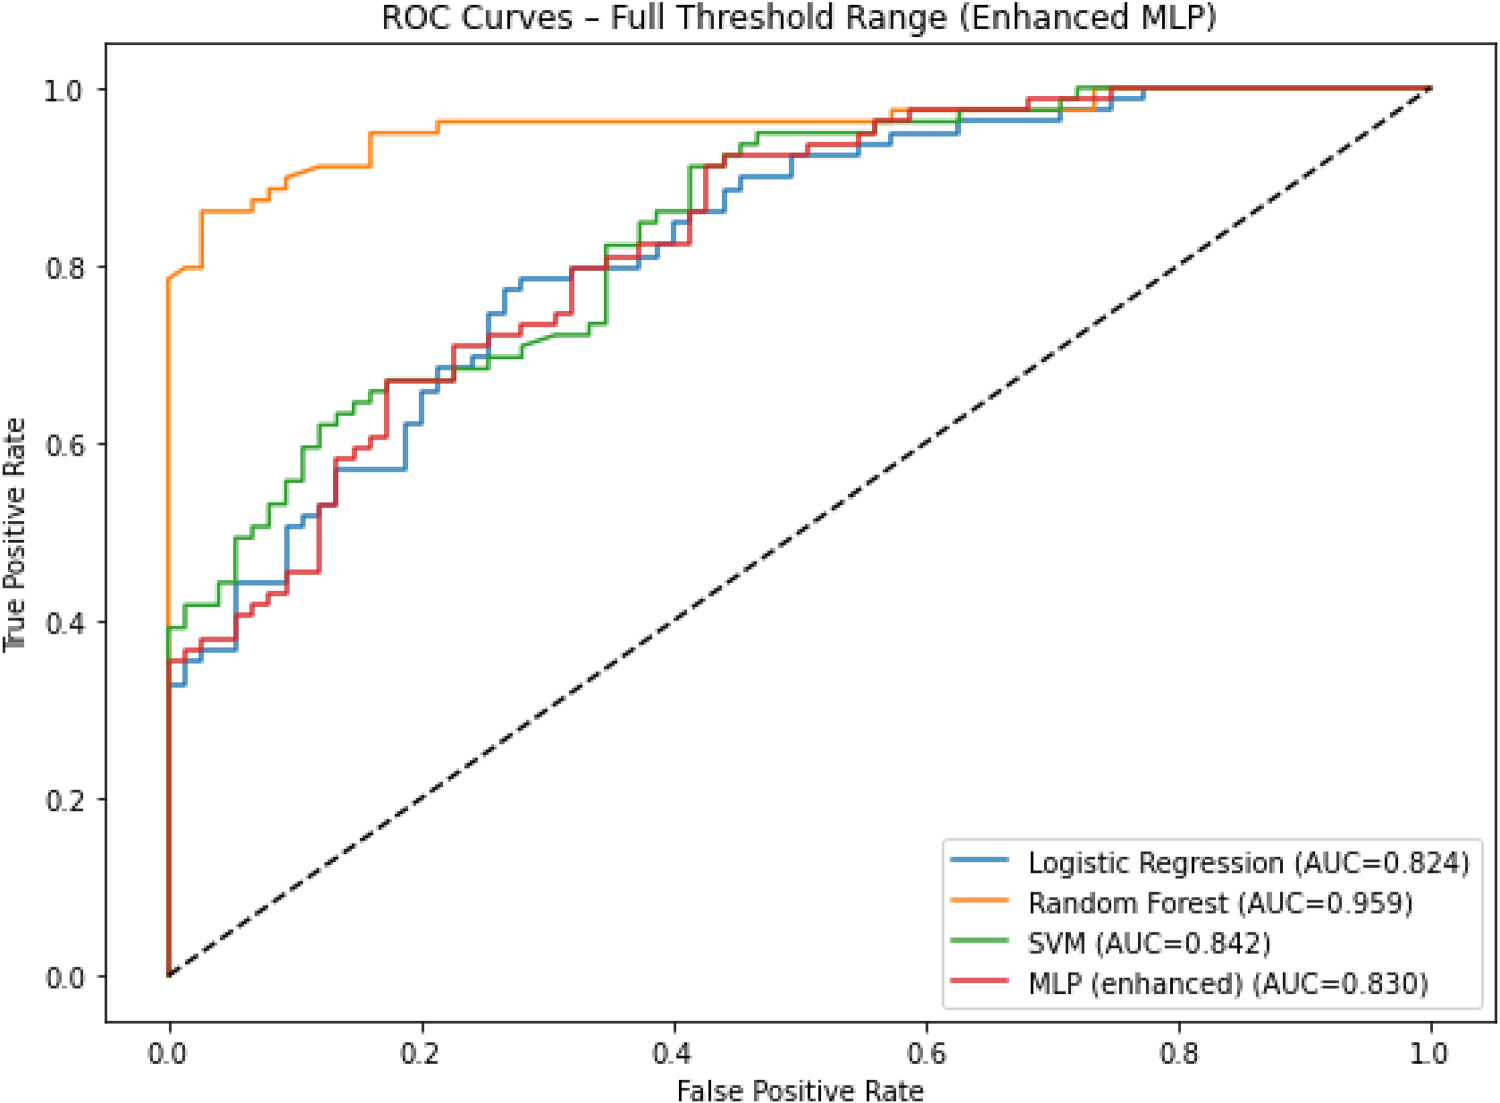
ROC curves of LR, RF, SVM, MLP models.
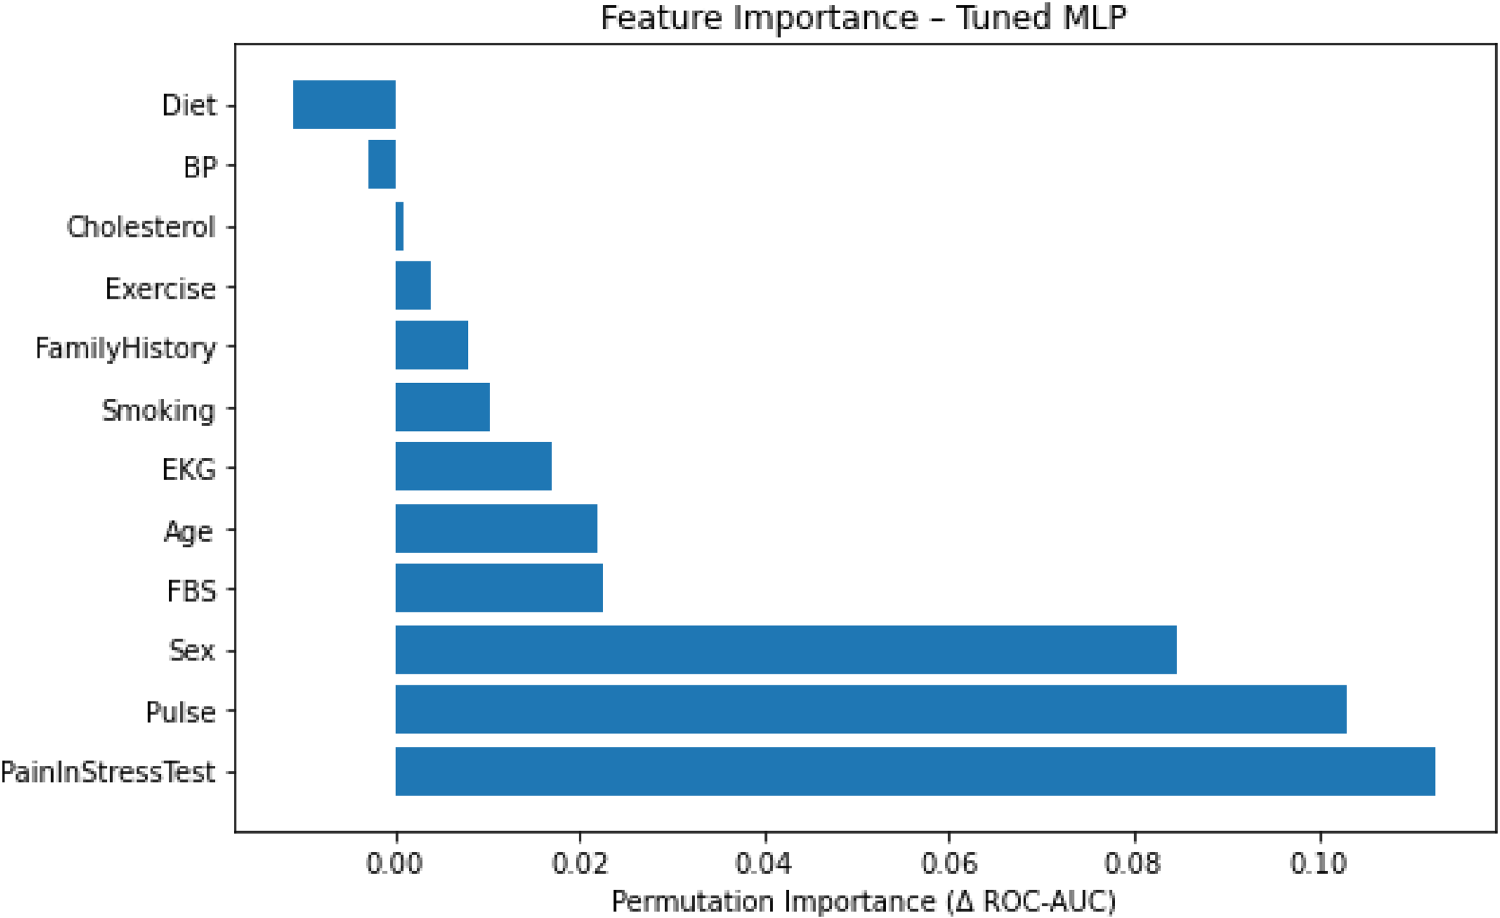
Permutation feature importance for the tuned MLP model.
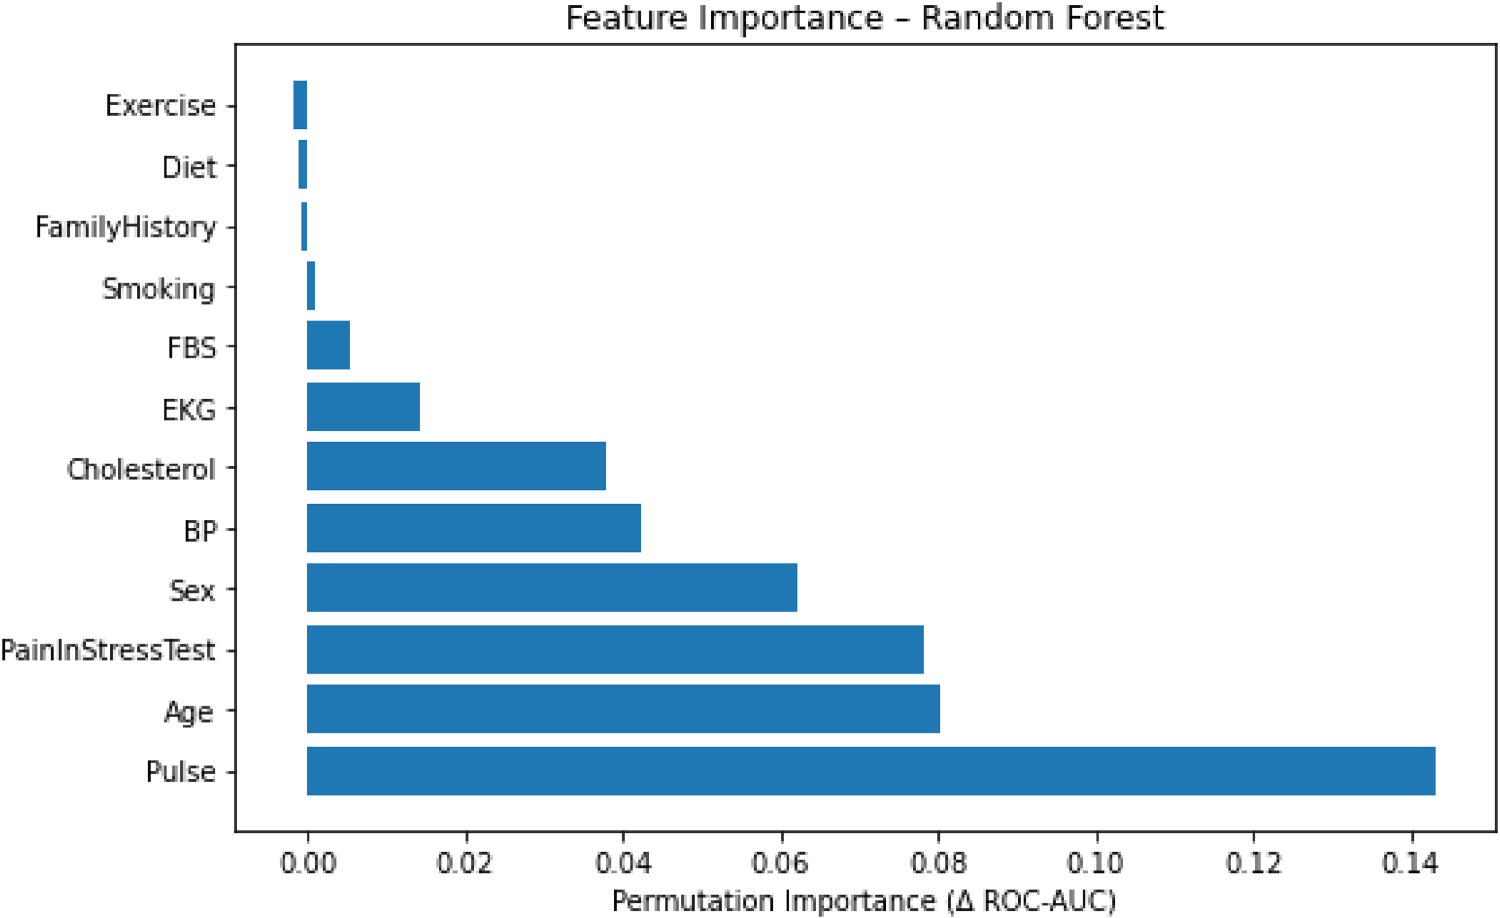
Permutation feature importance for the best–performing model (random forest).
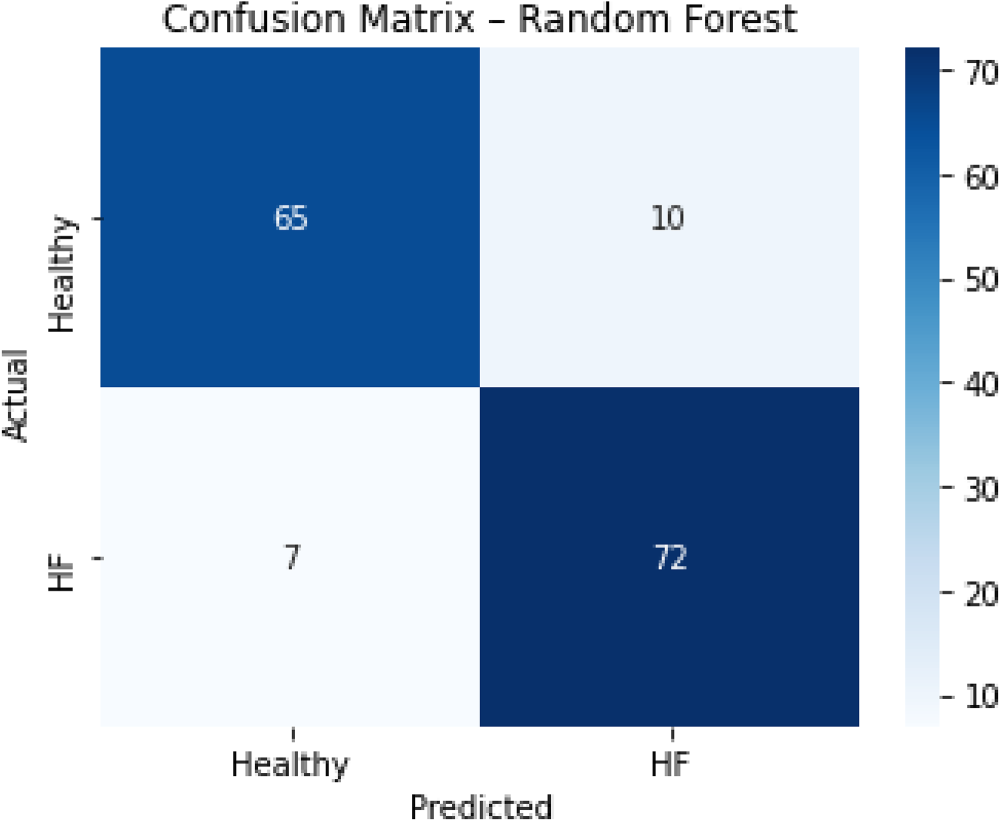
Confusion matrix of the tuned random forest model.
Discussion
The data collected in this study were pivotal in determining trends of cardiovascular diseases and proposing measures for enhancing heart health among the population. Our prime objective was to develop an intelligent heart failure prediction model from PHRs. The initial untuned MLP demonstrated a satisfactory level of accuracy (mean 0.724) in identifying individuals at risk of cardiovascular diseases. However, the high standard deviation of sensitivity (0.149) suggested inconsistency in detecting true positive cases, likely due to the small test set size (15%, n≈154), class overlap in certain risk factors, or lack of hyperparameter tuning. Future studies should use larger datasets and cross–validation to stabilize sensitivity.
To address these limitations and benchmark the MLP against standard approaches, we performed systematic hyperparameter tuning (grid search with 5–fold cross–validation) for Logistic Regression (LR), Random Forest (RF), Support Vector Machine (SVM), and an enhanced MLP. RF achieved the highest performance on the test set (ROC–AUC 0.959, 95% CI 0.924–0.986; accuracy 0.890), substantially outperforming both traditional statistical models and the neural network. This is consistent with the well–known advantage of tree–based ensembles on structured, tabular medical data. However, the tuned MLP (best architecture: hidden layers (50,25), ReLU, Adam, learning rate 0.01) reached a ROC–AUC of 0.830 (95% CI 0.763–0.893), which is a notable improvement over the original untuned MLP (AUC 0.724 on the same test split). Logistic Regression and SVM gave intermediate results (AUC 0.824 and 0.842, respectively). Moreover, after tuning and cross–validation, the enhanced MLP's cross–validation ROC–AUC standard deviation dropped to 0.023 (compared to the original sensitivity SD of 0.149), reflecting much greater stability.
Despite RF's superior numerical performance, the MLP offers several distinct advantages for clinical integration. First, MLPs can inherently model complex non–linear interactions between risk factors (e.g., age, blood pressure, physical activity) without manual feature engineering, which is crucial in cardiovascular risk stratification. Second, the trained MLP is lightweight, making it suitable for real–time deployment inside a mobile PHR application, as demonstrated in our study. Third, neural networks are scalable; with larger datasets (e.g., multi–centre EHRs), MLPs often continue to improve, whereas tree–based ensembles may plateau sooner. Fourth, the tuned MLP achieved a balanced trade–off between recall (0.873) and precision (0.683), which is desirable in screening settings where missing a true case (false negative) is more costly than a false alarm.
The conclusions of the current study are in agreement with Farzandpourian et al., 25 who established the design and usability of electronic personal health records for individuals with chronic heart failure in a developing environment. Our results support the argument that electronic health data can be a strong predictor of heart failure, particularly in well–established health systems with abundant data resources. Furthermore, research by Ben–Assuli et al. 26 shows that machine learning models improve predictive accuracy in cardiovascular patient assessment. This vindicates our hypothesis that predictive modeling can assist in the quicker and more accurate identification of heart failure cases and reinforces the central role of machine learning algorithms in predictive health software, especially for cardiovascular disease.
In addition, evidence by Yoo et al. 27 demonstrates that models utilising multimedia extraction in health ontologies can offer individualised data as a core technology for intelligent healthcare systems. This agrees with our research, which provides evidence for optimising our model with multimedia data combined with patients’ biological and lifestyle characteristics. Implementation of advanced data analysis techniques is key to formulating more intelligent healthcare systems and optimising the efficacy of digital health initiatives.
The predictive models identified in this study provide a sound foundation for developing preventive approaches to cardiovascular disease control. Qian et al. 28 suggested that incorporating predictive models into prevention programs enables early risk detection and effective intervention for at–risk groups. In addition to enhancing the effectiveness of prevention measures, predictive models help alleviate the burden of cardiovascular diseases.
Given the prevalence of risk factors for cardiovascular diseases in the electronic health records of our study population, and in line with our modelling results confirming the contribution of these factors to disease progression, the findings of this research provide a basis for developing more effective preventive and therapeutic strategies. Moreover, these results can inform future research on predicting and managing heart failure.
According to our results, predictive models of heart failure can improve patients’ quality of life and reduce the economic burden of cardiovascular disease. Singhania et al. (2024) showed that accurate predictive models during chronic disease treatment lead to decreased treatment costs and enhanced quality of life. 29 These results emphasise the potential of our predictive models to play a positive role in heart health management at the community level.
Considering that patients’ PHRs indicated the prevalence of cardiovascular risk factors in the majority of the studied population, and that our modelling results confirmed the presence and impact of these factors on the disease, the findings of this study can serve as a foundation for more effective preventive and therapeutic interventions in cardiology. Moreover, these results can be used as a basis for future research on the prediction and control of heart failure.
Conclusion
In this study, we developed and compared several machine learning models for heart failure prediction using PHR data from a cohort in Ahvaz, Iran. The tuned multilayer perceptron (MLP) achieved a ROC–AUC of 0.830, improving upon the untuned version (0.795) and showing comparable performance to logistic regression (0.824) and SVM (0.842). However, the Random Forest model outperformed all others (ROC–AUC 0.959), highlighting the advantage of tree–based ensembles on structured, tabular medical data. Despite the MLP's moderate performance, its lightweight architecture, ability to model non–linear interactions, and scalability make it suitable for real–time mobile PHR applications.
The importance of machine learning in cardiovascular risk stratification lies in its capacity to uncover complex, non–linear relationships between risk factors without manual feature engineering, to integrate diverse data sources (clinical, behavioural, and environmental), and to deliver individualized, real–time predictions that can empower both patients and clinicians. Our findings demonstrate that even with a moderate–sized dataset, machine learning models – particularly Random Forest – can achieve high predictive accuracy, supporting their potential for scalable, data–driven preventive cardiology.
Given the study's limitations (single–center design, moderate sample size, lack of external validation), these findings should be considered preliminary. Future research should focus on enhancing predictive model performance through the integration of environmental and social determinants of health, which emerging evidence indicates can significantly improve accuracy and inform targeted interventions. Expanding data sources to include socioeconomic status, air quality, urban planning, and access to healthcare may strengthen model validity and equity in risk prediction. Long–term evaluation of model impact on clinical outcomes, healthcare utilization, and patient acceptance is essential to ensure sustained utility and alignment with real–world needs.
Footnotes
Acknowledgments
The authors gratefully acknowledge the Deputyship for Research and Technology at Ahvaz Jundishapur University of Medical Sciences for their support in conducting this study. (Research ID: U-02091). We also extend our sincere thanks to the staff and patients at the heart clinics in Ahvaz, Iran, for their invaluable cooperation and participation. During the preparation of this work, the author (B.S.) used LLM‑based tools to improve the language, grammar, and readability of the manuscript. After using these tools, the author carefully reviewed and edited the content as needed and takes full responsibility for the final version of the publication.
Ethical approval
This study was approved by the Ethics Committee of Ahvaz Jundishapur University of Medical Sciences (IR.AJUMS.REC.1402.161).
Consent to participate
Data were collected in a blinded manner, with no identifiable personal information linked to the clinical records. The informed consent form was reviewed and approved by the Institutional Ethics Committee, ensuring compliance with ethical standards for research involving human subjects.
This study adhered to the principles of the Declaration of Helsinki, and all procedures were conducted with full respect for patient privacy and confidentiality.
Consent to publication
The authors confirm that the study was conducted in accordance with ethical standards, with approval from the Institutional Ethics Committee, and that all data used in this publication were anonymized to ensure participant confidentiality.
Credit statement (Author contribution)
Funding
This study was supported by Ahvaz Jundishapur University of Medical Sciences (Grant No: U-02091).
Declaration of conflicting interests
The authors declared no potential conflicts of interest with respect to the research, authorship, and/or publication of this article.
Data availability statement
The data supporting this study are available from Behzad Sobhani upon reasonable request, subject to ethical approvals.