






Abstract
Abstract
Background
In recent years, for patients with arterial stenosis up to 75% and poor medical control, stent implantation has become the mainstream choice.
Objective
The purpose of this work is to study the effects of stent implantation on hemodynamics in the stenotic artery considering microcirculation.
Methods
A stent implantation model with microcirculation is constructed. Expansion simulations are carried out for the grid stent and the link stent respectively to analyze the changes in hemodynamic parameters and the mechanical responses of the plaque and the stent.
Results
Compared with the stent implantation study without microcirculation, the results show that the pressure gradient decreases, and the probability of high time averaged wall shear stress near the stent wires reduces after the grid stent is implanted and expanded. The link stent generates time averaged wall shear stress close to the normal physiological range, and no regions with high oscillatory shear index and high relative residence time are found near the stent wire upstream of the stent.
Conclusions
The link stent can not only better improve the hemodynamic environment, but also reduce the risk of intimal hyperplasia and atherosclerosis. These findings reflect the importance of microcirculation in the regulation of hemodynamics after different stent implantations, providing a new perspective for optimizing stent design.
Introduction
Arterial stenosis is a common vascular disease that usually refers to the narrowing of blood vessels due to plaque in the arterial walls. Computational hemodynamics serves as crucial method for the diagnosis of cardiovascular diseases. 1 In recent years, numerical simulations on arterial stenosis have received increasing attention. Deplano et al. 2 constructed stenosis models and conducted experiments and numerical simulations on pulsating flows of different shapes, determining the temporal evolution of wall shear stress (WSS) downstream of the stenosis. Li et al. 3 employed the fluid-structure interaction (FSI) method to study the flow fields and stress fields of different degrees of stenosis under physiological conditions. They found that the higher the degree of stenosis, the higher the movement limit of the stenosed area. Pandey et al.4–6 analyzed the comparative hemodynamic investigation of blood flow in different blocked models and found that high-low wall shear stress and wall pressure gradient can be strongly linked to atherosclerosis plaque existence.
With the medical advancement, there are numerous methods for treating arterial stenosis. Stent implantation is an effective treatment approach, in which a stent is implanted at the stenosed site to dilate the blood vessel and restore blood flow. The changes in the mechanical properties after stent implantation have become a current hotspot. Eshghi et al. 7 employed finite element method (FEM) to model stents, balloons, blood vessels, and plaques, and obtained results such as the stress distribution, outer diameter change, and bending of the stents. Lee et al. 8 investigated the influence of the presence of fluid on the mechanical behavior of coronary stents during expansion, and found that metal stents were less affected during expansion, while polymer stents were significantly affected. Yu et al. 9 compared the impacts of cylindrical stents and conical stents on coronary artery hemodynamics and found that conical stents could better simulate the blood flow state under physiological conditions after implantation. Additionally, Chiastra et al. 10 emphasized the importance of fluid-structure interaction modeling in coronary stents and discovered that the rigid-wall assumption was reasonable for the analysis of parameters near the vessel wall, which provided a theoretical basis for simplifying the hemodynamic simulation of coronary stents. Yadav and Singh11–13 investigated the hemodynamic phenomenon during the electroosmotic flow of non-Newtonian hybrid nanofluid through an artery featuring irregular and overlapping stenosis and the hemodynamic characteristics through a diseased time-variant arterial structure with different geometrical configurations. Furthermore, they developed a model for ternary hybrid nanofluid flow through a stenosed bifurcated artery. 14
However, there are some deficiencies in current researches, as the influence of microcirculation in the cardiovascular system is not considered. The microcirculation system is an important part of the human circulatory system. The microcirculation system functions to transport oxygen, nutrients and metabolic products. Meanwhile, it is also involved in important physiological functions such as regulating body temperature and maintaining internal environment stability. 15 The microcirculation plays a regulatory role in the hemodynamics of arterial blood vessels.16,17 The purpose of this study is to incorporate microcirculation into the hemodynamic research of arterial stenosis treatment, and more accurately simulate the changes in hemodynamics after stent implantation.
Governing equations
Equations for arterial wall and plaque
In this paper, the arterial wall and plaque are set as incompressible and isotropic hyperelastic materials.
18
The 5-parameter Mooney-Rivlin model is adopted to describe their hyperelastic properties.
19

Where, W represents the strain energy function. C10, C01, C20, C11 and C02 refer to the material parameters, which are obtained by fitting experimental data.
20
The hyperelastic material parameters are shown in Table 1. Meanwhile, the density of the arterial wall and plaque is set as
Hyperelastic material parameters.

The blood flow is assumed to be an incompressible non-Newtonian viscous fluid.
22
The governing equations adopt the Navier-Stokes equations for incompressible viscous fluids.
17

The continuity equation is the following.

Where, u refers to the velocity of the fluid 
Where
The microcirculation system is composed of numerous tiny blood vessels with a complex structure and dense distribution, which is highly similar to the characteristics of porous media. Therefore, using porous media to simulate microcirculation can better reflect the microscopic pathways and spatial distribution characteristics of blood flow in the microcirculation. In this study, the area downstream of the stenosis is regarded as the porous-medium region to simulate the organizational structure of microvessels. The governing equations for blood flow in the porous-medium region are as follows.
25


Where, the porosity 
Where d is the diameter of the capillary, and its diameter is generally in a rang from
Regarding the stent material, due to the good elastoplastic properties and cost-effectiveness of structural steel, the stent is set as an isotropic elastoplastic structural steel. The elastic modulus is set to 210 GPa, the Poisson's ratio to 0.3, the yield stress to 280 MPa, and the stent density to 7850 kg/m3. 28
The basic equations of elastoplastic mechanics for stent expansion can be divided into three major categories. First, there are equations that describe the internal force equilibrium of the stent, and the influence of the inertial term is usually neglected.

Where
Secondly, it also includes the equation that describes the strain-displacement relationship.

The third category refers to the elastoplastic constitutive equations. During the stent expansion process, the total strain is divided into elastic and plastic parts. In the elastic stage, it conforms to Hooke's law.

When the elastic deformation exceeds the yield strength, irreversible plastic deformation occurs. The yield criterion is used to determine the limit stress criterion when the material yields. For isotropic metallic materials, the Von Mises criterion is generally adopted.

Where, the yield stress
The simulation of stent implantation and expansion also includes geometric nonlinearity and contact nonlinearity. For the contact of solid surfaces based on nonlinearity, the penalty function method is a commonly used nonlinear algorithm, which is based on the penalty function equation.

Where
The arterial wall is set to be impermeable and non-slip. The equations satisfied at the FSI interface are as follows.



Where, u and U represent the fluid velocity and the solid boundary velocity respectively, 
Where
When simulating the fluid interaction at the interface between the arterial region and the microcirculation system, it is necessary to ensure mass conservation and momentum conservation. Mass conservation requires that the mass of the fluid flowing in and out remains balanced at the interface. Moreover, at the interface, the volume flow rates of the inflow and outflow must be equal.

Where,
For momentum conservation, the velocity continuity of the fluid at the interface and the balance of stress need to be considered. Velocity continuity means that there is no jump in the fluid velocity at the interface.

At the interface, both the normal stress and the tangential stress remain in equilibrium. They are expressed as follows.


Stent implantation model
In this study, two types of vascular stents with different shapes are designed, including a grid stent and a link stent. The grid stent is composed of multiple diamond units arranged in order, and these units are mutually supported and connected through connection points. Its three dimensional structure is shown in Figure 1. Figure 2 shows the constructed interaction model, which includes the stent, plaque, blood vessel, and the microcirculation system is added. In the model, the thickness of the stent strut is 0.1 mm, the lengths of both the plaque region and the stent are 36 mm, the diameter of the artery is 10 mm, and the thickness of the arterial wall is 1 mm.
29
The regions at both ends of the artery are symmetrically distributed, and the stenosis is located 60 mm from the artery inlet. In this study, the degree of stenosis in the arterial region is defined by the following formula.

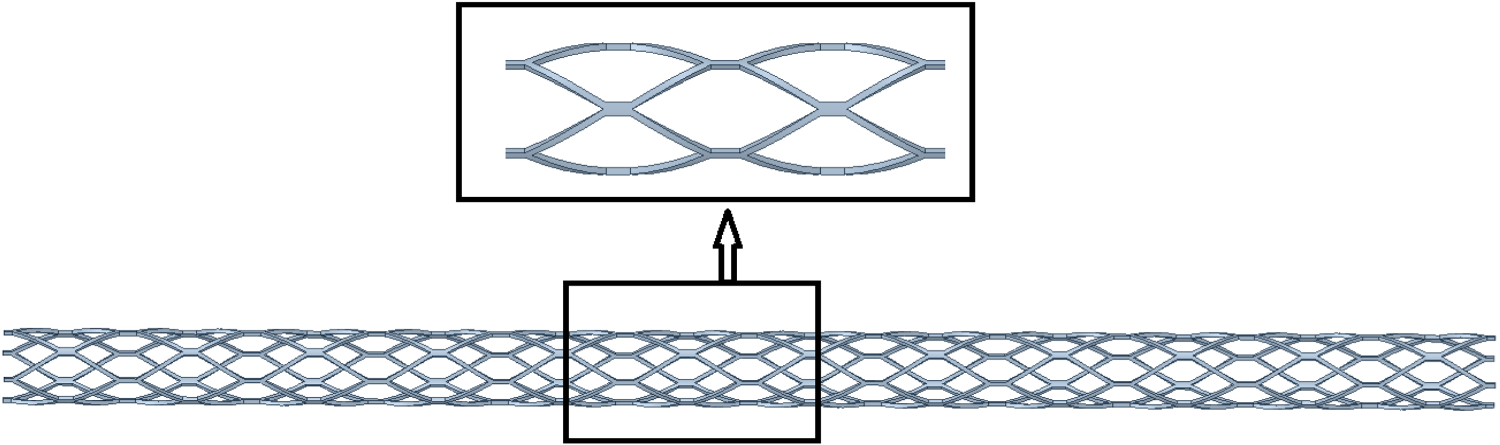
Grid stent.
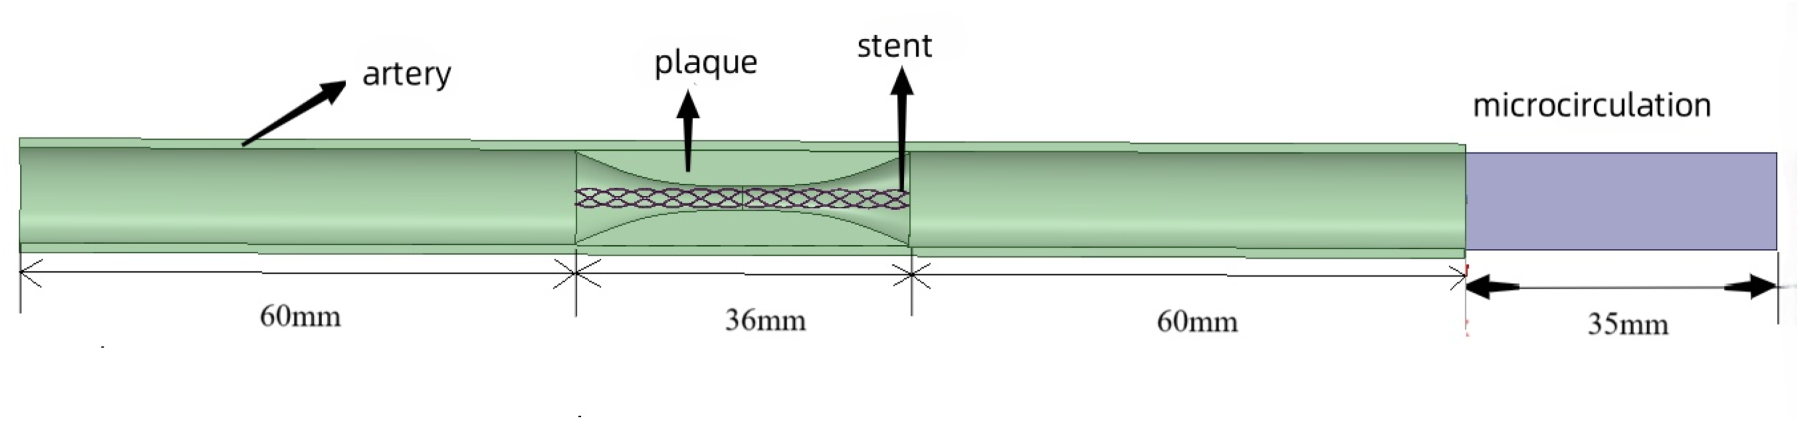
The grid stent-vessel model.
Where
Related research shows that changing the structure and shape of the stent can alter its flexibility. 30 In order to explore the impact of different stent designs on the hemodynamics of stent expansion, a link stent is also adopted in this study. As shown in Figure 3, each cell of the link stent presents an irregular rhombus shape, and the cells are connected to each other through stent hinges. The link stent adopts the same interaction structure as the grid stent, as shown in Figure 4.
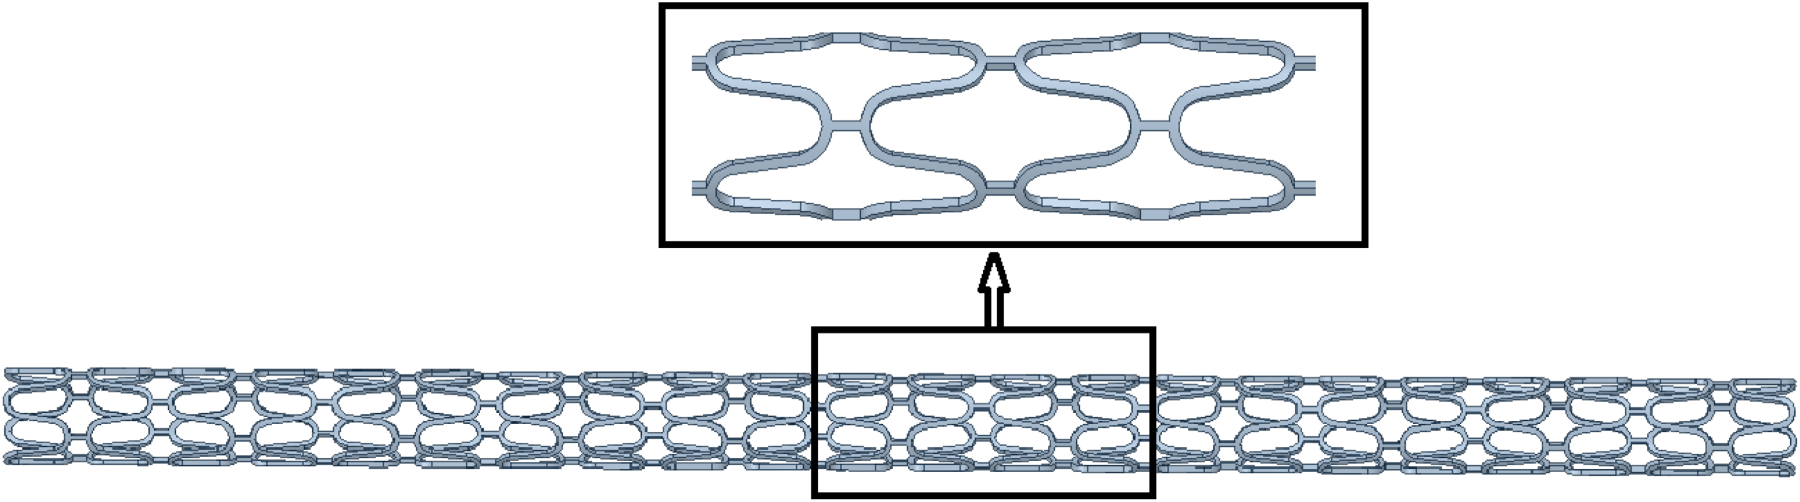
Link stent.
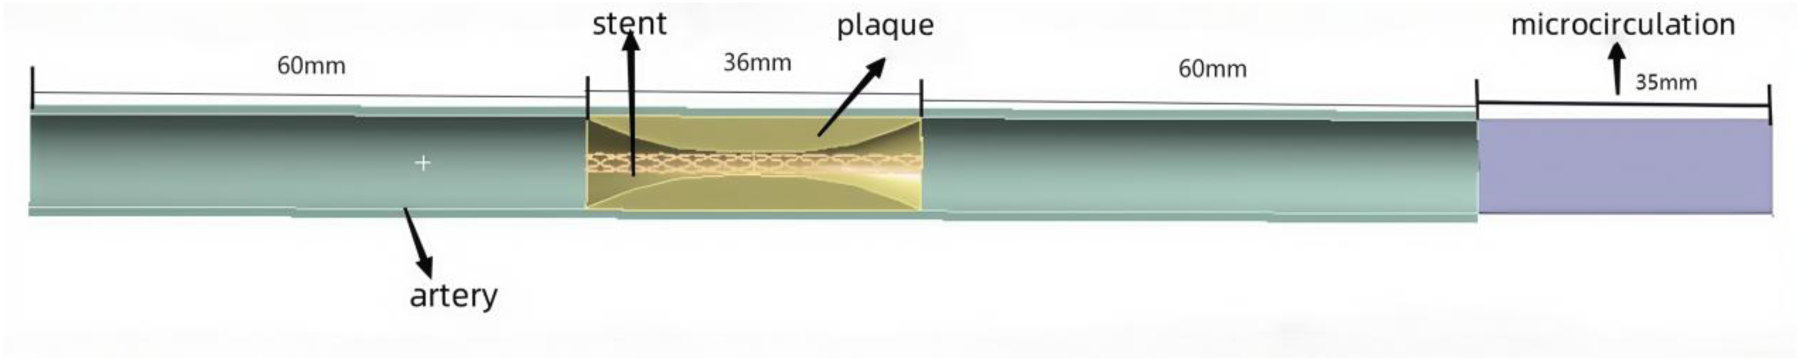
The link stent-vessel model.
As shown in Figure 5, FSI analysis is carried out in the artery-stent interaction model to simulate the hemodynamic changes and evaluate the hemodynamic characteristics after stent expansion. Six sections are selected for analysis. Sections S1, S2, S3, and S4 are located at both ends of the arterial region and the stent implantation site, while sections S5 and S6 are located at both ends of the microcirculation region. The selection of these six sections can reflect the hemodynamic characteristics of various typical regions after stent implantation.
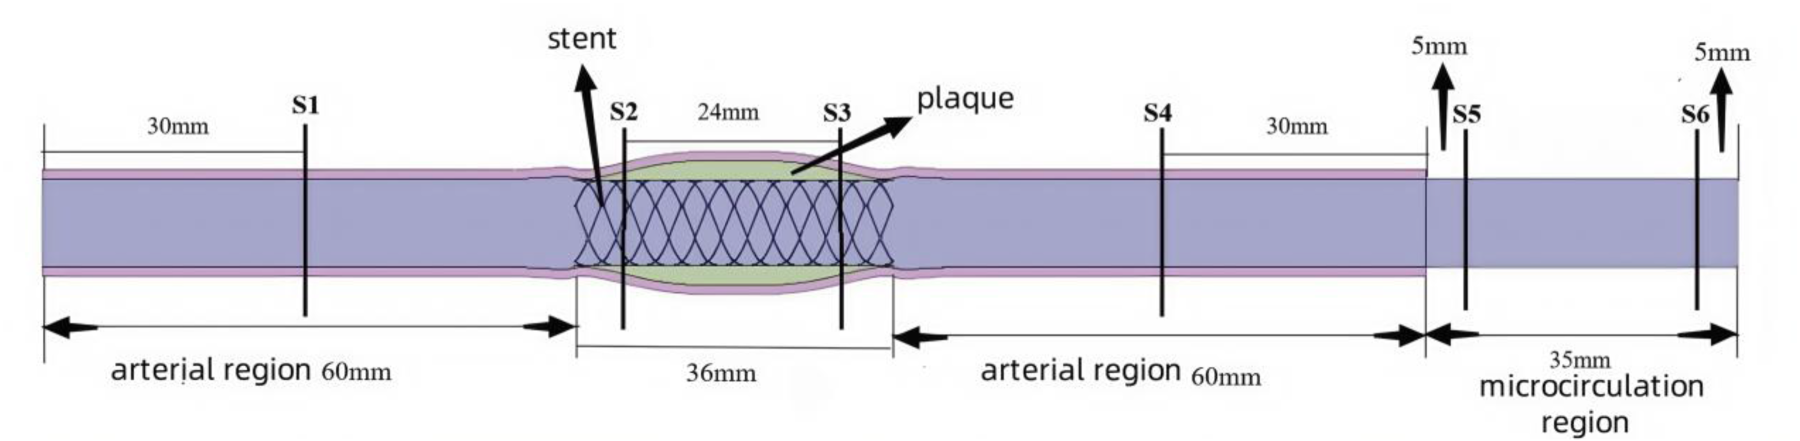
The artery-stent expansion model.
The stent and plaque parts are meshed with unstructured tetrahedral grids. For the relatively regular cylindrical arterial wall, structured hexahedral grids are used for meshing. The grid independent test is performed. The grid sizes of the stent, plaque and artery wall are respectively 0.1, 0.5 and 1 mm. We find that the size reduction and element increase do not significantly change the final results. The differences in velocity and wall stress from further increased elements are less than 4%. The final numbers of elements and nodes are shown in Table 2.
Numbers of elements and nodes in artery-stent models.

Numbers of elements and nodes in artery-stent models.
In this study, arterial blood flow is simulated through a time-varying inlet velocity distribution, as shown in Figure 6. 31 In the fluid and microcirculation regions, both the initial velocity and the static pressure are set to zero to minimize the impact of initial conditions on the simulation results. The microcirculation region is defined as the seepage outlet.
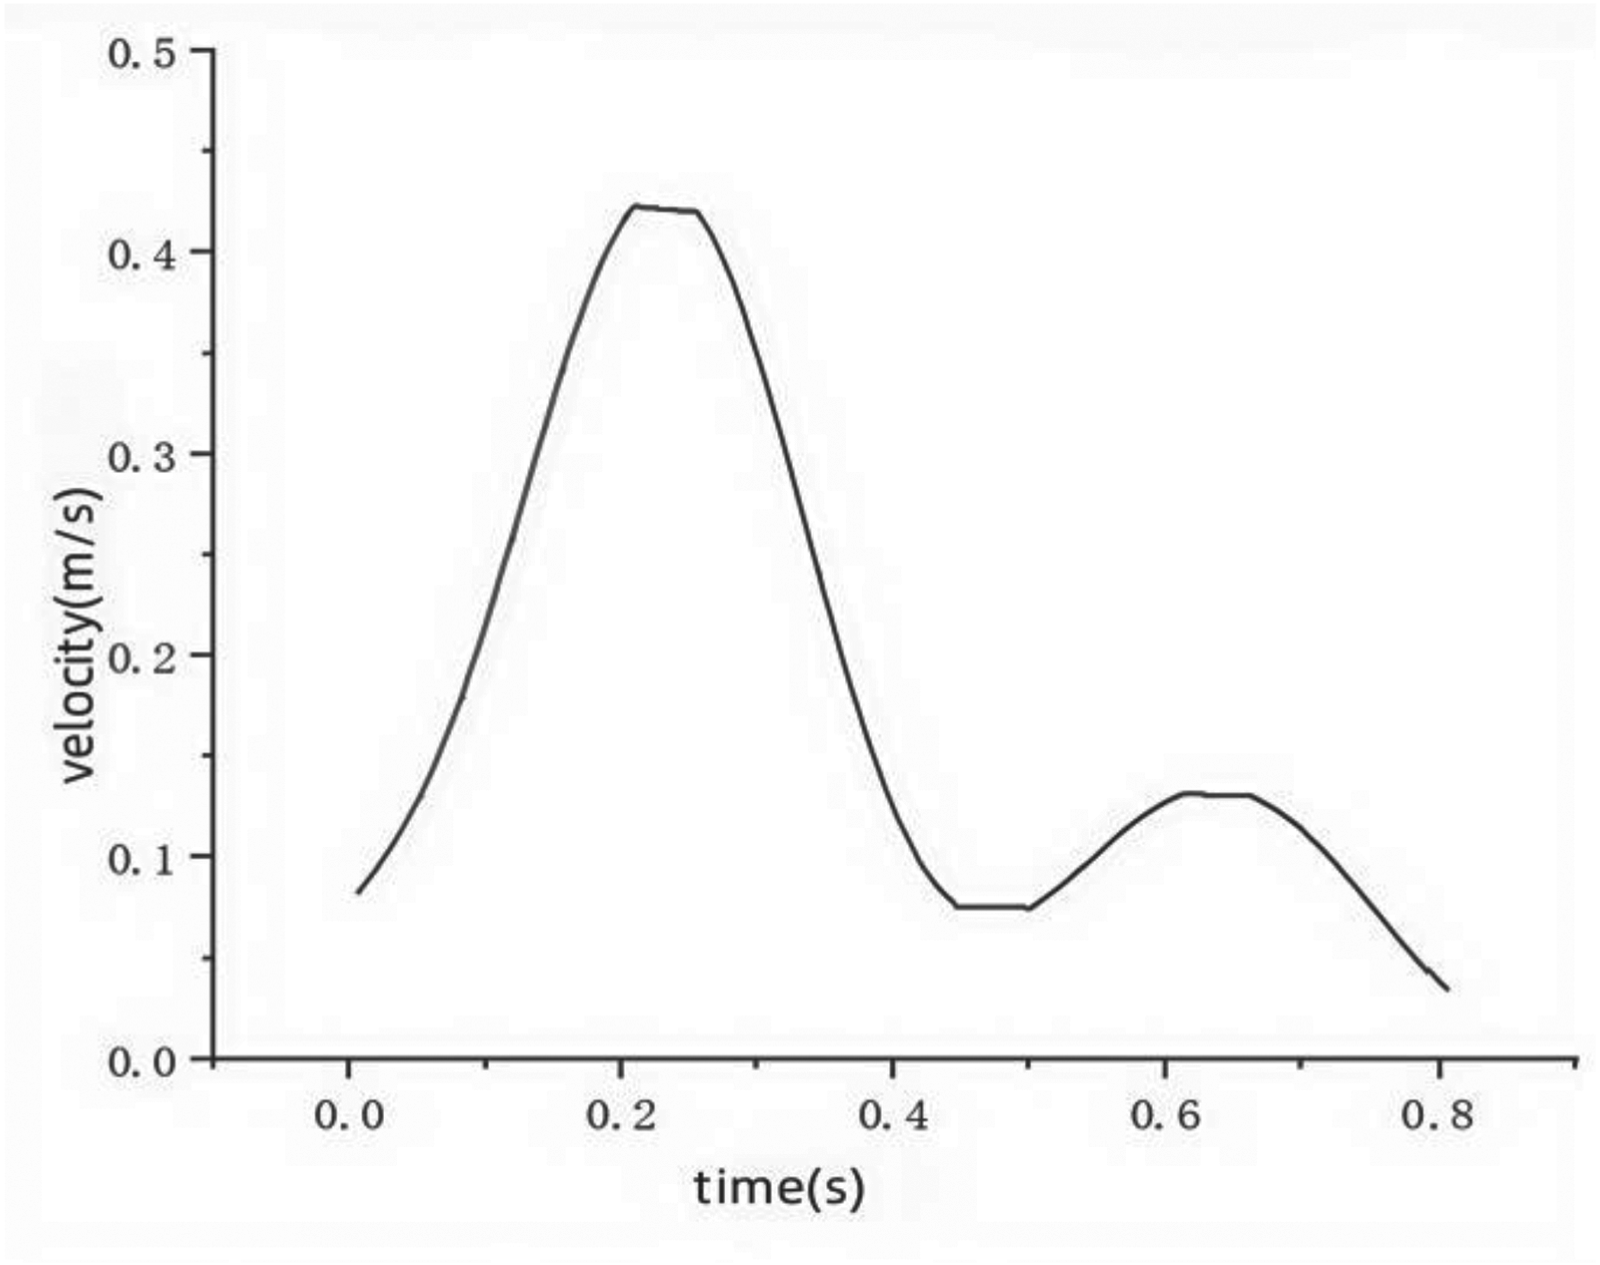
The inlet velocity.
The ANSYS transient structural module and CFX module are used to handle the solid domain and fluid domain respectively, and a two-way FSI model is adopted in the numerical simulation process. In the transient structural solution, fixed constraints are applied to both ends of the arterial wall to prevent its free movement. Degree of freedom constraints of axial displacement and circumferential rotation are applied to the characteristic nodes of the stent to ensure that the stent can maintain a fixed spatial position during the expansion process. A radial displacement constraint is applied to the stent to make the stent expand gradually in the radial direction, simulating the supporting effect of the stent implantation on the blood vessel wall.
When conducting the finite element analysis of stent expansion for the solid model, this study takes into account two key sets of contact relationships: the contact between the stent and the plaque, and the contact between the plaque and the inner wall of the blood vessel. For the contact between the stent and the plaque, the asymmetric penalty function algorithm is employed. This algorithm is suitable for simulating contact scenarios with friction. It can restrict the nodes on the contact surface from penetrating the target surface while allowing the nodes on the target surface to penetrate the contact surface, effectively handling the interaction at the contact interface. A relatively small penalty tolerance value (0.01 mm) can strictly limit the penetration of the contact surface, improving the accuracy of the simulation results. For the contact between the plaque and the inner wall of the blood vessel, a bonded contact is adopted. This type of contact ensures a tight connection between the plaque and the inner wall of the blood vessel, simulating the fixed state of the plaque on the blood vessel wall.
During the solution process, the time step is set to 0.005 s. To improve computational efficiency, a maximum of two iterations are carried out for each time step. Iteration stops when both the mass and velocity residuals are less than
Results
The stent deformation at different moments
Figure 7 shows the deformation of the grid stent during expansion. To observe the displacement changes of the stent during the expansion process, this study selects four key moments (0.25 s, 0.5 s, 0.75 s, and 1.0 s). As time progresses, the grid stent gradually expands and adapts to the shape of the blood vessel wall. The deformation in the middle of the plaque is relatively large, while that at both ends is relatively small. The deformation diagram at 1.0 s shows that the stent achieves a 3.5 mm radial symmetric expansion, increasing the diameter of the middle part of the stenosis from 2.5 mm to 9.5 mm. At this moment, the stent is basically stable, with a uniform deformation distribution, and there are no signs of excessive deformation or structural failure, indicating that the grid stent has good structural stability and adaptability.
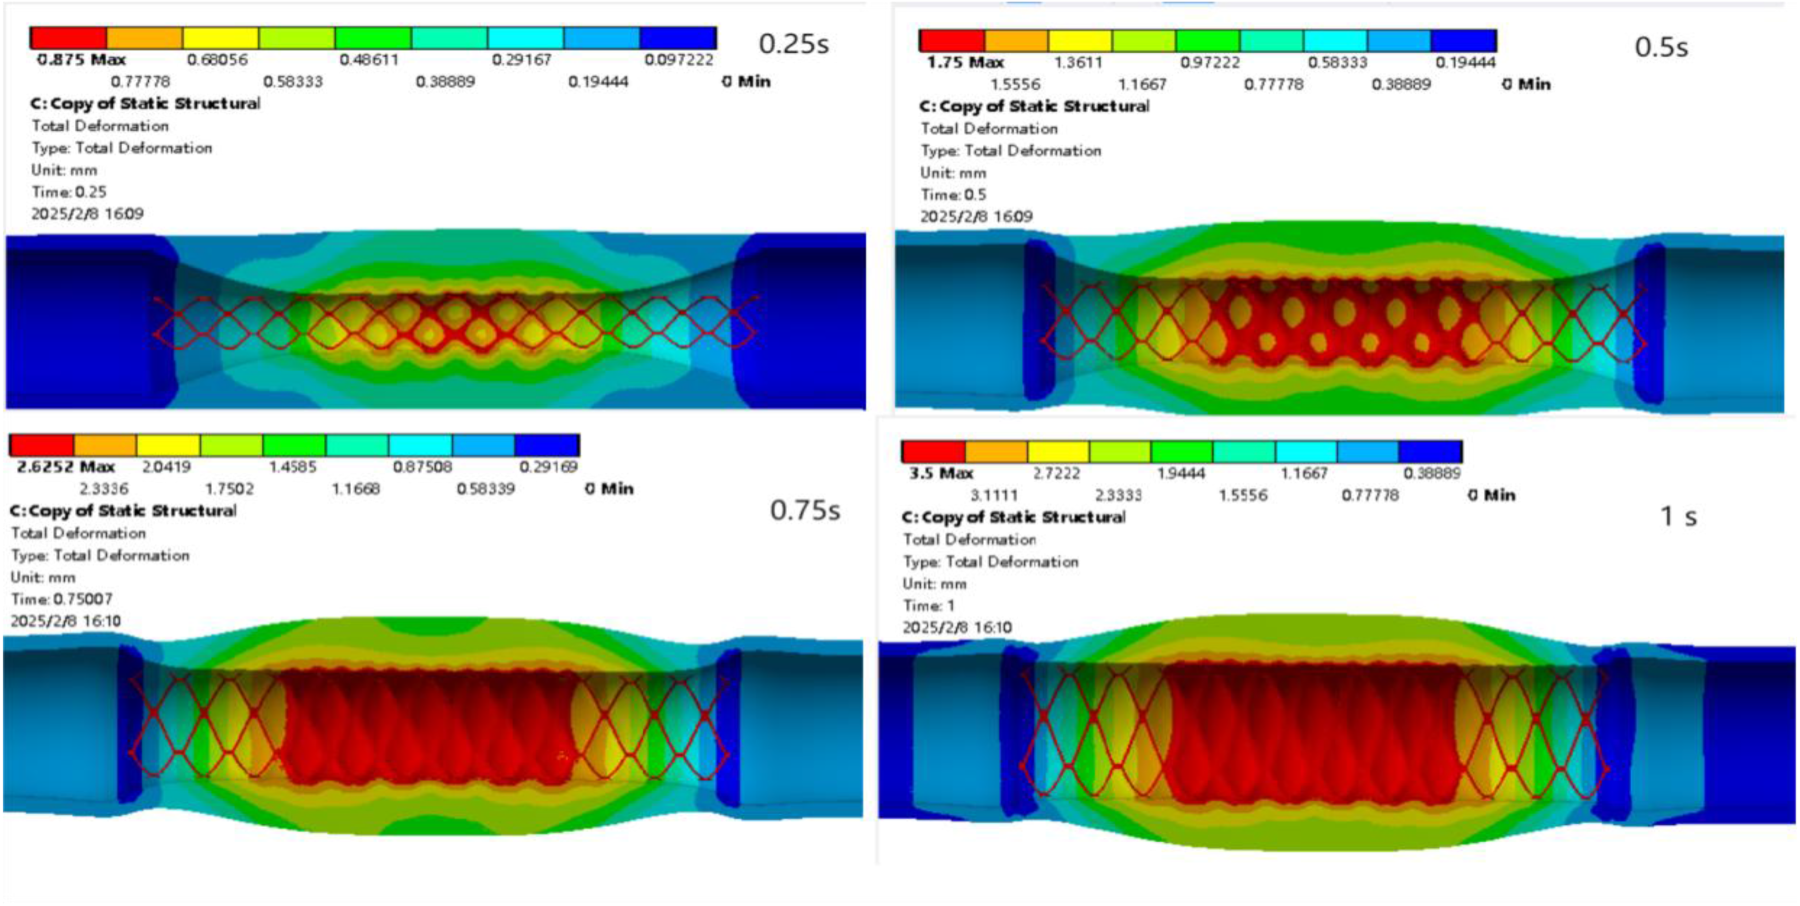
The grid stent deformation at different moments.
Figure 8 demonstrates the deformation of the link stent at different moments. As time goes by, the expansion amount of the stent gradually increases. At 1.0 s, the stent expansion is completed, and the plaque and blood vessel regions also experience displacement changes along with the expansion of the stent. It is found that the link stent can achieve a 3.6 mm radially symmetric displacement. That is, the original inner diameter of the stenosis is 2.5 mm, and now it is 9.7 mm, almost close to the inner diameter of a healthy artery. This stent can achieve 0.2 mm more expansion than the grid stent, relatively improving the expansion effect of the stent.
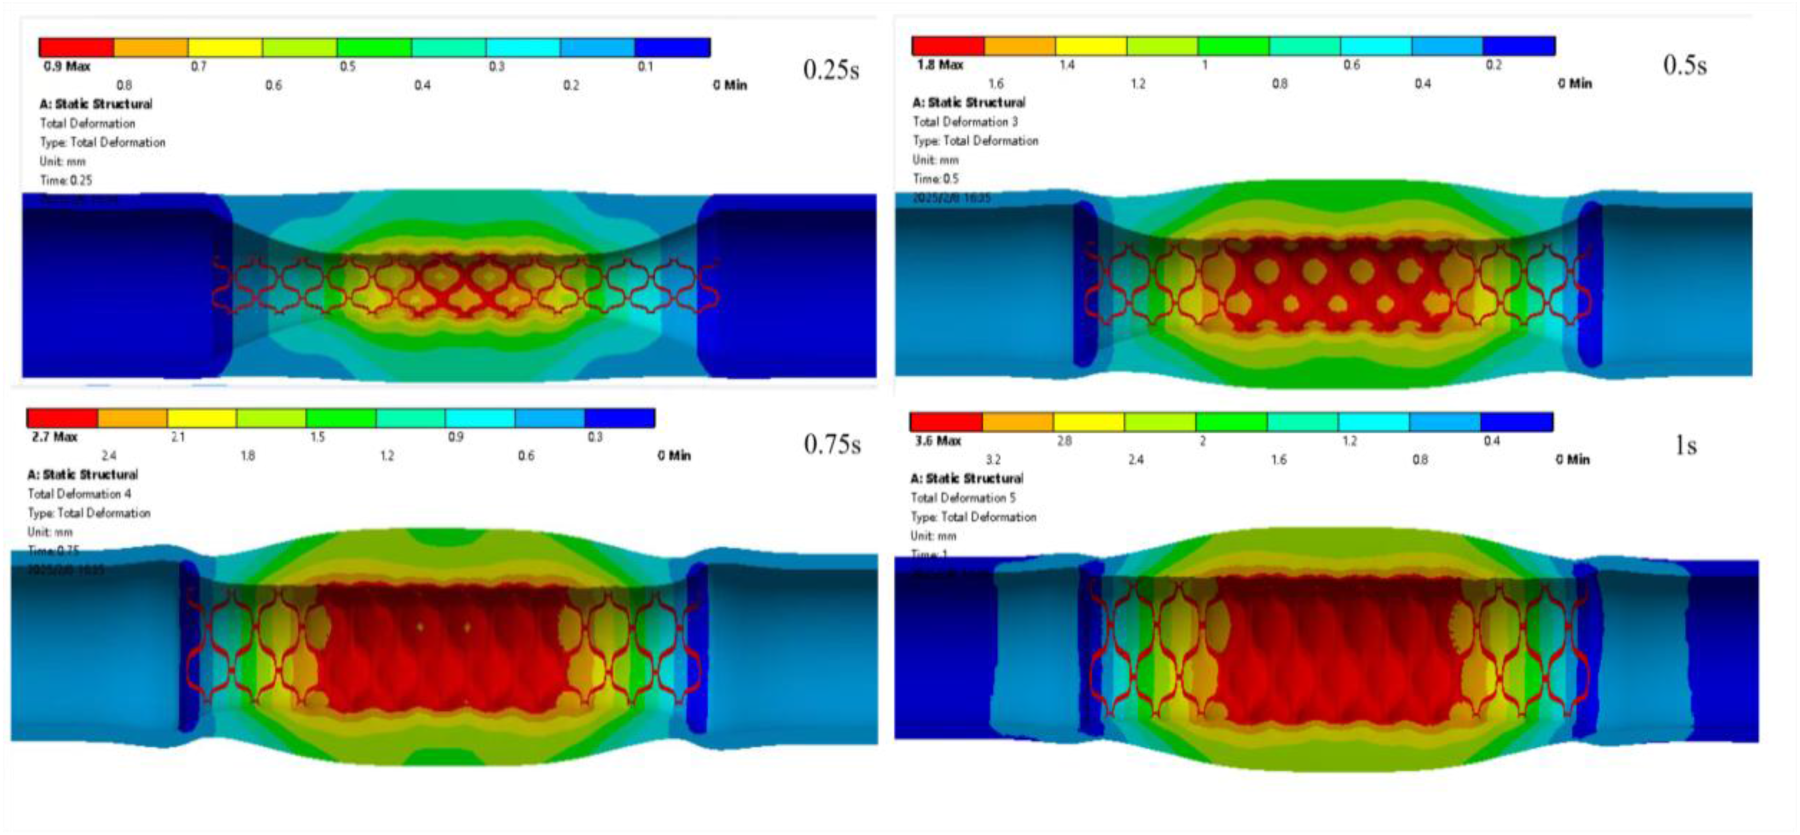
The link stent deformation at different moments.
Figure 9 shows the velocity streamline at the moment of the peak inlet velocity (0.205 s) after the stent expands. After stent implantation, blood flow in the blood vessel becomes unobstructed. In the upstream of the stent implantation, the flow velocity in the central area of the blood flow is relatively high, while the velocity is lower near the stent and the blood vessel wall. There may be a low velocity region at the edge of the stent. The stent expansion improves the blood flow condition in the stenotic part of the blood vessel. Although there may be local turbulence, the stent expansion is beneficial for maintaining the patency of the blood vessel.
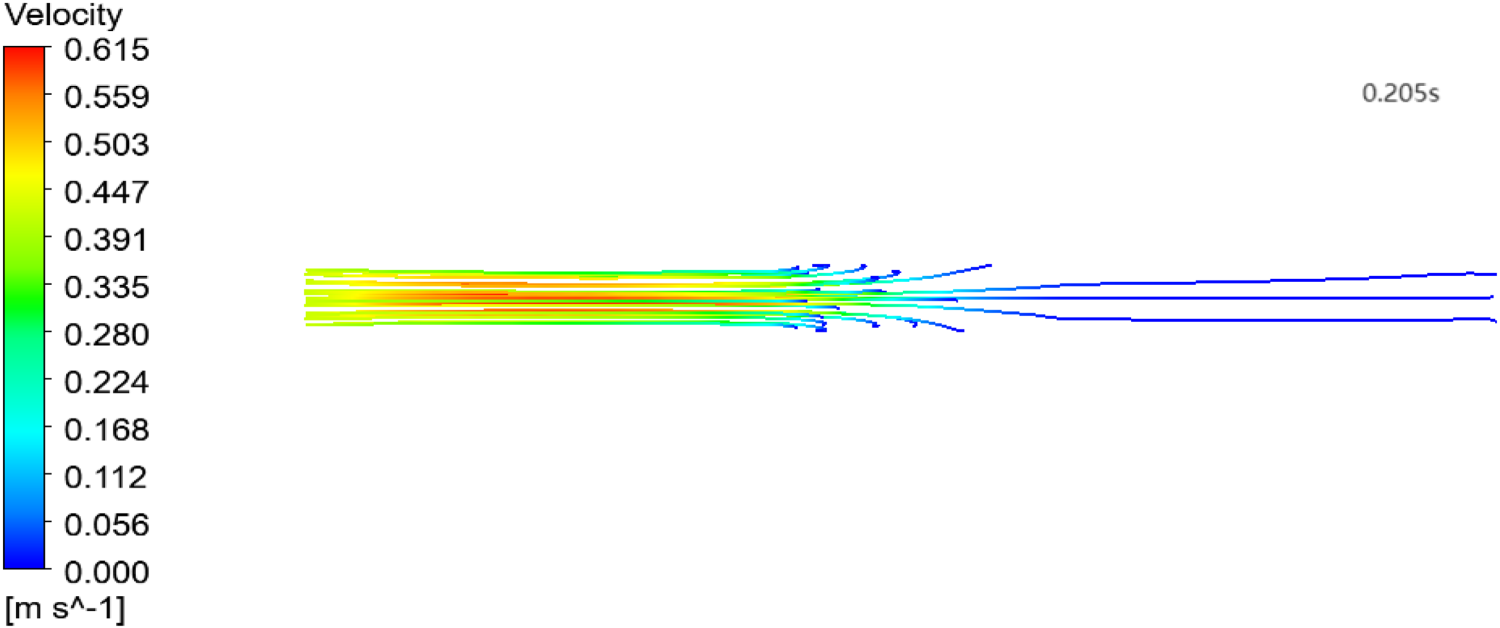
Velocity streamline after the grid stent expansion.
Figure 10 shows the velocity streamline of the link stent at the moment of the peak velocity during the systolic phase (0.205 s). The stent expansion increases the inner diameter of the blood vessel and reduces the blood flow resistance, enabling blood to pass through the expanded stenotic area. In the upstream area of the stent implantation, the streamlines are relatively dense, and the maximum velocity in the central area of the blood flow is 0.661 m/s. In the downstream area, the streamlines are more dispersed, and a decrease in flow velocity is observed at the edge of the downstream area of the stent.
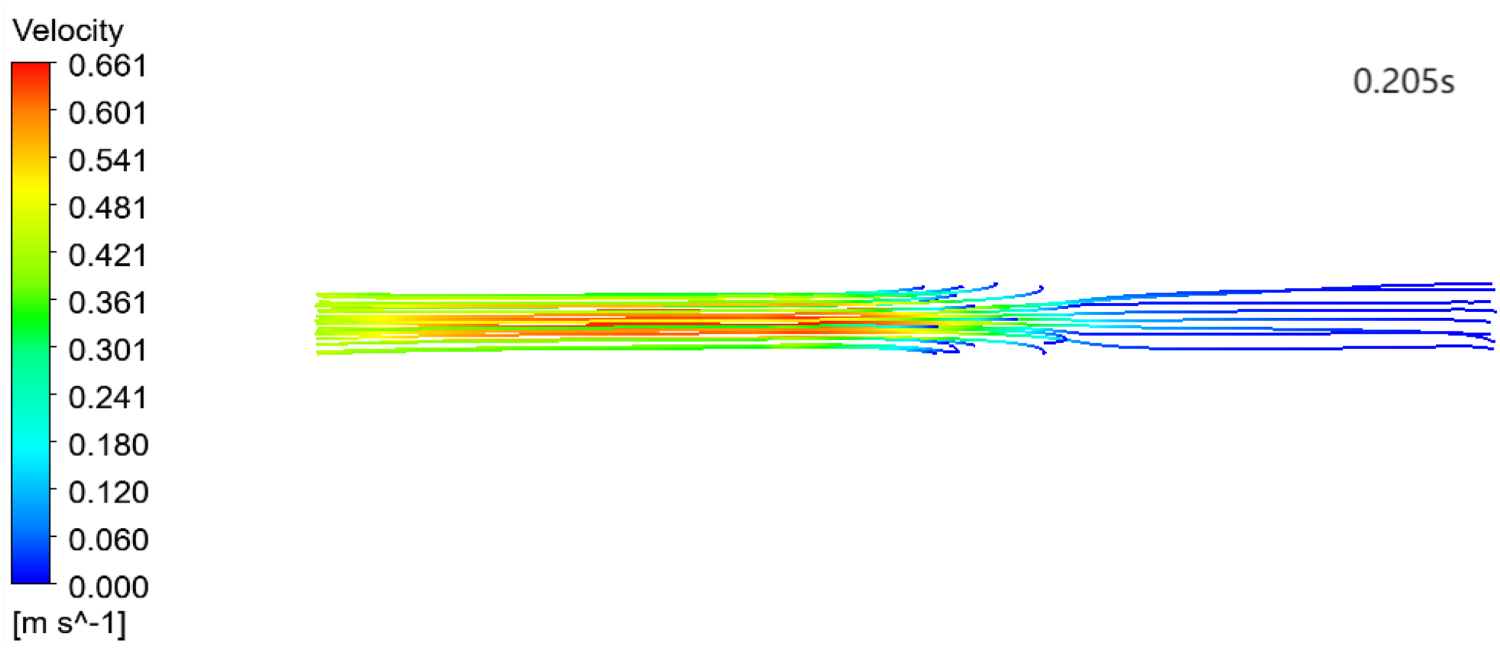
Velocity streamline after the link stent expansion.
Figure 11 shows the maximum velocity distributions at different arterial sections after the grid stent expansion. There are significant differences in the peak velocities at different sections. The peak velocity at section S1 near the inlet is the highest, approaching 0.65 m/s, while that at section S4 far from the inlet is the lowest, almost 0.02 m/s. Moreover, the velocity distributions at all sections are basically the same, with a peak value. This is related to the changes in blood flow during the systolic and diastolic phases of the heart within one cycle. At sections S1 and S2, the flow velocities increase significantly, indicating that the stent effectively improves the blood flow condition in the stenotic part of the blood vessel. Figure 12 shows the maximum velocity distributions at the microcirculation sections, the change in velocity is small in amplitude, and the magnitude is also small. Therefore, the microcirculation region can be approximately regarded as a steady flow.
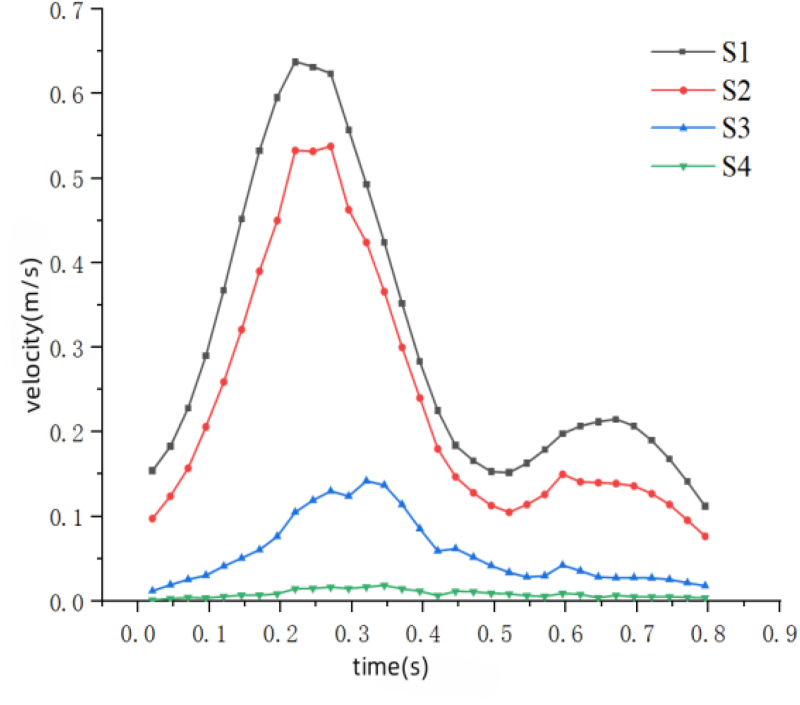
Maximum velocity at the arterial sections in the grid stent model.
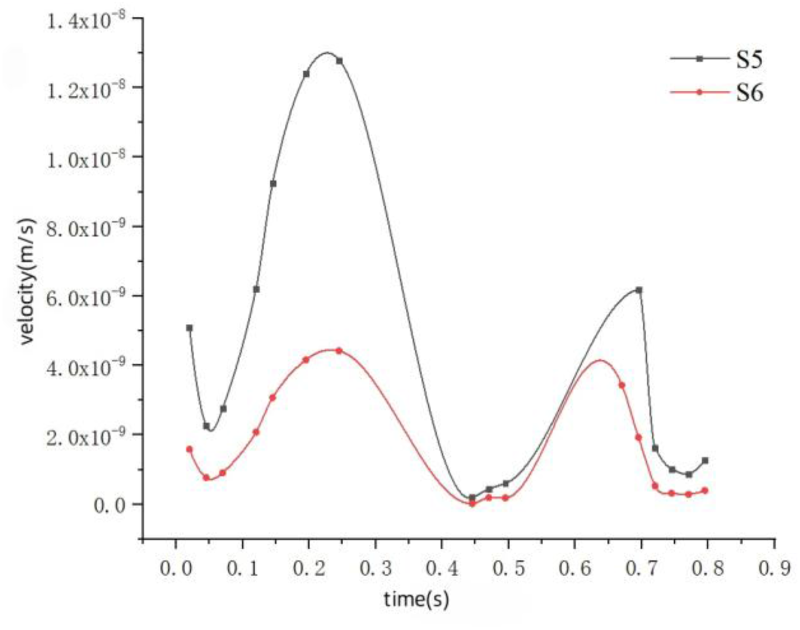
Maximum velocity at the microcirculation sections in the grid stent model.
Figure 13 shows the maximum velocity trends at different sections after the link stent expansion. The peak velocities at sections S1 and S2 are relatively high, and they have the same variation trend. The peak velocity at section S3 is slightly lower, but its variation trend is similar to those at sections S1 and S2. Moreover, the peak velocities at the three sections are all greater than the peak inlet velocity. The velocity at section S4 is significantly lower than those at other sections, and the variation range is relatively small. This reason may be that there is a relatively large loss of kinetic energy when blood flows through the stent area. The velocity change tends to be stable and the resistance at the distal end of the artery increases. Thus, there is insufficient blood supply. Figure 14 represents the maximum velocities at the sections in the microcirculation region. The blood vessels in this region are small, the velocity is low, and the blood flow is stable.
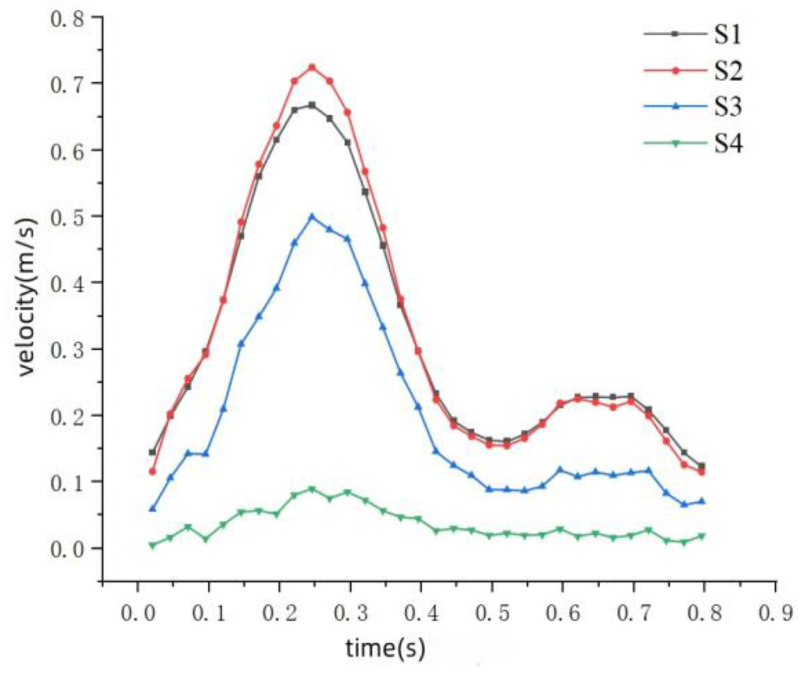
Maximum velocity at the arterial sections in the link stent model.
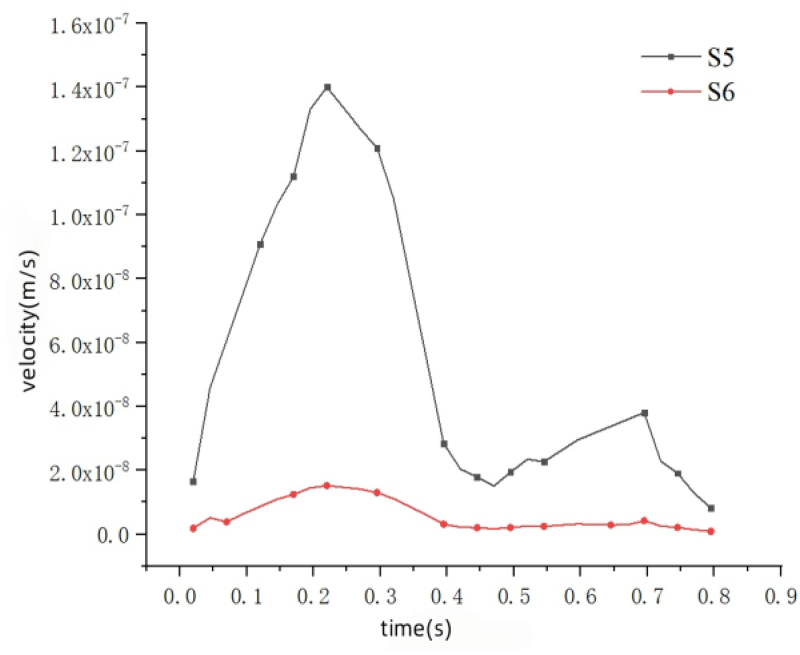
Maximum velocity at the microcirculation sections in the link stent model.
Figure 15 shows the maximum pressure variations at four sections in the arterial region after the grid stent expansion. The pressure variation range at section S4 is the largest. After the stent expands, the blood flows unobstructedly, increasing the pressure at section S4 downstream of the stent. The maximum pressure is close to 800 Pa, and the minimum pressure is close to −400 Pa. Sections S2 and S3 are located at both ends of the stenosis, and their pressure variation ranges are smaller than that at section S4. This indicates that after the stent implantation, the hemodynamic conditions are effectively improved, ensuring sufficient blood flow supply to the downstream artery. Figure 16 shows the maximum pressure distributions in the microcirculation region. The pressures at both ends of the microcirculation are almost the same, and the blood flow is relatively stable.
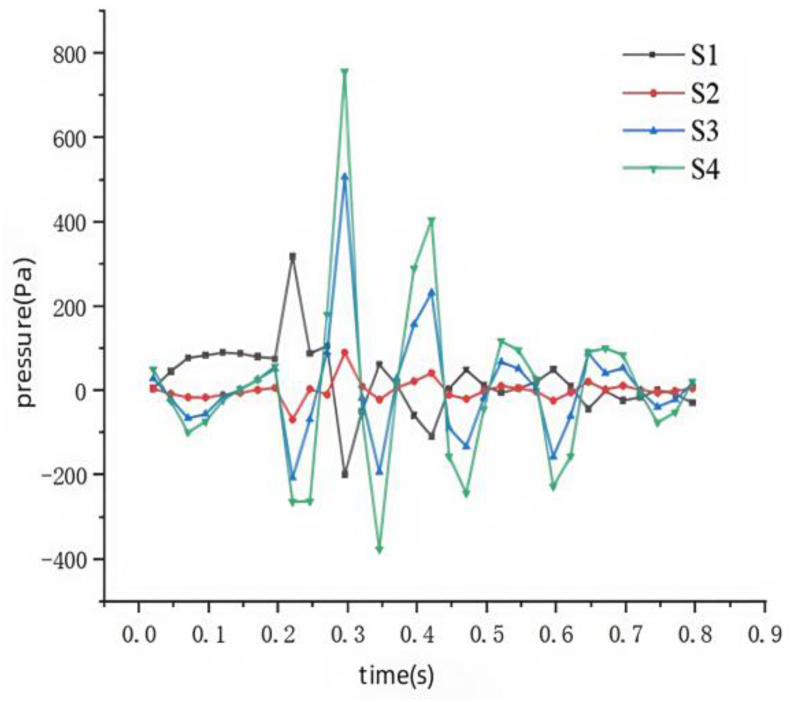
Maximum pressure at the arterial sections in the grid stent model.
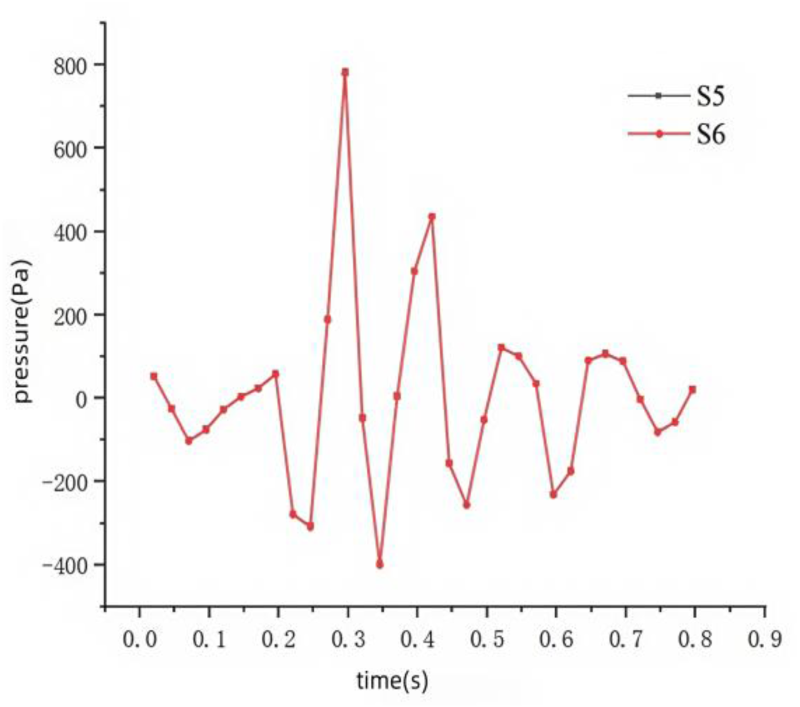
Maximum pressure at the microcirculation sections in the grid stent model.
Figure 17 shows the pressure variations at four different sections in the arterial region after the link stent expansion. The pressure fluctuation range at section S1 is the largest, probably because section S1 is located near the arterial inlet and is more directly affected by the heart's blood pumping. The pressure fluctuations at sections S2 and S3 are relatively small, indicating that the hemodynamic environment at these two positions is relatively stable. The stent effectively expands the stenotic area, reducing the pressure fluctuations caused by blood accumulation. As an artery at the distal end, section S4 has a pressure variation range second only to that at section S1. This reason may be that the pressure waves are transmitted along the blood vessel. Although section S4 is at the distal end, it is still affected by hemodynamic changes, resulting in a relatively large pressure fluctuation range. Figure 18 shows the maximum pressure distributions in the microcirculation region after the link stent expansion. The maximum pressures at both ends of the microcirculation are nearly the same.
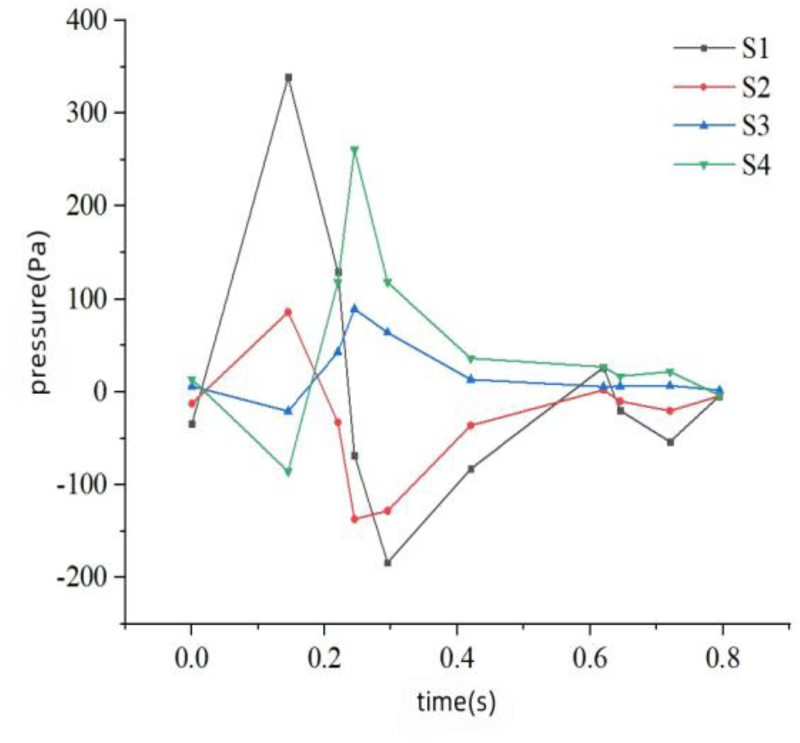
Maximum pressure at the arterial sections in the link stent model.
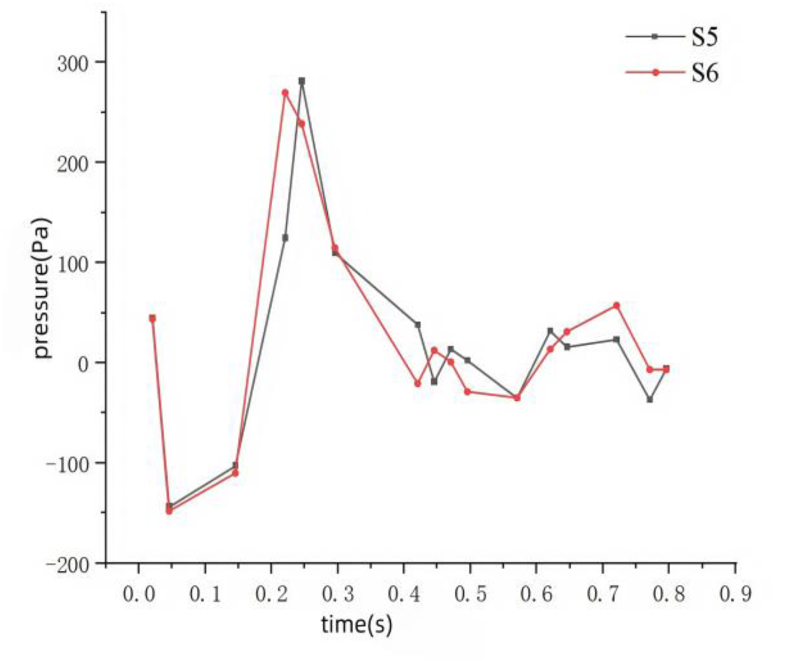
Maximum pressure at the microcirculation sections in the link stent model.
Figure 19 shows the maximum WSS variations at four different sections in the arterial region after the grid stent expansion. As the tangential force exerted by blood flow on the blood vessel wall, it is a key factor influencing the function of vascular endothelial cells. The maximum WSS value at section S1 is the highest, approaching 7.3 Pa, while that at section S4 is relatively low. The relatively high maximum WSS value at section S1 may be due to the fact that this section is located at the proximal end of the stent and is directly affected by stent expansion and blood flow acceleration. In contrast, the maximum WSS values at sections S3 and S4 are lower. These sections are located at the distal end of the stent or in the downstream section of the blood vessel, are less affected by stent expansion, and have a relatively stable blood flow, thus resulting in a lower WSS. Figure 20 is the maximum WSS distributions in the microcirculation. WSS is directly proportional to the blood flow velocity, and a low flow velocity leads to a significant reduction in WSS.
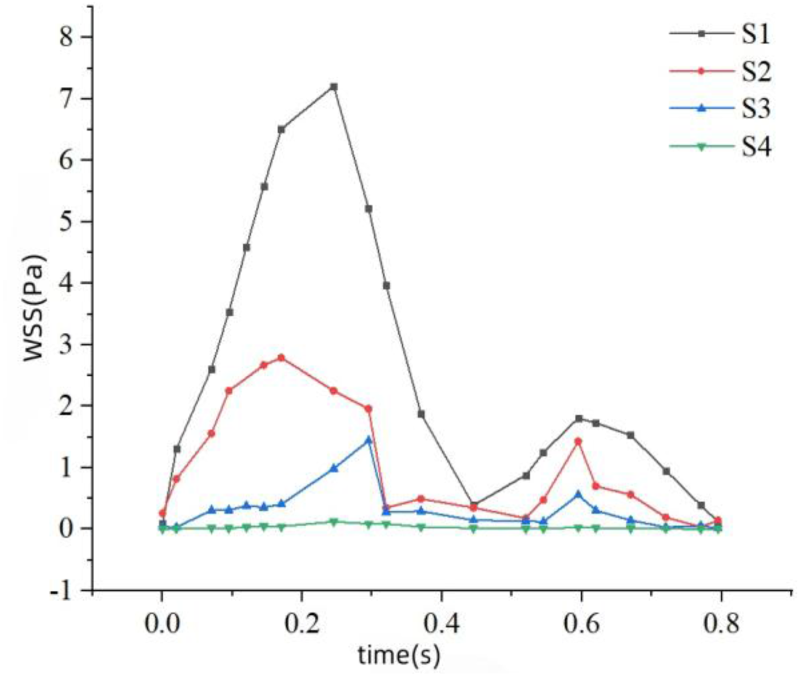
Maximum WSS at the arterial sections in the grid stent model.
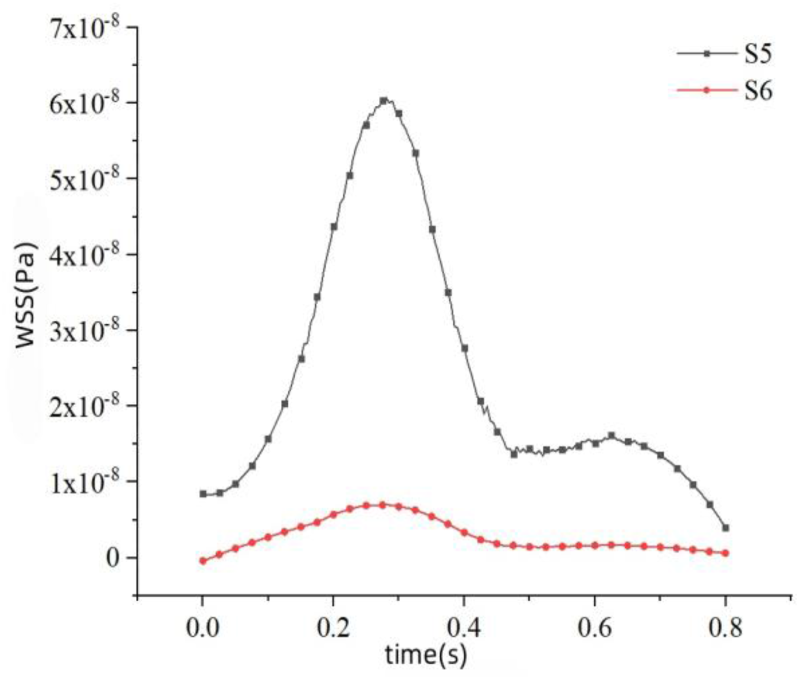
Maximum WSS at the microcirculation sections in the grid stent model.
The maximum WSS variations in the arterial region of the link stent model are shown in Figure 21. The maximum WSS (8.9 Pa) occurs in the area of section S2, which is upstream of the stent location, and it is higher than the maximum WSS (8 Pa) at section S1 in the arterial region. The stent implantation changes the distribution and velocity of blood flow within the blood vessel, thus affecting the variation of WSS. The stent expands the blood vessel wall, reducing the blood flow resistance, which increases the blood flow velocity in the stent area and enhances the WSS. Near the stent struts, the fluid may separate from the blood vessel wall and then reattach downstream of the stent. This separation and reattachment process generates fluctuations in WSS, causing the WSS at section S3 to be lower than that at section S2. Figure 22 shows the maximum WSS distributions at both ends of the microcirculation. The WSS in the microcirculation region is relatively low.
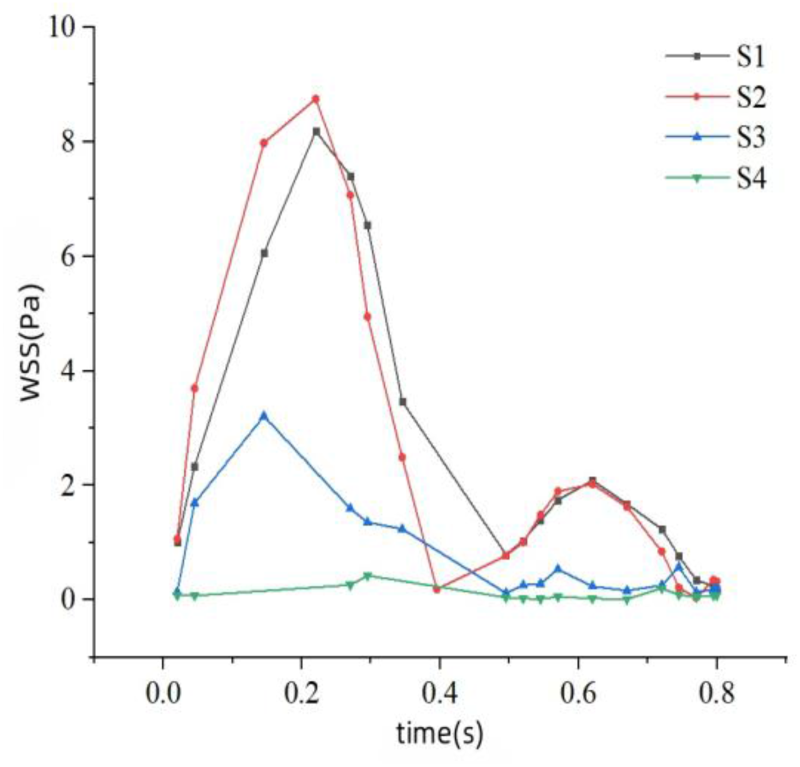
Maximum WSS at the arterial sections in the link stent model.
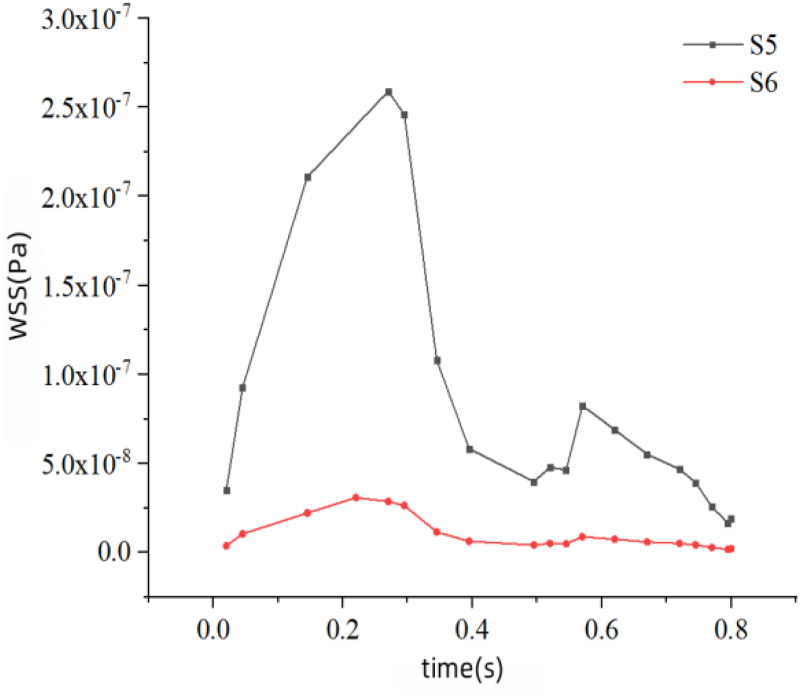
Maximum WSS at the microcirculation sections in the link stent model.
Time-averaged wall shear stress (TAWSS) refers to the average value of WSS over one cardiac cycle. It reflects the average tangential force exerted by blood flow on the blood vessel wall and is an important indicator for evaluating the health of vascular endothelial cells. Through computational fluid dynamics (CFD) simulation, the shear stress 
Figure 23 shows the TAWSS contour after the grid stent expansion. After the stent expands, in the arterial region upstream of the stent implantation location, the TAWSS value is close to 4 Pa, which is within the normal physiological range of the human body. However, in the arterial regions downstream of the stent implantation location and further downstream, the TAWSS values are relatively low, with the minimum being 0.5 Pa.
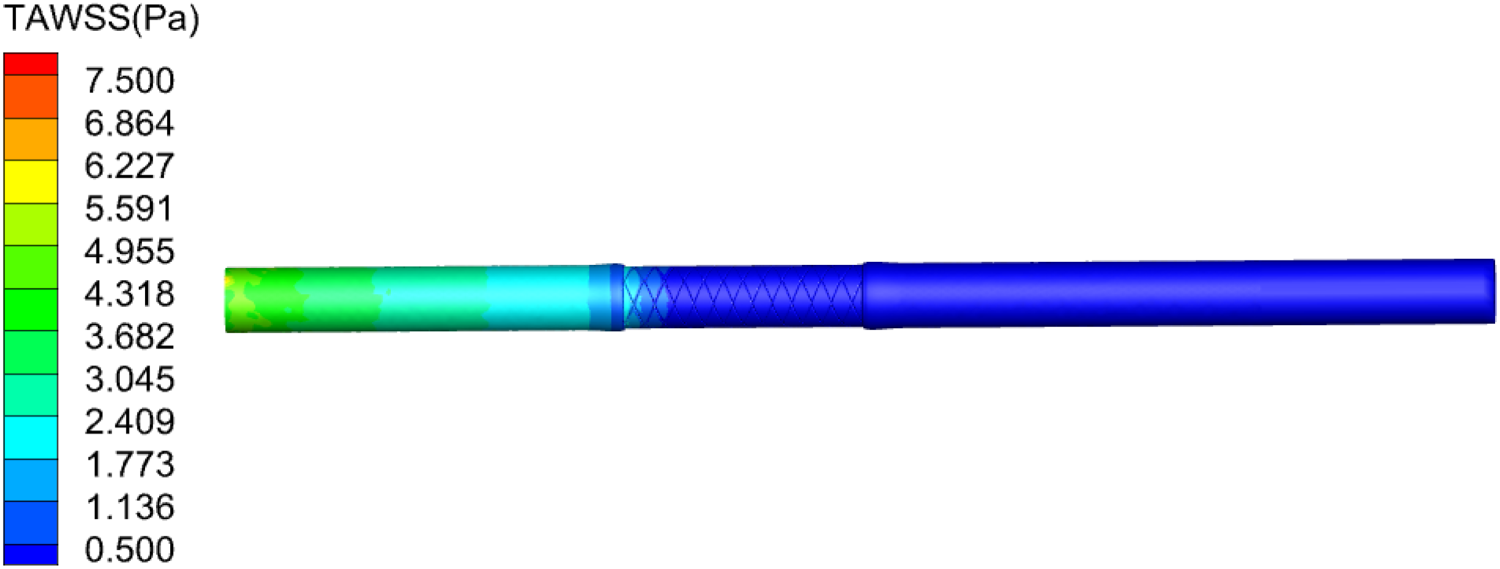
TAWSS contour after the grid stent expansion.
Figure 24 shows the TAWSS contour after the link stent expansion. The TAWSS value upstream of the stent is close to the normal physiological range of the human body. Starting from the central position of the stent, the TAWSS value decreases, approaching 1 Pa, which is still within the normal physiological range.
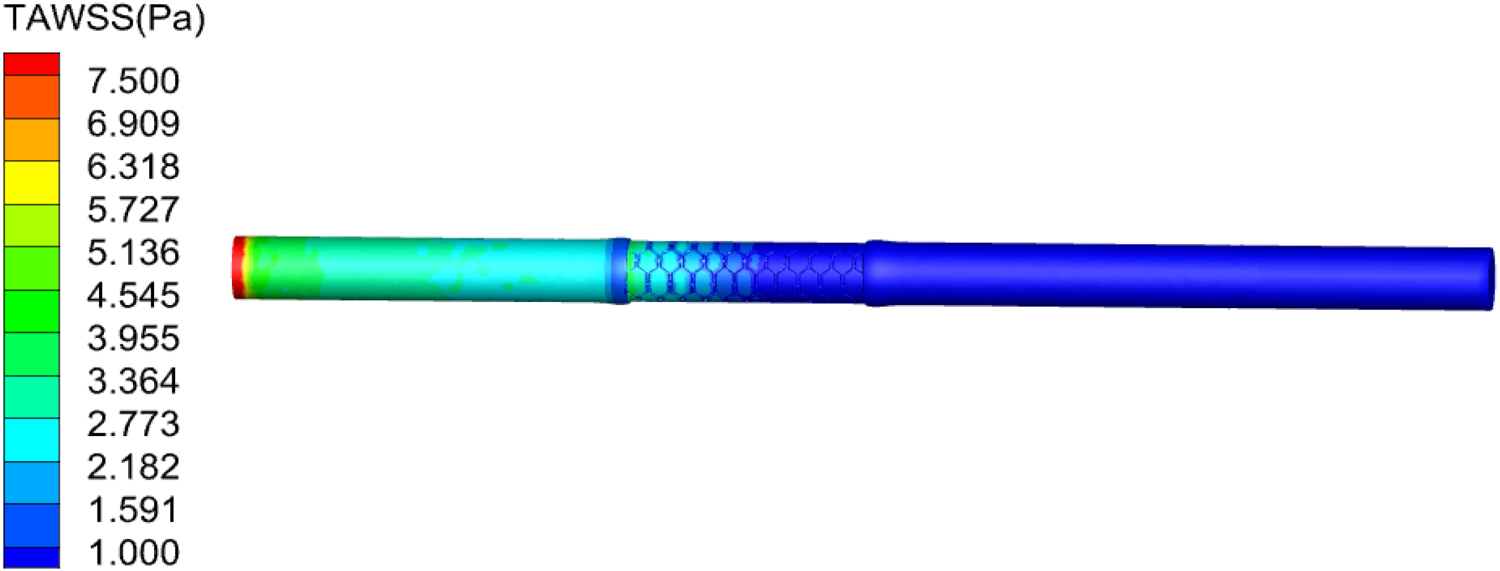
TAWSS contour after the link stent expansion.
As a dimensionless constant, the oscillatory shear index (OSI) is an indicator for measuring the change in the direction of blood flow shear force and reflects the stability of blood flow. Its value ranges from 0 to 0.5, where 0 represents a steady flow and 0.5 represents a highly oscillatory flow. The calculation formula is the following.
32

Figure 25 shows the OSI values after the grid stent expansion. After the stent implantation, significant changes occur in the hemodynamic state at the stent location and downstream. Especially in the stent mesh structure area, the OSI value in this area is relatively high, with a maximum value of 0.5, indicating a large change in the flow direction.
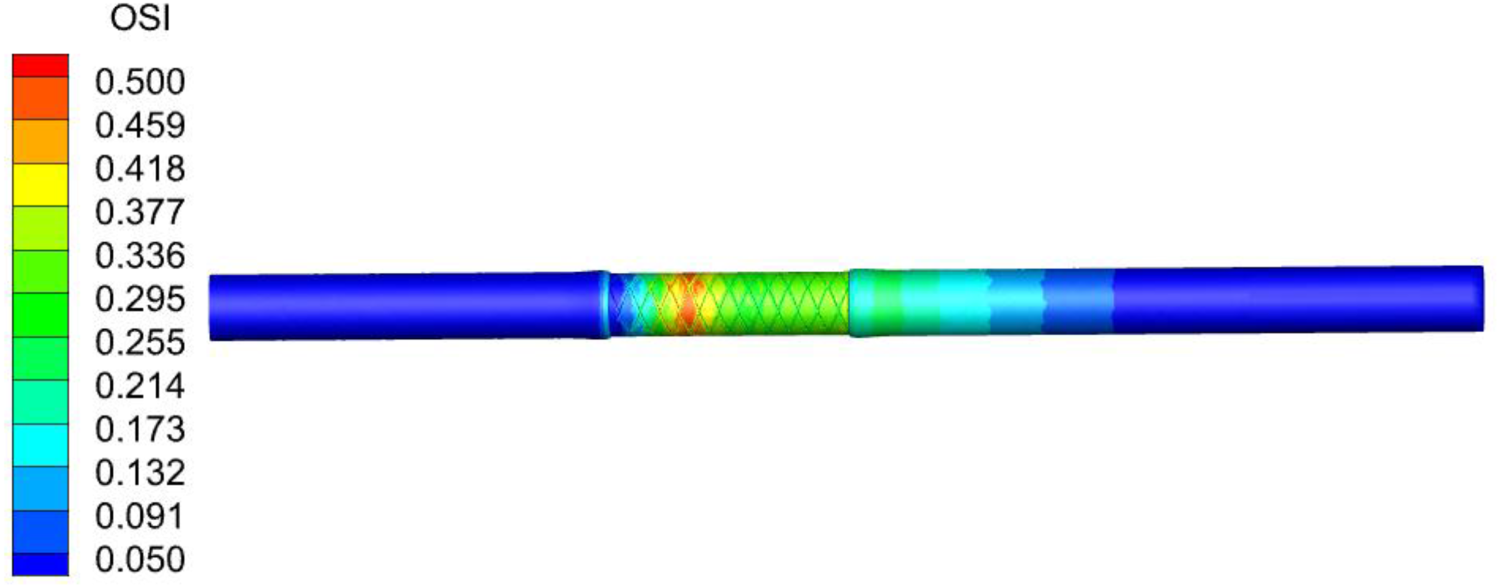
OSI contour after the grid stent expansion.
Figure 26 shows the OSI distribution after the link stent expansion. The OSI values in most areas are close to 0, indicating that the blood flow is stable after the stent implantation, demonstrating good hemodynamic characteristics. However, the OSI varies significantly in the downstream area of the stent, with values approaching 0.5. This reason may be that after the stent implantation, the blood in the downstream area needs to adapt to the presence of the stent and is affected by the geometric factors of the blood vessel and the stent. These factors lead to fluctuations in the direction of WSS, resulting in a relatively high OSI.
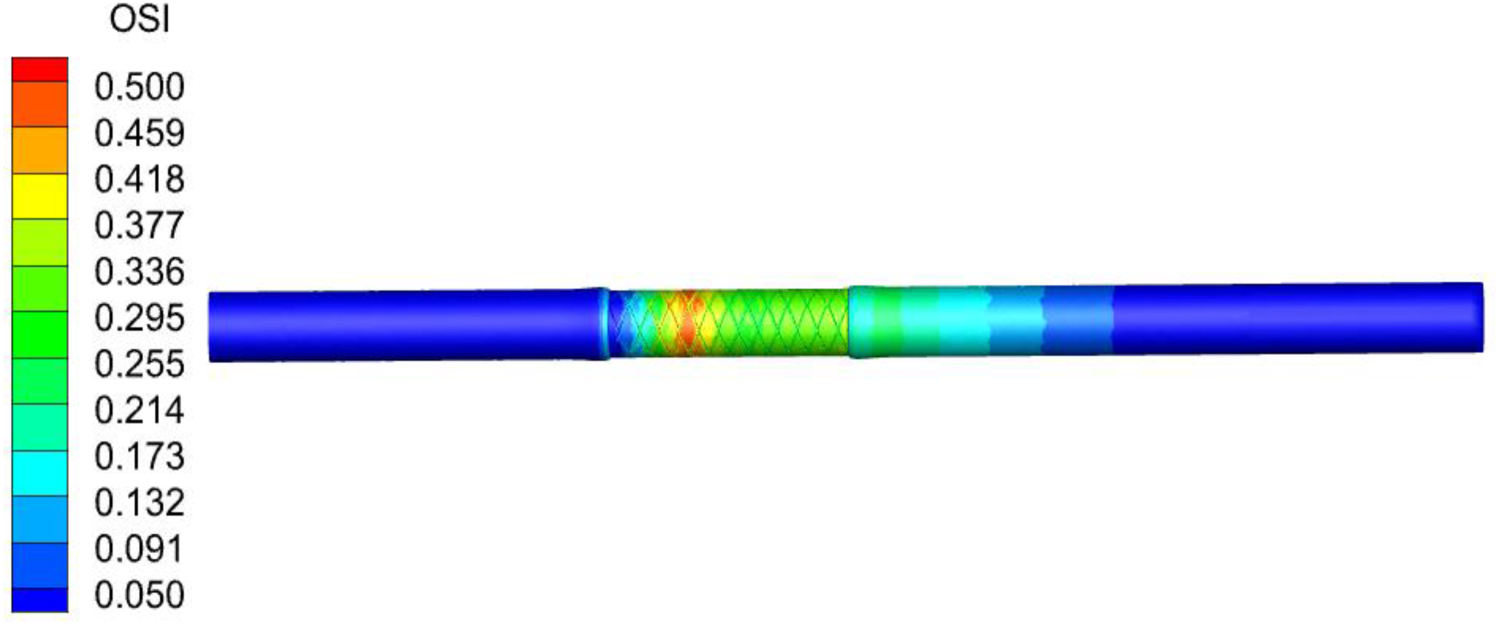
OSI contour after the link stent expansion.
Relative residence time (RRT) represents the residence time of blood near the blood vessel wall. It is a comprehensive manifestation of the TAWSS and the OSI. The calculation formula is the following.
32

Figure 27 shows the RRT distribution after the grid stent expansion. After the stent implantation, there are significant differences in the residence time of blood in different regions of the blood vessel wall. The RRT values near the stent are relatively high, indicating that the blood residence time in this area is longer. The areas with high RRT may be related to changes in the hemodynamic state, such as a decrease in flow velocity or blood flow separation. This may affect the distribution of WSS on the blood vessel wall, and further influence the function of vascular endothelial cells. In the microcirculation region, the blood vessel diameter is smaller, and the blood flow velocity slows down, thus increasing the blood residence time in this region.
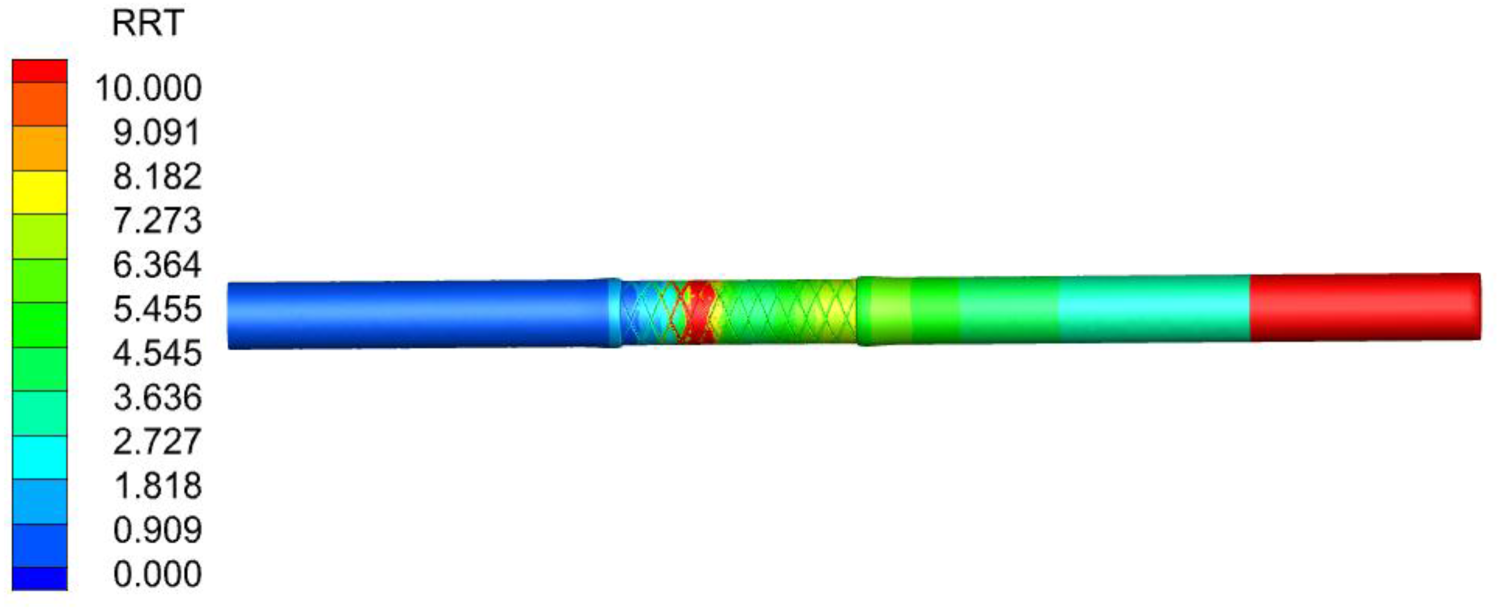
RRT contour after the grid stent expansion.
Figure 28 shows the RRT distribution after the link stent expansion. The RRT values downstream of the stent and in the downstream of the healthy artery increase significantly. This reason may be that the irregular blood flow at this location, causing particles to remain near the blood vessel wall for a longer time. In the microcirculation region, the blood vessels have a small diameter and slow flow, therefore, particles have a relatively long residence time in this area.
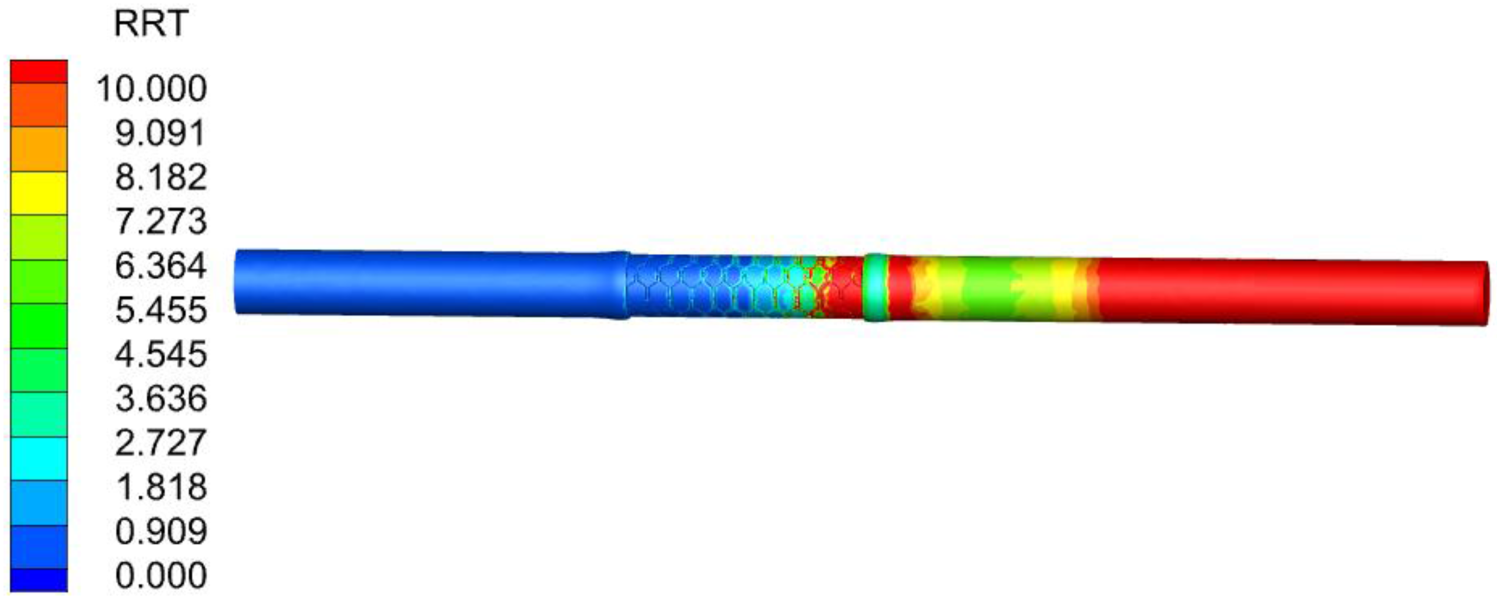
RRT contour after the link stent expansion.
Figure 29 shows the Von Mises stress distribution of the arterial wall and plaque at sections S2 and S3 where the grid stent is implanted at the peak velocity moment during systole. After the stent comes into contact with the blood vessel, it exerts pressure on the inner wall of the blood vessel. If the pressure is too high, it may lead to stress concentration in the blood vessel, thereby causing damage to the blood vessel. Under the stent expansion, both the plaque and the arterial region will undergo certain deformation, with the plaque deformation being more significant. The plaque stress is significantly higher than arterial stress, and the maximum stress at section S2 is much higher than that at section S3. There is a relatively large stress distribution gradient inside the plaque, which may be related to the direct contact between the plaque and the stent.
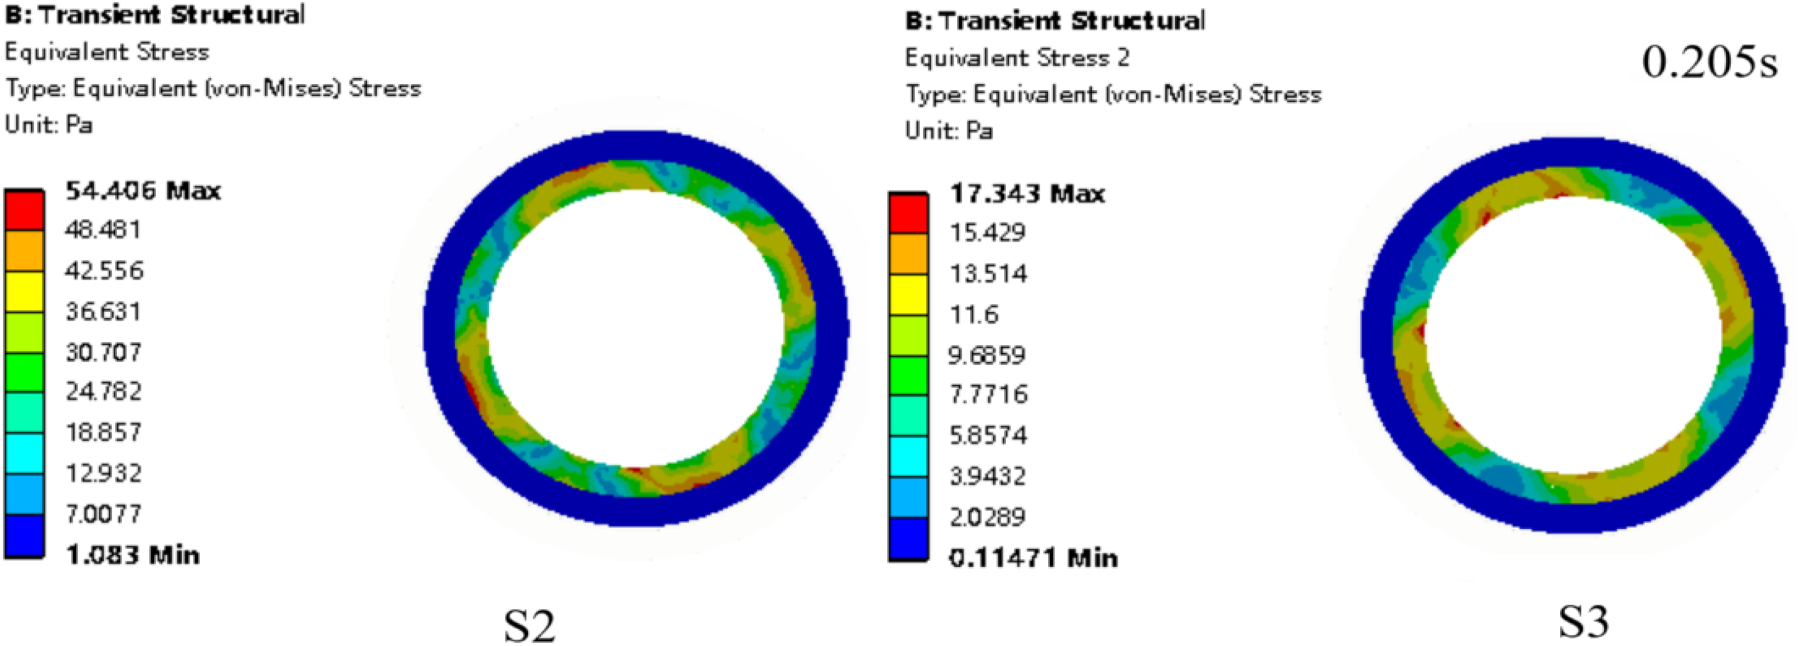
Von Mises stress contour of the arterial wall and plaque in the grid stent model.
Figure 30 shows the Von Mises stress distribution of the arterial wall and plaque in the link stent model at the peak moment (0.205 s) during systole. It can be observed that the stress distribution is symmetric, and the maximum stress values of the two sections are close. The maximum stress occurs at the contact area between the plaque and the inner side of the stent strut. In other parts in contact with the stent, the stress is relatively small. Moreover, in the areas of the blood vessel wall that do not have direct contact with the stent, the stress is almost zero. This indicates that the mechanical effect of the stent expansion process on the arterial wall is relatively mild, and the risk of damage to the arterial wall is low.
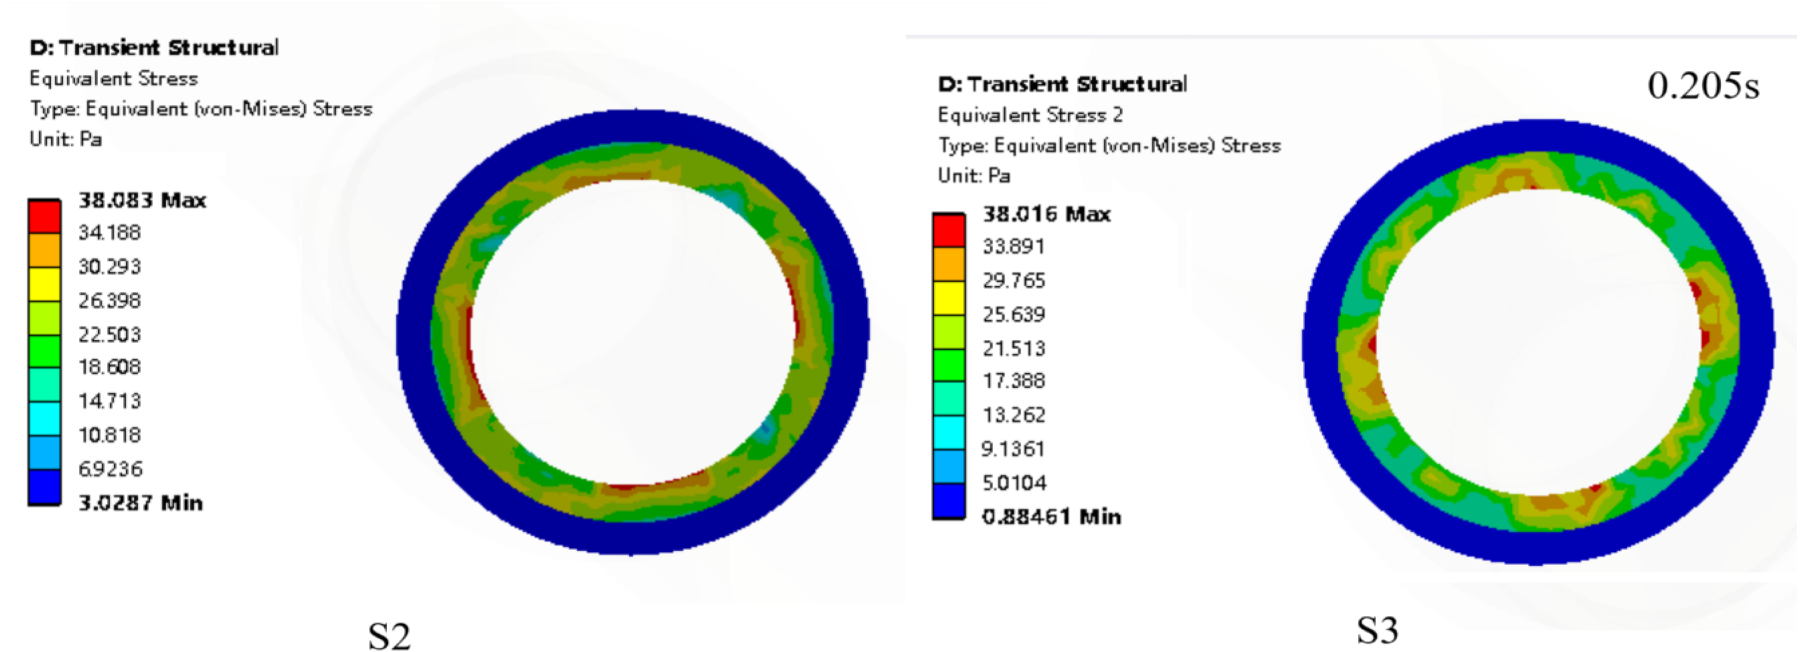
Von Mises stress contour of the arterial wall and plaque in the link stent model.
Figure 31 shows the equivalent strain contours at sections S2 and S3 in the grid stent model at the peak velocity moment during systole. It can be seen that the distributions of the equivalent strain contours at the two sections are basically the same. The maximum strain occurs in the area where the plaque contacts the stent, which is the location of a sudden structure change.
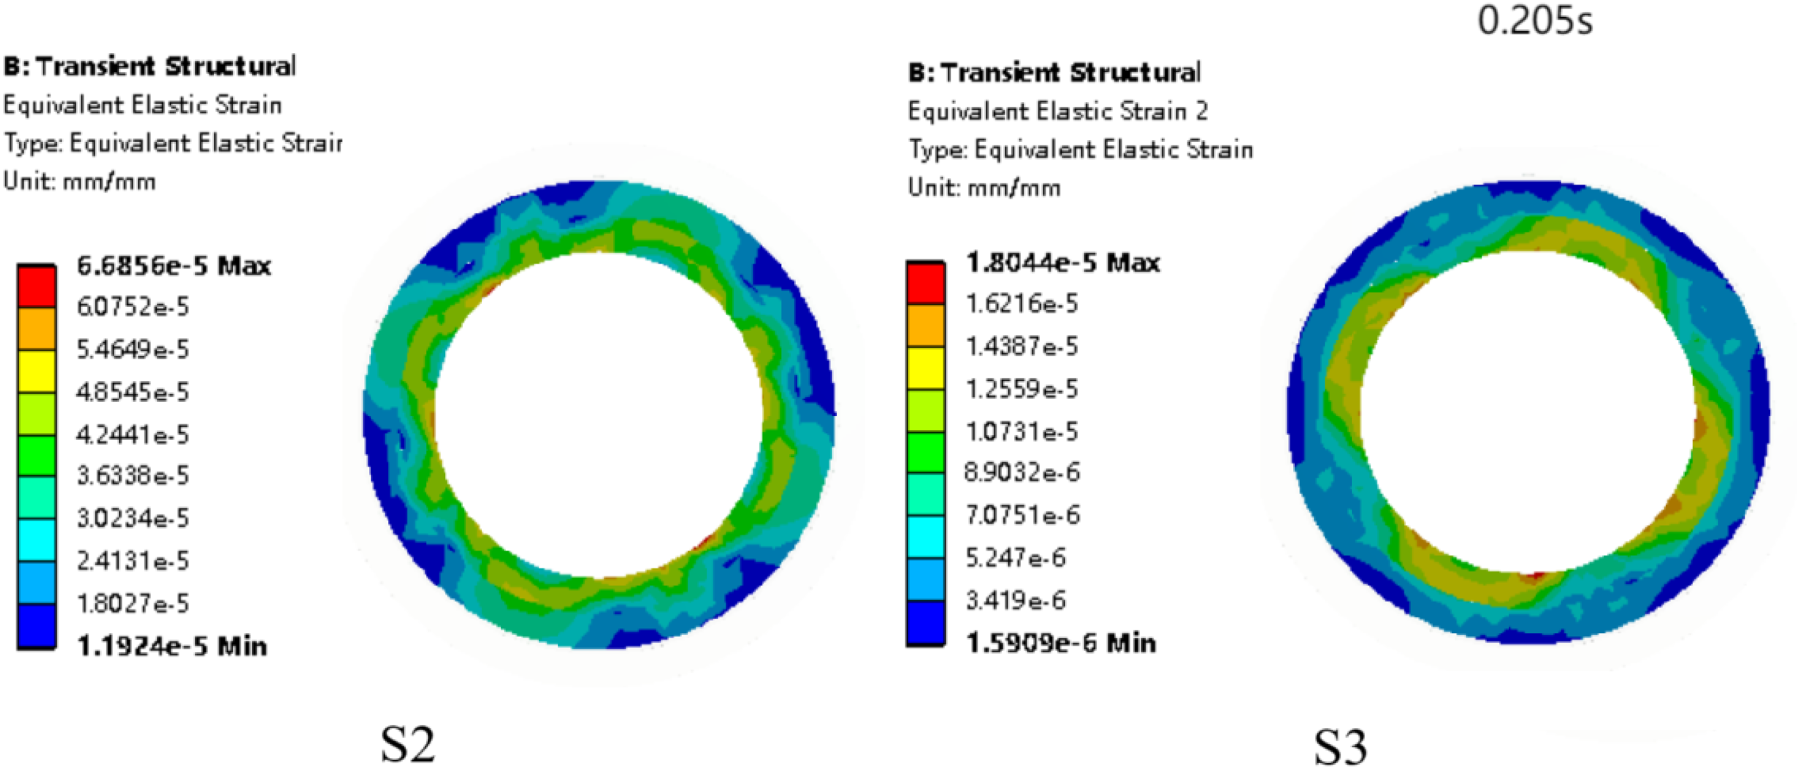
Equivalent strain contour of the arterial wall and plaque in the grid stent model.
Figure 32 shows the strain contours at sections S2 and S3 of the arterial wall at the peak moment (0.205 s) during systole after the link stent expansion. The maximum strain at section S2 occurs in the area where the plaque contacts the arterial wall, while the maximum strain at section S3 occurs in the area where the plaque contacts the stent. The contours at both sections are symmetrically distributed. The symmetric structure of the stent, to some extent, ensures the uniform strain distribution in the arterial wall and the plaque.
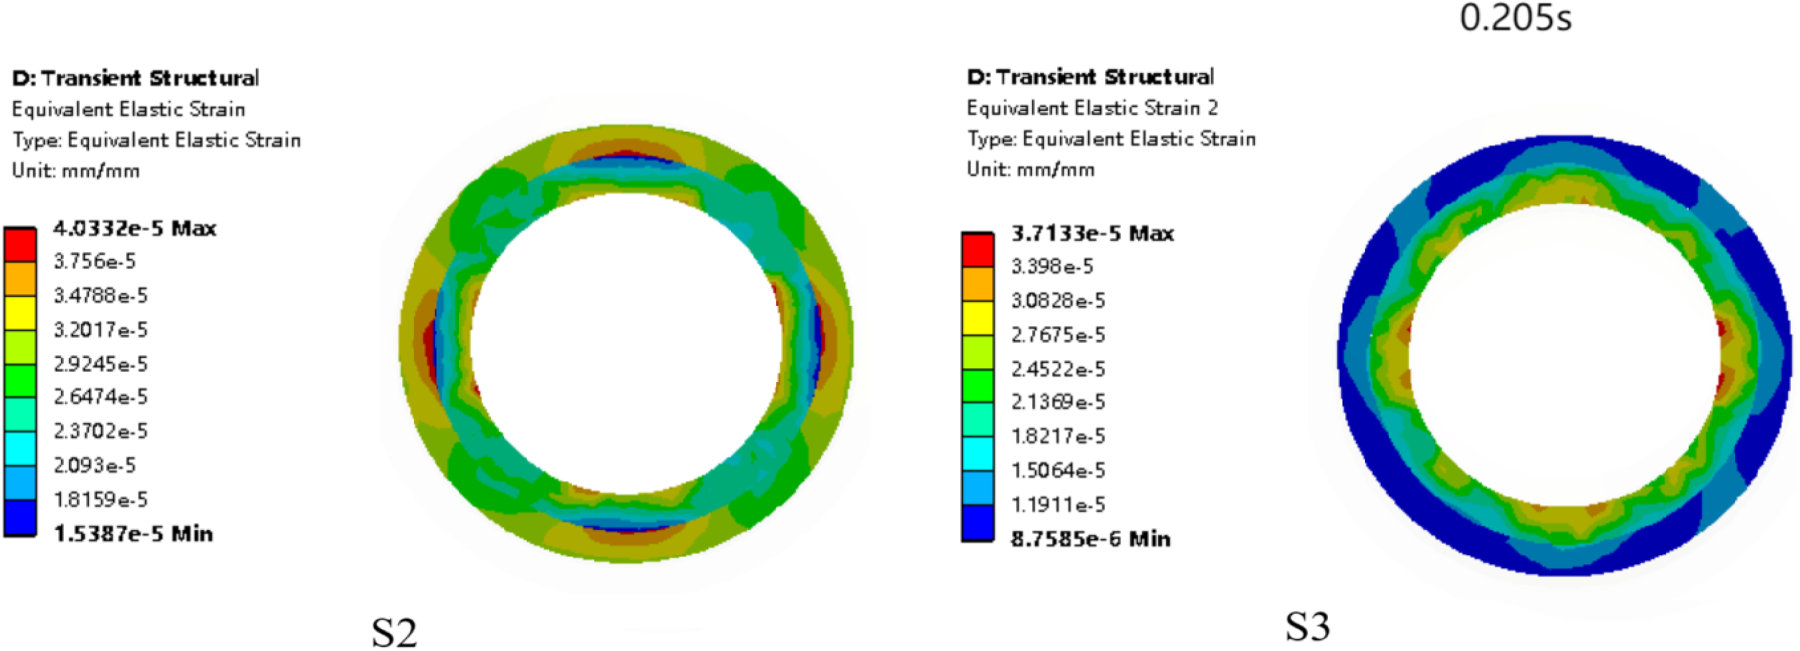
Equivalent strain contour of the arterial wall and plaque in the link stent model.
The grid stent model
After the grid stent implantation, it leads to a reduction in the local flow velocity at the edges of the implantation site, consistent with previous findings. 33 The change in the pressure gradient indicates that the stent may alter the mechanical environment of the blood vessel, especially in the regions at both ends of the stent. After stent implantation, the blood flow resistance is effectively reduced, and the pressure at the implantation site decreases, enabling blood pressure to be maintained within the normal range, similar to previous studies without considering the microcirculation. 34
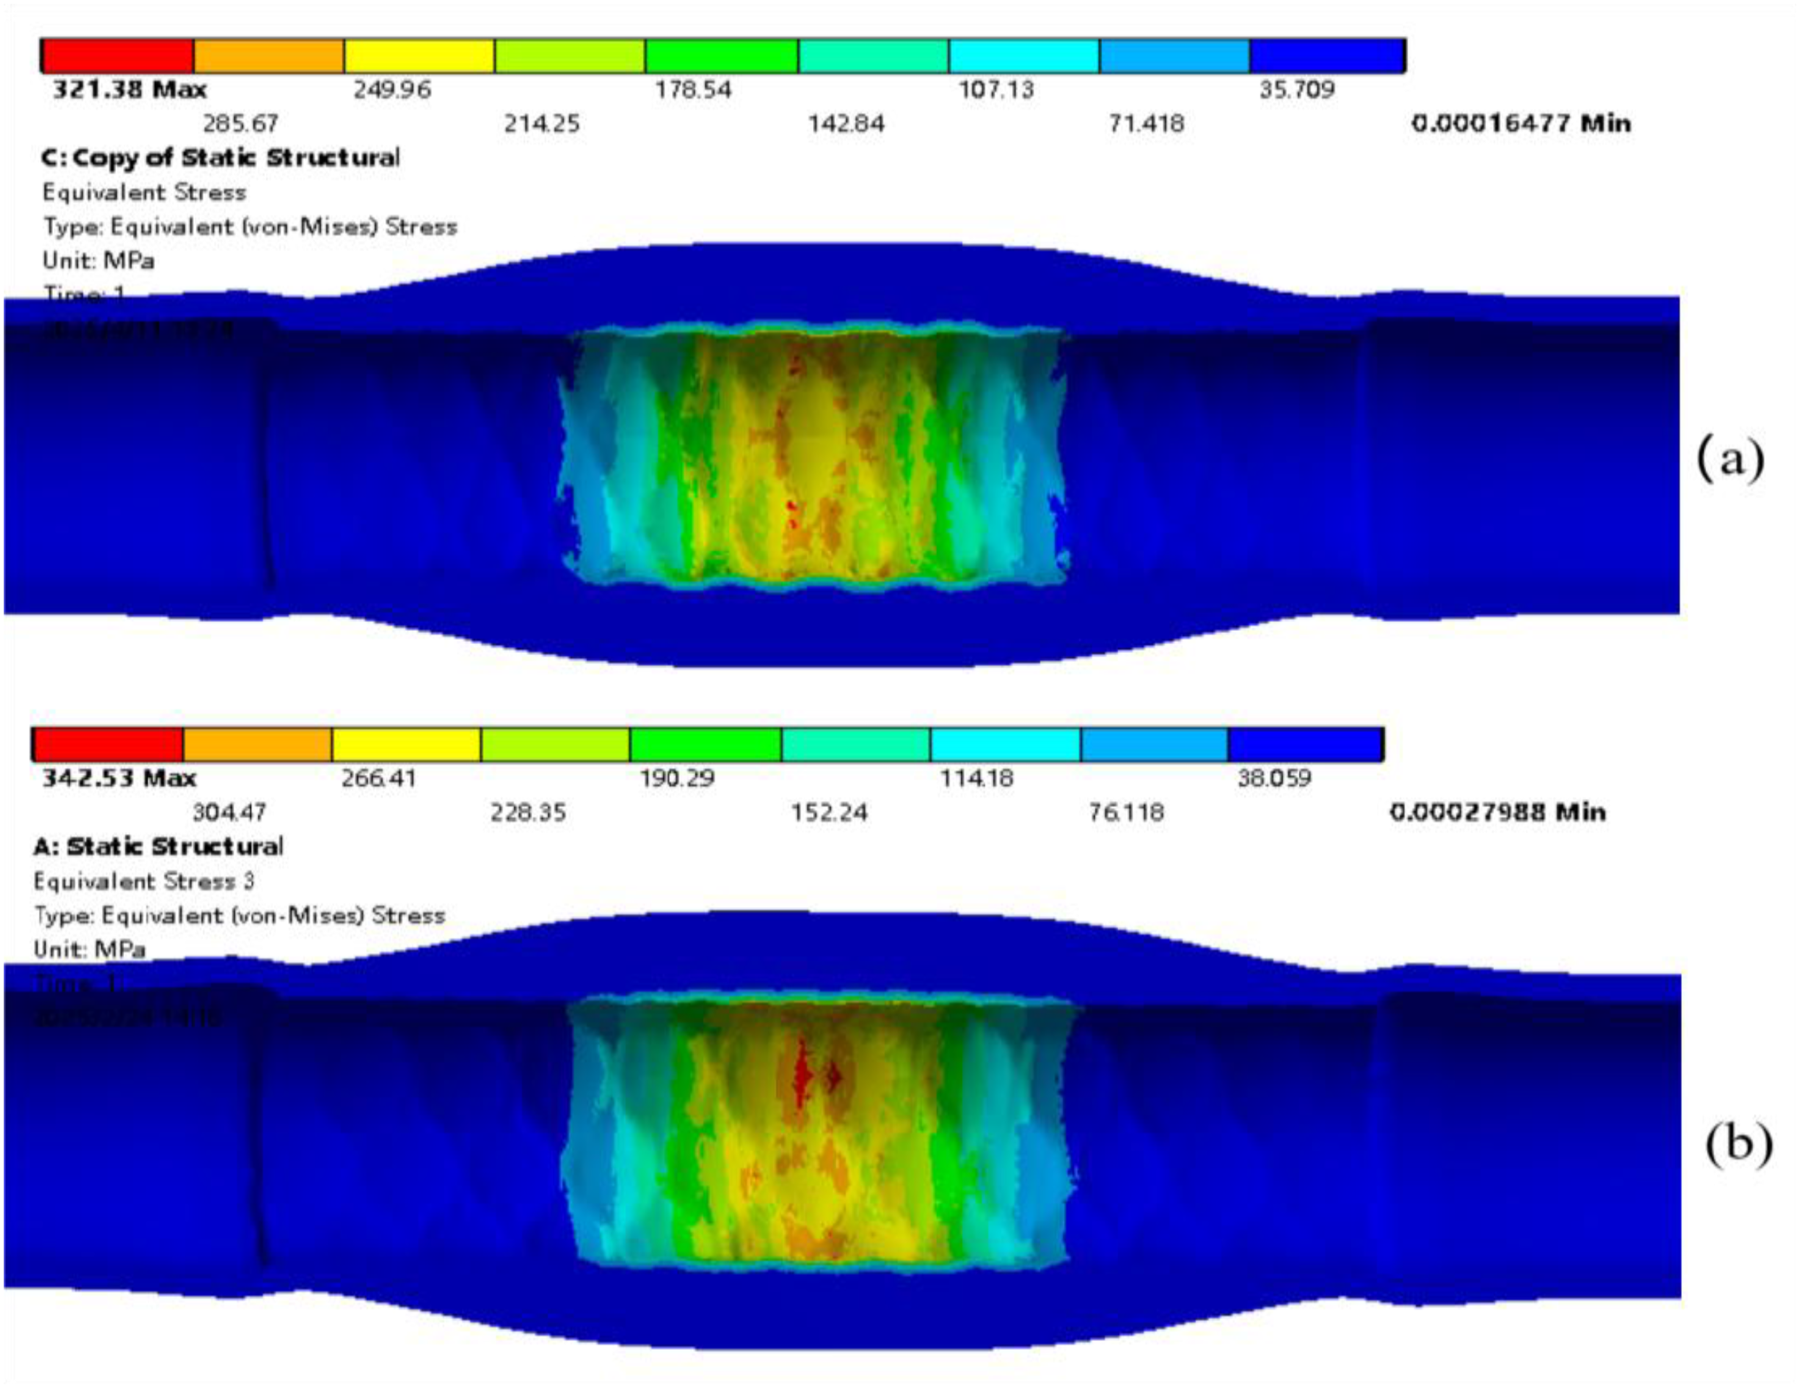
Plaque stress comparison after stent expansion. (a) grid stent (b) link stent.
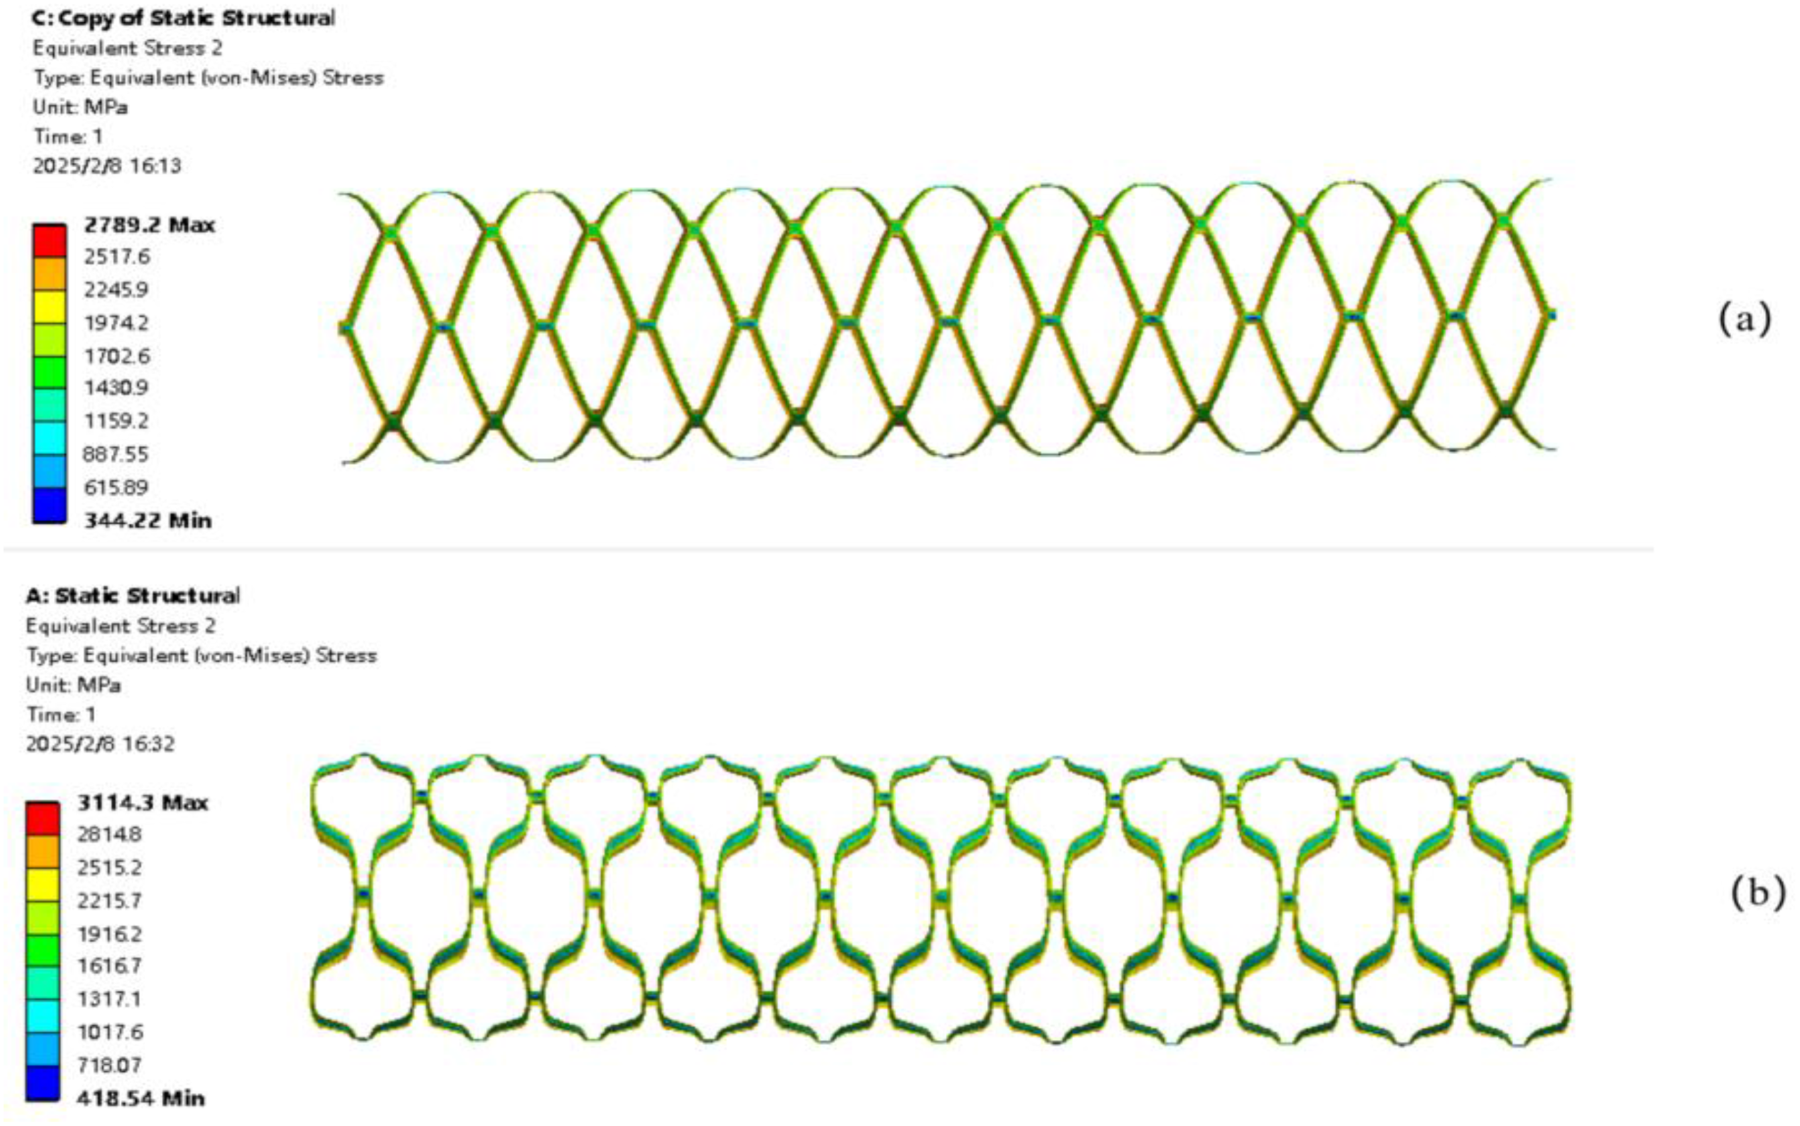
Stent stress comparison after stent expansion. (a) grid stent (b) link stent.
Traditional stent implantation models often neglect the microcirculation. In such models, the TAWSS at the positions of stent struts is higher than that in other regions and exceeds the normal physiological range of the human body. In areas other than the stent strut positions, relatively low TAWSS values are distributed. 35 Generally, a situation where TAWSS < 0.4 Pa is considered a high incidence area for lipid deposition and atherosclerosis. 36 In this study, the regulatory effect of the microcirculation makes the TAWSS distribution at the front end of the stent close to the normal range of the human body, and the TAWSS value in the stent expanded area is close to 0.5 Pa, alleviating the occurrence of high TAWSS near the stent strut area. Regions with low TAWSS usually correspond to regions with high OSI and high RRT, and these regions are associated with the risks of intimal hyperplasia and restenosis. 37 In previous studies, high OSI regions appeared near the proximal end of the stent implantation, 38 possibly because the stent implantation changes the original blood flow pattern in the blood vessel. Under the influence of the microcirculation, high OSI regions are generated around the central area of the stent implantation. Due to changes in the blood flow direction and the occurrence of stagnation, high RRT also occurs in this area. However, compared with studies without considering the microcirculation, the areas of high OSI and high RRT are significantly reduced. Therefore, the inclusion of the microcirculation helps to alleviate the concentrated interference of the stent struts on blood flow, reduces the local TAWSS, and also decreases the areas of high OSI and high RRT, making the results closer to physiological facts.
After the link stent implantation, although flow separation and a decrease in flow velocity also occur at the distal end of the stent implantation area, overall, the blood flow after the link stent implantation still conforms to physiological facts, despite the need to pay attention to some local abnormalities. Regarding the parameters near the vessel wall, after stent implantation, the TAWSS values are close to the normal physiological range. Although blood oscillation occurs downstream of the implantation area, resulting in high OSI and high RRT, relatively, the hemodynamic environment is improved and is closer to physiological facts.
In the hemodynamic simulation of stent implantation without considering the microcirculation, 39 the stent struts, acting as obstacles to blood flow, react to the velocity streamlines of blood flow, causing blood flow disorders. For each repeated stent strut structure, the TAWSS value increases from the area near the strut towards the center of each stent strut. Low WSS regions are generated beside the stent struts and at bifurcations, and high RRT values occur at these locations. In this study, we incorporate the microcirculation system. The capillaries in the microcirculation system increase the blood flow resistance, and the kinetic energy decreases during blood flow, resulting in a decrease in the blood flow velocity at section S4 and a more stable change in the flow velocity. Regarding the parameters near the blood vessel wall, at the hub of stenosis, the blood velocity magnitude and WSS are higher, 40 high WSS is usually associated with better endothelial cell function, but overly high WSS may lead to endothelial cell damage, where is high-risk area for disease progression.41,42 Stent implantation needs to strike a balance between improving the hemodynamic environment and protecting endothelial cells. 43 The inclusion of the microcirculation plays a regulatory role in the hemodynamic environment after the link stent implantation. High RRT regions do not occur at the front end strut positions of the stent, and the area of low TAWSS regions near the struts is reduced. That is, the inclusion of the microcirculation helps to alleviate the concentrated interference of the stent struts on blood flow, which is of positive significance for reducing the risk of atherosclerosis. Stent design should aim to minimize the formation of high OSI and high RRT regions. Compared with studies without considering the microcirculation, adding the microcirculation makes the areas of high OSI and high RRT regions reduce, which can lower the risks of intimal hyperplasia and thrombosis.
Comparison of two stent models
As observed from Figures 7 and 8, the two stents achieve different degrees of expansion displacement. The link stent achieves a greater degree of expansion than the grid stent, demonstrating better radial support capacity. Figure 33 compares the Von Mises stress distribution of the plaque after the expansion of the grid and link stents. The regions of maximum stress after the expansion of both stents are located in the central area of the plaque, which may indicate that the plaque is more fragile at these sites and more prone to rupture. Figure 34 shows a comparison of the stress distributions of the stents. The stress distributions of the two stents are similar, and the high stress regions are located on the inner wall of the stent. This is because a radial displacement is applied to the inner wall of the stent, causing the stent to expand. The link stent exhibits a relatively higher maximum stress value of 3114.3 MPa compared to the grid stent.
According to the velocity streamlines of the stents in Figures 9 and 10, both stents improve the hemodynamic environment of the stenosed artery and achieve unobstructed blood flow after implantation. However, compared to the grid stent, the link stent has better blood perfusion in the downstream area of the stent. Furthermore, the link stent has a smaller area of low TAWSS in the proximal end, and the areas of low OSI and low RRT are larger than those of the grid stent. This indicates that the link stent can better improve the hemodynamic environment and reduce the likelihood of intimal hyperplasia and restenosis.
Limitations of this work
The novelty of this work is to model a stenotic artery-microcirculation interaction system and investigate the effects of stent implantation on hemodynamics. The system embodies more physiological significance and shows that microcirculation alters hemodynamics. The underlying mechanisms are that the impedance and pressure wave reflection cause the changes. In this work, the microcirculation is modeled as a porous medium, which is a common simplification. The vessel compliance and heterogeneity of capillary networks are neglected. Thus, impedance matching and pressure wave reflection may be different from actual physiology. Furthermore, they may have possible impact on the results.
Conclusions
This work investigates the effects of stent implantation on hemodynamics in the stenotic artery considering microcirculation. The grid and link stent models are constructed and compared. The results suggest that the link stent can not only better improve the hemodynamic environment, but also reduce the risk of intimal hyperplasia and atherosclerosis. Compared with the no-microcirculation condition, these findings reflect the importance of microcirculation in the regulation of hemodynamics after different stent implantations, providing a new perspective for optimizing stent design.
Footnotes
Ethical consideration statement
This article does not contain any studies with human participants or animals performed by any of the authors.
Consent to participate
Not applicable.
Consent to publication
This manuscript has not been published or presented elsewhere in part or in entirety, and is not under consideration by another journal. All the authors have approved the manuscript and agree with publication in the journal.
Funding
The authors received no financial support for the research, authorship, and/or publication of this article.
Declaration of conflicting interests
The authors declared no potential conflicts of interest with respect to the research, authorship, and/or publication of this article.
Data availability statement
The data supporting the findings of this study will be made available upon reasonable request.
Credit statement
Fan He made crucial initial contributions to the manuscript, especially for the modelling. Chun Luo and Minru Li wrote the main manuscript text. Lu Hua and Tingting Guo collected the remaining literature for related approaches and data. All authors reviewed the manuscript.
