
Abstract
Even in divided societies, people from different ethnic backgrounds engage each other and an overwhelming majority of this cross-ethnic interaction does not yield conflict, but rather cooperation. Whereas the literature focuses on ethnic diversity as an impediment to cooperation, this study aims to test whether social networks can overcome the challenges posed by ethnic diversity in collective action. This paper’s contribution is to examine the impact of social ties vis-à-vis ethnic difference on cooperative behavior. I analyze data collected from surveys and behavioral economics experimental play of 188 rural Malawians. I find ethnic difference (or sameness) does not influence whether subjects choose to trust their game partner but being socially connected to a game partner increases the odds that a subject will cooperate.
1. Introduction
Nine years ago, children in Saliele village walked 2 miles to attend school. That changed in 2005 with the local construction of a primary school, which proudly displays a sign indicating the building was financed by the European Union. The signpost, however, is incomplete in enumerating the many different groups of people who devoted resources and labor. It started with the village headman in Saliele calling on all of his villagers, diverse groups of mostly Chewas and a minority of Ngonis, to mould bricks to demonstrate to European Union development agents that an investment in the group of five villages would be a worthy one. 1 Now, students are free to spend more time on their studies, doing household chores, helping on the family farm, or doing whatever it is kids around the world do. The story of the school in Saliele is one rarely reported from Africa: that ethnically diverse communities overcome collective action problems to provide public goods that improve the welfare of citizens. Empirical analysis has suggested that ethnic diversity is in part responsible for the low provision of public goods witnessed in Africa (Easterly and Levine, 1997; Miguel and Gugerty, 2005), and there are similar findings in the United States (Alesina et al., 1999; Goldin and Katz, 1999; Luttmer, 2001). Related scholarship shows ethnic diversity erodes social capital and collective action (Alesina and La Ferrara, 2002; Costa and Kahn, 2003; Vigdor, 2004; Putnam, 2007). The experience of school-building in Saliele village does not fit with the usual narrative of ethnic diversity and public goods provision.
Public goods provision can improve quality of life, but requires voluntary contributions. In the case of Saliele village, these contributions would have been insufficient if only a few villagers contributed. Essentially, people have to cooperate to collectively provide for these goods and services. The literature on the Africa Growth Tragedy demonstrates ethnic diversity discourages collective action. The question I ask in this paper is: could social networks overcome the challenges associated with ethnic diversity? In the small but growing literature on social networks in Africa, we have learned how social networks have impacted how Africans have adapted their behavior in response to social problems as severe as HIV/AIDS (Kohler et al., 2007), and as pressing as unemployment (Burns et al., 2010).
This paper’s contribution is to examine the impact of social connectedness vis-à-vis ethnic diversity on cooperative behavior. I use behavioral games (the trust game in particular) to measure cooperation and surveys to collect information on participants’ ethnic identity and social networks. The present study differs from most other lab-in-the-field studies in Africa by examining how people trust non-anonymous others in their rural village. I selected a rural setting because 80% of Africans live in rural areas. All of the behavioral games played in our study were between people living in the same village, to better approximate the dynamics of local cooperation. We used photographs of the villagers in the behavioral games to be explicit about who one was given an opportunity to cooperate with, to more precisely measure person-to-person dynamics of play, thus not relying on assumptions about players’ assessments of the ‘average’ villager in their community. The 188 rural Malawians who participated in the study showed more cooperative than non-cooperative behavior, even across ethnic lines. In short, I find ethnic difference does not influence whether subjects choose to trust their game partner but being socially connected to that game partner increases the likelihood that a subject will cooperate.
2. Cooperation amidst diversity
In the past half century, African countries have largely suffered from a ‘growth tragedy’, which Easterly and Levine (1997) attribute to ethnic divisions. They argue ethnic division impacts economic growth through the choice of growth-enhancing versus growth-retarding policies. At a more micro-level, Miguel and Gugerty (2005) examined the impact of ethnic diversity on collective action, in particular the local provision of public goods (schools and wells). They argue a diverse community’s reduced ability to impose social sanctions on free-riders is the mechanism through which ethnic diversity negatively impacts collective action. Habyarimana et al. (2007; 2009) study the relationship between ethnic diversity and collective action more closely, systematically testing an array of potential mechanisms driving under-provision of public goods by employing experimental games in urban Uganda; the authors find that coethnic cooperation in public goods experimental games stems from norms of coethnic cooperation and sanctioning. Miguel and Gugerty conclude their study on ethnic diversity and public goods provision with the following policy implication: ‘A more attractive approach for addressing the efficiency costs of ethnic division lies in designing policies and institutions that promote successful cooperation across ethnic groups’ (Miguel and Gugerty, 2005, 2362).
This paper does not test a new policy or institutional design that would promote cooperation. Rather, I bring focus to already existing patterns of cross-ethnic cooperation with an aim to provide some insight for potential policy or institutional designs called for by Miguel and Gugerty. The motivation of this study draws from the growing body of literature that aims to evaluate what community characteristics can moderate the negative impacts ethnic diversity can pose to public goods provision (Singh, 2010).
Even in the most divided societies, people from different backgrounds engage with each other, and most of this cross-ethnic interaction does not yield conflict, but rather cooperation (Fearon and Laitin, 1996). In this study, I build on earlier scholarship that found social connections, beyond those related to ethnicity, also drive cooperation. Experimentalists studied the behavior of Harvard University students in a modified trust game and measured a series of indicators, including race, national background, and social connection to another subject. In addition to seeing less sharing between subjects of different racial and ethnic backgrounds, the authors also found that subjects that have known each other for a longer time will send higher amounts of money (as well as respond with higher amounts) in a trust game than will subjects who have known each other for less time or not at all (Glaeser et al., 2000). Survey data from two poor neighborhoods in Dallas, Texas indicate that social capital in a neighborhood was more important that ethnicity, ethnic diversity, or other demographic information in predicting reported public goods contributions; the authors find individuals with larger social networks have a higher propensity to make contributions to local charitable organizations (Leonard et al., 2010).
Social networks are likely more developed within ethnic groups, allowing coethnics to develop reputations for cooperative behavior (Bowles and Gintis, 2004; Fearon and Laitin, 1996). Habyarimana et al. (2007) designed a network game where subjects would have to find randomly selected ‘targets’ that were resident in the same high-density area of Kampala and found that subjects with coethnic targets were significantly more successful than subjects whose targets had a different ethnic background. Their results are consistent with the expectation that shared ethnicity increases the likelihood of a shared social network. Nonetheless, people’s social networks cross ethnic lines, giving them opportunities to create reputations and sanction behavior.
Building on the scholarship on social networks, ethnic diversity, and collective action, this study explores the relative importance of social networks vis-á-vis coethnicity on cooperative behavior. Findings from the empirical analysis of public goods and collective action in Africa and behavioral economics experimental findings from multiple contexts have shown more cooperation between coethnics than between people of different ethnic backgrounds. In the context of a trust game, then:
The social capital and social networks literature and findings demonstrating social connectedness influences cooperative behavior would predict:
The original contribution of the present study is to test the expectation that social connectedness will have a stronger influence on cooperative behavior than shared identity. In the context of a trust game, then:
3. Methods
3.1. Setting
Malawi is a poor country, where 90.5% of the population lives on less than US$2 per day (World Bank, 2012). The government has few resources to devote to public goods provision as it has a limited local revenue stream. Malawi is highly dependent on foreign aid. In 2009, nearly 40% of the government’s budget was sourced from foreign assistance (Ministry of Finance [Malawi], 2011, 19). International donors and other charities occasionally provide funding for schools, clinics, or boreholes (wells). Nonetheless, any development in a village, whether funded by government or donors, will also require local villagers to make contributions, if not of money, then of their time and effort. Like the Saliele village example in the introduction, another village headman I interviewed in 2008 discussed the process of how his village ‘received’ a new borehole from ‘the government’: builders came to the village and villagers had to supply moulded bricks, carry sand from another nearby village, and provide the builders with food for the duration of their time constructing the borehole. The upkeep of the borehole is managed by a committee in the village who assign one woman each day to sweep and mop up around the borehole. 2 In sum, aid and development interventions in Malawi require cooperation between ordinary Malawians. The setting is one in which collective action can improve conditions.
Malawi is also a society divided along ethnoregional lines. Ethnic identity has shaped politics in Malawi since at least the colonial period, when colonial political economy facilitated ethnic and regional divisions in service of the British policy of indirect rule (Vail and White, 1989). The first president following independence in 1964, Hastings Kamuzu Banda, reified his own Chewa ethnic group and reinforced ethnoregional boundaries through patronage (Vail and White, 1989; Kaspin, 1995). Even in the current period since the introduction of multiparty reforms in 1993, elections have shown ethnoregional partisanship and voting patterns, although the 2009 election showed a decline in ethnoregional partisanship (Ferree and Horowitz, 2010). Following the 2009 election, however, there was heated public debate over a university admissions policy that considers regional background in determining admission; discourses went so low that leaders were accusing other ethnic groups of being selfish or stupid (Dionne, 2014). Relatedly, the 2014 election’s ethnoregional patterns of political support suggest the 2009 election may have been an anomaly (Dulani and Dionne, 2014).
There are over a dozen ethnic groups in Malawi and the 2008 census captured information about 12 ethnic groups. 3 No group constitutes a majority of the population, and most groups map onto the three administrative regions of the country. The largest group, the Chewa, make up 32.64% of the nation’s population, but 70.17% of the population in the Central Region. The second largest group, the Lomwe, make up 17.56% of the population, 36.6% of the Southern Region, and roughly 75% in both Thyolo and Mulanje districts (which are in the south). The Yao constitute 13.51% of the national population, 24.6% of the Southern Region, and 71.73% of the population in the lakeshore district of Mangochi. The Ngoni make up 11.46% of the national population, and unlike other groups, are not concentrated in a particular region, but make up 89.93% of Ntcheu district (in the Central Region) and 66.34% of the population of Neno district (in the Southern Region). Although Tumbuka only account for 8.84% of the national population, they constitute 53.76% of the population in the Northern Region and 86.88% of the population in Rumphi District and 71.1% of Mzimba District. See Table 1 for a summary of the concentration/dispersion of ethnic groups in Malawi.
Ethnic groups in Malawi, 2008 (%).
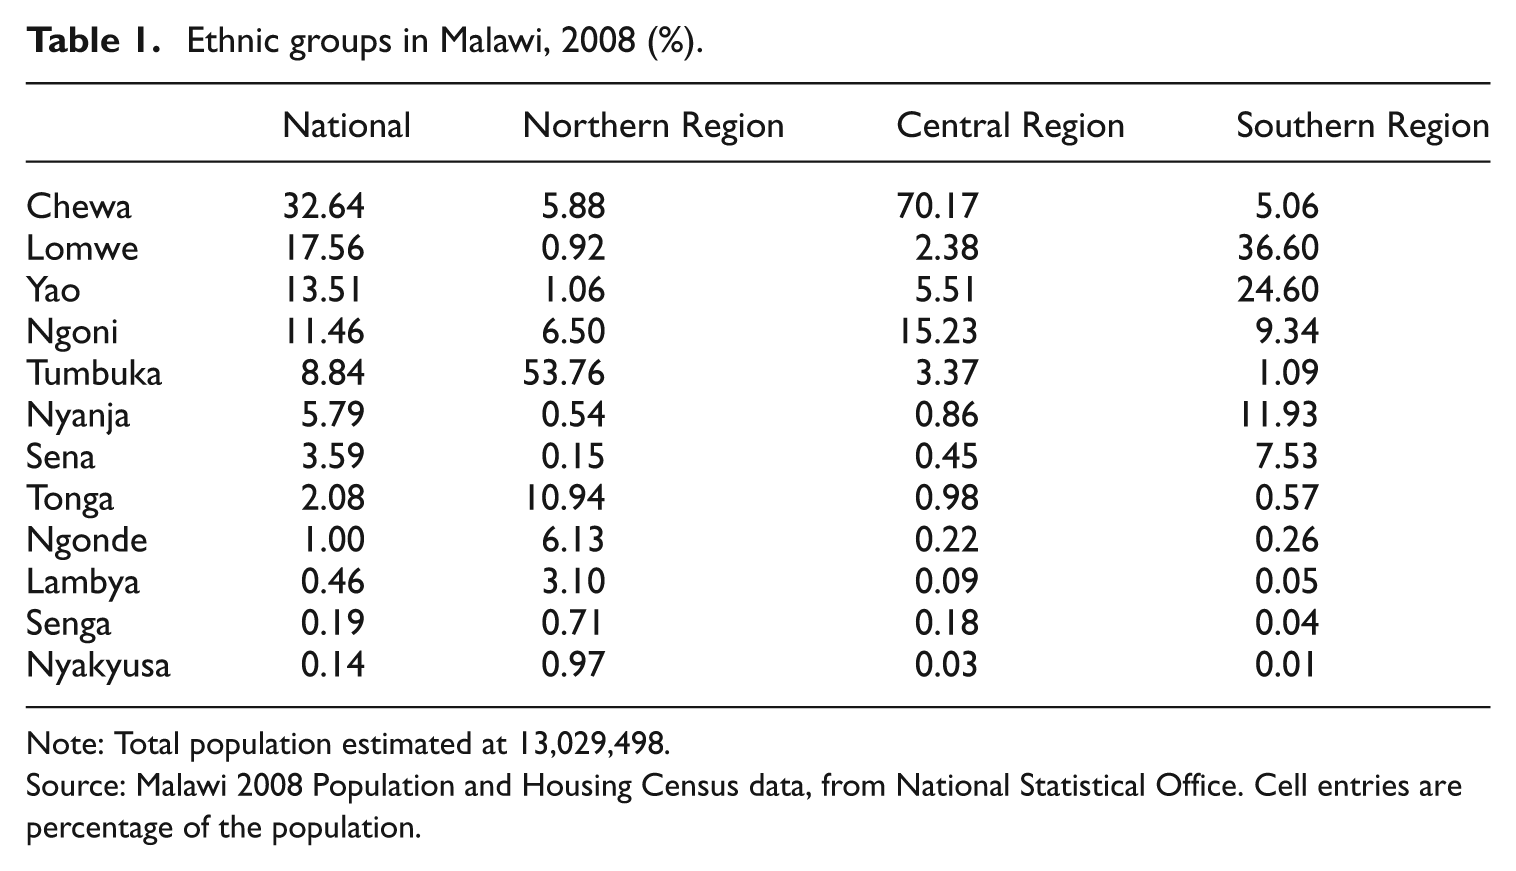
Note: Total population estimated at 13,029,498.
Source: Malawi 2008 Population and Housing Census data, from National Statistical Office. Cell entries are percentage of the population.
The study was situated in rural areas of Zomba district (in TAs Kuntumanji and Mwambo), a diverse district in Southern Malawi that also holds the former colonial capital, where the arts and sciences college of the University of Malawi (Chancellor College) is located. By car, the villages would average 45 minutes drive to the heart of Zomba town, and the great majority of that time would be spent on unpaved, ‘dusty’ roads. In TA Mwambo and TA Kuntumanji, the Nyanja are a majority (54.36% in Mwambo and 54.3% in Kuntumanji). In Mwambo, the next largest group is the Lomwe (36.96%), and there is a small population of Yao (5.61%). In Kuntumanji, the next largest group is the Yao (28.34%), followed by the Lomwe (12.64%).
3.2. Sample
Using data on ethnic diversity from the 2008 census, I selected study villages from census enumeration areas in TA Mwambo and TA Kuntumanji of varying ethnic makeup: one area was predominantly Yao, another area was predominantly Nyanja, and two areas were mixed with somewhat equal proportions of Yao and Nyanja. I met with traditional leaders to discuss the nature of the research and gain access to the proposed study areas. The research team conducted a census of the number of adults aged 18–50 living in households in each of the four villages.
The sample was drawn at a village meeting. First, the research team was introduced by the headman and in all but one village (a predominantly Muslim village), there was an opening prayer. Then the Malawian research supervisor gave a 30-minute presentation that discussed the goals and process of random sampling and the purpose and nature of the study. After the presentation was over, villagers asked questions and we answered them. The meetings in each village were well attended, and in one of the villages, the meeting was rather celebratory in nature, with groups of women singing and dancing when we arrived. In all villages, women sat separately from men, but questions and participation came from both sides.
Once it seemed the village had a good grasp of the proposed work, we drew the sample. In an opaque bag, we had the name of household heads from the village representing each adult living in the village. For example, if Abiti Jamusi’s 4 household had three adults, Abiti Jamusi’s name would be written on three pieces of paper in the bag. Volunteer villagers would blindly select from the bag one piece of wadded-up paper, which would be unfolded by the research supervisor and read aloud (usually twice), so the person, or another member of the household, would make him/herself known.
Within households, a household representative would draw a numbered card for each of the adults sampled, and whatever number was drawn would determine which adult in the household would be sampled into the study. For example, at Abiti Jamusi’s household, each adult’s name was written on a numbered list and if Abiti Jamusi’s household had only one draw from the village sample, a research assistant would go to Abiti Jamusi’s home and ask that she or someone else draw one of three cards. Whatever number was drawn would determine which person on that household listing, whether Abiti Jamusi, her husband, or her sister listed as 1, 2, and 3 respectively would be drawn. So, if 2 was drawn, Abiti Jamusi’s husband would be the sampled participant.
The villages averaged 200 adults in total. In a village of this size, it is reasonable to expect most people to know many of the other Malawians living in their respective villages. Even if a villager might not know everyone else in her village, she would likely know a relative to any given villager, whether through village meetings, previous schooling together, or the everyday aspects of village life (drawing water from a collective borehole, passing others on narrow village footpaths, etc.). In each village, 55 adults were drawn into the sample, with a target of successfully collecting data from 50 respondents in each village. The final study population consisted of 205 interviewed subjects, of which 188 played the behavioral games. No resulting sample from a village matched my intention to have two villages with ethnic constitutions that were equal between groups. Instead, all villages had one ethnic group that constituted at least a majority. One village was 52% Yao (Village #2), another 71% Yao (Village #3), another 72% Yao (Village #1), and one village was predominantly Nyanja: 74% (Village #4).
3.3. Measuring cooperation
One way of observing cooperative behavior is through behavioral games. Scholars devise ‘games’ and interpret participant play as indicative of whether and how a population cooperates. Berg et al. (1995) designed what they called the ‘investment game’ to study trust and reciprocity. In this game, now commonly called a ‘trust game’, Subject A has some amount of money from which Subject A can decide to send to Subject B. Subjects are told that whatever amount is sent would be tripled before it reached Subject B. Subject B then decides how much of the tripled money to keep and how much to send back to Subject A. The dominant, individual wealth-maximizing strategy of this game is to send nothing, thus positive contributions by Subject A are thought to reflect a degree of trust that Subject B will reciprocate. Each move allows us to see two elements of trust: Subject A’s decision on whether to trust Subject B and Subject B’s decision on whether to respond as trustworthy. Scholars have used this trust game (or variants of it) to identify determinants of trust and trusting behavior, be it gender (Croson and Buchan, 1999), a subject’s reported risk profile (Eckel and Wilson, 2004), expectations about how trusting or trustworthy others are (English, 2011), the attractiveness of strangers (Wilson and Eckel, 2006), and, particularly germane to the present study, social connection and racial differences (Glaeser et al., 2000).
3.4. Data collection
The Malawian research team of one supervisor and six enumerators had extensive experience prior to the study in obtaining informed consent, collecting survey data, and maintaining confidentiality. The team had not, however, previously collected data using behavioral economics experiments, so the bulk of training focused on proctoring the behavioral games.
Data collection took place across a span of three weeks in August 2011. Owing to the rural setting of the study, it would have been incredibly difficult to replicate the lab-in-the-field set-up and procedures used by Habyarimana et al. (2009). Our data collection methods, although incorporating portable technology for survey enumeration, relied heavily on the low-technology approach of printing experimental games on paper. Benefits of such a low-technology approach include reduced resource needs (not just in terms of equipment but also programming needs) and less reliance on intermittent if existent electricity supply.
3.4.1. Pre-game survey
Adults sampled into the study were sought out for consent to participate. No participant refused, although a few in the sample were temporarily absent. All but one had temporarily migrated for labor reasons; the other was temporarily in the hospital. Each participant was photographed and surveyed. The survey took 36 minutes on average to complete.
In addition to standard demographic and background characteristics, the survey asked questions about ethnic identity, social and political activities, and village experiences with and reported participation in local development projects. Enumerators captured data using iPads loaded with the iSurvey software package. At the conclusion of the interview, the enumerator gave the subject an appointment time at a later date to show up at a central location in the village to check in for the second part of the research project (the games) and were reminded of the MWK 200 show-up fee associated with game play that was previously announced at the village meeting when the sample was drawn.
3.4.2. Experimental games procedure
Respondents were matched randomly within village for the behavioral games. 5 Using photographs collected during the pre-game survey, we generated paper files for each respondent to play the games. Each file contained one pre-printed sheet per game, with envelopes attached to the sheets for money transfer. When participants arrived at the field lab, 6 they checked in and were verified using the photographs taken during survey data collection. The subject was then given a show-up fee of MWK 200, 7 and directed to a facilitator team who would be leading his/her group in game play. Participants played the games in groups of five or six, led by two facilitators. Before playing, facilitators read instructions from a script and demonstrated play. Then, each player was given an envelope of their own to keep throughout the game play.
We made clear to the players in the instructions that their decisions in the game were confidential. The other villagers with whom they were playing (those pictured on their game sheets) would not know what, if any, money was sent to them nor by whom. 8 The picture alone may not have conveyed the ethnic identity of the other player, as there are no obvious facial features (i.e. ritual scarring) attributed to any ethnic group living in the villages under study. Instead, I assume that the photographs of other villagers in a moderate-sized (approximately 200 adults) village acted to draw on a villager’s previous knowledge about the other players. 9
In the one-shot trust game, respondents were given a sheet of paper on which was printed a black and white photo of the other player. Sometimes, the other player was anonymous (see Figure 1). An envelope was stapled to the page. Each participant was then given a MWK 5 coin, 10 facilitators turned away and the participants were instructed to choose to either put the coin in his/her own envelope, 11 or to put the coin in the envelope stapled to the page. Participants were then asked to seal the envelope stapled to the page, turn the page over, and set it aside.
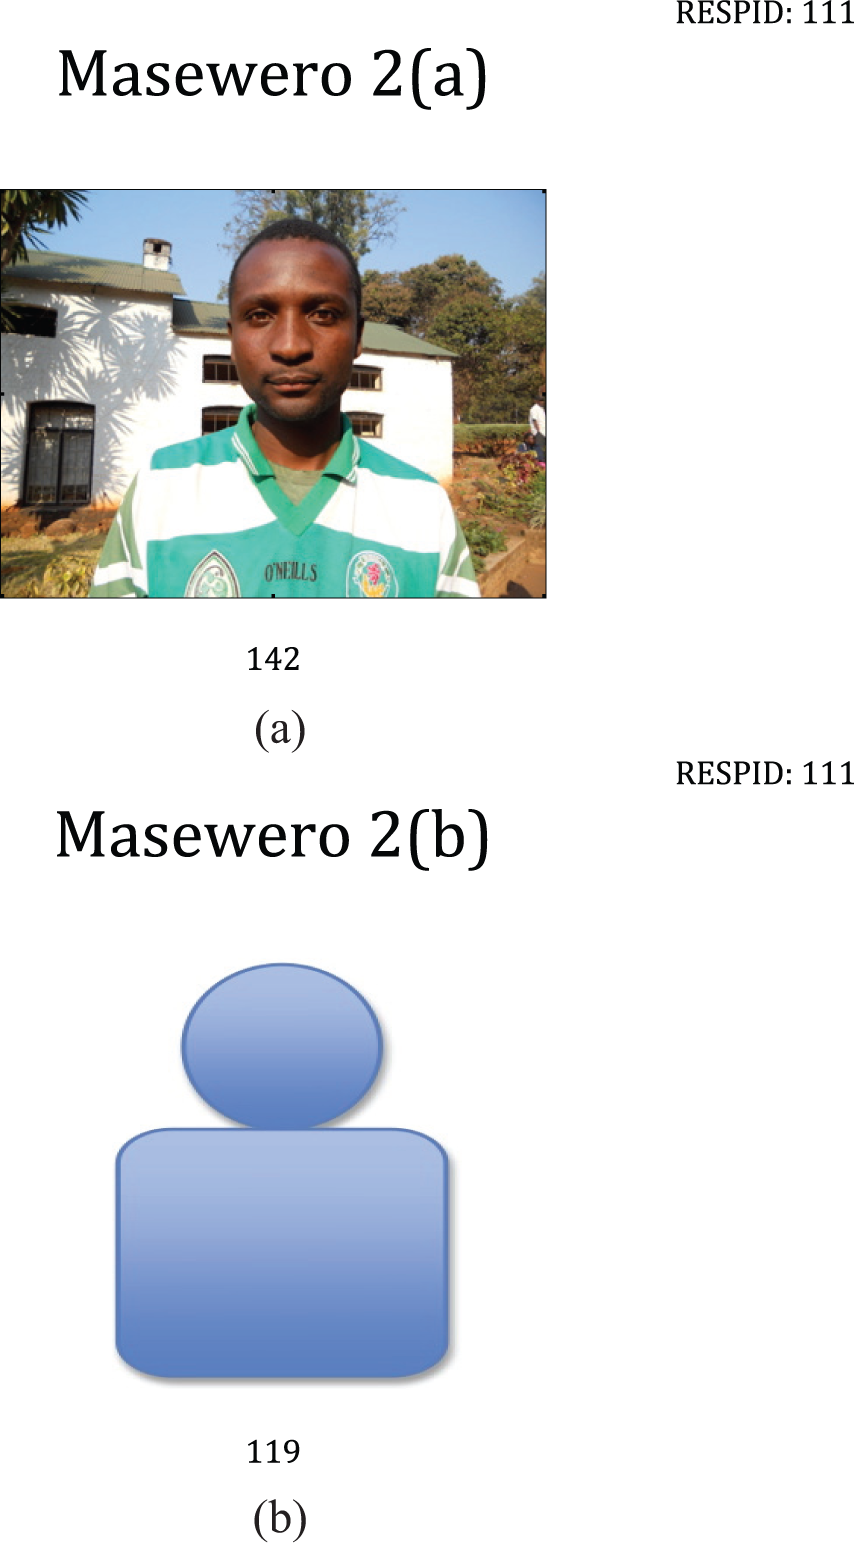
Sample trust game images: (a) non-anonymous version (for illustrative purposes only, not a photograph of actual study subject); (b) anonymous version.
Participants played the trust game three times, each time with a different player. For each participant, one of those games was with an anonymous partner. At the conclusion of the three games, facilitators would collect the stack of three game sheets (with sealed envelopes) from each player. 12
After three iterations as the trust game ‘sender’, each participant was asked how they would respond to being sent MWK 5. Participants were told that the amount was tripled from MWK 5 to MWK 15 and then given a sheet of paper and asked to mark MWK 0, MWK 5, MWK 10, or MWK 15 to send back to the trust game sender (see Figure 2). No matter what the respondent chose, they would receive MWK 5 in the game. Thus, if a respondent marked MWK 0, they would receive MWK 20 for the game; if a respondent marked MWK 5, they would receive MWK 15, and so on. Respondents marked their responses and then folded the paper in quarters (to keep their responses private), which were immediately collected by a facilitator. Trust response play was anonymous, meaning subjects did not know with whom they were playing when they acted as a responder. Game play data was entered the same day. Play across all games and players in the village was later examined to calculate each player’s earnings. Within a few days of play, the research team would return to the village to distribute participants’ earnings one at a time and in private.
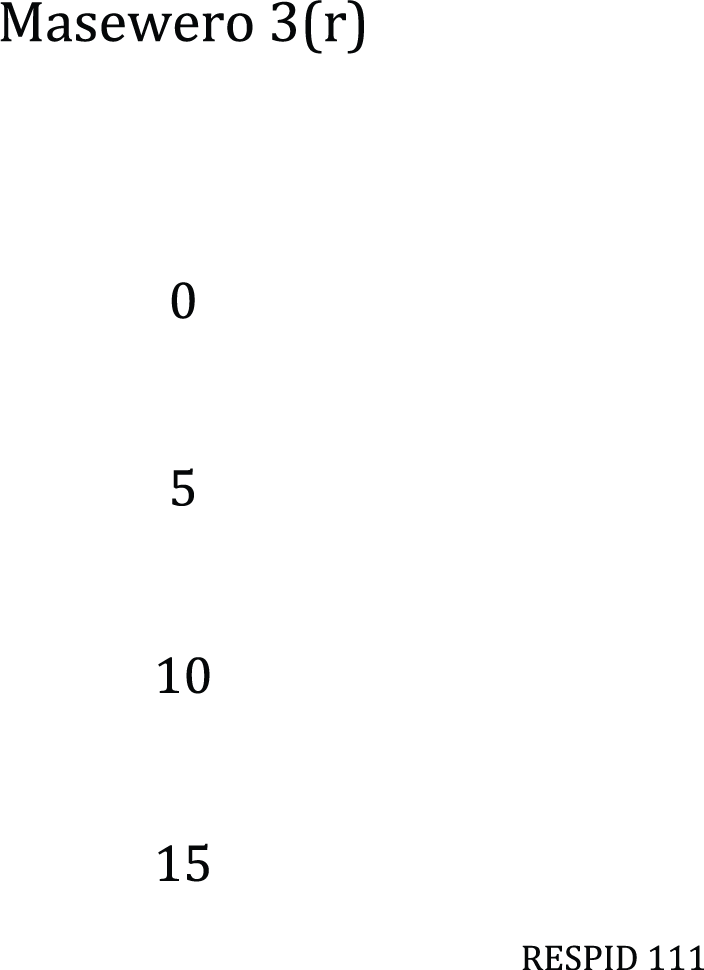
Sample trust game response sheet: sheet given to respondents to mark how much to send as a receiver in the Trust Game.
3.4.3. Post-game social network grid
At the conclusion of game play, each participant was given a sheet of paper with the photographs of all sampled participants in his/her village and asked to mark which villagers s/he considers a close friend. 13 The photo network sheet was self-administered. Upon finishing, participants were asked by the enumerator to fold the sheet in quarters (to keep their responses private) and hand it to the enumerator.
4. Data and results
We collected 205 surveys, however, 16 of the subjects sampled did not participate in the behavioral economics experiments and we are missing network data for one respondent. These 17 subjects are dropped from all of the foregoing analysis, leaving us with an analytic sample of 188.
The primary outcome variables of interest to this study are whether the participant chose to send money to his/her trust game partner (Trust Sent), and the participant’s response to Trust Sent (Trust Response). Trust Sent is a binary measure equal to 1 if the participant gives the other player MWK 5, signaling s/he ‘trusts’ the other player will send money back. 14 More than half (62%) of play resulted in trust being sent (Trust Sent=1). A small group (14%) of players always took the money for themselves (Trust Sent=0 for all three iterations), and more than a third (34%) of players always gave the money to the other player (Trust Sent=1 for all three iterations). A third of the games had anonymous partners. In anonymous games, trust was sent 56% of the time. Non-anonymous play resulted in trust sent for 64% of games. Any sent money was tripled, so Trust Response is an ordered variable where the participant could choose to send back 0, 5, 10, or 15 MWK. The average Trust Response was MWK 7.6 (standard deviation: 4.8) and the modal Trust Response was MWK 10 (see Table 2).
Summary statistics of play in the Trust Game.
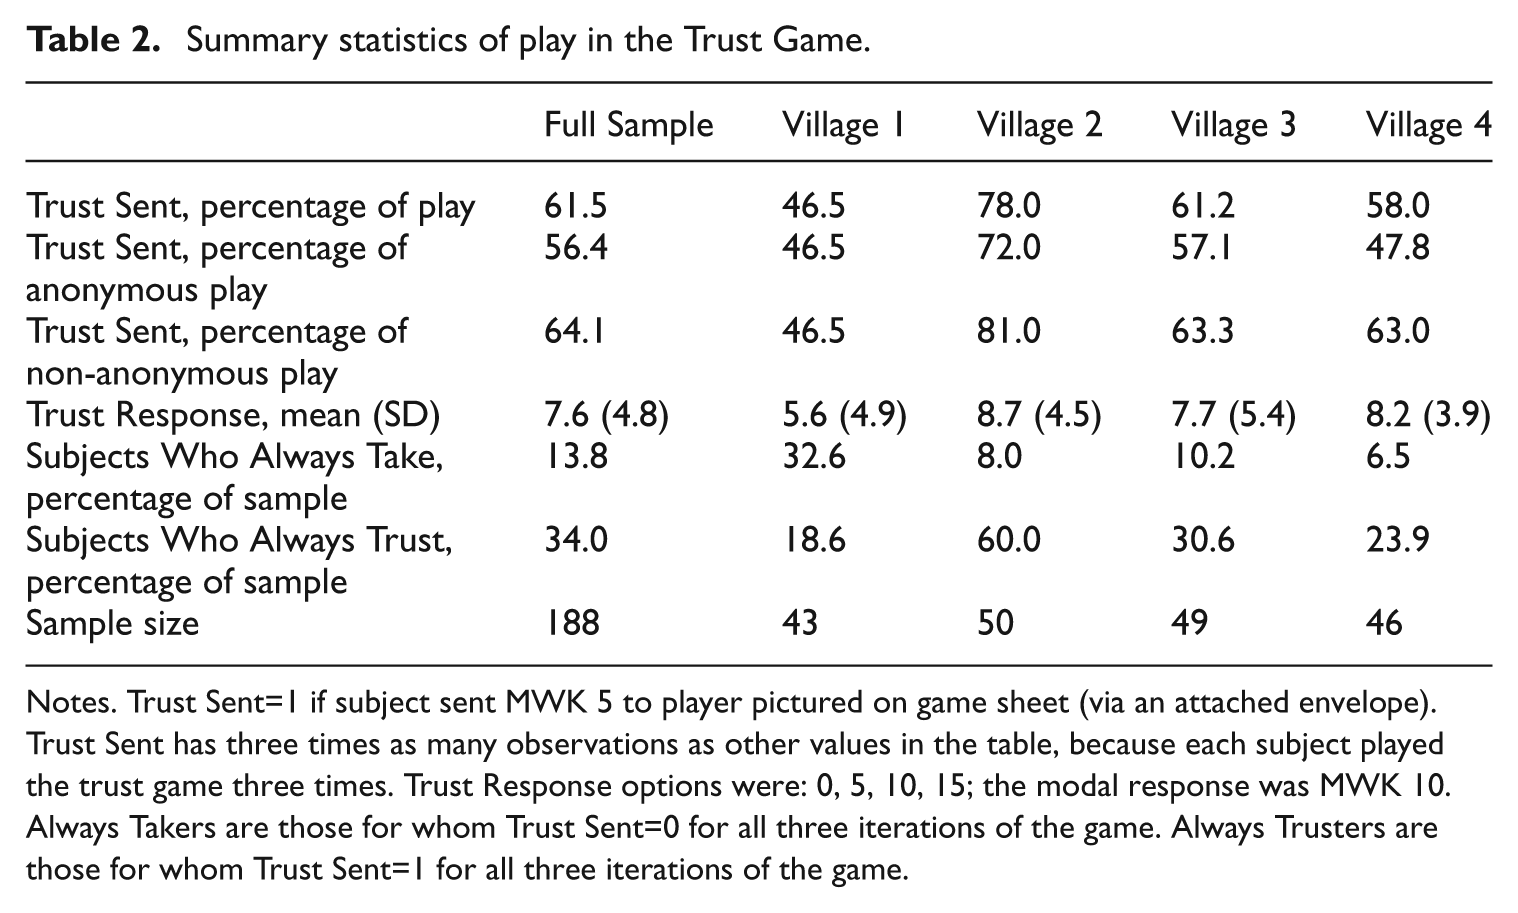
Notes. Trust Sent=1 if subject sent MWK 5 to player pictured on game sheet (via an attached envelope). Trust Sent has three times as many observations as other values in the table, because each subject played the trust game three times. Trust Response options were: 0, 5, 10, 15; the modal response was MWK 10. Always Takers are those for whom Trust Sent=0 for all three iterations of the game. Always Trusters are those for whom Trust Sent=1 for all three iterations of the game.
Table 3 presents summary statistics of the study sample generated from the surveys, including data on demographics, social participation, ethnic identity and social networks. The majority of the sample (66%) was married. Age of respondents ranged from 18 to 50 years old, with the average subject aged 30 years old. The sample was not balanced on gender; only 34% were male. The sample was split nearly in half on religion: 48.5% were Christian, 51.5% were Muslim.
Summary statistics of the study population.
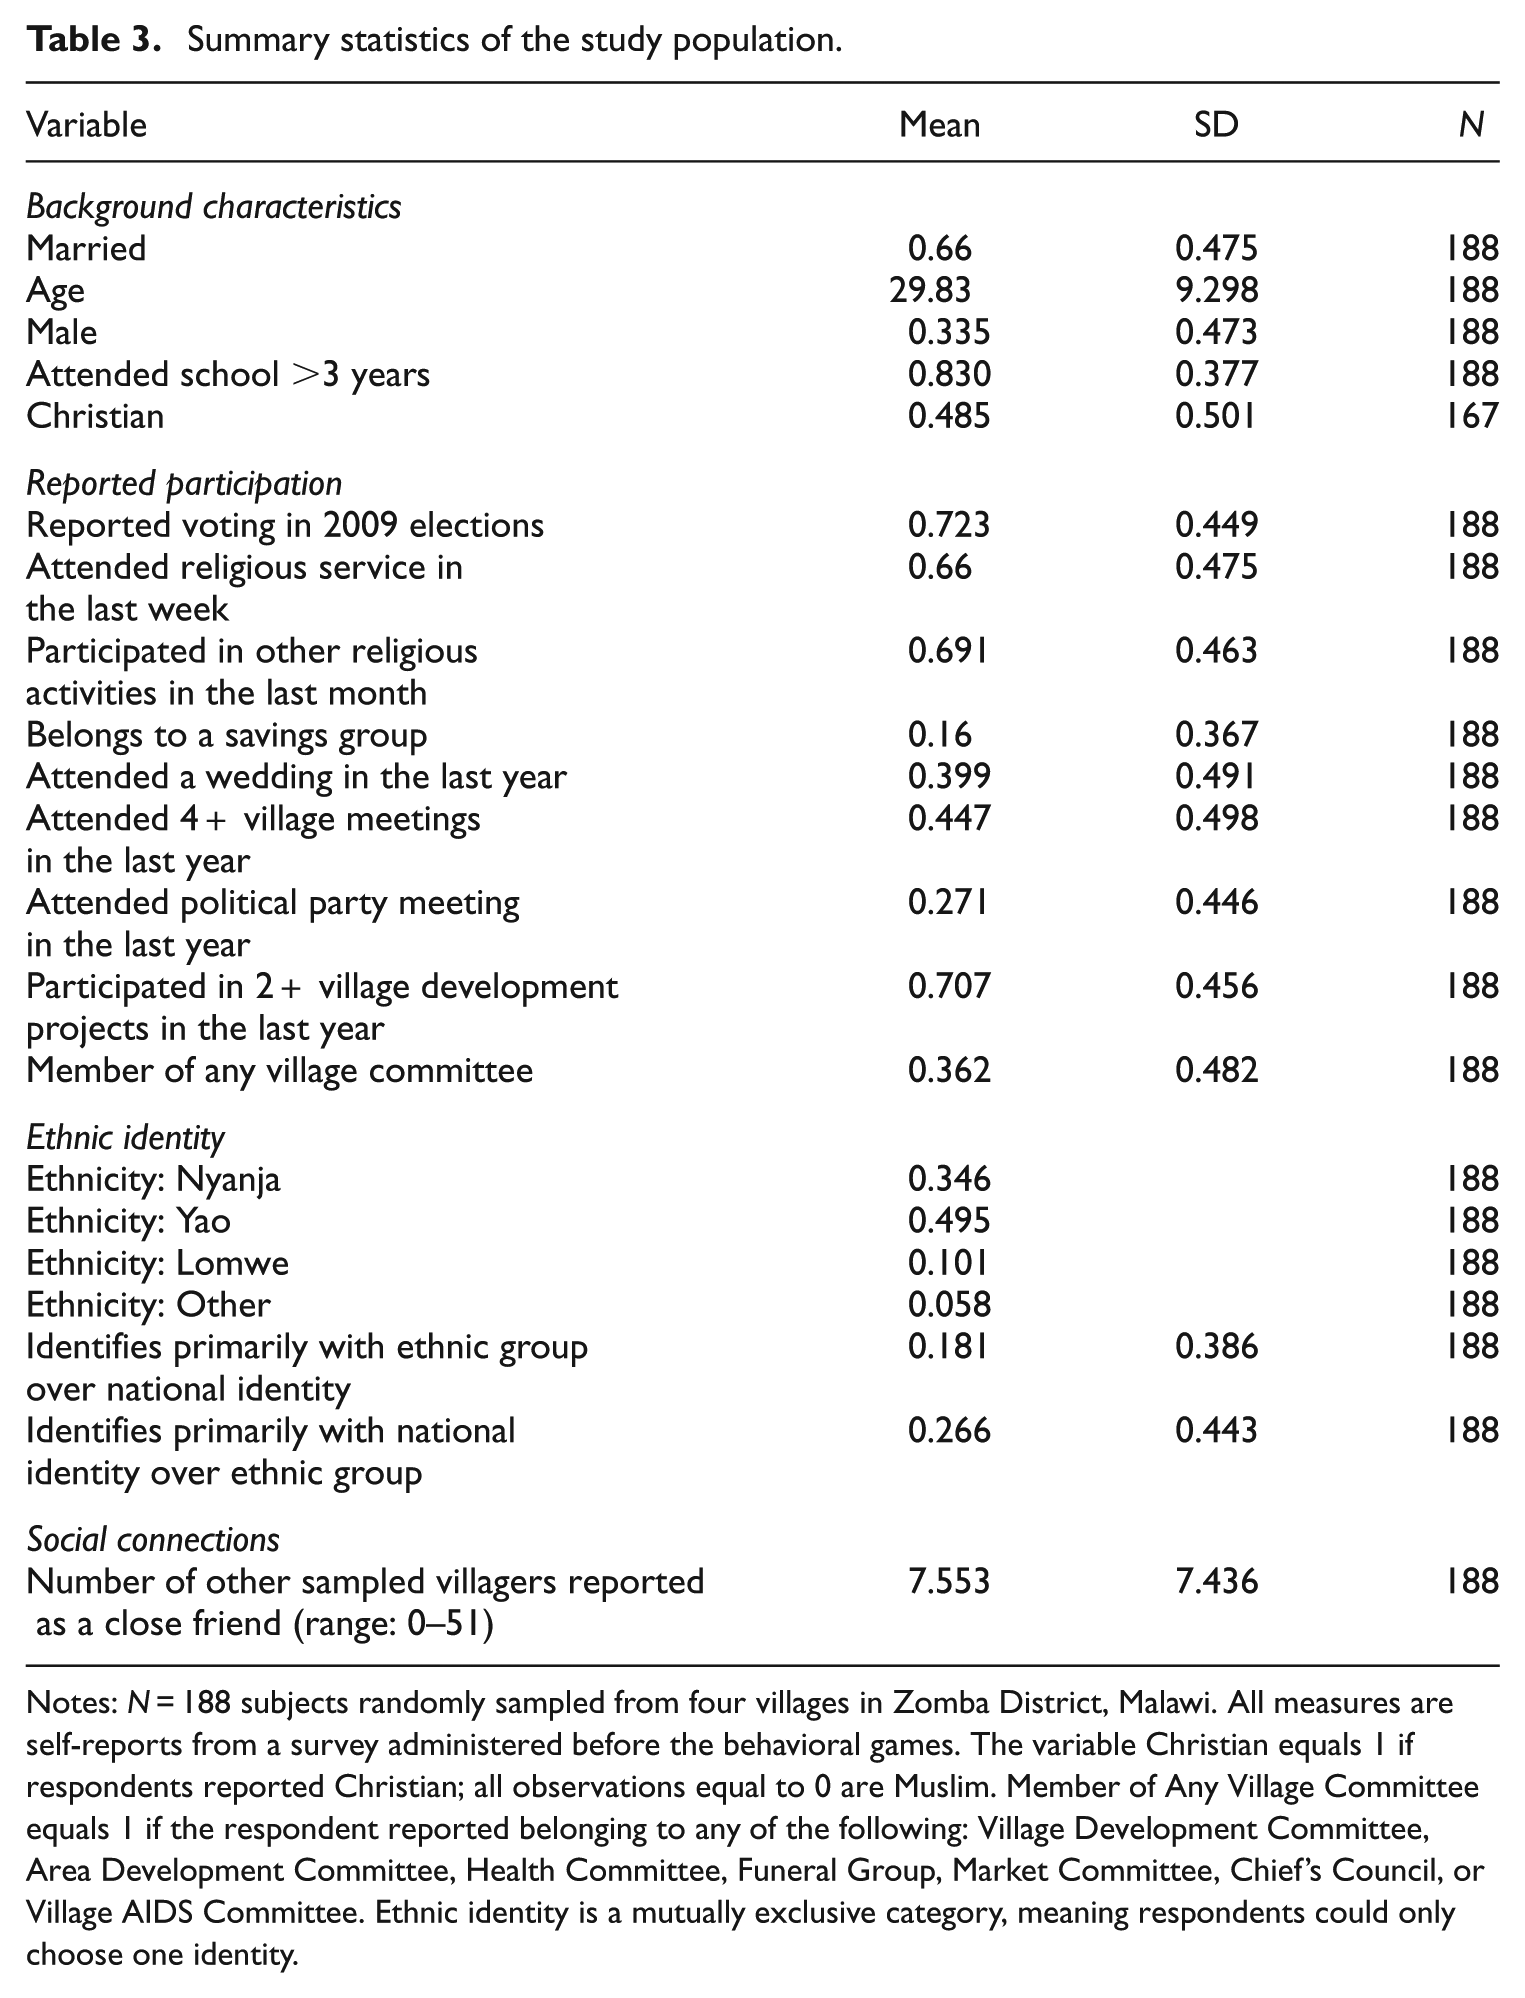
Notes: N = 188 subjects randomly sampled from four villages in Zomba District, Malawi. All measures are self-reports from a survey administered before the behavioral games. The variable Christian equals 1 if respondents reported Christian; all observations equal to 0 are Muslim. Member of Any Village Committee equals 1 if the respondent reported belonging to any of the following: Village Development Committee, Area Development Committee, Health Committee, Funeral Group, Market Committee, Chief’s Council, or Village AIDS Committee. Ethnic identity is a mutually exclusive category, meaning respondents could only choose one identity.
The survey captured data on recent participation in social activities such as voting, religious activities, village committee participation, attendance at weddings, funerals and village meetings, and participation in local development projects. Most of the sample (72%) reported having voted in the most recent presidential and parliamentary elections held in 2009, and more than a third report belonging to a village committee, suggesting these populations are active in civic life at the local and national levels.
The survey included questions about the respondent’s ethnic identity and their opinions related to their ethnic group that were previously tested and fielded in the most recent round of the Afrobarometer. 15 In addition to asking self-reported ethnic identity, respondents were asked whether they identified more with their ethnic identity than their national identity. 16 In the 2008 wave of the Afrobarometer, 14.9% of rural Malawians identified with their ethnic identity more than their national identity and 56.8% of rural Malawians identified with their national identity more than their ethnic identity. In this study, those proportions are 18.1% and 26.6%, respectively. It is unclear whether this large difference is because the present study’s sample is not representative of rural Malawians more generally (since this study was limited to Zomba district and the Afrobarometer has a nationally representative sample) or because of a temporal shift. The data suggests ethnicity is more salient in the study’s sample at the time of data collection (2011) than measured nationally in the run-up to the previous election.
On average, respondents reported to be close friends with seven other people in their village randomly selected into the sample. The modal respondent marked five other villagers.
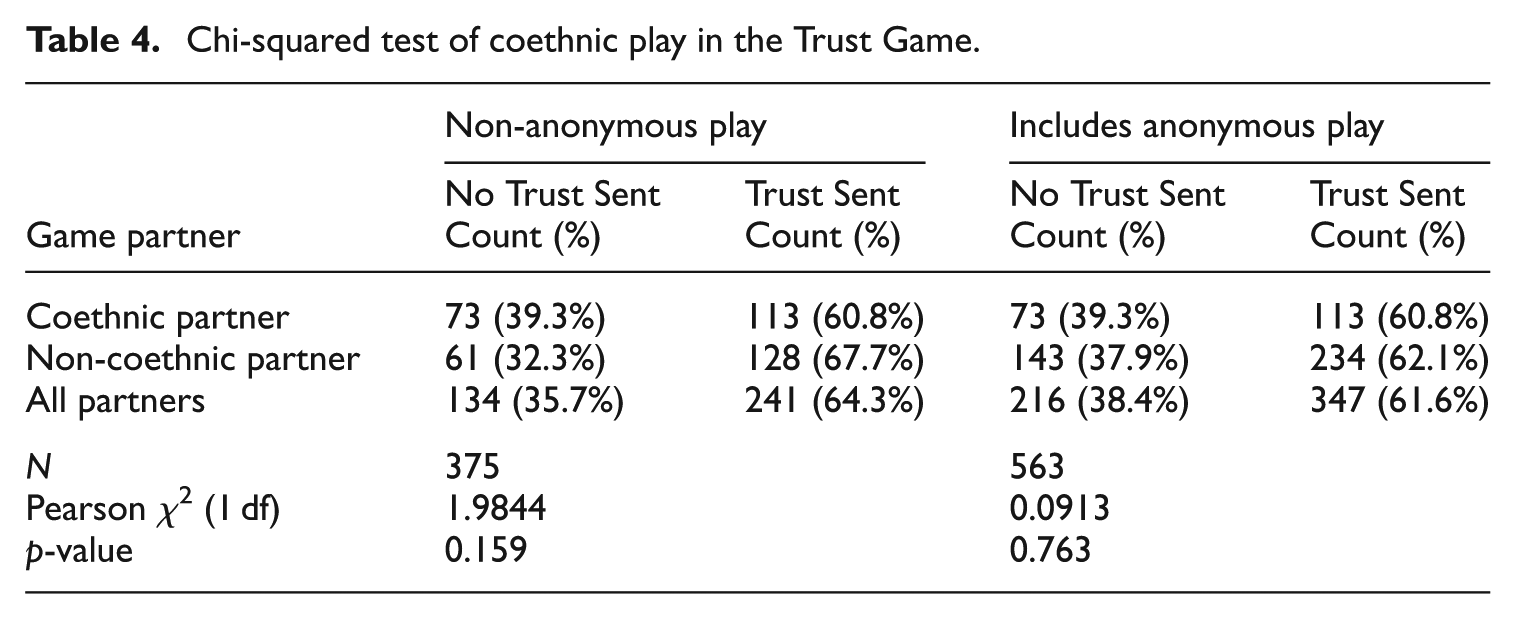
In the 375 games where the partner was not anonymous, almost half (186) were played between coethnics. Recall that in all non-anonymous play, trust was sent 64% of the time. In non-anonymous play between coethnics, trust was sent 60% of the time. However, a chi-squared test indicates there is no statistically significant relationship between coethnicity and trust sent (see Table 4). Including anonymous play (and coding anonymous partners as not coethnic) does not substantially change the outcome.
Chi-squared test of coethnic play in the Trust Game.
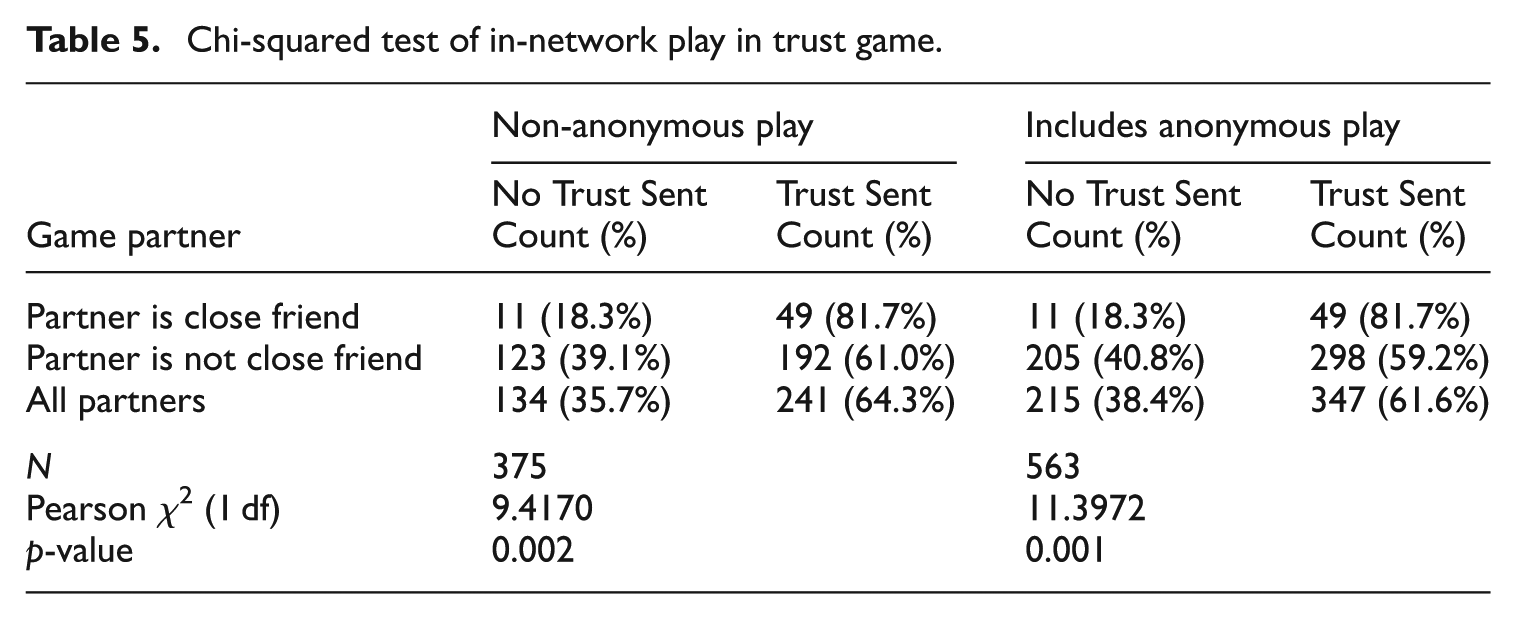
In the 375 non-anonymous games, 60, or 16%, were between players where the sender (Subject A) reported the receiver (Subject B) to be a close friend. When subject A reported Subject B was a close friend, Trust was Sent 82% of the time (see Table 5). A chi-squared test indicates the difference between in-network and out-of-network play is statistically significant (p = 0.002). Including anonymous play (and coding anonymous partners as not a close friend) does not change the outcome.
Chi-squared test of in-network play in trust game.
The next step in the analysis estimates multivariate models of the decision to trust. Table 6 presents logit regressions where the dependent variable is Trust Sent. Models 1 and 2 include ethnic group fixed effects and Models 3 and 4 include village fixed effects. The social connectedness measure, ‘Partner is a close friend’, achieves statistical significance in all models, with an odds ratio of about 3. We can interpret this value to mean that when a subject is matched to play the trust game with someone whom they consider a close friend, the odds are 3 to 1 that the subject will send the receiver money. The coethnicity odds ratio is always less than 1, which can be interpreted that the odds are greater that a subject playing the trust game with a coethnic partner will not send money than if a subject were playing with a partner of a different ethnicity. However, the coethnic variable only achieves statistical significance in one of the four models (Model 4).
Trust Sent as a function of sender and pair characteristics.
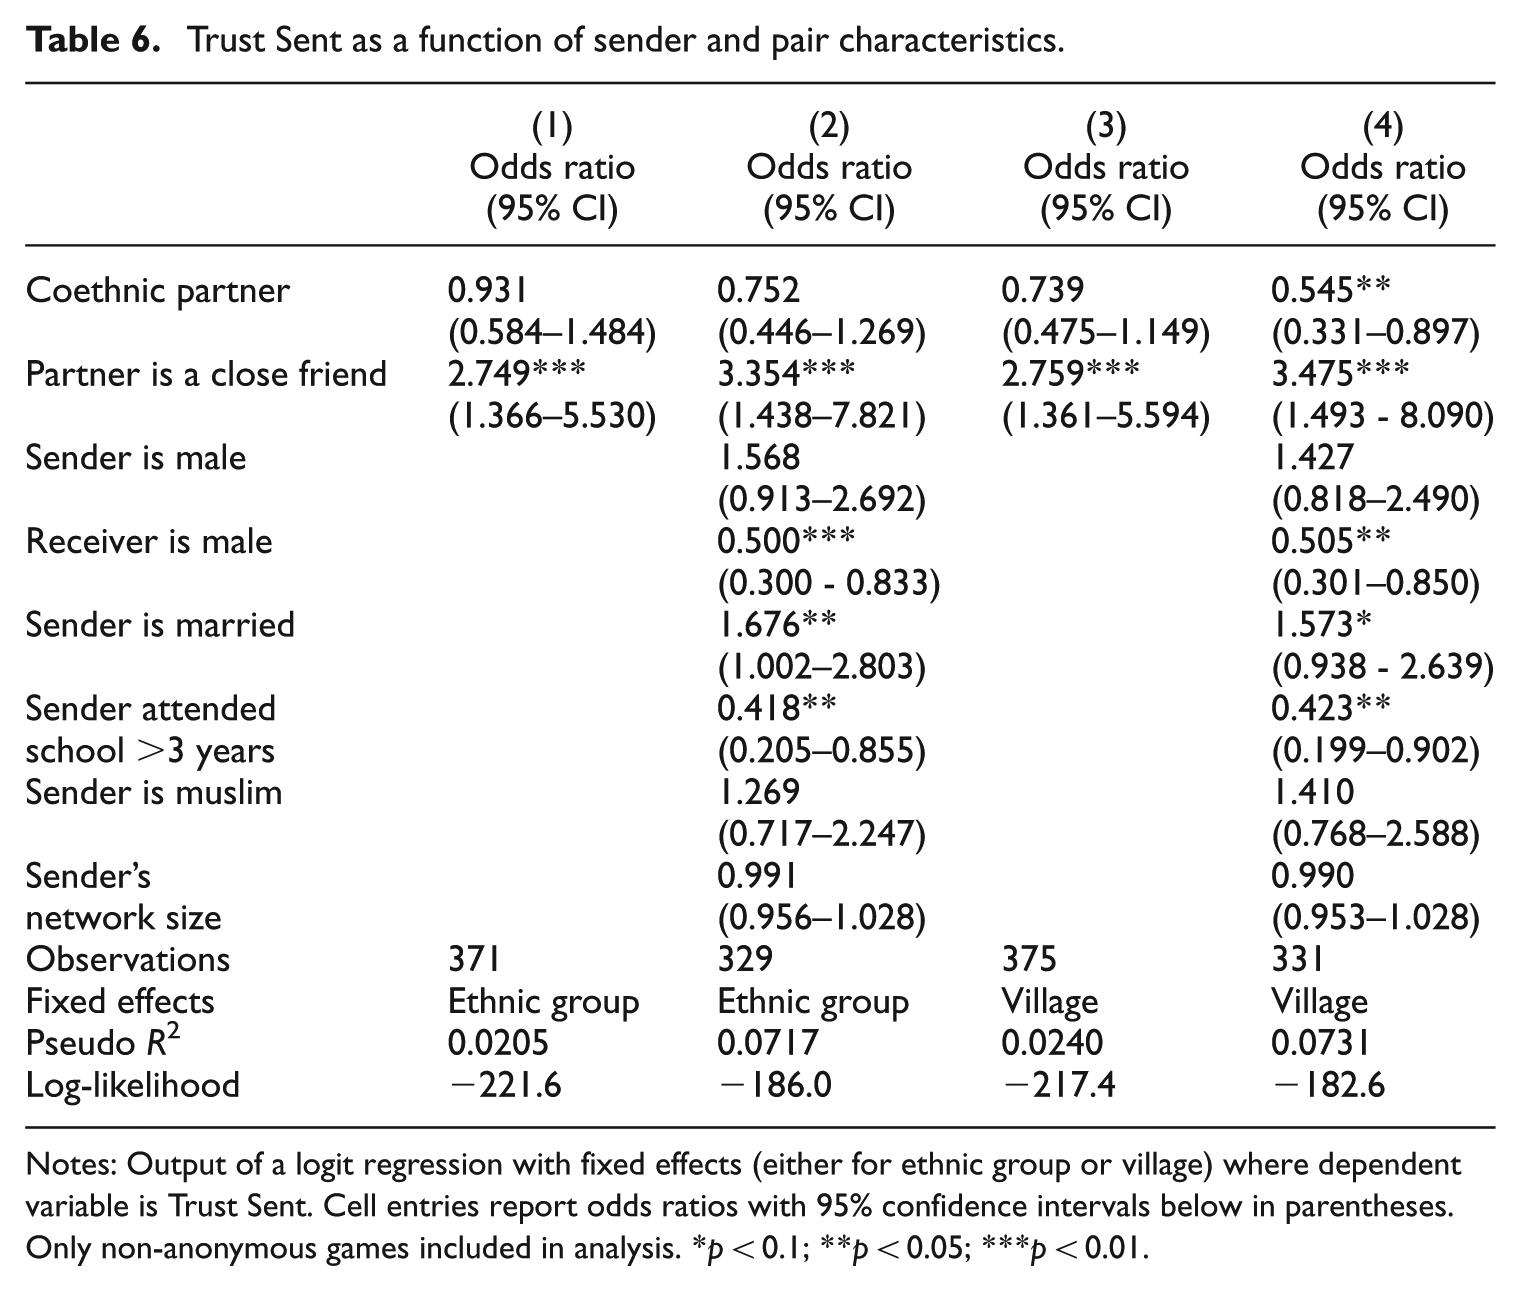
Notes: Output of a logit regression with fixed effects (either for ethnic group or village) where dependent variable is Trust Sent. Cell entries report odds ratios with 95% confidence intervals below in parentheses. Only non-anonymous games included in analysis. *p < 0.1; **p < 0.05; ***p < 0.01.
Sender characteristics included as controls did not always achieve statistical significance, but two variables deserve some additional attention. A married sender has increased odds of sending money in a trust game than an unmarried sender. Also, senders with more than three years of schooling have lower odds than those with less schooling for sending money in the trust game.
5. Discussion
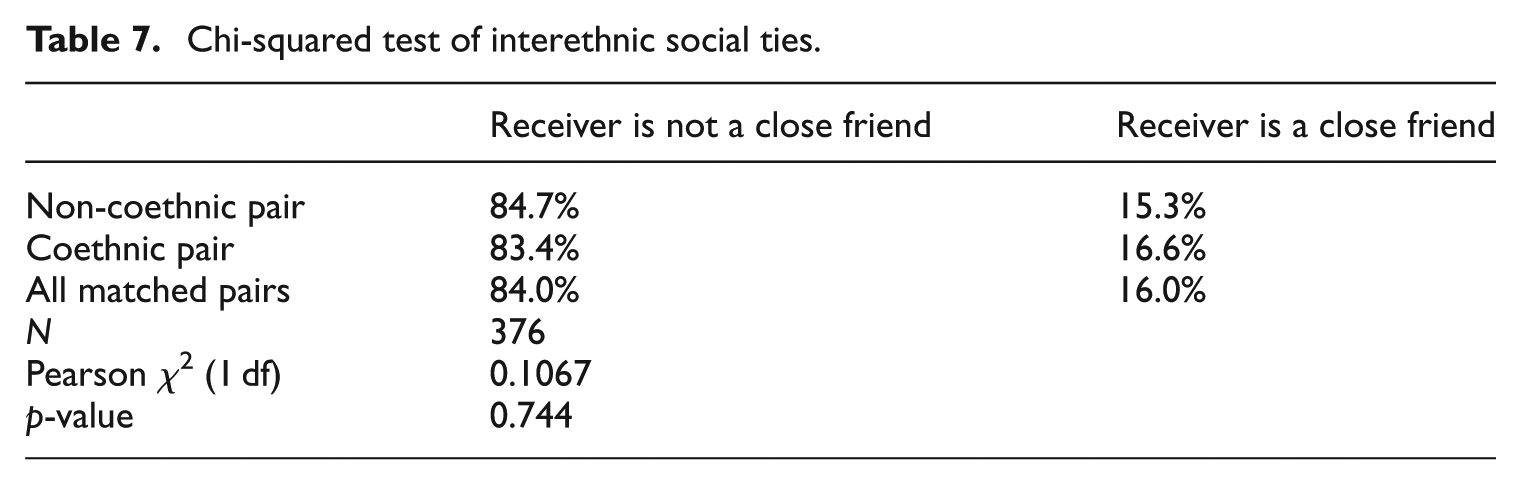
One might attribute the ‘close friend’ effect on trust as masking a ‘coethnic’ effect on trust, especially if we expect that close friends are more likely to be coethnics. However, in our sample, players were just as likely to report non-coethnics as close friends as they were to report coethnics as friends. As noted earlier, 16% of non-anonymous trust games were between players where the sender reported the receiver as a close friend. Let us call these ‘close friend’ games. Splitting all games played by whether players shared ethnicity, we find that 15.3% of non-coethnic paired games and 16.6% of coethnic paired games were ‘close friend’ games: these differences are not substantively nor statistically significantly different from each other (see Table 7). In other words, even if we only examine the match-ups in the one-shot, non-anonymous trust games, cross-ethnic social ties are almost as likely as social ties between coethnics.
Chi-squared test of interethnic social ties.
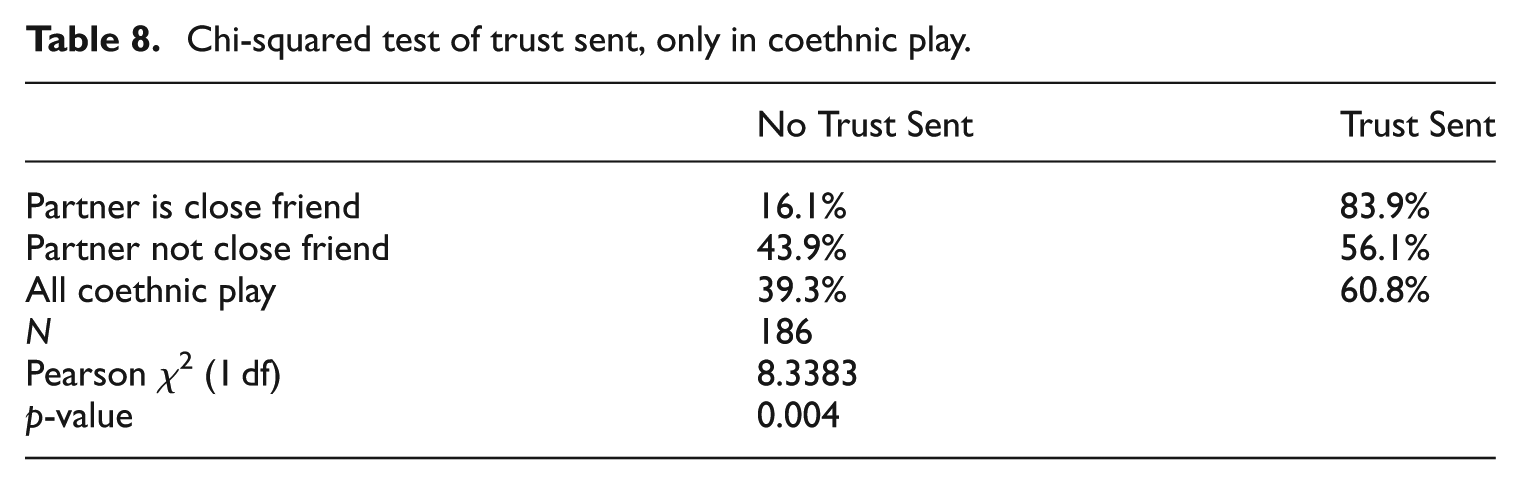
Almost half (186) of all trust games were played between coethnics and we can also examine the ‘close friend’ effect in this subsample of games. In only coethnic play, trust was sent 84% of the time when the receiver was a close friend, and only 56% of the time when the receiver was not a close friend. These differences are statistically significant (see Table 8).
Chi-squared test of trust sent, only in coethnic play.
Of the 375 non-anonymous games played, in 315 games the sender did not report the receiver was a close friend; trust was sent in 61% of these games. In this subset of games played between players who were not close friends, senders gave trust slightly less frequently to coethnic (56%) than non-coethnic (65%) receivers (see Table 9). These differences reach marginal statistical significance (p = 0.084), and are substantively not dramatically different from overall play in this subset of games.
Chi-squared test of play in trust game, by relationship.
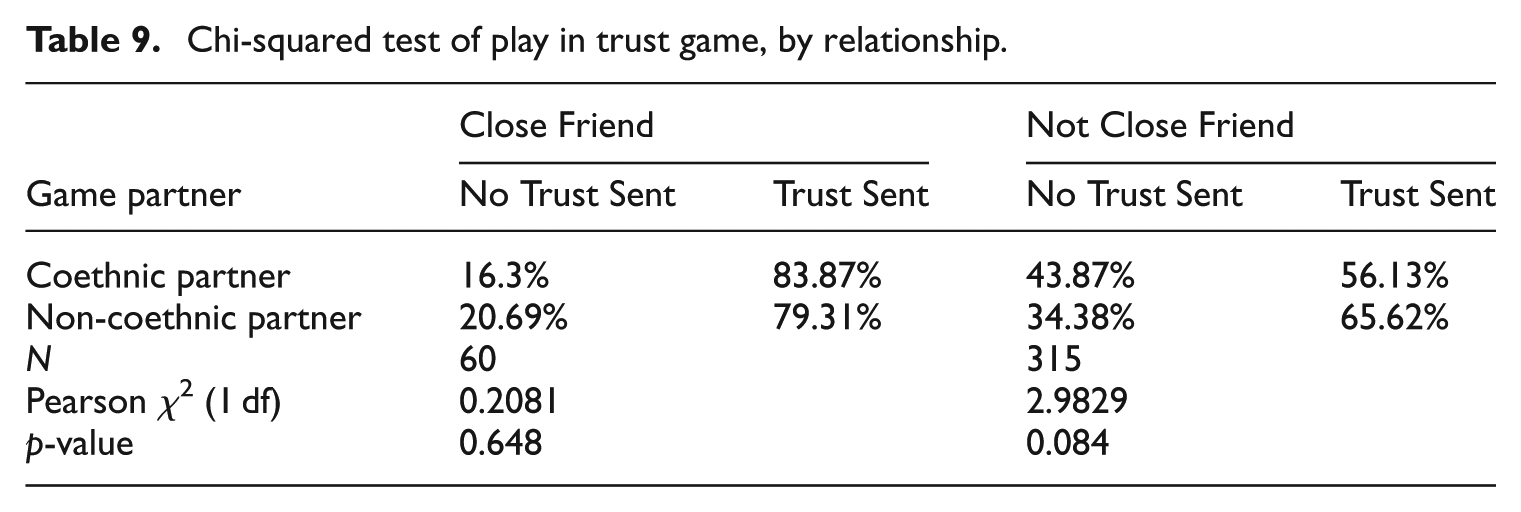
There were many fewer ‘close friend’ games: only 60, a subsample too small to have much confidence in comparing outcomes between subgroups in this subset. But looking at these 60 games (also in Table 9), there was very little difference in how often trust was sent to the receiver dependent on whether the match-up was coethnic. In ‘close friend’ games, trust was sent to a coethnic partner 84% of the time and to a non-coethnic partner 79% of the time.
One might expect the present study’s population, drawn from rural Africa, rather than urban Africa, is driving the results. However, other studies using behavioral economics experiments conducted in rural Africa have found evidence of a coethnic trust advantage (see for example, in Malawi, Robinson (2014)). 17 The present study differs from other studies in rural African settings in the likelihood of players knowing their co-players. Partly, this is due to the present study’s scale: we examined play in behavioral economics experiments within villages whereas most previous research analyzes play in larger scale populations either between villages (Robinson, 2014) or within large, urban neighborhoods (Habyarimana et al., 2009). 18 It could be that cross-ethnic social ties are more likely in rural than urban areas. That idea alone generates debate as scholars often assert that rural villages have high degrees of ethnic homogeneity (e.g. Posner, 2004). Even if ethnic homogeneity existed in rural areas in the past, rural-to-rural migration and intermarriage could have created more ethnically diverse and socially connected rural populations. In the fieldwork conducted for this study, it was impossible to identify a near-homogenous study village, even with the assistance of census data on ethnicity specified at the level of census enumeration area (which can be as small as three villages).
6. Study limitations
This study only uses one behavioral game to measure cooperation: the trust game. Other measures such as play in a public goods game, actual contributions to public goods, or survey measures of trust (including expectations of how others will play) could provide additional insight on how communities overcome collective action problems. Such measures require greater resources and the benefits in particular for including survey measures of trust are unclear (Anderson et al., 2004; English, 2011; Glaeser et al., 2000).
The study also used only one measure of social networks: self reports of whether Subject A considered Subject B a close friend. With more time and resources, future research could get a greater variety of network data, including information on ‘weak ties’ (i.e. acquaintances) to see whether the strength of relationship between players impacts cooperative behavior, or more comprehensive data from villages to ascertain network structure to see whether individuals from tight-knit or open communities demonstrate more cooperative behavior.
The study did not capture data on subjective coethnicity, but instead relies on an assumption that players will accurately guess their partners’ ethnicities. Habyarimana et al. (2007) asked their study subjects to guess the ethnicities of other study subjects, incentivizing respondents with cash rewards for ‘correct’ guesses. Their measure of ‘subjective coethnicity’ would act as a manipulation check. In a setting as interactive as a rural village, it is unclear how necessary such a manipulation check would be.
7. Conclusion
Using surveys, social network data, and behavior in the trust game, this paper studied the relative impact of coethnicity and social connectedness on whether subjects ‘trusted’ their partners. A shared ethnic background does not seem to influence how subjects play the trust game, at least in the rural Malawian context. However, playing the trust game with someone reported as a close friend increases the odds a subject will send money in the trust game.
The study has implications for the broader literatures on trust and ethnic diversity. Putnam’s (2007) study of American data indicated ethnic diversity has negative consequences for trust. Given the findings of other studies on ethnic diversity in Africa (Easterly and Levine, 1997; Habyarimana et al., 2007; Miguel and Gugerty, 2005), we might also expect ethnic diversity would undermine trust in Africa. The present study of behavior in a trust game in Malawi provides some evidence that suggests we reconsider the conventional wisdom on ethnic diversity and trust. In the ethnically diverse, rural context of this study, I find that cross-ethnic social ties are just as common as coethnic social ties. The additional finding that social connection is more likely to predict trusting behavior than shared ethnicity suggests we consider broadening the scope of future micro-level research; if we are only hoping to understand trust and cooperation in the African context between anonymous players who do not share day-to-day experiences, then behavioral economics experiments conducted in the continent’s capitals seems reasonable. But if we care to know whether shared ethnicity drives trust, which many theorize also drives development, we should examine behavior in contexts where there is an increased likelihood that research subjects can ethnically identify their counterparts. The present study was purposefully situated in smaller, ethnically diverse villages. 19
Although in Africa 80% of the population is rural, the continent is urbanizing and future research should also consider adding peri-urban samples and urban samples. One of the aims of the present study was to extend the analysis by Habyarimana et al. (2009) to a rural environment, but a direct comparison of the findings between the two studies can only be suggestive as the populations not only differed in urbanity but also country. Future research should include samples from contexts that vary on population density but are within the same country, to allow for controlled comparison.
This paper’s primary contribution is to a small but growing body of scholarship examining potential avenues through which diverse communities can overcome ethnic bias. Robinson (2014) finds that a strong and salient national identity can diminish ethnic barriers to trust in diverse societies. In a related vein, Singh (2010) finds a shared identity, a subjective sense of belonging to a common polity, is the key determinant of public goods provision in a highly fractionalized Indian state. Future research could further examine the connections between people of diverse backgrounds and the supra-identities that would foster such connections.
Footnotes
Acknowledgements
I am grateful to the 188 rural Malawians who agreed to participate in our study, as well as TA Mwambo, TA Kuntumanji, and the four village headmen presiding over the areas in which our study was conducted who permitted us access. Catherine Eckel, Marisa Kellam, Amanda Robinson, and Rick Wilson provided helpful feedback on earlier drafts of this paper, as did participants at seminars at UT-Dallas, the University of Houston, Penn State University, and Smith College. I am also grateful to the editors and two anonymous reviewers for helpful comments and suggestions. Thanks go as well to Lynn Hancock, Augustine Harawa, Hastings Honde, Charity Chisale, Peace Mbewe, Kondwani Munthali, Paul Mwera, Victor Phiri, Cameron Wimpy, Goodson Yobe, and IKI-Malawi for assistance in collecting the data analyzed here. Peter Loewen and Greg Eady contributed to some of the data collection. All errors are my own.
Declaration of Conflicting Interests
The author(s) declared no potential conflicts of interest with respect to the research, authorship, and/or publication of this article.
Funding
The author(s) disclosed receipt of the following financial support for the research, authorship, and/or publication of this article: This work was supported by Texas A&M University grants from the Program in Scholarly and Creative Activities and Department of Political Science.