
Abstract
While previous research has explored how performance data can influence organizations and considered the factors that shape public managers' use of performance data, we know less about the way in which individual bureaucrats respond to performance information. Considerable research illustrates the power of peer information in a variety of contexts, including energy use, voting, and charitable giving. We suggest that public employees may adjust their behavior in response to information about how their performance compares with their peers. Providing peer information to public employees allows for learning. If alerted to an unflattering comparison, public employees might be motivated to alter their behavior. Using the case of administrative law judges in the Social Security Disability programs, we find evidence that is consistent with the expectation that individual bureaucrats respond to peer information. This study provides insight into whether and how public managers can harness the power of peer information.
Due to improvements in data collection and information techniques, governments are now able to gather vast amounts of quantitative information about public organizations and personnel (Lavertu, 2015). As early as 1939, Herbert Simon recognized the power of comparative data to improve performance. Since then public management scholars have explored the importance of comparisons in decision-making and factors that shape public managers' use of performance information (see Ammons and Roenigk, 2015; Andersen and Moynihan, 2016; Bjørnholt et al., 2016; Grossi et al., 2016; Moynihan and Pandey, 2010; Olsen, 2015). Furthermore, a growing body of research considers the way in which comparative performance data affects how work in the public and private sectors is performed (see Bastedo and Bowman, 2010; Fowles et al., 2016).
However, most of these studies have research designs at the organizational or managerial level rather than at the level of individual front-line employees. These studies do not provide direct evidence that front-line employees are responsive to comparative information because our ability to infer individual-level behavior from aggregate data is limited. Organizations can change for reasons other than the behavior of front-line employees. They can change because top managers hire new people, create new programs or reorganize. Studies at the front-line employee level are needed to understand the usefulness of comparative data for managers wanting to influence the behavior of those they supervise.
In this paper, we explore the ways in which individual bureaucrats respond to information about peers' behavior. Using the case of Administrative Law Judges (ALJs) in the Social Security Disability programs, we test the hypothesis that the behavior of individual bureaucrats will be shaped by the availability of peer information. The case of ALJs is a good case to study comparative performance information because Social Security Administration (SSA) managers are limited, like many managers in the public service, in their ability to attach financial benefits to performance data. Consequently, a study that focuses on ALJs allows us to examine the association between the availability of peer information and case processing behavior in the presence of minimal financial rewards.
We find evidence that is consistent with our hypothesis, showing that the case processing behavior of ALJs appears to respond to the introduction of a peer information system. This suggests that public managers, when appropriate, might be able to harness the power of peer information to influence the behavior of public employees. Given that strong material incentives are often problematic in public organizations (see Heinrich, 2007; Rainey, 1983), particularly at the individual level, this research provides important insights to managers regarding their tools for directing employee behavior.
Power of comparative data
Several studies exist that highlight the importance of comparative data for decision-making. Citizens' evaluations of policy and government performance are influenced by organizational/government comparisons (Hansen et al., 2015). Olsen (2017), for example, compares the effect of social reference points (i.e., information about the performance of other organizations) and historical reference points (i.e., information about the past performance of an organization) on citizens' evaluations of government performance, finding that social reference points are more meaningful for citizens' evaluations. Furthermore, public managers are more likely to seek out information about the performance of their agencies when that data allows for comparisons. For example, Andersen and Moynihan (2016) find evidence that school principals in Denmark were more likely to pay attention to information about performance when provided with information about how their school compared with others.
Responsiveness to peer information
In addition to the power of comparative information in shaping attitudes and attention, evidence exists that organizations change their behavior in response to comparative performance information such as organizational rankings. For example, Bastedo and Bowman (2011) find that college rankings affect tuition fees; and Fowles et al. (2016) show that universities use rankings to establish their identities (also see Espeland and Sauder, 2007). These findings about college rankings are noteworthy in that they show the power of comparative information even when that information is based on reputational data from opinion surveys. 1 However, as mentioned earlier, studies showing organizational change following the publication of comparative information leaves unanswered the question of whether public managers can use comparative performance data as a tool to change the behavior of the individuals they supervise.
Research on individuals outside the public service suggests that comparative performance data should be a powerful tool. There is an extensive literature on the power of peer effects in the workplace, meaning that what peers are doing affects an individual's behavior. Researchers also find that the ability to directly compare performance increases productivity. For example, studies show that working alongside more productive peers makes individuals more productive (see Kaur et al., 2010; Mas and Moretti, 2009). Similarly, individuals in organizations with higher absenteeism miss more days of work themselves (Ichino and Maggi, 2000). Within the literature, there are a number of reasons suggested for peer effects in the workplace and other contexts. Working alongside a productive peer, for example, might activate an intrinsic competitive drive. Additionally, if an employee is less productive than their peers, this might lead to an individual being stigmatized by the group. Moreover, there might be a lower risk of punishment if an employee is performing the same as others. Given this scholarship, we know that peer effects are present in the workplace. Much of this research, however, focuses on peer effects from physical proximity. In many types of jobs, especially in the public sector, employees often do not work side-by-side.
While less focused on the workplace, a related literature explores the power of peer information to change the behavior of target populations. Policies that provide peer information seek to bring about change in behavior by harnessing the power of peer effects (Thaler and Sunstein, 2009). This work focuses specifically on providing individuals with peer information and seeing if this information affects their behavior. Comparative information can be effective in changing behavior because it creates “descriptive norms” that communicate what type of behavior is appropriate (Goldstein et al., 2008). There is evidence of the effects of peer information in many different areas, including voting, charitable giving, energy use, etc. (see Bond et al., 2012; Bursztyn et al., 2014; Frey and Meier, 2004; Schultz et al., 2007). For example, when individuals were given information that a higher proportion of their peers donated to a charitable fund, they were more likely to do so (Frey and Meier, 2004). Similarly, Goldstein et al. (2008) find that hotel guests are more likely to act in environmentally conscious ways when informed of their peers' environmentally conscious behavior. And, informing college students of the percentage of their peers who smoke, which is often less than assumed, was associated with a reduction in smoking (Linkenbach and Perkins, 2003). Governments have also used the power of peer information to encourage more people to pay taxes. Individual taxpayers given information that a very high percentage of taxpayers pay what they owe are more likely to comply with tax payments (Coleman, 1996).
Importantly, there is also evidence that the framing of the peer information is meaningful. In a study of energy use, Schultz et al. (2007) find that when households were informed about their own energy use, as well as the average for their neighborhood, both high and low users altered their energy use so that it was closer to the average. While decreasing energy use of high users was desirable, increasing use among low users was not. However, low energy users' increasing use was mitigated when they were given an approving message about their current energy use. This indicates that the way in which peer information is framed might affect the response to it.
Following this logic, we suggest that front-line public employees should also be responsive to peer information. After all, as Wilson (1989) notes, bureaucrats are highly affected by their peers within their agency. We suggest that public employees who are given information about their peers' behavior will change their behavior to be more in line with that of their peers. This should especially be the case if the information is framed in a way to signal that behaving like one's peers is valued. Bureaucrats' behavior can be difficult to observe, not only for managers but also for peers. Access to peer data provides a clear signal about one's behavior relative to others—information that a bureaucrat might not otherwise have. By gaining access to information about peer behavior, public employees can learn about how their behavior compares to that of their peers. Importantly, they might learn that their behavior differs from the norm, which might encourage them to change.
As such, we contend that bureaucrats might be motivated to adjust their behavior if they are given peer information that suggests an unfavorable comparison to peers, especially if the information is framed such that being more similar to peers is viewed as desirable. As noted above, performing in ways that are out of line with peers might lead to changes for a variety of reasons, such as a desire to avoid sanction, the activation of an intrinsic competitive drive, a desire to perform better, or a desire to conform to norms.
Of course, whether or not individual front-line bureaucrats think being similar to peers is a positive trait will depend on what is being measured. In cases where bureaucrats are confronted with information that reveals that their behavior deviates from that of their peers but in a way that is applauded by their agency, we might not expect them to alter their behavior to reflect organizational norms. An employee who is an outlier in her agency on a measure that is unequivocally desirable may not want to be more like her average colleagues (though, there can be pressure to be more like the group if someone is viewed as “wrecking the average,” producing more than social norms had dictated). On the other hand, in many cases deviating from norms may suggest that the front-line employee is not behaving appropriately. Often public employees engage in tasks with trade-offs (Carpenter, 2002). Consequently, scoring very high or very low on a particular performance measure may indicate inappropriate performance. Possible examples include a number of arrests per police officer, number of clients approved for benefits by caseworkers at state welfare offices, and number of “A” or “F” grades by public school teachers.
However, there are some reasons to remain skeptical that public employees will be responsive to peer information as a performance tool. This is because public managers, compared to those in the private sector, do not have as much power to use material incentives to reward high performers or punish poor performers (Heinrich, 2007). Members of the civil service also have greater job protection than people in the private sector. This likely reduces the impact that comparative peer information has through evoking fears of punishment or expectations for reward. Furthermore, research on peer effects more generally suggests that while people are likely to change their behavior in response to peer effects when the desired change is consistent with their ideology, they are less likely to change when it is not (Castro and Scartascini, 2015; Costa and Kahn, 2013). Therefore, we might expect bureaucrats to be unresponsive to peer information if bureaucrats do not view management efforts to make bureaucrats change as legitimate. Changing the behavior of bureaucrats is extremely difficult because of the importance of standard operating procedures and culture (Wilson, 1989).
Thus, studies are needed that examine the effects of comparative peer information in the public sector. We address this question using data on case processing of ALJs in the Social Security Disability program. This is a useful case to examine this issue for two reasons. The first reason is that ALJs have greater protection from performance pressure imposed by superiors compared to other types of public employees because of the independence given to them by the Administrative Procedures Act (APA). As will be discussed in more detail later, the APA makes it more difficult for managers to use performance information to penalize or reward bureaucrats. The second reason is that associations representing ALJs in the Social Security Disability program have been particularly hostile to any efforts to measure their productivity. In other words, management efforts to change behavior are viewed with suspicion by many ALJs. For these two reasons, ALJs in the Social Security Disability programs provide a difficult test of the influence of peer information on individual behavior. If we find evidence of effects of a peer information reporting system here, we should be more optimistic about it working in less difficult situations.
ALJs in the Social Security Disability Programs and Peer information
ALJs hear appeals from citizens who are unhappy with the decisions of public agencies regarding their applications for benefits or government decisions to impose regulatory sanctions. Over 80% of federal ALJs (approximately 1500) adjudicate claims in the Social Security Disability programs. Generally, ALJs in the SSA hear appeals from claimants who were denied either Social Security Disability Insurance (SSDI) or Supplemental Security Income (SSI) at the state agency level. Both programs provide cash benefits for people unable to work due to a medical condition. Individual ALJs work in hearing offices located across the country. As will be discussed shortly, the SSA has recently adopted a performance system that uses comparative peer information. However, ALJs also have high levels of independence that may make them less susceptible to efforts to change their behavior.
The relative independence of ALJs
ALJs are an interesting case in which to examine the impact of peer information because they have a high level of legal protection from certain types of performance review compared to the average public employee (SSA Office of Inspector General (SSA OIG), 2012b). The Administrative Procedures Act (1946) sought to ensure that ALJs had the ability to adjudicate claims fairly by giving them some independence from the agencies whose decisions they were reviewing (Lubbers, 1981). For example, Office of Personnel Management regulations “provide that ‘[a]n agency may not rate the job performance of an administrative law judge,’ or grant monetary or honorary awards or incentives to ALJs” (Burrows, 2010). And removal action by an agency against an ALJ can be taken only for good cause determined by the Merit System Protection Board on the record (see Burrows, 2010). Therefore, the material incentive for ALJs to respond to peer information is relatively weak. This is not to say that ALJs can never face disciplinary action; it is simply that a fairly high bar has to be crossed for that to happen. We think that this provides an interesting test of the influence of peer information because it allows us to speak to the power of peer information in the absence of a strong material incentive to comply. If peer information works here, then it might also work for public employees who are less independent but whose managers face similar limitations regarding incentives.
HMID: The performance reporting system
In late 2011, the SSA implemented a new performance initiative. This peer information system, How MI Doing? (HMID), monitors and disseminates information about the productivity, among other things, of individual ALJs. SSA lists the HMID system as one of a number of SSA initiatives “to increase the quality and consistency” of their work (SSA, 2016). The SSA describes HMID as an “analytical tool” providing “real-time management information on the quantity and quality of the employees’ work relative to the rest of their office, their region, and the nation” (SSA, 2016: 15). This tool allows individual ALJs to “view a graphical presentation of their up-to-date individual productivity as compared to others …” (SSA, 2012). Furthermore, HMID provides ALJs with statistics about their productivity over time (SSA OIG, 2014). Using this system, ALJs can “compare their productivity and timeliness metrics to hearing office, regional, or national metrics” (Government Accountability Office (GAO), 2017: 33). This system makes comparative case processing information easily accessible to ALJs. HMID also provides other information on performance, such as accuracy measures and reasons for case remands (GAO, 2017). In interviews with the SSA Office of the Inspector General, regional and hearing office managers indicated that “some of their ALJs used HMID” (SSA OIG, 2017b: 9). 2 Importantly, both ALJs and their managers can view the information in HMID. It can help managers monitor productivity (SSA OIG, 2014). In interviews with the GAO, regional chief judges, who are regional managers, indicated that they “generally found ‘How MI Doing?’ to be a helpful tool” (GAO, 2017: 33).
SSA also started posting raw ALJ productivity data online a little before the introduction of HMID; 3 this data can serve as a complement to the HMID system. Anyone who has an interest can calculate the national average (or other statistics) and see the extent to which each ALJ is deviating from it. This should serve to enhance the effect of peer information by providing additional pressure to conform to norms. The combination of the HMID system giving ALJs direct, real-time access to peer information and the online data allowing ALJs (and others) to compare ALJs should facilitate the effects of peer information.
This performance reporting system could potentially influence the behavior of bureaucrats by providing information and giving feedback. When ALJs see how their performance compares to that of other ALJs, they can self-regulate without further intervention by SSA. While we are not aware of SSA explicitly stating publicly how it wants ALJs to use the HMID system, this system is often discussed in SSA Inspector General reports and the congressional hearing testimony of SSA officials as a tool for ALJs to compare themselves to their peers, suggesting that SSA administrators think that this kind of comparison is valuable. This system is also discussed as a tool for overseeing workload, allowing SSA to monitor outliers (SSA OIG, 2012b, 2014).
The SSA is under pressure to reduce outliers in both directions when it comes to case processing. There is pressure to increase dispositions in order to reduce the backlog at the appeals level; 4 since late 2007, SSA has had a stated ALJ productivity goal of 500–700 case dispositions a year. However, in addition to pressure to reduce the backlog, there is also pressure to do this while making decisions consistent with program rules. Policymakers are concerned that ALJs deciding an extremely large number of cases are more likely to rule in favor of claimants erroneously. Some evidence exists that denying cases is more time consuming than allowing them (Ohlemacher, 2013; SSA OIG, 2014, 2017a). Members of Congress have signaled that they find abnormally high dispositions problematic (US House of Representatives Committee on Oversight and Government Reform, 2014).
At least one SSA Inspector General report, which was in response to a congressional inquiry, focused on high disposition and allowance outliers, making outlier status salient among ALJs (SSA OIG, 2014). With the rollout of the new HMID system, it is reasonable to think that SSA leadership desired to rein in outliers in both directions—ALJs with extremely low dispositions in order to help with the backlog and ALJs with extremely high dispositions to reduce errors in decisions potentially caused by ALJs deciding cases too quickly.
As such, we hypothesize that ALJs who are deviating from agency norms in their number of dispositions will conform to a greater extent after the implementation of the HMID system.
5
In other words, after the introduction of HMID, ALJs who are outliers in case processing in 1 year will deviate from the mean to a lesser extent the next year compared to before HMID. Under this hypothesis, after they are easily able to compare their behavior to that of their peers through HMID, ALJs who are outliers in 1 year should adjust their behavior to fall closer to the mean of their peers the next year.
Research design
To test the expectation that the introduction of the performance reporting system is associated with conforming in the case processing behavior of ALJs, we use data on ALJ dispositions from FY 2008 to 2014. HMID was adopted in August 2011. Therefore, this date range includes years prior to the adoption of HMID and years that follow its adoption. We begin our analysis with 2008 data to hold constant SSA's implementation of its productivity goal of 500–700 dispositions a year. For 2010–2014, we use ALJ disposition data that is available on the SSA website. 6 For 2008–2009, we use ALJ disposition data that we obtained from the SSA through a Freedom of Information Act request.
We exclude ALJs with dispositions below 200 in the current or previous year and ALJs in their first year of employment in the current or previous year from our analysis. SSA Office of Inspector General reports that analyze dispositions often exclude ALJs with fewer than 200 dispositions (see SSA OIG, 2012a). ALJs with dispositions below 200 are thought to have lower case processing numbers because they likely worked only part of the year or had other responsibilities. Figure 1 presents graphs of ALJ dispositions over time; the graphs include all ALJs with over 200 dispositions and who are not in their first year. The left graph shows the distribution of dispositions by year and the right graph shows the mean and median of dispositions by year. As illustrated by the left graph, the distribution of dispositions is tighter toward the end of the time series, and the average and median number of dispositions decrease toward the end of the time series as well.
Administrative law judge dispositions by year.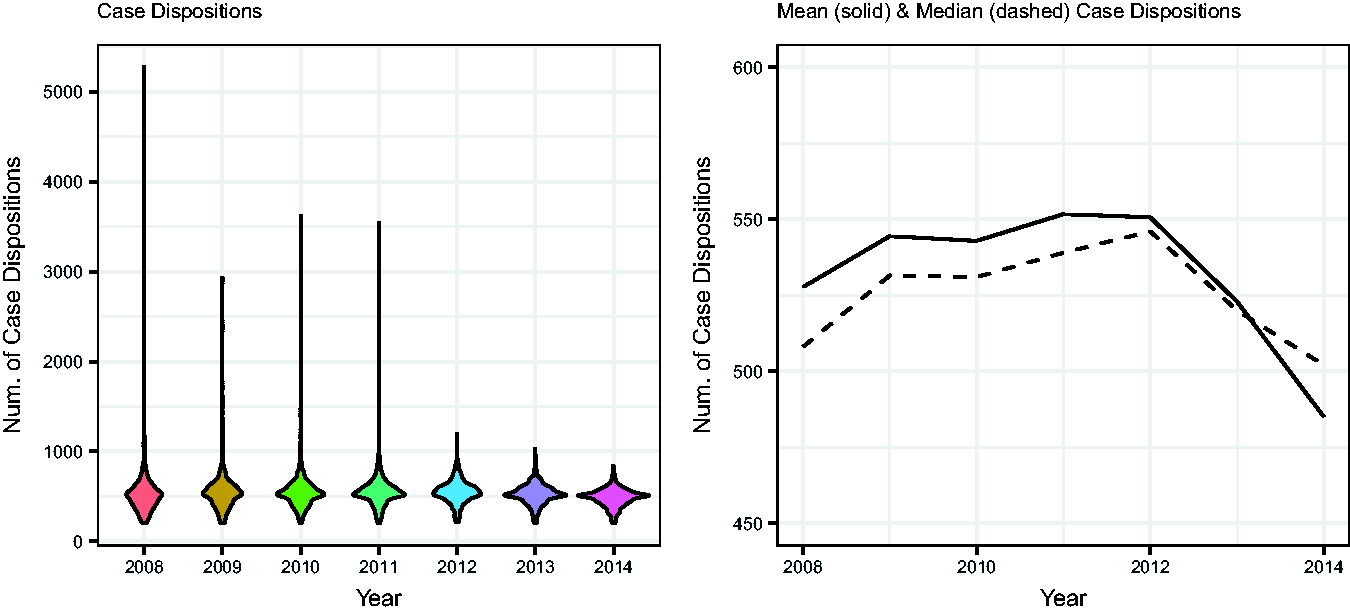
Modeling approach
To test our hypothesis, we estimate linear regression models with fixed effects for ALJ. We use fixed effects to help account for time-invariant ALJ characteristics; the fixed effects can help to limit omitted variable bias. Because we are interested in changes in the association between past behavior and current behavior, one of our variables of theoretical interest is very similar to a lagged dependent variable. We want to consider whether being an outlier regarding case dispositions in the previous year is related to distance from the average number of dispositions in the current year and how that relationship might change with the introduction of the performance reporting system. However, given that we only have a few time points in the models (6 years) and a relatively large number of ALJs (∼1000 each year), the inclusion of both fixed effects and a lagged dependent variable can lead to bias (see Hsiao, 2003; Nickell, 1981). Thus, in order to test our expectation regarding the effect of the performance reporting system on ALJ disposition behavior, we subset the data based on disposition outlier status in the previous year. This allows us to estimate the relationship between the introduction of the program and deviation from the average number of dispositions for different groups of ALJs without including a measure of whether an ALJ's disposition number in yeart–1 was an outlier. This avoids including a variable closely related to a lagged dependent variable. We show models for ALJs who were high outliers in the previous year (i.e., their number of dispositions were relatively high in the previous year), low outliers in the previous year (i.e., their number of dispositions were relatively low in the previous year), and non-outliers in the previous year (i.e., their number of dispositions were neither relatively high nor low in the previous year). 7
To capture whether an ALJ was an outlier regarding her number of dispositions in the previous year, we code a few separate measures for high and low disposition outliers. First, we code “outliers.” Low disposition outliers are defined as ALJs who are below the 25th percentile in number of dispositions in the previous year. High disposition outliers are ALJs who are above the 75th percentile in number of dispositions in the previous year. We use the 25th and 75th percentiles as cut-offs because they include the set of ALJs whose behavior the SSA might seek to change if they want to reduce the backlog of cases and reduce the unintended consequences of hastily made decisions. This range also includes more than just ALJs with dispositions outside the norm to such an extent that their volume of dispositions might elicit an extreme response from SSA or who are fringe actors in their agency. Second, we code “extreme outliers,” with low extreme outliers defined as ALJs who are below the 5th percentile in number of dispositions in the previous year and high extreme outliers defined as ALJs who are above the 95th percentile in number of dispositions in the previous year. These are likely the ALJs with dispositions outside the norm to such an extent that their volume of dispositions might get attention from the SSA leadership. Finally, we also present models that look at outliers in the previous year (i.e., <25th percentile and >75th percentile) with extreme outliers in the previous year (i.e., <5th percentile and >95th percentile) dropped from the analysis altogether.
Dependent variable
The dependent variable for this analysis captures an ALJ's deviation in number of case dispositions from the national mean number of case dispositions. We focus on the national mean, as opposed to the regional or office mean because this seems to be a salient disposition statistic for ALJs. First, much of the intense pressure regarding case dispositions that ALJs face is focused on ALJs who are national outliers. Congress, the SSA leadership, and the SSA Office of the Inspector General look at national numbers and scrutinize those who are outside normal disposition numbers based on national statistics. Second, ALJs can work remotely up to 8 days per month (SSA OIG, 2017c) and many ALJs review cases for multiple hearing offices. 8 These factors may limit the influence of office-specific pressures, and lead ALJs to turn their attention to the national level. 9 We use the directional difference between an ALJ's number of dispositions and the average number of dispositions for a particular year, with negative values indicating difference below the mean and positive values indicating difference above the mean. 10
Independent variables
The key independent variable captures whether the performance reporting system (How MI Doing?) was in place. This program started in August 2011. Thus, we code the performance system variable as a 1 for FY 2012–2014, and a 0 for 2008–2011. Given that we are estimating models on subsets of ALJs, we have different expectations for high and low outlierst–1. For high outlierst–1, we expect the coefficient for the performance reporting system dichotomous variable to be negative and significant, indicating these ALJs' disposition numbers are closer to the mean after the introduction of HMID. For low outlierst–1, we expect the coefficient to be positive and significant, again indicating these ALJs' disposition numbers are closer to the mean after HMID. For non-outlierst–1, we do not expect the introduction of HMID to be associated with distance from the mean.
We account for a few other factors in the models. First, we include a variable for the receipts per ALJ in an ALJ's primary hearing office (lagged by 1 year). 11 If ALJs work in an office that receives a high number of receipts, then they might experience pressure to speed up processing time, disposing of more cases. Additionally, we include two measures of the ALJs' broader environment. We include a measure of state ideology, which corresponds to the state of the ALJ's primary hearing office. We use the nominate version of the state institutional ideology measure from Berry et al. (1998, 2010). 12 Given the potential connection between high numbers of dispositions and allowance rates (SSA OIG, 2012a), ALJs in states with more liberal ideologies might process more cases. We also include a measure of the state's unemployment rate (lagged by 1 year). This variable comes from the Bureau of Labor Statistics. 13 Because unemployment might lead to an increase in claims, some of which might not fall within SSA regulations, there might be a negative association between state unemployment rate and a number of ALJ dispositions, given that denials might take more effort to write.
Given our research design, the idea of regression to the mean is an important issue for us to consider. While we have no reason to think that the regression to the mean process is not taking place, we expect that the introduction of HMID will lead to additional, systematic movement toward the mean. We expect that the disposition numbers of high and low outlierst–1 will be closer to the mean after the introduction of the performance reporting system compared to before. If regression to the mean is continuing on as normal, then it makes sense that the indicator for the introduction of HMID would not be statistically significant, indicating that movement toward the mean number of dispositions after HMID is not statistically distinct from before HMID. However, if the HMID indicator is statistically significant and in the expected direction, then this indicates that there is a distinction between ALJs' difference from the mean number of dispositions before and after HMID, with the difference from the mean being reduced after the introduction of HMID.
Results
Relationship between performance reporting system and deviation from case disposition average.
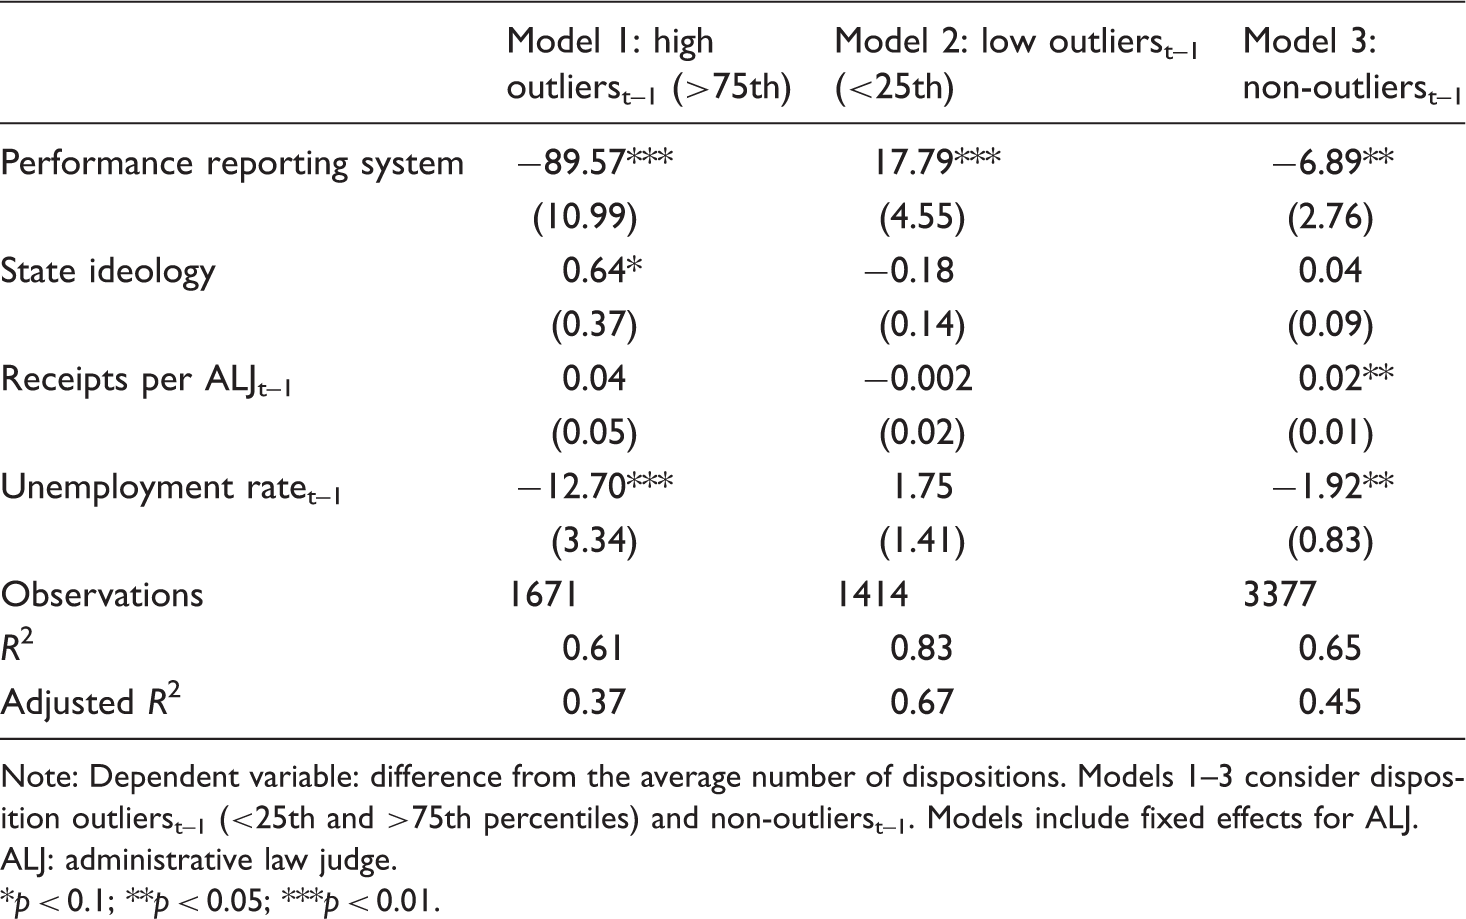
Note: Dependent variable: difference from the average number of dispositions. Models 1–3 consider disposition outlierst–1 (<25th and >75th percentiles) and non-outlierst–1. Models include fixed effects for ALJ. ALJ: administrative law judge.
*p < 0.1; **p < 0.05; ***p < 0.01.
Models with extreme outliers and models excluding extreme outliers.
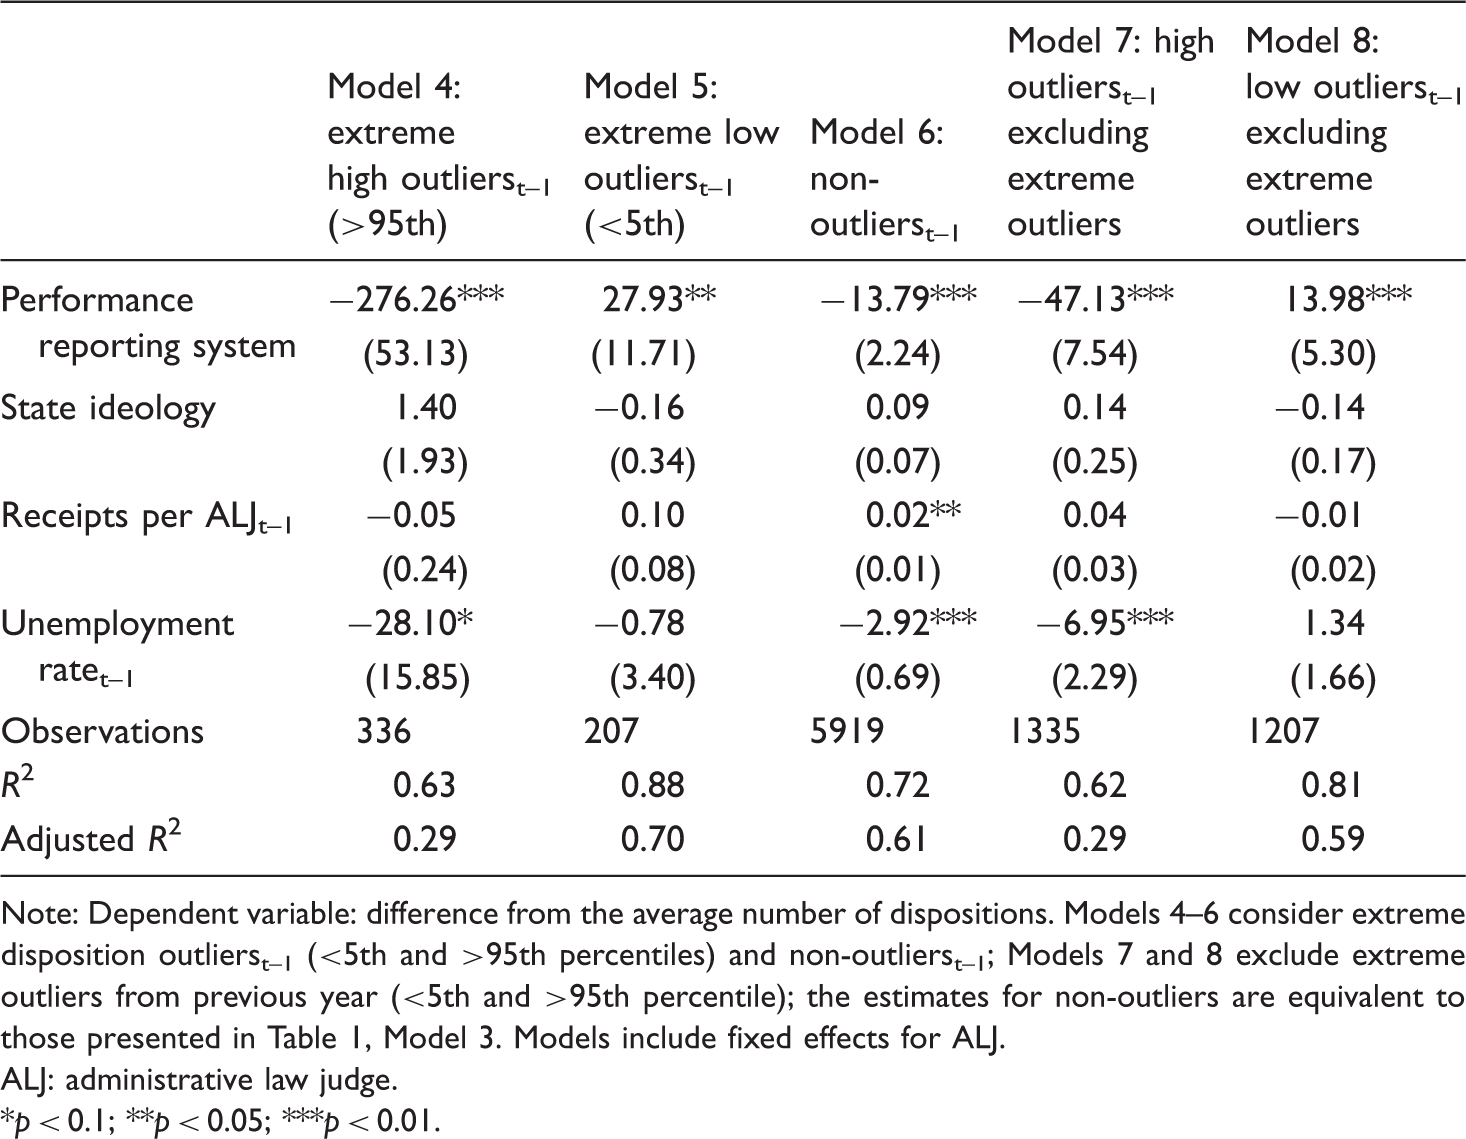
Note: Dependent variable: difference from the average number of dispositions. Models 4–6 consider extreme disposition outlierst–1 (<5th and >95th percentiles) and non-outlierst–1; Models 7 and 8 exclude extreme outliers from previous year (<5th and >95th percentile); the estimates for non-outliers are equivalent to those presented in Table 1, Model 3. Models include fixed effects for ALJ. ALJ: administrative law judge.
*p < 0.1; **p < 0.05; ***p < 0.01.
Considering the estimates presented in Table 1, the negative coefficient for performance reporting system in Model 1 indicates that, for high disposition outlierst–1, the introduction of this system is associated on average with case processing numbers that are closer to the mean by 90. And the positive coefficient in Model 2 indicates that, for low disposition outlierst–1, the introduction of the performance reporting system is associated with case processing numbers that are 18 dispositions closer to the mean. Model 3 indicates that the performance reporting system is also associated with a change in the deviation from the mean for non-outliers. To examine the substantive effects, we show the predicted difference from the disposition average when the performance reporting system is and is not implemented by outlier statust–1 in Figure 2. As noted earlier, we expect the introduction of the performance reporting system will be associated with a decrease in the distance from the average number of dispositions for ALJs who were disposition outliers (high or low) in the previous year. The predicted values based on Models 1–3 are presented in the upper left side of Figure 2. As illustrated, high outlier ALJst–1 are associated with adjudicating 186 dispositions above the average before the performance reporting system and only 96 dispositions above the mean after the performance reporting system. Similarly, low outlier ALJst–1 are associated with adjudicating 132 dispositions below the average before the performance reporting system and only 114 below the mean after the performance reporting system. In contrast, the predicted distance from the mean for ALJs who were not outlierst–1 changed little after the introduction of HMID—from 0.5 below the average before the performance reporting system to 7.4 below the average after the system was put in place. The change in the predicted distance from the mean for high and low outlierst–1 is consistent with the normalizing behavior of keeping disposition numbers closer to the mean after the introduction of the performance reporting system.
15
Predicted difference from disposition average by performance reporting system (95% confidence interval).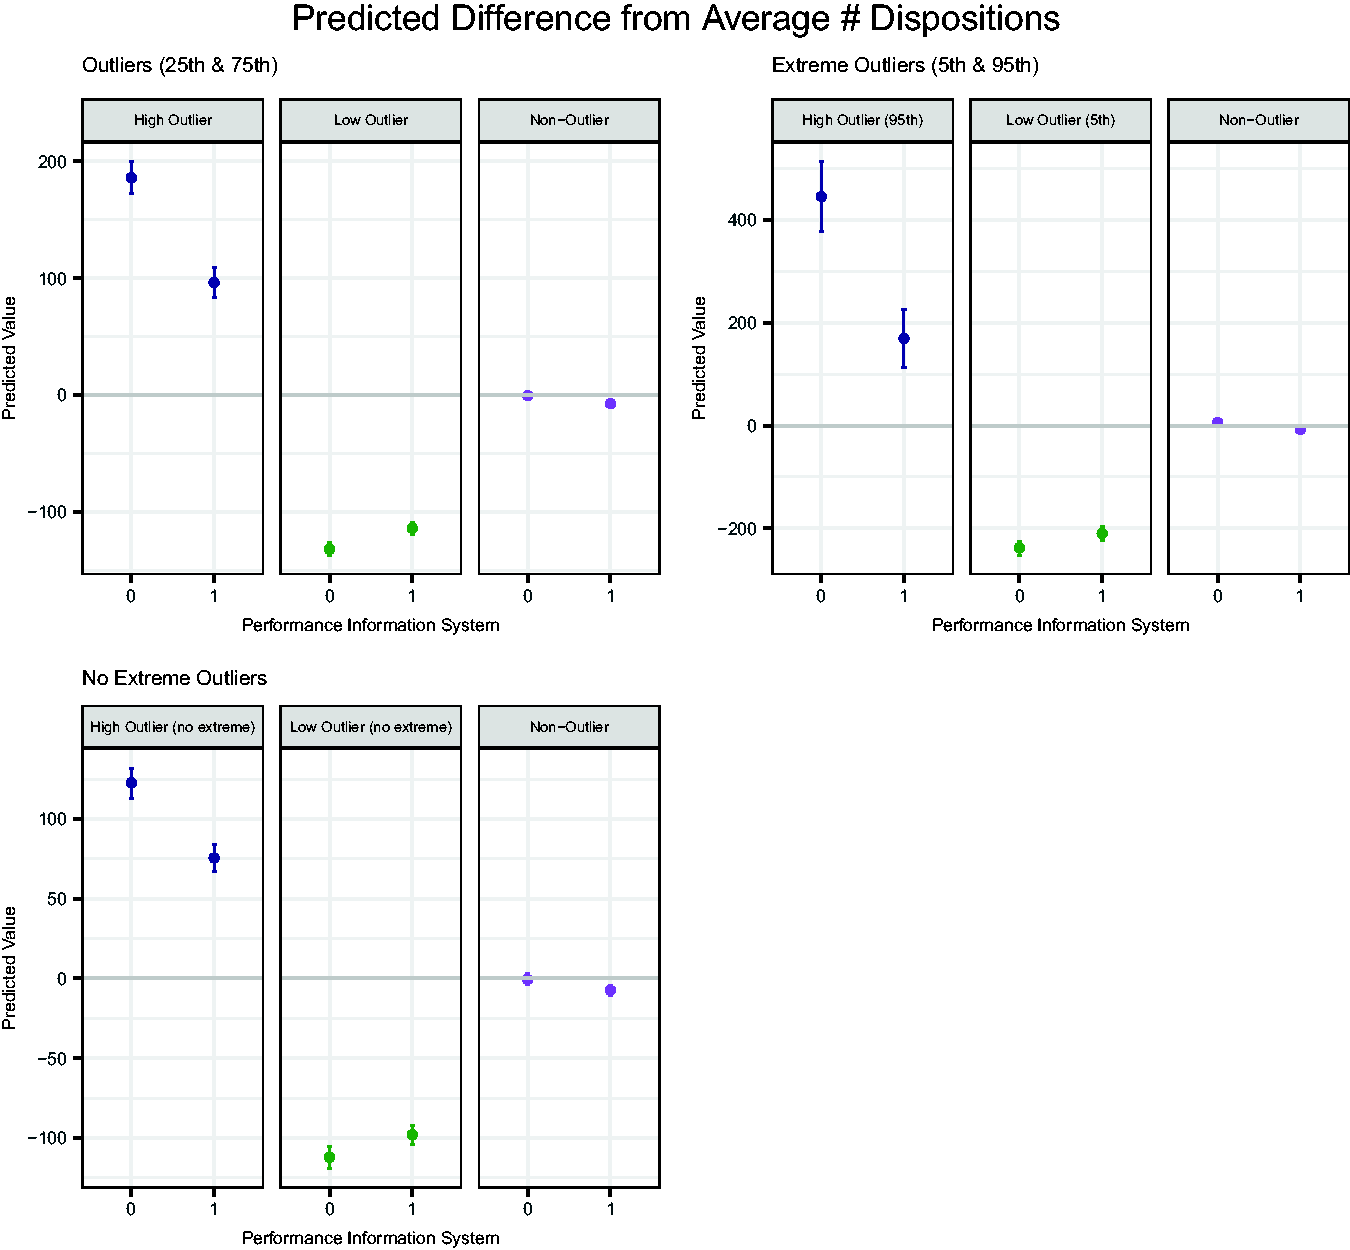
The pattern is similar when looking at extreme outlierst–1 and when extreme outlierst–1 are excluded from the model (Table 2). For extreme high outlier ALJst–1, the performance reporting system is associated with a 276-disposition shift towards the mean (Model 4). For extreme low outlier ALJst–1, the performance reporting system is associated with case processing numbers that are 28 dispositions closer to the mean (Model 5). The performance reporting system is associated with a change in the deviation from the mean for non-outlier ALJst–1 as well (Model 6).
Similarly, when looking at outlierst–1 but excluding the most extreme (<5th percentile and >95th percentile), for high outlierst–1, the performance reporting system is associated with case processing numbers that are 47 dispositions closer to the average; and, for low outlierst–1, the reporting system is associated with case processing numbers that are 14 dispositions closer to the average. These patterns are illustrated in Figure 2, with the predicted values based on the extreme outlier models (Models 4–6) in the upper right and the predicted values based on the models excluding extreme outliers (Models 7, 8, and 3) in the lower left.
In sum, these results offer evidence that is consistent with our expectation. They suggest that outlier ALJst–1 conformed in response to the implementation of the performance reporting system. An ALJ who was either a high or low case disposition outlier in a given year is associated with a smaller deviation from the average in the subsequent year after the implementation of the performance reporting system. This evidence is consistent with the argument that ALJs' case processing reflects conforming behavior after learning how their performance compares to that of their peers. 16
In addition to the implementation of the performance reporting system, there are a couple other factors that are consistently related to the difference from the average number of dispositions. First, unemployment ratet–1 is negatively associated with deviation from the disposition average (Models 1, 3, 4, 6, and 7). This suggests that high unemployment might lead to more claims that do not meet the eligibility requirements for SSDI or SSI, increasing the number of denials, which may take more time to process. Second, the variable for receipts per ALJt–1 is positively associated with distance from average dispositions in the non-outliert–1 models (Models 3 and 6), indicating that workload may have an effect on production in some cases.
Limitations
As with many analyses that rely on time indicators, it can be difficult to determine how much of the effect can be attributed to the intervention. 17 Moving forward, researchers could explore the impact of peer effects on public employees using research designs that can establish causality. However, our evidence is suggestive of a relationship between the introduction of a peer information system and public employee behavior.
Conclusion and implications
In this paper, we explore how peer information can shape the behavior of individual bureaucrats. We examine ALJs' case processing in response to the implementation of a system that allows them to compare their performance to that of their peers. We find evidence consistent with the argument that after the implementation of a performance reporting system, ALJs who are outliers compared to their peers adjust such that their case processing is closer to the average of their colleagues. This result holds even when we exclude the most extreme outliers from the analysis, suggesting that peer information may shape the behavior of public employees even when disciplinary action is less likely.
The fact that we find evidence consistent with peer information effects in a case in which public managers lack the ability to provide bonuses and are limited in other incentives is important. After all, a variety of management reforms have called for the use of material incentives to change behavior (see Osborne and Gaebler, 1992); the potential difficulties of following this recommendation in the real world are well documented (see Heinrich, 2007). We find evidence consistent with the argument that providing information that allows bureaucrats to compare themselves with their peers is associated with conforming behavior even in the absence of strong material incentives. We find that even bureaucrats who are not overly extreme in their deviation from the average are responsive despite the fact that their deviation would likely not motivate the SSA to begin disciplinary actions against them. This suggests that similar to those advocating the use of social norms marketing campaigns to help encourage behaviors like recycling or healthy eating, public managers might be able to harness the power of peer information to motivate bureaucrats to change their behavior by making peer information available to them.
Readers may question whether a study of ALJs, an admittedly atypical type of bureaucrat, has implications outside of agencies like the SSA. We agree that ALJs are atypical among federal bureaucrats in that they have much higher levels of independence, are quasi-judicial, and are particularly hostile to efforts by SSA to influence their performance. However, many of the key ways in which ALJs are different from more typical bureaucrats create biases against finding evidence that comparative performance data is associated with conforming behavior for those whose current behavior is outside the norms of their peers. Evidence of such associations for ALJs offers optimism for comparative performance data in other agencies—effects may be even stronger for other bureaucrats with less independence. Furthermore, our findings for the Social Security Disability programs are also important for public managers in this program, given the historical struggle to manage ALJs without the use of material incentives.
However, it is also important to highlight the potential dangers of using comparative performance information. As with all performance targets, employees can find ways to improve their performance scores without really improving service delivery by manipulating information or focusing just on aspects of performance that are measured. Meeting targets does not necessarily mean that performance improved (Van Thiel and Leeuw, 2002). Furthermore, in light of our results, it is important to point out that the use of peer information as a management tool can potentially backfire in cases where being an outlier suggests high-quality performance. Conforming behavior can lead to mediocre performance (Frederickson and Stazyk, 2010). As discussed above, this is not the case for the number of dispositions made by an ALJ. However, in other cases, very high or low scores on a performance measure can indicate exceptional performance. If comparative information causes top performers to change their behavior to mimic the performance of the average employee, its use will not improve performance.
Still, research on framing and comparative peer information outside of the public sector suggests reasons for optimism. When comparative peer information is provided with a frame that indicates what type of behavior is desirable, there is evidence that the unintended convergence to the mean is mitigated (Schultz et al., 2007). This suggests that managers might be able to frame the information in a way that reduces this type of unintended consequence. But, managers must pay careful attention to the messages they attach to comparative peer information.
Footnotes
Declaration of conflicting interests
The author(s) declared no potential conflicts of interest with respect to the research, authorship, and/or publication of this article.
Funding
The author(s) received no financial support for the research, authorship, and/or publication of this article.