
Abstract
The template method for polymerization has high potential for synthesizing polymer nanotubes, nanofibers, and nanobelts because it controls the diameter and length of the material microstructure. In this study, polyaniline (PANI) nanofibers were successfully prepared with ethyl cellulose as the template. The chemical constituents and crystallinity of the PANI nanofiber samples were investigated by Fourier transform infrared spectroscopy and x-ray powder diffraction. Sample morphology was characterized by scanning and transmission electron microscopy. The size uniformity and electrical conductivity of the PANI nanofibers were also determined. The electrical conductivity of the PANI nanofibers reached up to 13.5 S cm−1 at a hydrochloric acid concentration of 1 mol L−1. The PANI nanoparticles had uniform size, and the PANI nanofibers were disordered. The mechanism of ethyl cellulose as a template for synthesizing PANI nanofibers was also analyzed. This study provides a simple method for synthesizing uniform conductive PANI nanofibers.
Introduction
In materials science, the character of a material is determined by the size, shape, and dimensionality of the material microstructure. Conductive polyaniline (PANI), an important organic semiconductor, has high potential for many practical applications and has thus attracted considerable research attention. Many studies have investigated the preparation and properties of PANI nanomaterials, such as nanospheres, nanofibers, and nanotubes. Compared with common PANI powder, conductive PANI nanostructures exhibit high electrical conductivity, 1 –3 photoconductance and electrochromism, 4,5 elastic modulus, 6 and microwave-absorbing capacity. 7,8 These distinct characteristics of conductive PANI nanostructures have potential applications in sensors, polymer light-emitting diodes, and energy storage. However, synthesizing conductive PANI nanostructures with uniform size and with the desired morphology is difficult.
Various synthesis approaches, such as the hard template, 9 soft template, 10 electrochemical, 11 and other methods, 12 have been developed to fabricate nanostructured PANI. Among these methods, the soft template method is simple and easy to control. This method also does not leave template residue, which would require removal.
Cellulose and its derivatives are used to modify conductive polymers to achieve special functional properties. 13,14 Cellulose and its derivatives are suitable templates for synthesizing nanostuctured conductive polymers because of their distinct supramolecular structure, flexible and oriented molecular structure, intrinsic strength, and stability. For example, gas-sensitive nano-PANI has been synthesized in acetone solution with cellulose acetate as the template. 15,16 Sodium carboxymethyl cellulose has also been used as a polymerization template to synthesize PANI/sodium carboxymethyl cellulose nanorods. 17 A conductive polymer film has been prepared with cellulose as the matrix component 14 and nanocellulose polypyrrole composite was obtained. 18
In this study, hydrophobic ethyl cellulose was chosen as a template for synthesizing PANI nanofibers. Ethyl cellulose was initially dissolved in alcohol. The ethyl cellulose–alcohol solution was then added to the reactor where aniline was being polymerized by current chemical oxidation. The PANI nucleus was adsorbed on the ethyl cellulose surface by the electrostatic force. PANI molecules grew along the ethyl cellulose fibers. Finally, the ethyl cellulose was removed, and PANI nanofibers were obtained. The PANI nanofibers had uniform morphology and a diameter of approximately 40–50 nm. The electrical conductivity of the nanofibers was 13.5 S cm−1. The results of Fourier transform infrared spectroscopy (FTIR) indicated that the template was completely removed and that the product was pure PANI.
Experiment
Materials
Aniline (Beijing Chemical) was distilled under reduced pressure before use. Hydrochloric acid (HCl), ammonium peroxydisulfate ((NH4)2S2O8), and alcohol (Aladdin Chemistry Co., Ltd, Shanghai, China) were used as dopant, oxidant, and solvent, respectively, without further purification. Ethyl cellulose was provided by Kunming Hendera Science and Technology Co., Ltd (Kunming, Yunnan Province, China). Deionized water was used in all experiments.
Preparation of PANI nanofibers
Aniline (0.022 mol) was dissolved in 100 mL HCl (1 mol L−1) under magnetic stirring at room temperature for 1 h. Under the same conditions, (NH4)2S2O8 (0.025 mol) was dissolved in 150 mL HCl (1 mol L−1) under magnetic stirring for 1 h. Ethyl cellulose (0.2 g) was dissolved in 100 mL alcohol. The pH of the ethyl cellulose solution was adjusted to 2 by adding HCl (1 mol L−1) solution. The aniline and ethyl cellulose solutions were then mixed under vigorous magnetic stirring for 5 min. Finally, the (NH4)2S2O8 solution was added to the aniline–ethyl cellulose mixture under magnetic stirring for 3 h. The final solution was immobilized at room temperature for 24 h.
The resultant was filtered several times with acetone, ethanol, and distilled water to remove excess ions, monomers, and ethyl cellulose. The resultant was dried in an electrothermal constant temperature dry box at 50°C for 24 h to obtain dark green PANI nanofiber powder.
Preparation of PANI
Aniline (0.022 mol) was dissolved in 100 mL HCl (1 mol L−1) under magnetic stirring at room temperature for 1 h. Under the same conditions, (NH4)2S2O8 (0.025 mol) was dissolved in 150 mL HCl (1 mol L−1) under magnetic stirring for 1 h. The (NH4)2S2O8 solution was then added to the aniline solution under magnetic stirring for 3 h. The final solution was immobilized at room temperature for 24 h.
The resultant was filtered with distilled water until the filtrate was colorless. The product was then dried in an electrothermal constant temperature dry box at 50°C for 24 h to obtain dark green PANI powder.
Characterization
FTIR spectra were obtained in KBr phase with a Perkin Elmer (RK-1310) FTIR spectrometer (Shanghai, China). X-Ray diffraction (XRD) patterns were recorded with an XD-3 x-ray diffractometer using a CuKα radiation source (λ = 1.5418 Å). The morphology of the PANI samples was investigated by scanning and transmission electron microscopy (SEM and TEM, respectively).
PANI powder or PANI nanofiber samples of 840 mg were pressed into a pellet (10 mm diameter and 3 mm thickness) with a manual hydraulic press at 20 MPa. The electrical conductivity was measured by SX1934B four-probe instrument (Suzhou Telecommunication Factory Jiansu Province, China) at room temperature.
The granularity analysis of the PANI samples were exhibited on LS900 laser granularity analysis apparatus (ZhuHai Omec Technology Co., Ltd, Guandong Province, China). PANI nanofiber sample or PANI power sample of 0.2 g was dispersed in 300 mL ethanol and treated ultrasonically for 30 min before measurement.
Yield of PANI nanofibers
The yield of the PANI nanofibers was calculated according to the following formula:
Results and discussion
Morphology of PANI nanofibers
The low-magnification SEM image in Figure 1 indicates that the synthesized PANI nanofibers had uniform size and shape and lacked organization. The PANI nanofibers had a diameter of approximately 40–50 nm and were intertwined (Figure 1). The TEM image of one PANI nanofiber (Figure 1(b)) suggests that the nanofibers consisted of smaller particles that aggregated regularly.
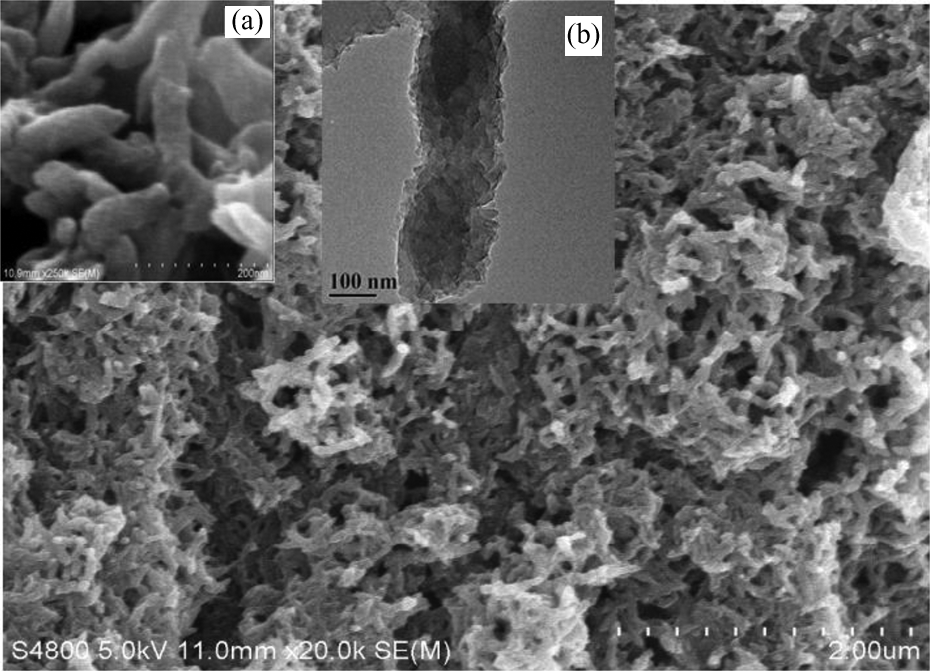
The SEM images of PANI nanofibers. The inset (a) is the high-magnification SEM image of the sample. The inset (b) is the TEM image of one nanofiber. SEM: scanning electron microscopy; TEM: transmission electron microscopy; PANI: polyaniline.
To determine the effect of the template, SEM (Figure 2(a)) and TEM (Figure 2(b)) images of the PANI samples prepared without a template were obtained. The figures show that the PANI samples exhibited a granular texture. The TEM image (Figure 2(b)) confirms the mechanism of the traditional method used to synthesize PANI. 19 With no template, PANI grew from a “core” and developed a granular texture. With a template in the reactant and under electrostatic force (and under the same conditions as without a template), PANI molecule grew along the template. This expansion of aniline polymerization facilitated the synthesis of nanofibers.
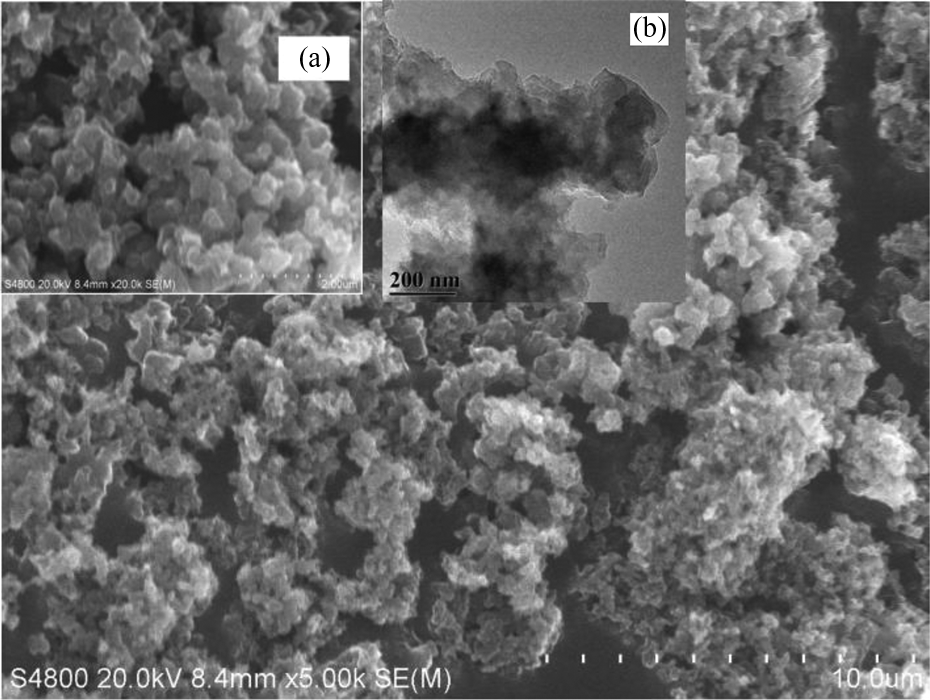
The SEM images of PANI prepared without template. The inset (a) is another magnification SEM image prepared without template. The inset (b) shows a TEM image of the PANI prepared without a template. SEM: scanning electron microscopy; TEM: transmission electron microscopy; PANI: polyaniline.
Molecular structure and characterization of PANI nanofibers
The molecular structure and the crystallinity of the PANI nanofibers were characterized by FTIR (Figure 3) and XRD (Figure 4), respectively, and then compared with that of the ordinary PANI. The curves for the PANI and PANI nanofibers had the same characteristic peaks (Figure 3). The peaks at 1564 and 1477 cm−1 are attributed to the C=C stretching of the quinoid and benzenoid rings. The peaks at 1299 and 1245 cm−1 were due to the N–H bending and asymmetric C–N stretching modes of the benzenoid ring. The band at 1118 cm−1 corresponded to the in-plane bending of C–H. The band at 798 cm−1 is attributed to the out-of-plane bending of C–H. 20 By contrast, the FTIR spectra of pure ethyl cellulose (Figure 3) indicated no ethyl cellulose residue and thus pure PANI nanofibers.
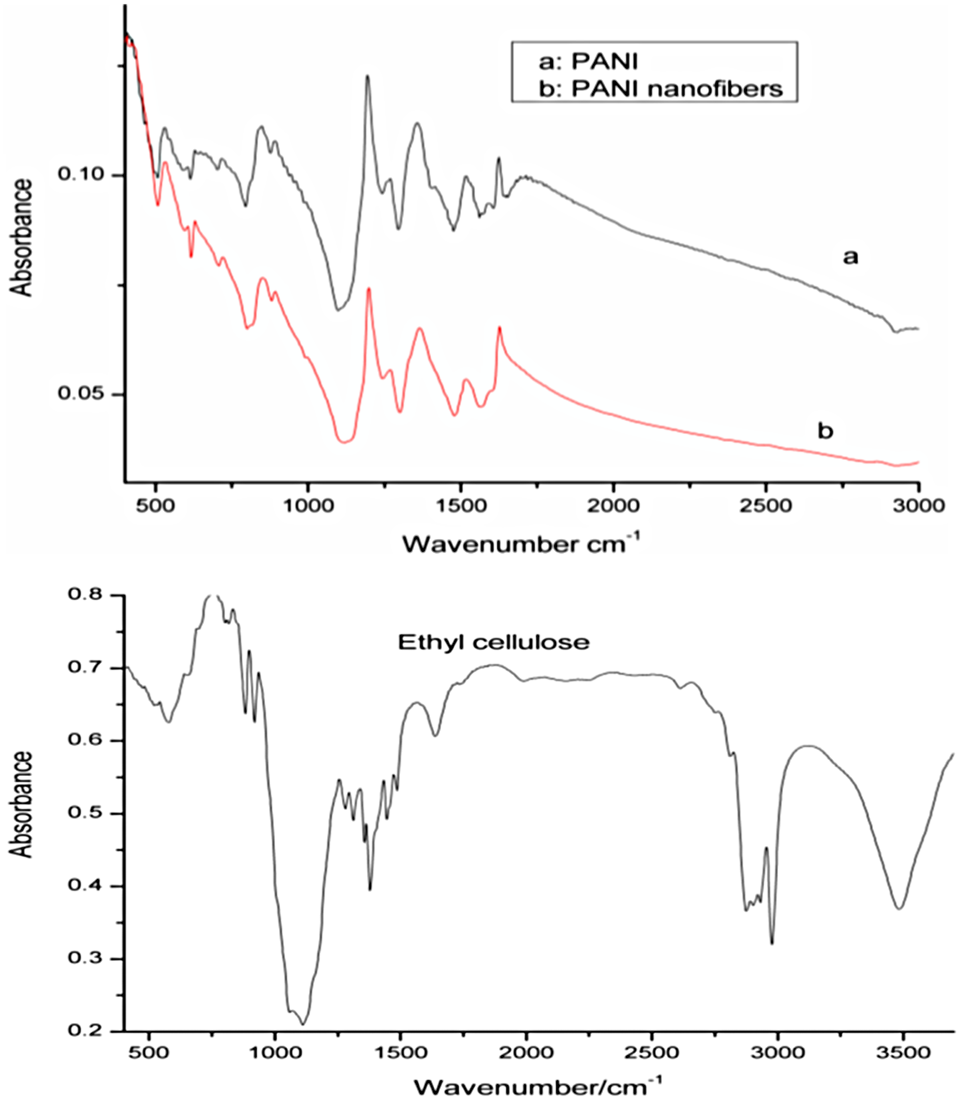
FTIR spectra of PANI nanofibers, PANI prepared without template, and pure ethyl cellulose. PANI: polyaniline; FTIR: Fourier transform infrared spectroscopy.
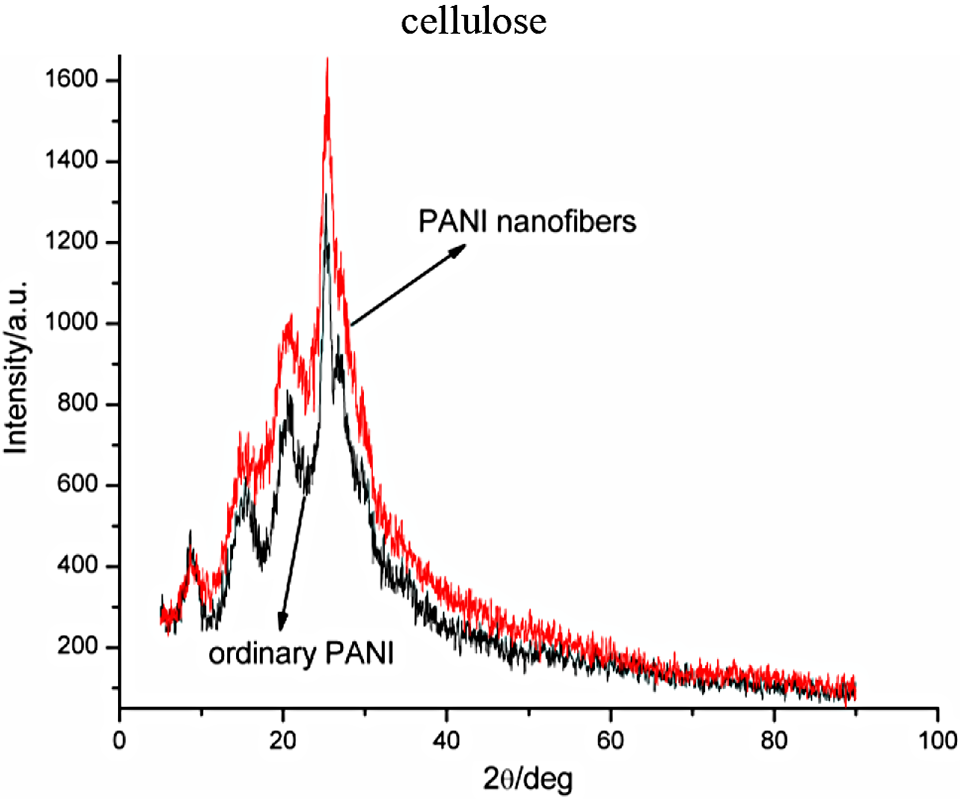
XRD patterns of ordinary PANI and PANI nanofiber samples. PANI: polyaniline; XRD: x-ray diffraction.
Wide-angle XRD patterns of the PANI nanofibers and ordinary PANI powder are shown in Figure 4. The curves for the two samples had four distinct crystalline peaks: 25.53°, 20.74°, 15.52°, and 8.80° (2θθ). The peak at 25.53°, a characteristic crystalline peak of HCl-doped PANI, 21 may be due to the periodicity perpendicular to the PANI chain. Another sharp peak at 20.74° may have been contributed by the periodicity parallel to the polymer chain. 22 The peaks at 15.52° and 8.80° indicated that the primary PANI particle size was approximately 10 nm, 23 similarly evidenced by the TEM image in Figure 1.
The XRD results indicate that the sample of PANI nanofibers has higher relative intensity in the diffraction peaks. The increase in relative intensity in diffraction relate to the higher amount of diffraction planes per unit of volume in the PANI. So, the PANI nanofibers have higher volume fraction of crystalline phases.
Particle size distribution
The PANI nanofibers synthesized with the ethyl cellulose template had uniform dimensionality (Figure 5). The PANI nanofibers obtained under the experimental conditions had a particle size of 3–4 µm; 60% of the particles had a size of 3.3 µm. A comparison of the particle size distribution curves of the pure ethyl cellulose sample and PANI nanofibers revealed that the size distribution of the PANI nanofibers was similar to the template size of ethyl cellulose. This result confirms that the PANI molecules were deposited along the ethyl cellulose template. Meanwhile, the distribution curves of the ordinary PANI sample showed that the particle size of the PANI synthesized by the traditional method changed from 2 to 30 µm. Therefore, the particle size was not uniform.
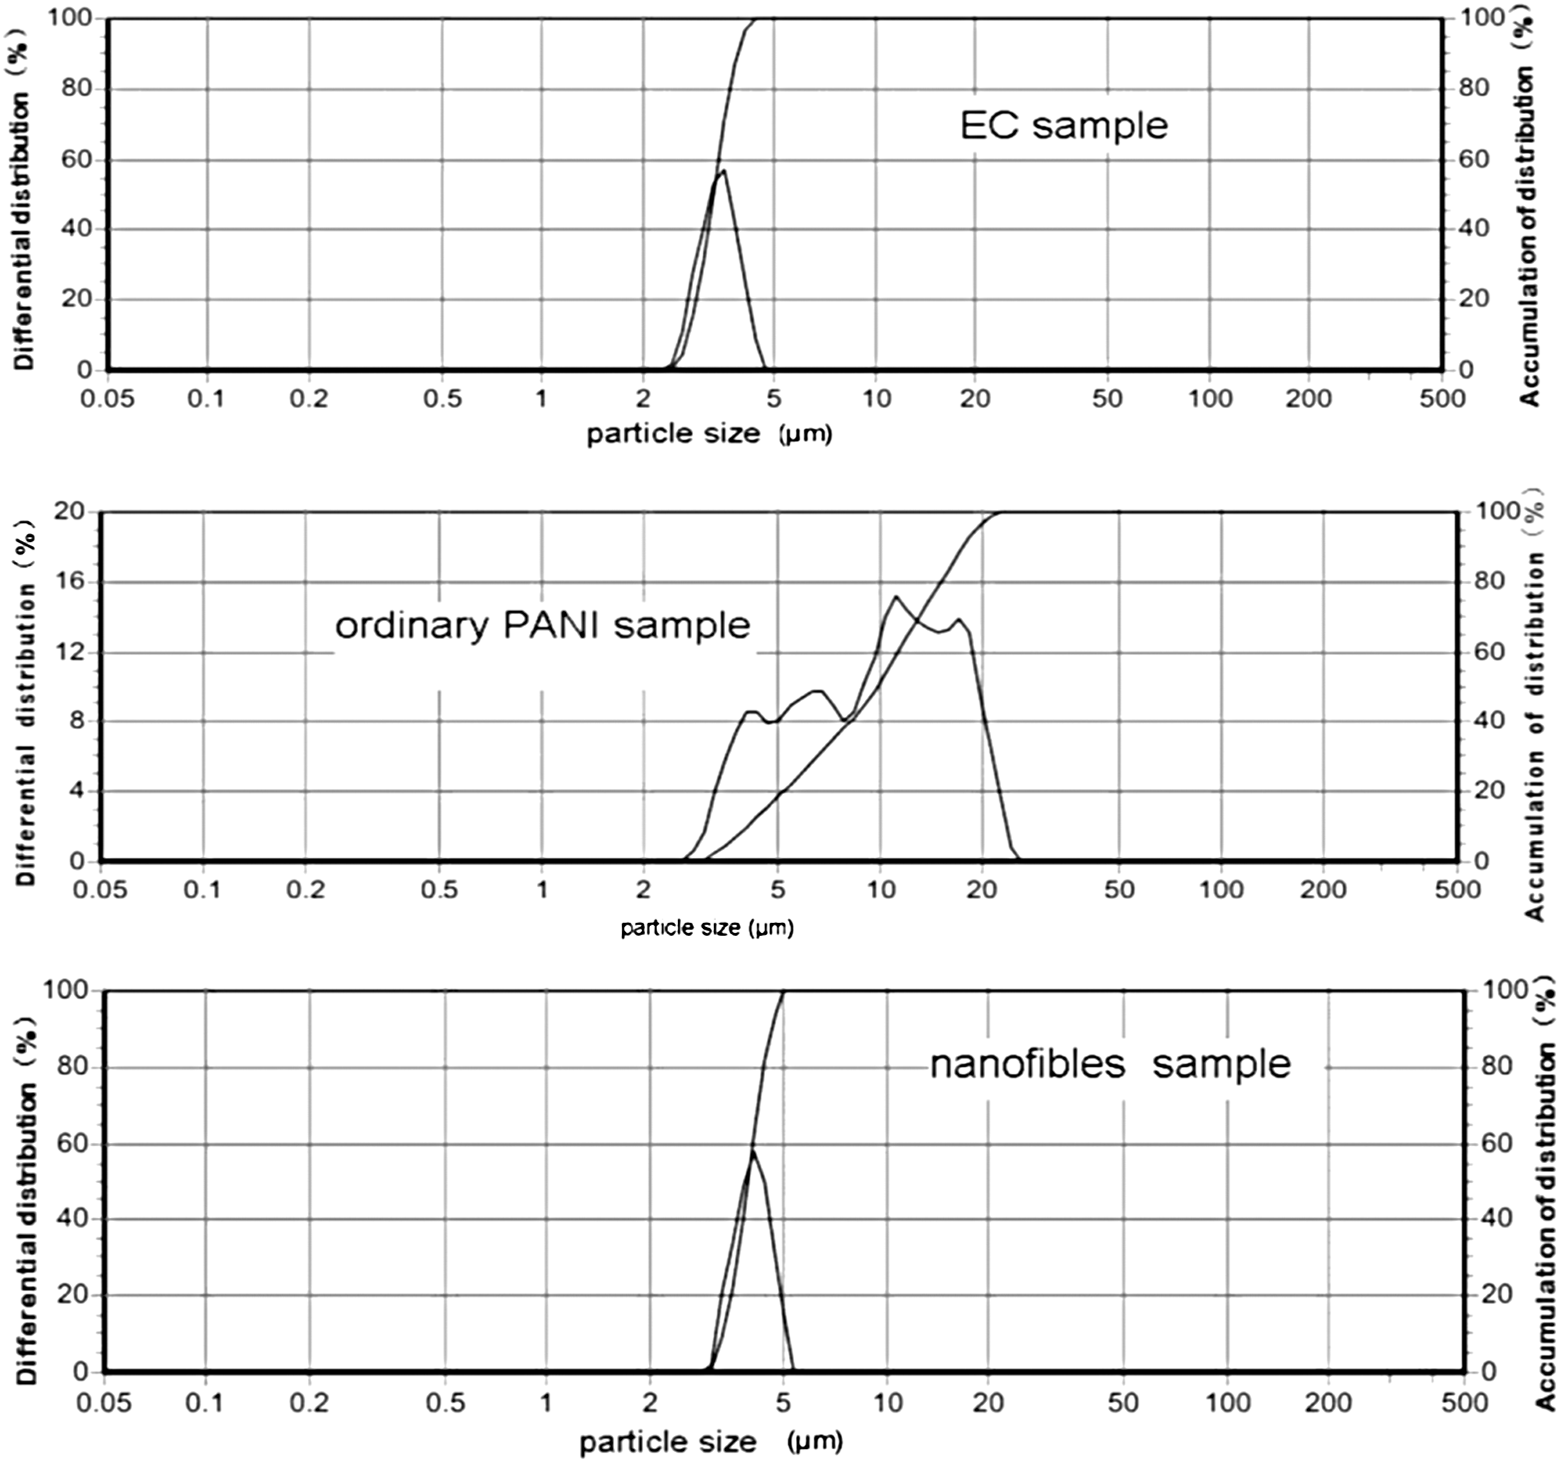
Particle size distribution of ethyl cellulose, ordinary PANI, and PANI nanofiber samples. PANI: polyaniline.
Effect of initial pH on synthesis
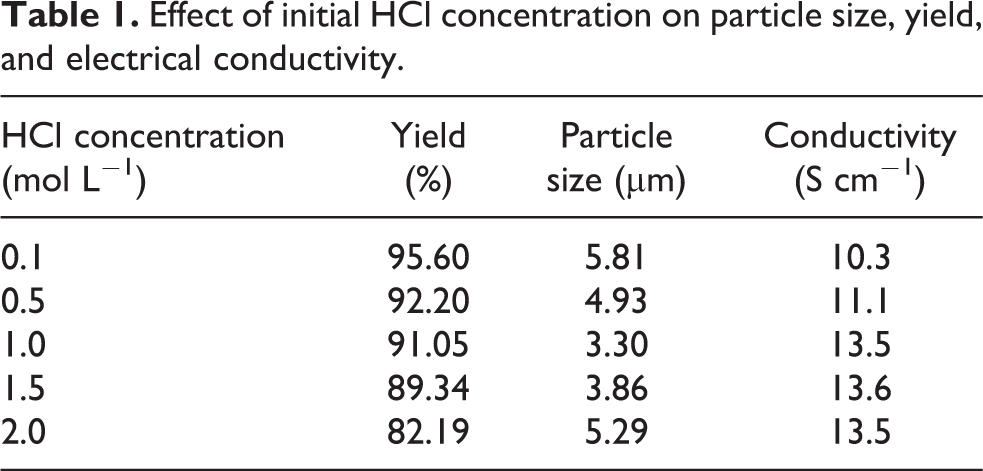
The initial pH of PANI prepared in an aqueous medium significantly affects yield and conductivity. 24 To investigate the effects of initial PH on the preparation of PANI nanofibers, different HCl concentrations were used in the synthesis. The particle size was measured by LS900 laser granularity analysis apparatus. The size, which according to the max point on differential distribution curve, was chosen to determine the particle size of the PANI nanofibers. The optimum HCl concentration for preparing PANI nanofibers was 1 mol L−1 (Table 1). The PANI nanofibers prepared in this optimum concentration had a length of approximately 3.3 µm, a yield of 91.5%, and a conductivity of up to 13.5 S cm−1.
Effect of initial HCl concentration on particle size, yield, and electrical conductivity.
Thermogravimetric analysis
To determine the thermal stability of the PANI nanofibers, thermogravimetric analysis and corresponding differential thermal analysis were performed. When the thermal behavior of PANI was determined in a nitrogen atmosphere, three typical weight loss stages were observed: (1) below 150°C, moisture volatilized; (2) between 200 and 300°C, the dopant (HCl) was eliminated; and (3) at approximately 400°C, the PANI backbone thermally decomposed. 25 When the thermal behavior of PANI in air was determined, only two weight loss steps were observed from the curve (Figure 6). Wolter et al. 26 suggested that the weight loss caused by deprotonation is equal to the weight increase caused by the oxidation of PANI by O2 in the second step. Therefore, the second step was obscure and only two stages were observed in the thermogravimetric analysis curve. From Figure 6, it was found that the moisture volatilized step was below 149.7°C. Below this temperature, the structure of the PANI nanofibers was stable. So, the processing temperature for the PANI nanofibers was below 149.7°C.
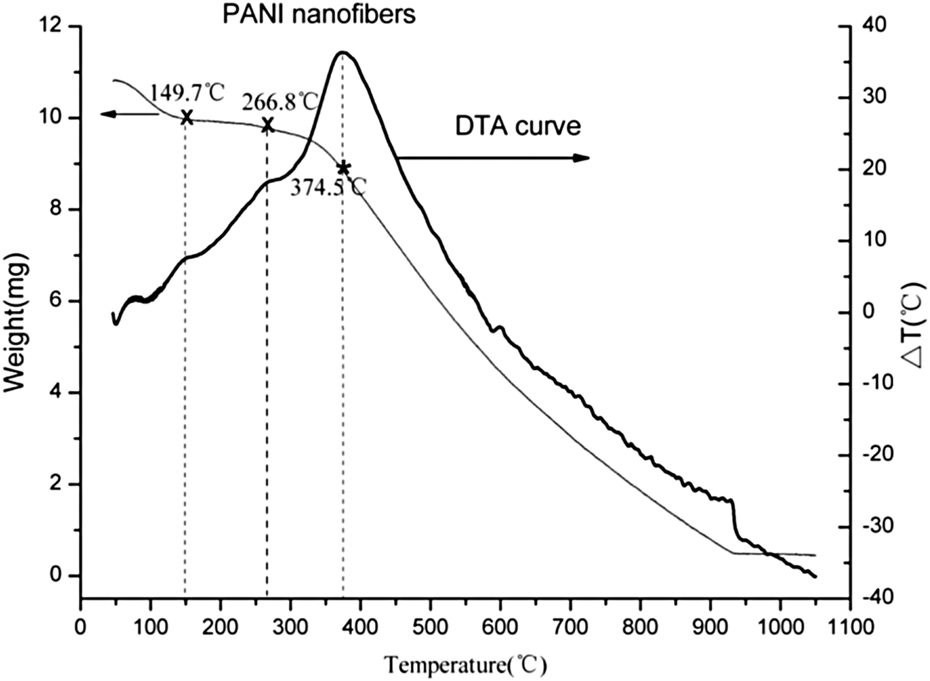
Thermogravimetric analysis curve and corresponding differential thermal analysis curve of PANI nanofibers. PANI: polyaniline.
Growth mechanism of PANI nanofibers
Although the growth process was rather complex, the ethyl cellulose template significantly affected the preparation of PANI nanofibers (Figures 1 and 2). The mechanism for nanofiber formation is shown in Figure 7. Ethyl cellulose was initially dissolved in alcohol. Under violent magnetic stirring, the ethyl cellulose solution was mixed with aqueous aniline solution; the pH of this mixture was adjusted to 1 by adding HCl. Then ethyl cellulose fibrils are formed in the mixture. The mixture became turbid. The ethyl cellulose fibrils had a diameter of 2–20 nm and a length of several micrometers. 27 The surface of ethyl cellulose fibrils contains anionic charges that combine with the positive charges of aniline. Therefore, the aniline molecules formed arrays along the ethyl cellulose fibrils. When the aniline is polymerized, PANI deposits covered the ethyl cellulose fibrils. The product was then soaked in alcohol and filtered with acetone and alcohol. So, the ethyl cellulose fibrils were dissolved and removed from the product, thereby yielding pure PANI nanofibers.
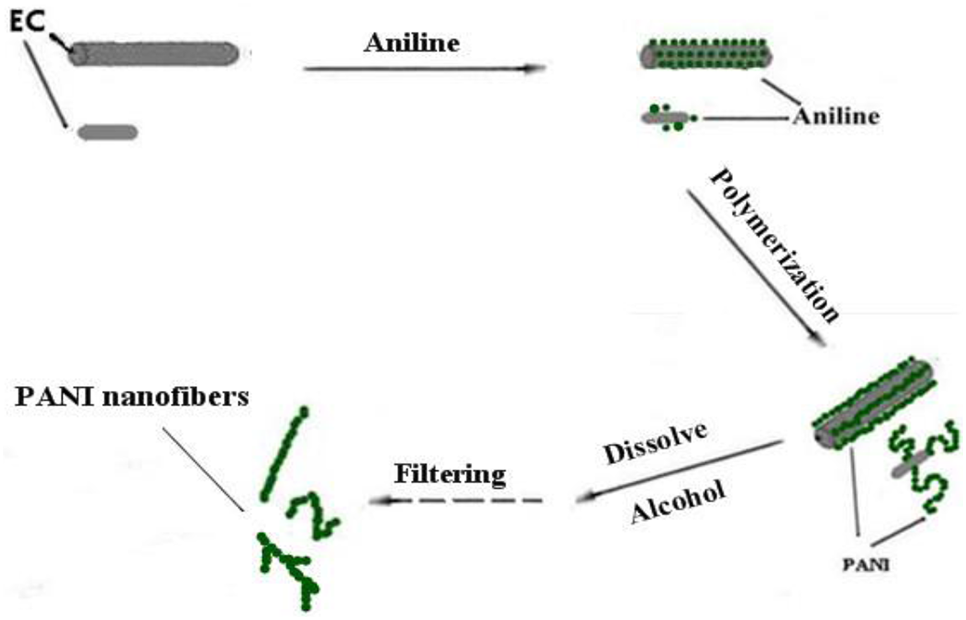
Schematic illustration of PANI nanofiber growth. PANI: polyaniline.
Discussion
The ethyl cellulose fibrils, which were separated from alcohol solution when it was added to an aqueous medium, were hydrophobic materials that acted as a template or “seed” for polymerizing aniline. The hydrophobic surface of the polymerization medium also acted as an interface, similar to that in interfacial polymerization. 28 The surface of the hydrophobic material changes the dielectric constant of the aqueous medium and the aniline concentration in aqueous phase, which create nucleates that were necessary for the generation of nanofibers. 29,30 In this experiment, the ethyl cellulose fibrils provided the hydrophobic surface. Under the electrostatic force, the aniline ions cling to the surface of the ethyl cellulose hydrophobic surface. At the beginning of polymerization, the nucleate form on the ethyl cellulose surface and when the polymerization progresses, the PANI nanofibers are produced from the nucleate.
The PANI deposits adhered to the ethyl cellulose fibrils under electrostatic force, thereby facilitating the synthesis of PANI nanofibers.
The electrical conductivity of the PANI nanofibers samples was higher than that of ordinary PANI samples. Stejskal and Gilbert 31 prepared PANI–HCl samples through a “standard” procedure in which aniline hydrochloride was oxidized with (NH4)2S2O8 in an aqueous medium at ambient temperature. The electrical conductivity of the PANI–HCl sample at room temperature was 4.4 ± 1.7 S·cm−1. Under the same conditions (Table 1), the electrical conductivity of the PANI nanofibers in the present study was 13.5 S cm−1. This discrepancy may be due to the difference in the microstructures of the two samples. The SEM, TEM, and XRD results showed that the crystallinity of the PANI nanofibers was higher than that of ordinary PANI. Therefore, the molecular structure of PANI exhibited more regularity, and the charged species moved along the molecular chain more smoothly. Moreover, because the crystallinity is higher, the value of crystallinity phase is larger than the value of disorder phase surrounds the “crystallinity island”. Therefore, the charge species hope between the “crystallinity island” is efficient. So, the electrical conductivity of PANI nanofibers is higher.
Conclusions
Pure PANI nanofibers were synthesized with ethyl cellulose as the template. The synthesis conditions were simple and practical. The PANI nanofibers had uniform size, with a diameter of approximately 40–50 nm and a length of several micrometers. The PANI nanofibers were also stable below 150°C. The electrical conductivity reached up to 13.5 S cm−1 higher than that of ordinary PANI. In this method, ethyl cellulose fibrils acted as the template for fabricating PANI nanofibers. This experiment provides an alternative method of synthesizing PANI nanofibers in large amounts. PANI nanofibers can be used in the electrical, nanocomposite, and nanotechnology industries.
Footnotes
Funding
This work was supported by National Natural Science Foundation of China (No.51004057).