
Abstract
Epoxy-based composites containing silica modified by various silane coupling agents (SCAs) were prepared. The effect of the SCAs and the silica content on the thermal, mechanical properties, and fracture toughness of the nanocomposites was investigated. The particle size and dispersion state of the modified silica particles in the matrix were determined by transmission electron microscopy. The modification of silica with SCAs was verified by Fourier transform infrared spectroscopy. The specific tensile properties at ambient temperature (AT, 298 K) were compared with those at cryogenic (LT, 77 K) condition for silica content of 1−5 wt%. The effect of certain types of coupling agents on the thermal properties of the composites was also investigated. The Tg of all amino-silane-modified composites tended to be improved at low silica contents, while that of epoxy-silane-modified composites seemed to be enhanced further at high silica content. The tensile properties of the nanocomposites both at AT and LT tended to be enhanced at lower silica content, especially the failure strain. The fracture toughness (K IC) turned out to be better enhanced by coupling agents at LT. The difference of the toughening mechanism at AT and LT was examined according to the morphology of the fracture surfaces using the scanning electron microscopy.
Introduction
Thermoset polymers have been widely used in structural applications such as aerospace, automobiles, and windmill blade for fiber-reinforced composites due to their good mechanical properties compared to those of thermoplastic polymers. Epoxy resins are very versatile raw materials and used in large volumes for high-performance fiber-reinforced composites. 1–3 But they are usually inherently brittle and vulnerable to crack owing to the low strength and low fracture toughness, which greatly limited their application in fields requiring high fracture strength. 4 Nowadays, the demand of epoxy resins at cryogenic temperature (LT) is increasing. So, for more complicated practical applications like liquid oxygen tank for launch vehicles, improving their strength and toughness is required. 5–7 Therefore, many attempts have been made to improve the fracture toughness of epoxies by addition of particles like rubbers, or a thermoplastic polymer in the last few years. 8–12 But they often result in reductions of basic mechanical properties of the epoxy. Incorporation of rigid inorganic nanofillers into epoxy systems is an alternative technique to improve the physical and mechanical properties such as strength, stiffness, and modulus without decreasing the glass transition temperature (Tg ). Direct mixing of the components is still the most convenient way to prepare conventionally filled polymers. 13
Development of different inorganic nanofillers such as silica, alumina, titania, zirconia, silicon nitride, and silicon carbide with improved performance has been widely studied with much success. 14–18 Advancement in nanotechnology promotes the mass production of nanosized silica, which has been widely used as fillers in engineering composites. Many studies concerning silica-filled epoxy resins showed that the resins exhibited lower shrinkage on curing, lower thermal expansion coefficient, better thermal conductivity, and improved mechanical properties due to the silica-particle filling. 19–22
The intrinsic properties of each component, the shape of fillers, particle size, the nature of the interface, and so forth largely affect the properties of composites. 23,24 It is well known that the load applying on the composites is transferred to fillers mainly via the interface interaction. 5 Therefore, a strong interface between the matrix and filler is demanded for excellent properties. But the nanofiller itself usually has a strong tendency to agglomerate and is incompatible with the epoxy. Directly adding the filler into the epoxy will result in the nonuniform dispersion of nanofiller and reduced affinity between the filler and the matrix. One of the most promising solutions for enhancing interfacial properties at high filler–loading system is suggested to be the surface modification of filler. 25 Chemical modification engrafts small molecular compounds on the surface of particles to maximize the interfacial compatibility between the two phases. Coupling agents are commonly used to react with the nanofillers to avoid agglomeration and improve the adhesion between fillers and resin, primarily via chemical bonds. The commonly used coupling agents in epoxy–amine cured system are silane coupling agents (SCAs) with epoxy and amino functional groups. But there are rare research about systematically comparing and analyzing the effect of the commonly used coupling agents on the properties of nanosilica-modified epoxy composites. Furthermore, researchers mainly paid attention to the effect of coupling-agent-modified fillers on the mechanical properties of epoxy resins at ambient temperature (AT) rather than that at LT. The influence introduced to the cryogenic mechanical properties of the composites modified by different SCAs remains unknown.
In other research, the content of silane-modified silica in the epoxy composites could reach 20–35 wt%. This was because the resin with 40 wt% nanosilica was manufactured using a modified sol–gel process. But in our experiment, the bisphenol-A epoxy resin itself has high viscosity and the silica nanofillers were added by direct mixing. So, the dispersion of silica in epoxy was poor. When the silica content exceeded 5.0 wt%, the curing process was very hard to achieve. In our study, four types of commercial SCAs with different functional groups were utilized to modify the nanosilica to enhance the interfacial force with epoxy matrix. The mass ratio of SCA with respect to silica was kept constant in order to facilitate the comparison of the results. The modified particle size and dispersion were investigated by transmission electron microscopy (TEM) and Fourier transform infrared spectroscopy (FTIR). The effect of silica nanofiller content and the variety of SCA on thermal and mechanical properties of the epoxy resin were investigated, especially the tensile properties and fracture toughness at LT (77 K). Trend of Tg change attributed to the bonding level between the particle surface and the molecules of the epoxy. The data comparison of tensile test and fracture roughness especially at LT was elucidated by the difference in the functional organic group, hydrolysable functional group, and structure of SCA. The effect of SCA type on the fracture surface was described based on the scanning electron microscopy (SEM) results and preliminary conclusions about the toughening mechanism at AT and LT were drawn.
Experimental
Materials
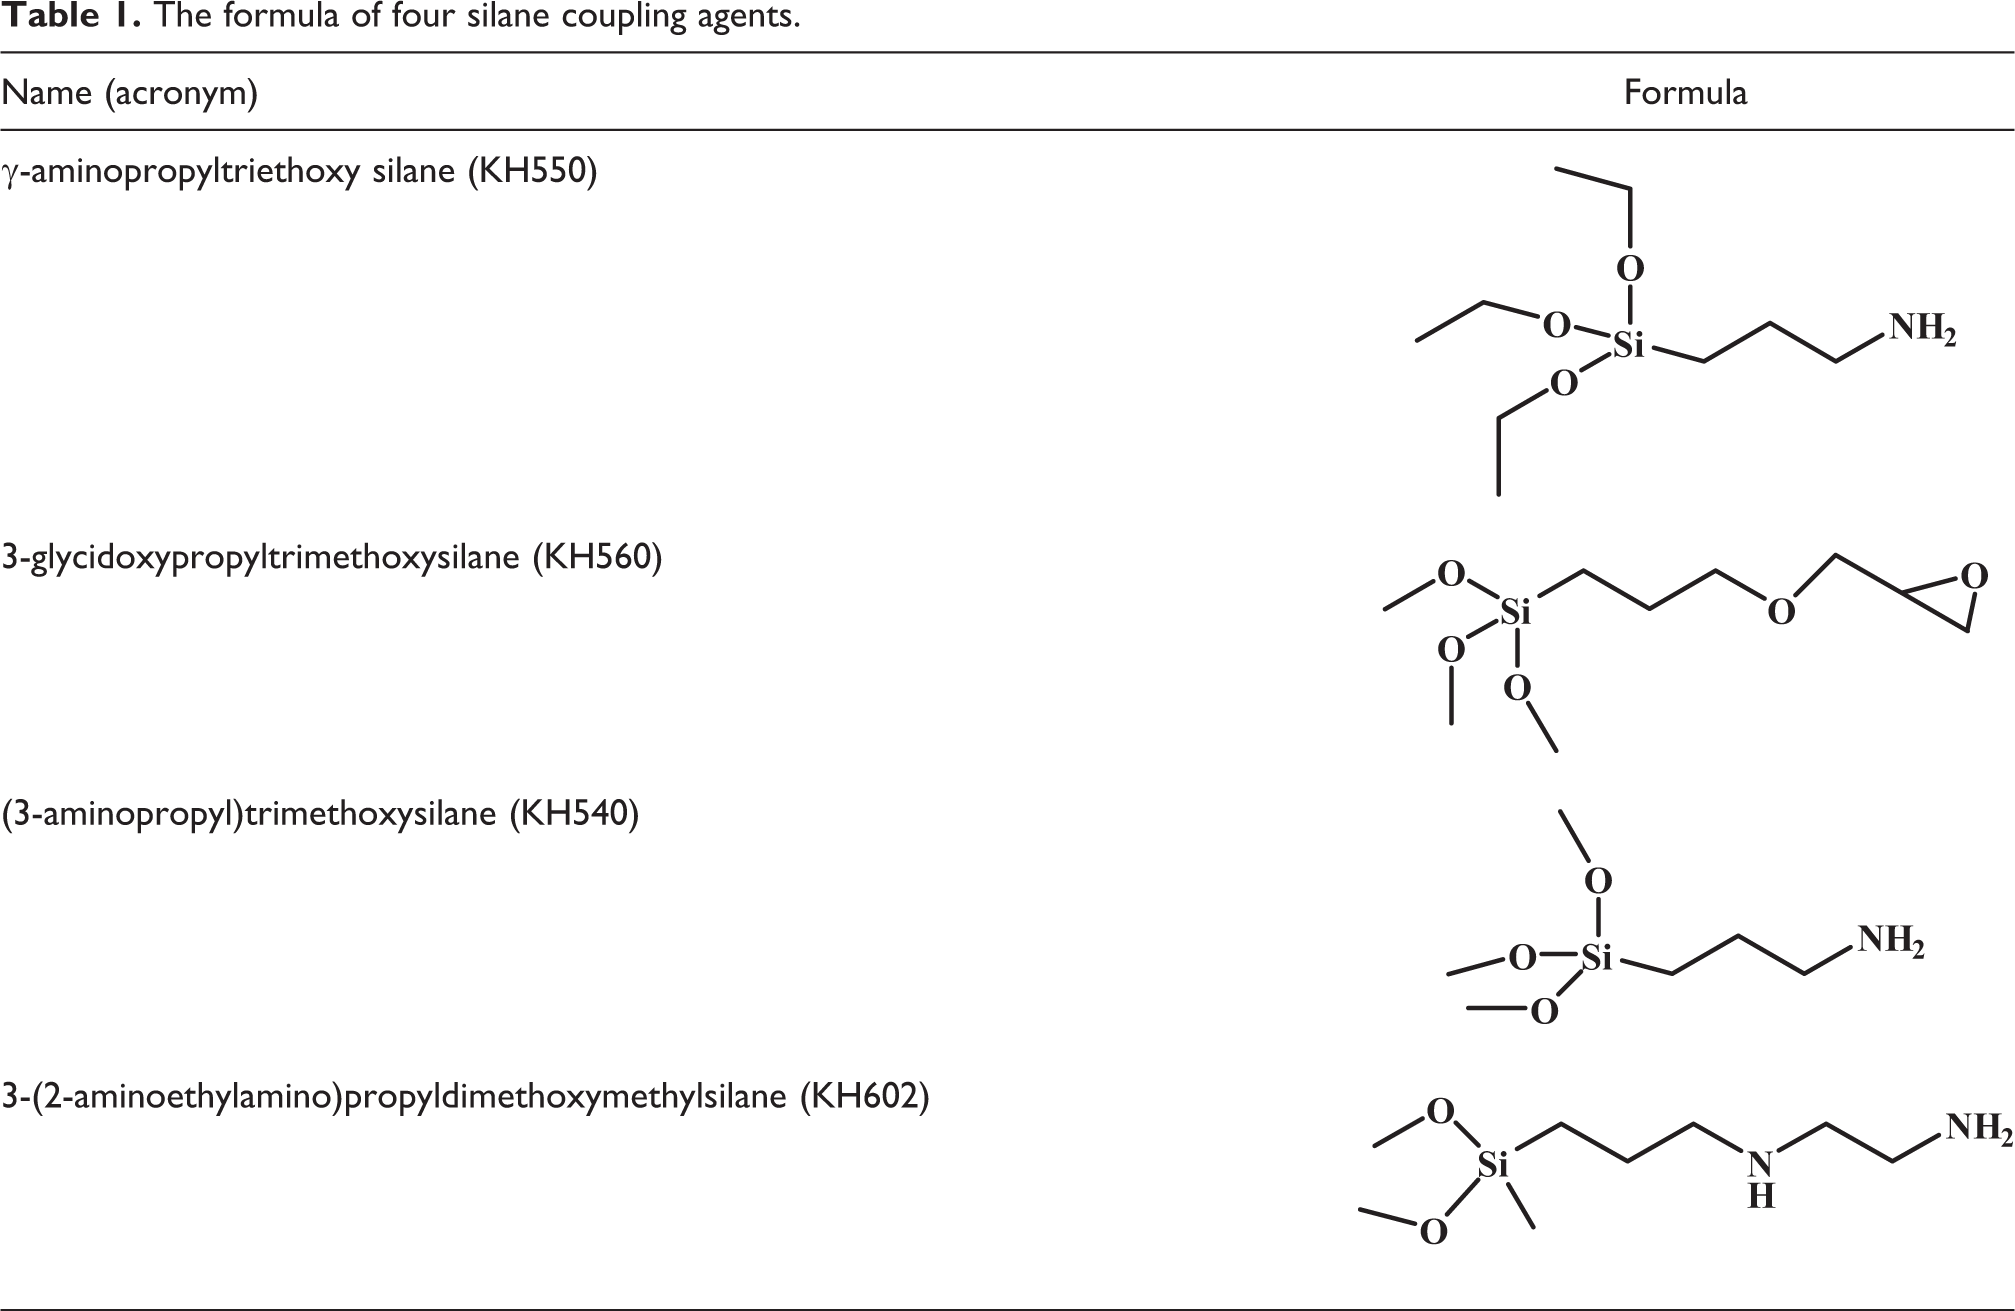
The epoxy matrix selected was composed of a standard bisphenol-A epoxy resin (specific equivalent weight of 192–196 g/mol) and a traditional diamine curing agent, 4,4′-diaminodiphenylmethane (DDM), supplied by Yueyang Chemical Co., Ltd., China, and Sinopharm Chemical Reagent Co., Ltd., China. The silica particles with an average diameter of 4–70 nm and a specific surface area of 200 m2/g were purchased from Aladdin Chemistry Co., Ltd, Shanghai. γ-aminopropyltriethoxy silane (KH550, Sinopharm Chemical Reagent Co., Ltd.), 3-glycidoxypropyltrimethoxysilane (KH560, Energy Chemical, Shanghai), (3-aminopropyl)trimethoxysilane (KH540, Aladdin Industrial Corporation, Shanghai), and 3-(2-aminoethylamino)propyldimethoxymethylsilane (KH602, Aladdin Industrial Corporation) were used as coupling agents and toluene and isopropanol as solvents. The chemical formulas of the coupling agent are illustrated in Table 1.
The formula of four silane coupling agents.
Modification of silica
First, the silica (10 g) was kept in a vacuum oven at 90°C for 24 h to eliminate the moisture. Then, it was cooled down to room temperature and mixed with 250 mL of toluene in a three-necked flask followed by ultrasonication for 30 min. After that, coupling agent (with the same content of 2% of the silica by weight) was added to the mixture, followed by ultrasonic treatment for 10 min. 9 The mixture was stirred with reflux under a nitrogen atmosphere for 6 h at 110°C. Then, the solution was centrifuged and the obtained powder was washed by isopropanol in an ultrasonic bath for three times to eliminate the residual toluene. Finally, the obtained white solid was dried at 80°C for 12 h.
Curing process
The curing process of all the composites filled with the silica was similar. The detailed information of composite filled with KH550-modified silica (EP/KH550) was shown below. The calculated KH550-modified silica (1, 3, and 5 wt% corresponding to the uncured epoxy resin) was mechanically dispersed in the epoxy resin for 2 h in order to avoid agglomeration. Then, the mixture was put into a vacuum oven at 90°C for 2 h to get rid of the isopropanol. Finally, a stoichiometric amount of curing agent DDM, with the weight ratio of 1:3.96 corresponding to the epoxy resin, was added to the mixture at 90°C by constant stirring. Once the curing agent dissolved completely in the mixture, the mixture was put in a vacuum oven at 80°C for 35 min to remove bubbles. Finally, the mixture was poured into a Teflon mold with precuring at 100°C for 2 h and postcuring at 160°C for 4 h. The preparation process of the composites is shown in Figure 1. For comparison, neat epoxy resin was also prepared according to the aforementioned curing procedure.
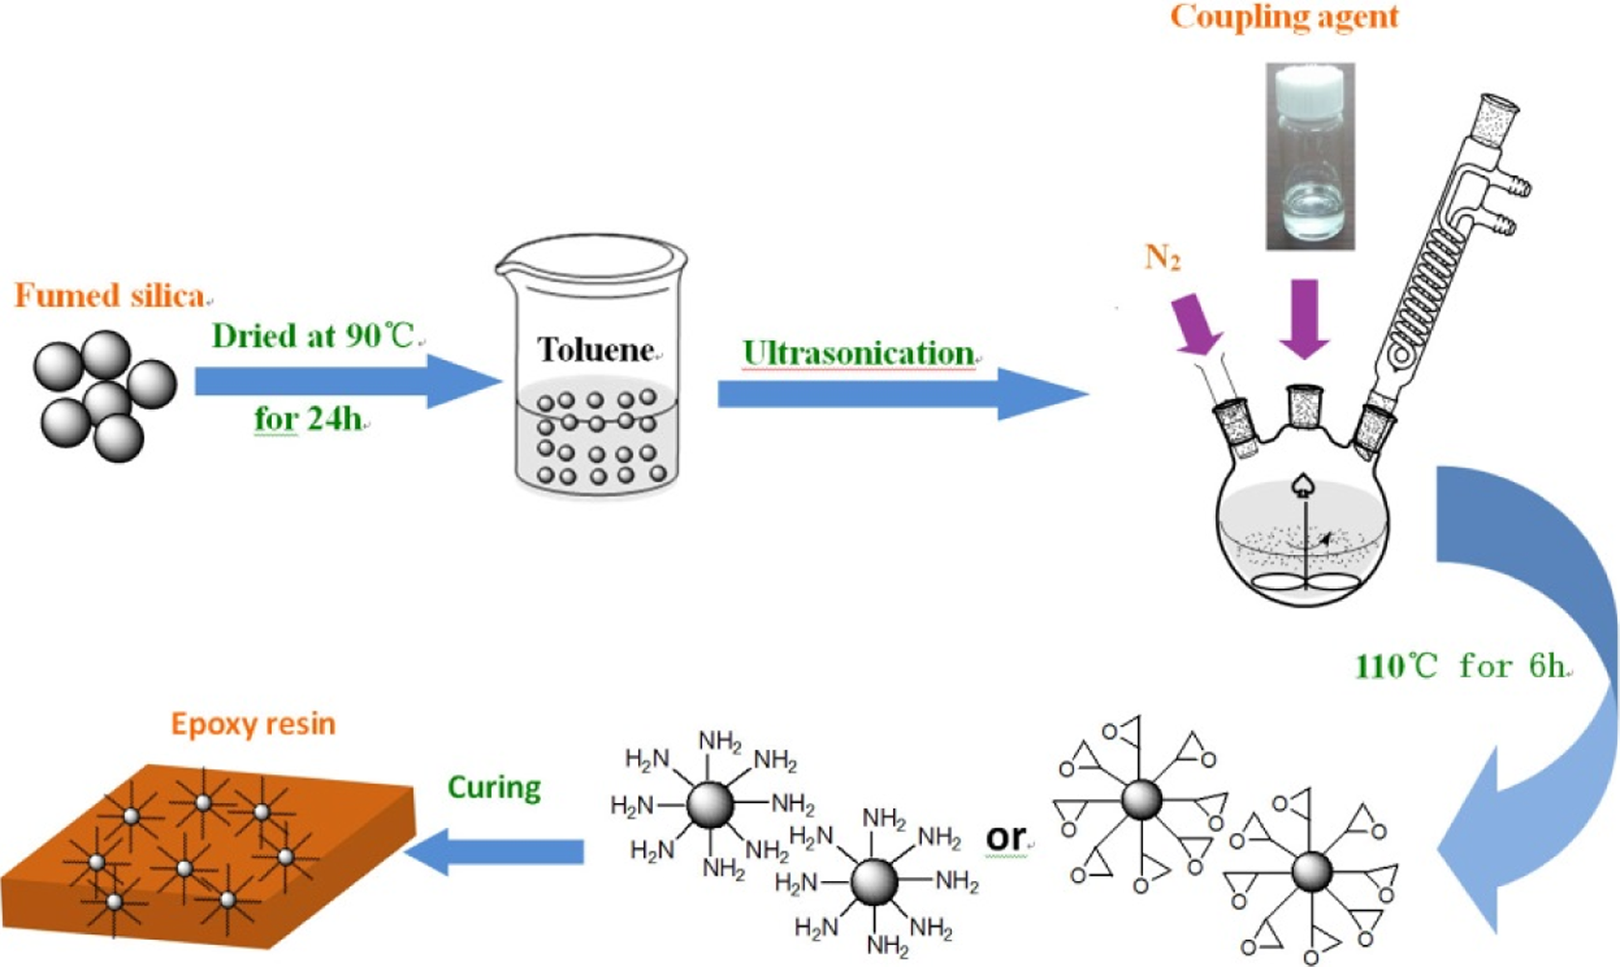
Schematic representation of the formation of the composites.
Material characterization
The size and distribution of the silica particle within the polymer were observed using TEM named by Tecnai F30 produced by FEI Company, USA. FTIR spectra were measured with a PerkinElmer Spectrum One FTIR (USA) from 4000 cm−1 to 600 cm−1 (potassium bromide). The Tg of the cured composites was examined by differential scanning calorimetry (DSC) at a heating rate of 10 K/min over a temperature range of 20–250°C. According to the ASTM D3418 standard, the Tg s, where the mechanical and damping behaviors of samples change drastically, were assessed by the mid-point of the heat capacity transition between the upper and lower points of deviation from the extrapolated liquids and glass lines with the sample weight in the range of 10–20 mg. The tensile tests of the composites at AT (298 K, 25°C) and liquid nitrogen temperature (LT, 77 K, −196°C) were performed using an SDS–100 universal electrohydraulic servo testing machine (Changchun Research Institute For Mechanical Science Co., Ltd., China), with a constant displacement rate of 1 mm/min. The elongation of the specimen was measured using a clip-on extensometer (Epsilon, USA) with a gauge length of 25 mm. The LT (77 K, −196°C) was achieved by putting the sample and extensometer in a cabinet with continuously spraying liquid nitrogen about 40 min from AT to LT and kept stable for testing. Dog-bone tensile samples with a gauge length of 50 mm were made according to the ASTM D638–99 standard by a Teflon mold, and afterward both sides of the specimens were ground and polished by emery paper until all visible pores and burrs disappeared. The single-edge notched bending (SENB) both at AT and LT was performed using a universal tensile tester. The dimension of the SENB specimens was prepared according to the ASTM D5045–99 standard with a span of 32 mm at a constant displacement rate of 1 mm/min, which was illustrated in Figure 2. Before the SENB test, the specimens were first soaked in the liquid nitrogen for 30 min and then were taken out and immerged in a container full of liquid nitrogen for 15 min until the temperature was consistent. A sufficient slot was introduced to the sample by a numerical control cutting machine. The stress intensity factor, K IC, was calculated by the following equation:
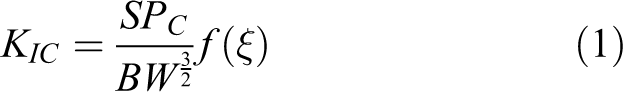
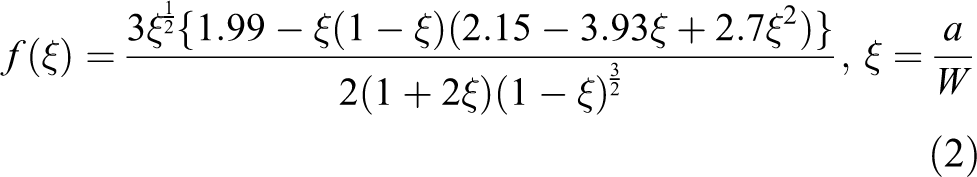
where PC is the maximum load. S, B, a, and W represent the span length, the thickness, the precrack length, and the width of the specimen, respectively. SEM (FEI: Quanta 450) was used to investigate the fracture surfaces of tensile samples both at AT and LT, and before observation, the fracture surfaces were cleaned with alcohol and sputter coated with a thin golden layer for sufficient image quality.
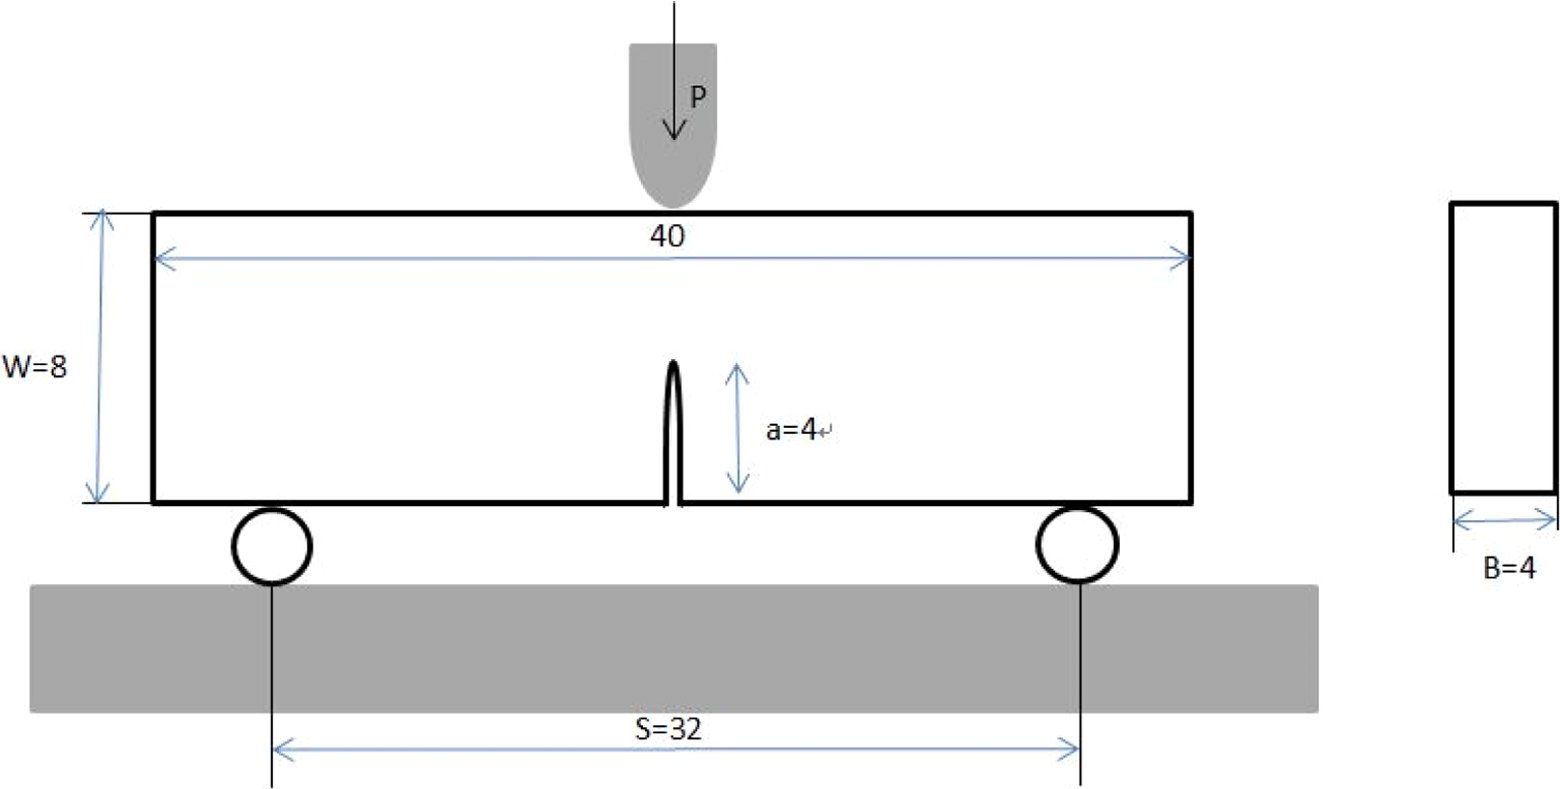
Schematic picture of the SENB samples. SENB: single-edge notched bending.
Results and discussion
Silica particle size and dispersion
The TEM images (Figure 3) show a homogeneous distribution of particles despite some small agglomerates in the matrix. The size of the agglomeration was in the range of 300–500 nm. Compared to the amino-silane-modified silica (Figure 3(a), (c), and (d)), the agglomeration content and the degree of particle stacking was less in the epoxy-silane-modified silica (Figure 3(b)). The distribution and size of silica modified by KH550 (Figure 3(a)) were similar to that modified by KH540 (Figure 3(c)). Besides, the shape of KH602-modified silica (Figure 3(d)) seemed to be linear chains rather than three-dimensional network (Figure 3(a) to (c)).
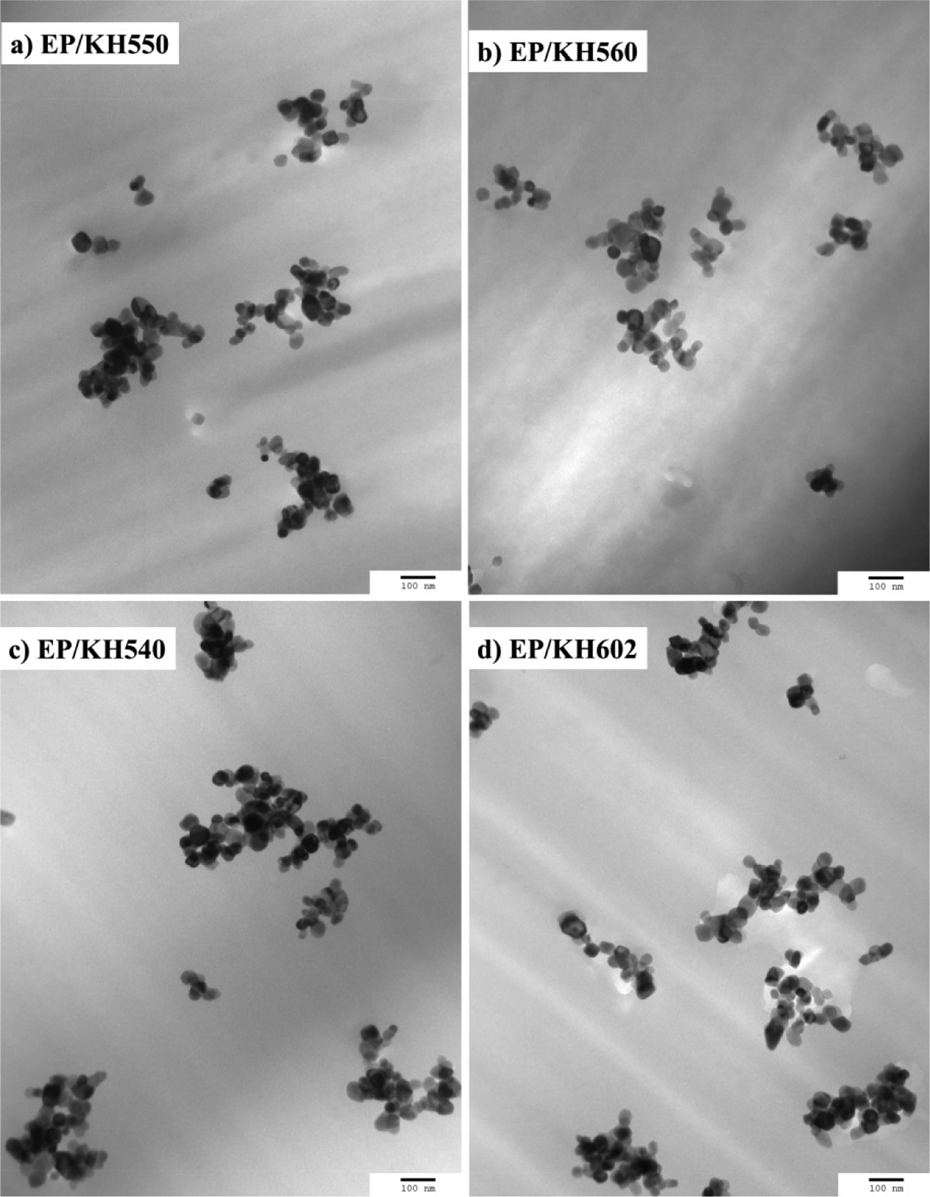
TEM images of the modified silica particles with 3 wt% silica content in the modified composites: (a) EP/KH550, (b) EP/KH560, (c) EP/KH540, and (d) EP/KH602 (scale bars are all 100 nm). TEM: transmission electron microscopy; EP: epoxy.
FTIR spectroscopy analysis
Figure 4 exhibits the FTIR spectra of pure silica and SCA-modified silica. Apparently, the characteristic bands of pure silica were shown in all the spectra: the broad peaks between 3400 and 3450 cm−1 and between 1630 and 1640 cm−1 contributed to –O–H stretching and bending vibration. The stretching vibrations of the framework (–Si–O–Si–) were assigned to the strong peaks around 1100 cm−1 and 800 cm−1. From the spectra (b)–(e), the peaks located between 2935 cm−1 and 2870 cm−1 nearby were ascribed to the asymmetrical and symmetrical stretching vibration of the –C–H2– bond in the methylene group of all SCAs. For amino-silane-modified silica, the band at 1560 cm−1 owing to the vibrations of N–H bond of amino groups could be found in the spectra (c)–(e). 26 Besides, the presence of a new band at 1260 cm−1 (Figure 4(e)), which was assigned to the rocking vibration of Si–CH3, 27 also verified the difference of KH602 compared to KH550 or KH540. For epoxy-silane-modified silica, the epoxy group in KH560 was marked at 910 cm−1 (Figure 4(b)). 26 Thus, the FTIR spectra indicated that the SCAs with different surface functional groups had been associated with the surface of silica particles.
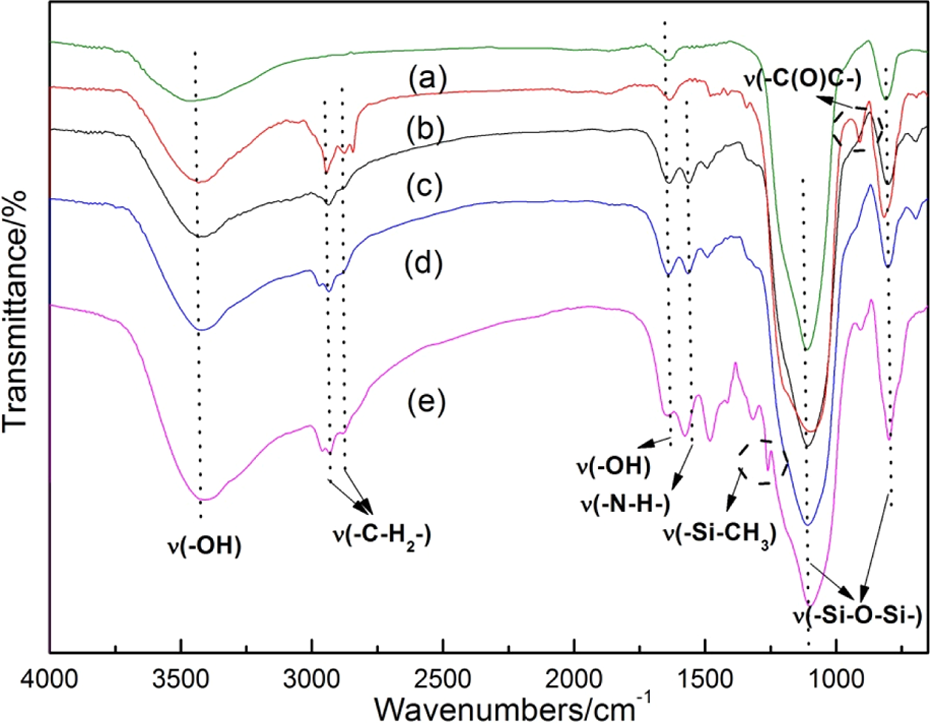
FTIR spectra for SiO2 nanofillers: (a) pure silica, (b) KH560-modified silica, (c) KH550-modified silica, (d) KH540-modified silica, and (e) KH602-modified silica. FTIR: Fourier transform infrared spectroscopy; SiO2: silicon dioxide.
Thermal properties of the silica/epoxy composites
The thermal properties of the silica/epoxy composites were characterized by DSC. The Tg s obtained by DSC were summarized in Table 2. It was clearly shown that effects of the SCA with epoxy group on Tg of the composites were different from the others with amino groups, which seemed to have the similar effect on the Tg of the composites. Tg of the pure resin was 148.08°C, and the results showed that Tg of the silica/epoxy composites reached the maximum at 3 wt% silica content. The increase of the Tg of the composites was partly ascribed to the contribution of increased cross-link density by the silane treatment. 10,11 For amino-silane-modified composites (EP/KH602 and EP/KH540), the reinforcement seemed to be effective at low silica contents, which reached the highest level of 174.22°C and 173.58°C between 1 wt% and 3 wt% silica. And the maximum increment was about 26°C, then Tg decreased (still remained slightly higher than Tg of the pure resin) at 5 wt% silica content. But for epoxy-silane-modified composite (EP/KH560), Tg increased slowly along with the increased silica content. And the maximal increment of Tg was only about 8°C. Generally, the silane reduced the amount of hydroxyl groups on particles by forming chemical bonds. Meanwhile, the bonds formed cross-linking sites to increase the space steric hindrance of the epoxy chain segment, which resulted in the increase of Tg . However, unexpectedly, Tg reduced when the silica content exceeded the optimum amount. This might be due to that excessive particles increased the viscosity of the resin and led to incomplete cure of the epoxy, which reduced the cross-link density of the epoxy–amine curing system. Usually, the general formula for an SCA, which is symbolized as (X–Si(CH3) n R3–n ) (0 ≤ n < 2), contains two classes of functionality. The X represents the functional organic groups like amino, epoxy, and so on, which can react with the resin. 28 The R represents hydrolysable functional groups such as methoxy, ethoxy, and so on. The chemical formulas of the silanes shown in Table 1 are employed to compare the difference in their structure. From the formula, it is clear that KH602 has more amine groups and a longer nonhydrolytic chain than that of KH540 and KH550. The coupling process is the condensation reaction between the alkoxy groups and hydroxyl groups on the silica particles. The rate of hydrolysis or alcoholysis is in the order of –O–CH3 > –O–C2H5, –Si–(OH)2X > –Si–(OH)3. 29 Moreover, the amino groups in silane could catalyze the inorganic condensation reactions and participate in the formation of the organic networks via reactions with the epoxy resin. 11 According to the opinion of Nelson, 30 the Tg of the polymer might be related to the level of the bonding between the particle surface and the molecules of the polymer, and the faster the hydrolysis or alcoholysis rate was, the stronger the bonding level was. Therefore, the hydrolysis rate of the SCA could be arranged in the order at the same silica content: KH602 > KH540 > KH550 > KH560. At the same time, it has been reported that the length of nonhydrolytic groups in SCA would shelter partial hydroxyl groups and reduce the coupling reaction between the SCA and silica. 31 From Table 1, the length of nonhydrolytic groups in SCA could be sorted in the following sequence: KH560 > KH602 > KH550 ≈ KH540. The change of Tg was a consequence of the hydrolysis rate and the length of nonhydrolytic groups of SCA. The hydrolysis rate dominated Tg at low silica content. So, the Tg of composites at 1 wt% silica was in correspondence with the order of the hydrolysis rate of the SCA. When the silica content increased, the effect of hydrolysis rate decreased and the impact of the length of nonhydrolytic groups of SCA played a leading role in the change of Tg . So, the Tg of EP/KH540 and EP/KH550 was higher than that of EP/KH602 and EP/KH560 at 3 wt% silica content. Tg of EP/KH540, EP/KH550, and EP/KH602 began to decrease when more silica was added. The decrease might be attributed to self-polymerization of SCAs catalyzed by extra amino groups that reduced the number of SCA coupled with silica. As for the relatively high Tg of EP/KH560 at 5 wt% silica content, this might be because of the relatively low self-polymerization level due to the absence of the amino catalysis and more SCAs resulted in the increase of the actual number of hydroxyl groups for grafting one KH560 molecule.
The Tg of the silica/epoxy composites treated by different coupling agents.
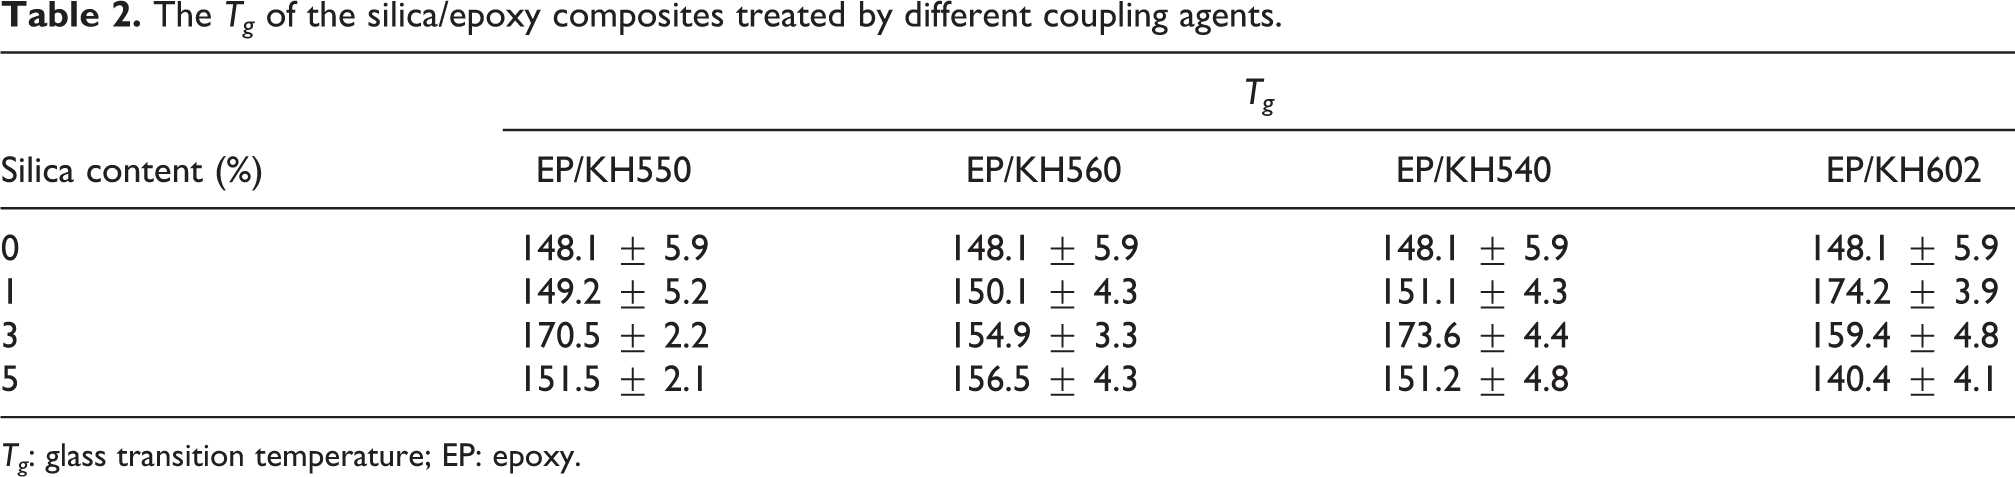
Tg : glass transition temperature; EP: epoxy.
Mechanical properties
Figures 5 and 6 show the stress–strain curve of the composites treated by different coupling agents at both AT and LT. The fluctuation of the curve was due to noise and vibration generated by the machine. Failure strain and tensile strength of the epoxy composites at AT and LT obviously increased compared to those of the pure epoxy system due to the introduction of particles. Both curves at AT and LT suggested that the tensile strength of the composite reached the optimum at lower content. This was due to the fact that the addition of nanofiller changed the failure and energy dissipation mechanisms of the epoxy system. The nanofiller acted as stoppers to block the crack growth by pinning the cracks. From the curing kinetics results of Rosso and Ye, 32,29 the formation of an amino-rich interphase region around the silica nanofillers could also be responsible for the property improvements. And the relatively stronger agglomerates of silica at a high content would become stress concentrations locally at the interfaces and then easily induced the initiation of the final failure. 33 Moreover, the composites tended to have high failure strain and low tensile strength at AT, whereas the results at LT were on the contrary. On one hand, this was because the molecules of the matrix and the fillers were tightly arranged at LT. So, both the strength of the matrix and the silica–epoxy interface adhesion increased. On the other hand, according to the research of White, 34 Shan, 35 and Chu, 36,37 the thermal expansion of silica and epoxy resin at 77 K was about −6 × 10⁻⁷ K−1 and −1 × 10⁻² K−1, which indicated that silica had much lower thermal expansion than epoxy resin at LT. So, the compressive stress was generated at the interface due to the difference of thermal expansion of the silica and matrix, and at LT, the silica was clamped tightly by the matrix. Detailed tensile properties at AT and LT are shown in Figure 7.
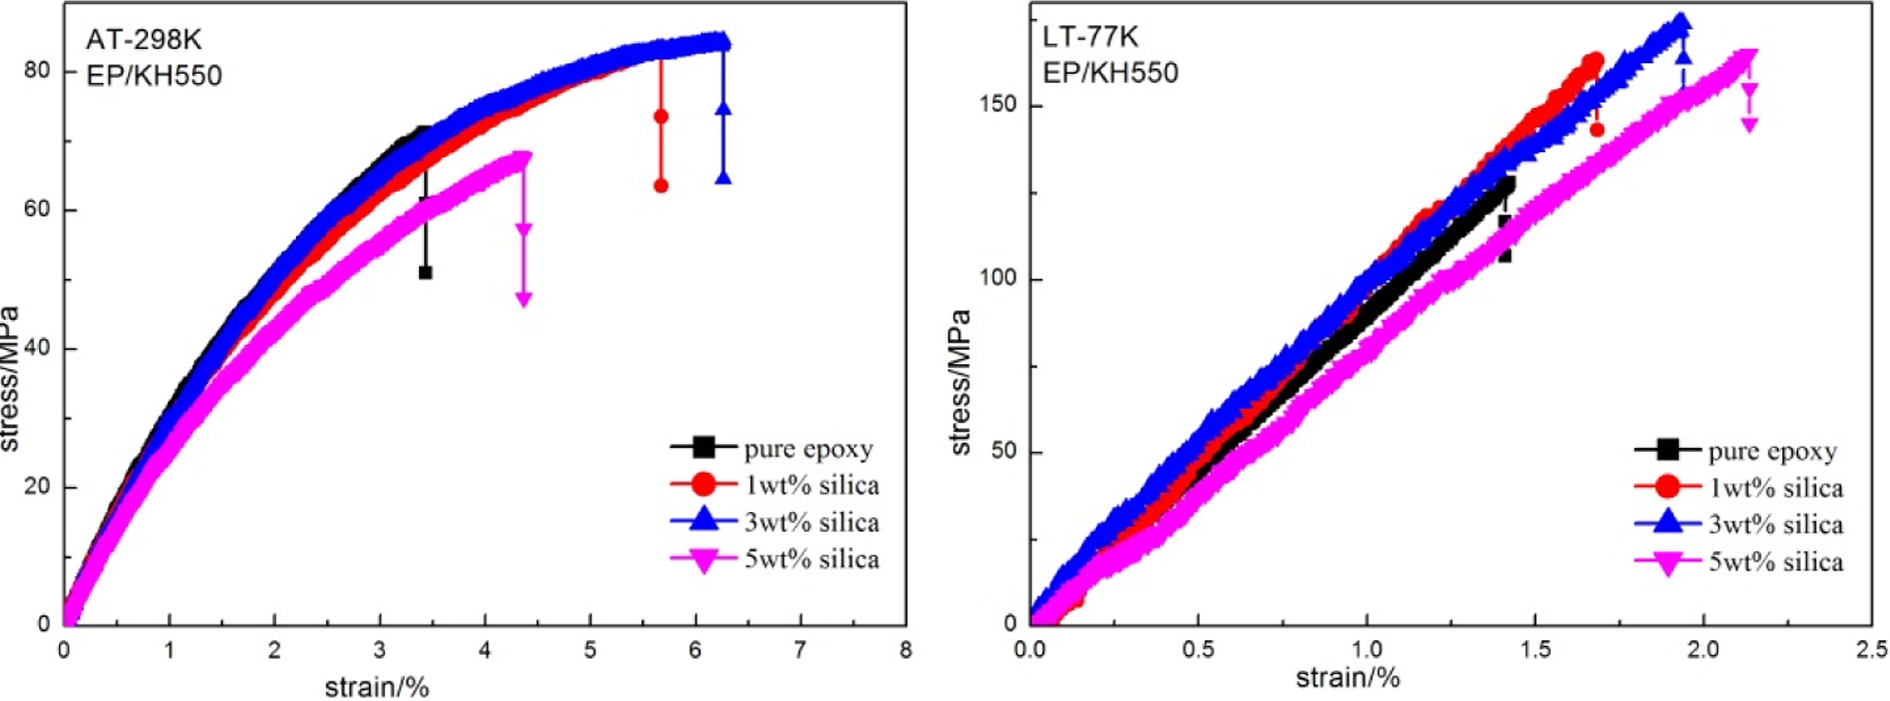
Stress–strain curve of silica/epoxy composites modified by KH550 measured both at AT and LT. AT: ambient temperature; LT: cryogenic temperature.
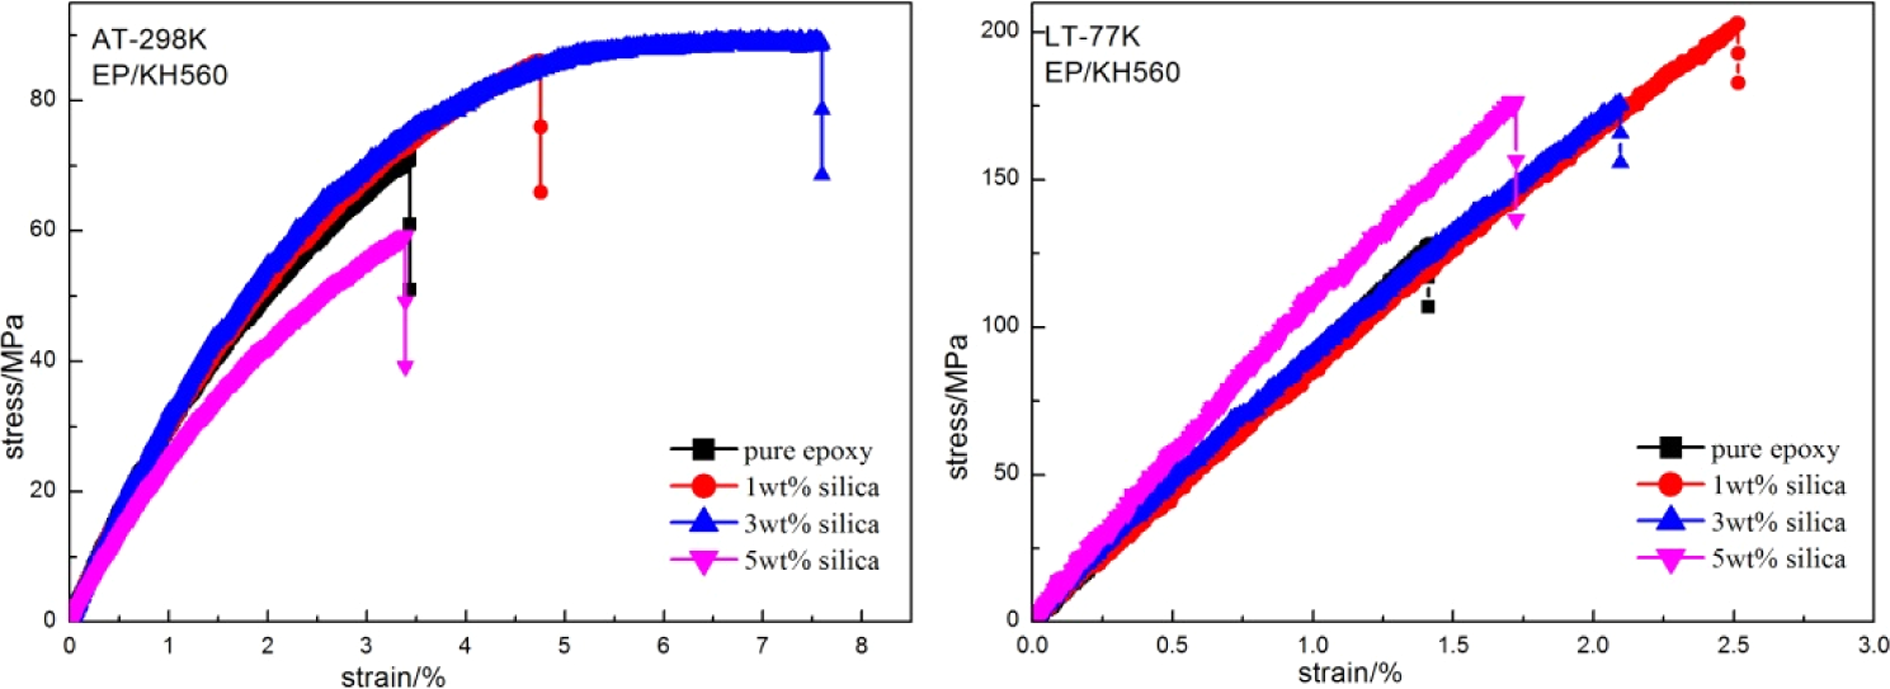
Stress–strain curve of silica/epoxy composites modified by KH560 measured both at AT and LT. AT: ambient temperature; LT: cryogenic temperature.
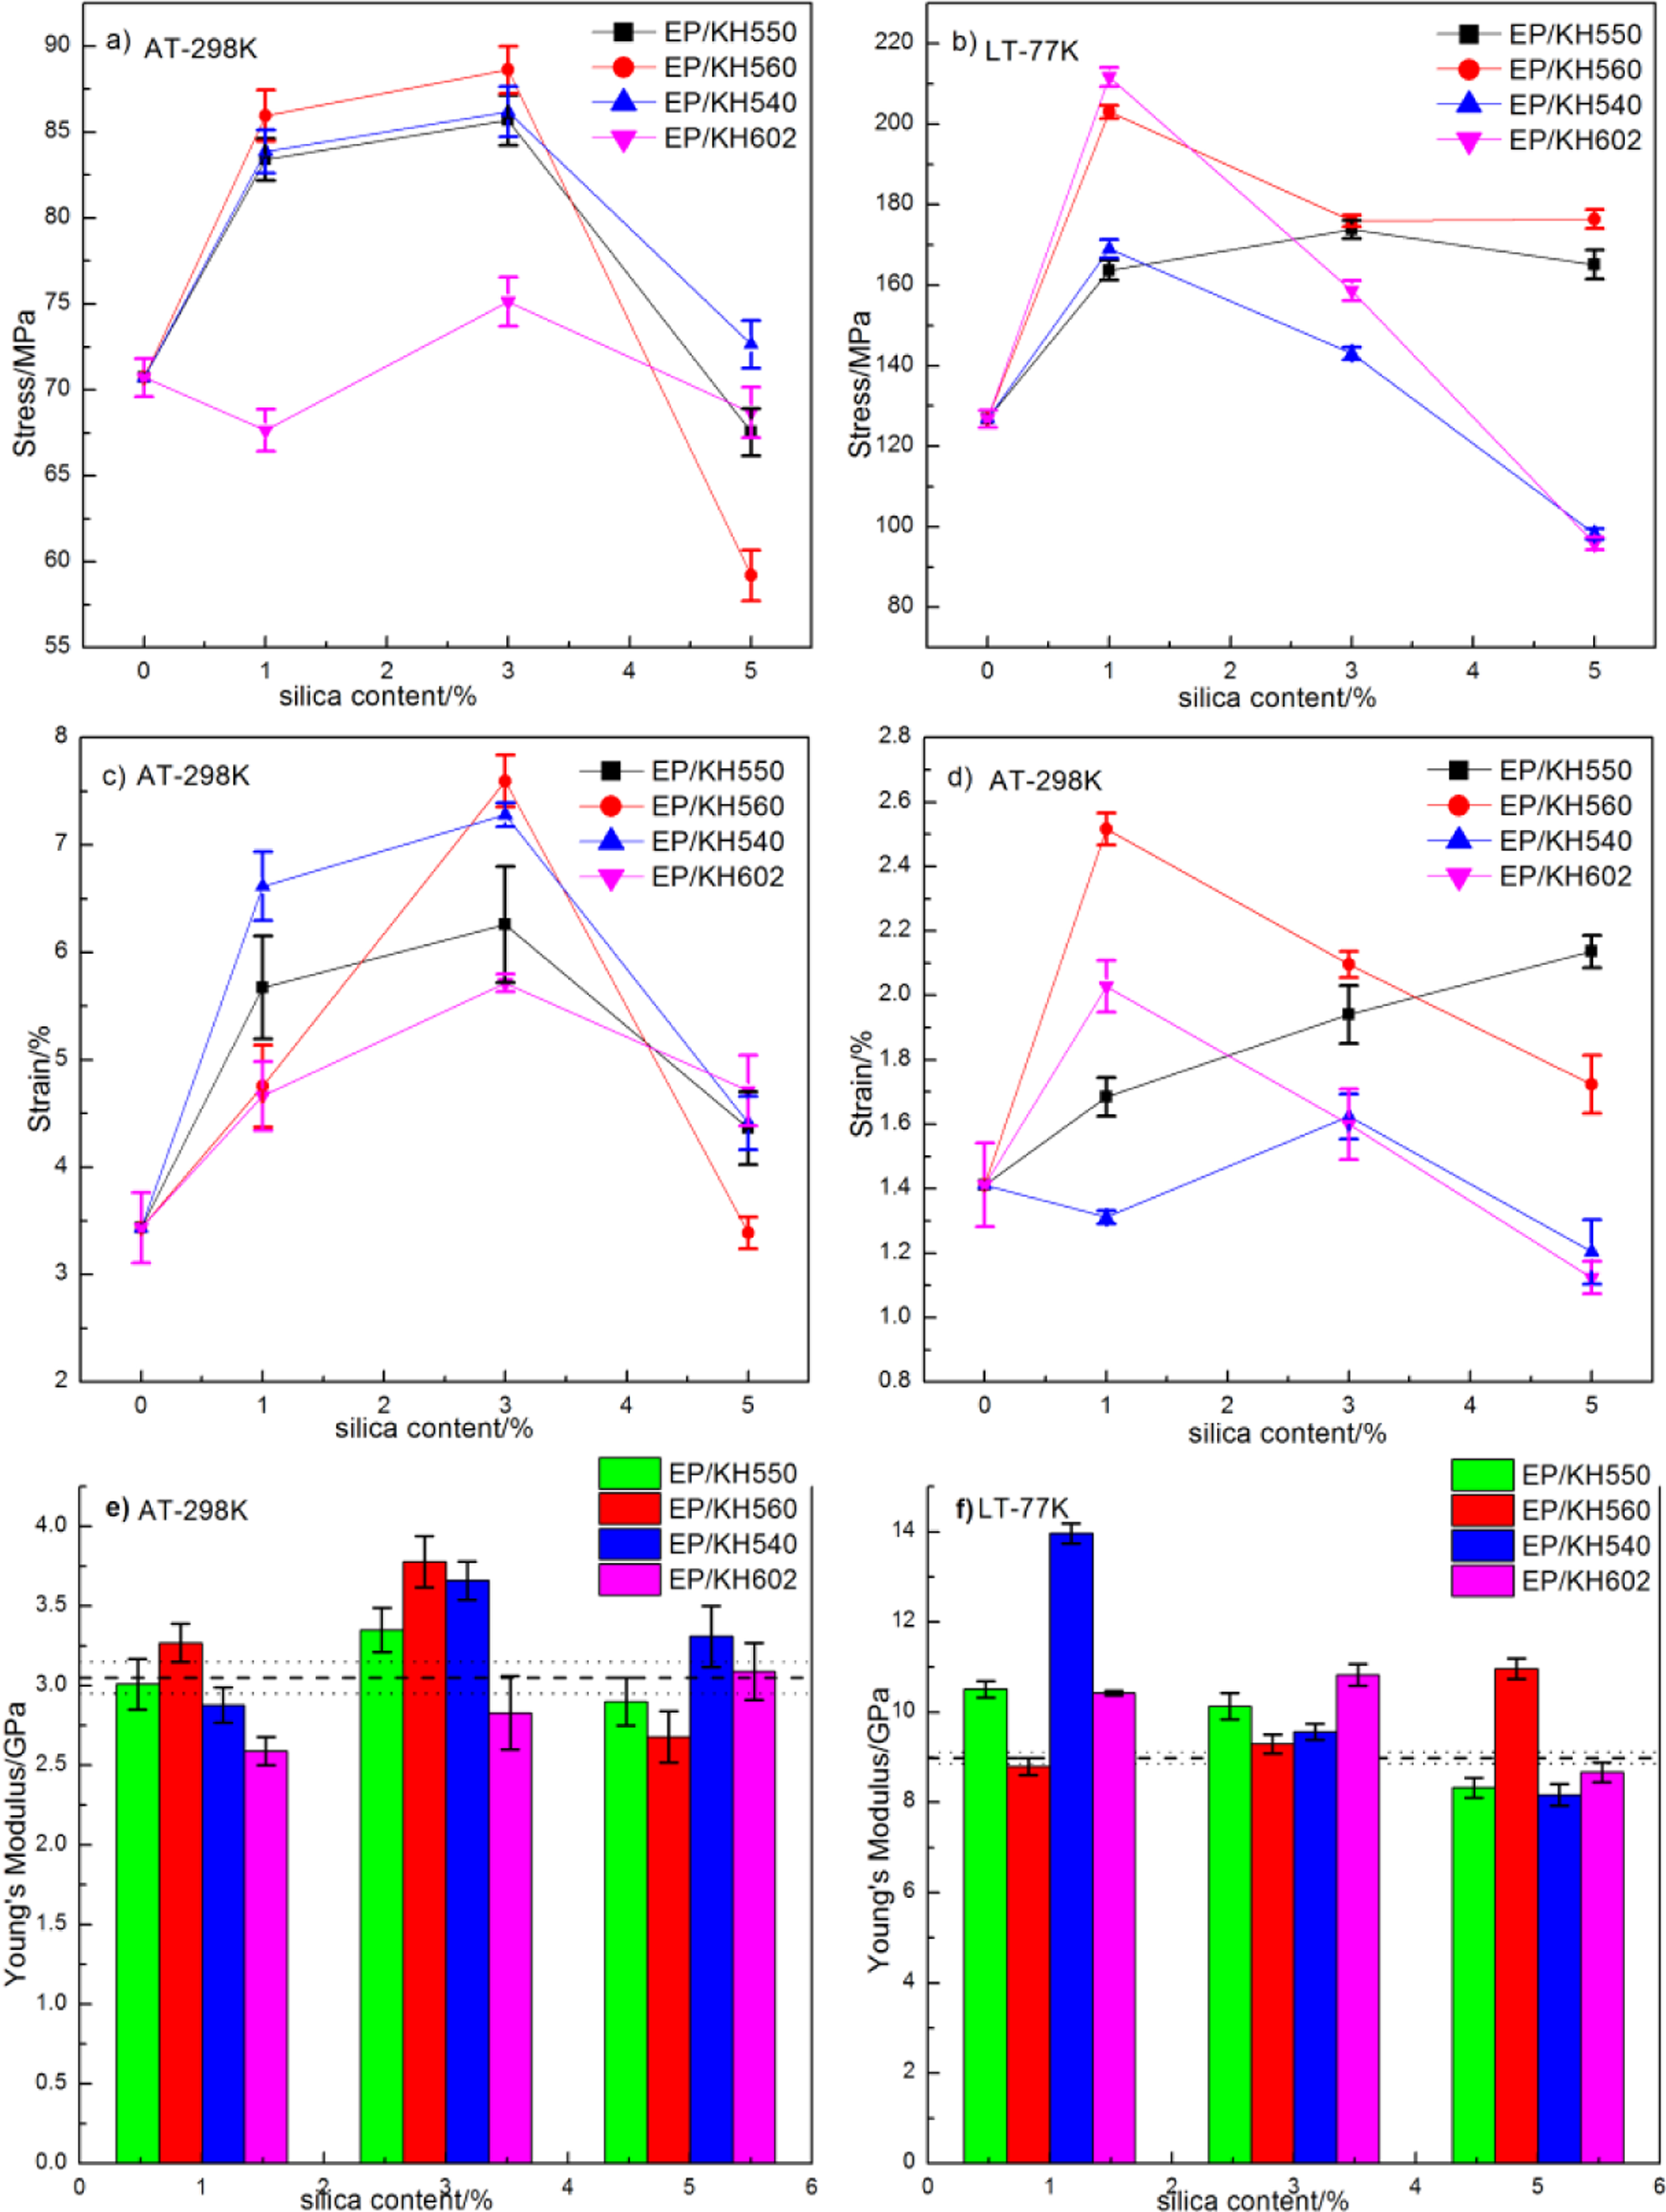
Tensile properties of the composite at AT and LT. (The ultimate tensile strength at AT (a) and LT (b), the strain at AT (c) and LT (d), and the corresponding Young’s modulus at AT (e) and LT (f). The dashed lines are on behalf of the test values of the pure epoxy.) AT: ambient temperature; LT: cryogenic temperature.
The addition of the modified fillers to the epoxy resin significantly improved the strength of the material. The toughening effect of different SCA-modified composites was different. But the enhanced effect of the addition of nanosilica on the tensile properties of the epoxy resin could only be achieved at low silica content (1−3 wt%) both at AT and LT. The decrease in strength and strain could be explained by the fact that the filler tended to cluster due to intermolecular forces (van der Waals and hydrogen bonding) at higher content, which led to weakening of the matrix. Because large agglomerates as defects could induce high local stress concentration and lead to untimely failure.
At filler loadings of 1 and 3 wt%, the silica–nanofillers markedly plasticized the epoxy matrix, improved its elastic modulus (or kept unchanged) and tensile strength, while noticeably increased its failure strain. These results were in agreement with the possible occurrence of better interfacial physical and chemical bonding between polymer phase and filler at lower silica loading. 38 But for the 5 wt% filled sample, the ultimate tensile strength and failure strain underwent a drastic decay, with a little decrease in the modulus compared with that of the unfilled matrix. Such degradation implied that particle agglomeration dominated and restrained the matrix deformation mechanically. The tensile strength of all the composites had the maximum values of 211.7 MPa (1 wt% silica in EP/KH602) at LT and 92.4 MPa (1 wt% silica in EP/KH560) at AT, with increases of 66.9% and 30.7% compared to the neat epoxy. And the changes of the strain at both LT and AT showed an improvement of 121.1% and 78.2% for the EP/KH560 composites.
Furthermore, the modulus was improved at a silica content of 3 wt% both at AT and LT and the modulus at LT was much higher than that at AT. This could be explained that at LT, the mobility of molecules of the matrix and fillers was restrained and became stiffer than that at AT. According to the modified rule of mixtures that is applicable to the polymer blends with the second phase,
39
The difference of the tensile properties of different coupling agents was mainly due to the effect of the dispersion of the fillers caused by the functional organic group and hydrolysable functional group in SCA. The better enhancement by the rigid fillers in tensile properties could result from more evenly dispersion and less agglomeration of the fillers. 38 Generally, the hydrolysable functional group of SCA was first hydrolyzed on the boundary of the interface with silica and generated silanols. Then, parts of unstable silanol groups underwent a condensation with the hydroxyl groups on the surface of silica to form silicon–ether bonds. At the same time, the functional organic group of the SCA could interact with the matrix and form chemical bonds, ion–molecule interaction, or chain entanglement to enhance the filler–matrix interface.
Although all SCAs are with the similar improving trend, as shown in Figure 7, by comparing all SCAs, the results proved that the tensile properties of the composites modified by SCA with the epoxy functional groups (KH560) were better than those with amino ones. This could be explained that the amino groups on the filler surface easily reacted with the epoxy molecules and resulted in some clusters by cross-linking. 11,33 Compared with KH550 and KH540, the KH602 with the amino/imino groups was more likely to cross-link with the epoxy. 28 So, the improvement in tensile properties of the composites modified by KH602 was less than that of the other two silanes with amino. Whereas, the epoxy groups in KH560, without reaction with the matrix, could suppress the agglomeration tendency by reducing attractive forces among fillers and decreasing the viscosity. 33 Another apparent difference that should be noticed was the effect of hydrolysable methoxy and ethoxy functional groups on the tensile properties of the composites among EP/KH550, EP/KH540, and EP/KH602 at 3 wt% silica. Overall, the reinforcement effect (including the magnitude of discrepancies of the tensile test data) of the SCA with ethoxy functional groups (EP/KH550) was better than that of SCA with methoxy (EP/KH540) and methyl groups (EP/KH602). This was because the hydrolysis rate of the ethoxy groups was slower than that of methoxy and methyl groups. The rapid rate of hydrolysis would form macromolecular network and reduce the binding and interfacial adhesion of fillers with SCAs.
Figure 8(a) and (b) reveals the results of K IC at AT and LT for the specimens with different coupling agents. It was noteworthy that the improvement of the fracture toughness for all the composites at LT was more obvious than that at AT and the fracture toughness tended to increase at LT. 42 In all cases, the fracture toughness at AT and LT exhibited a maximum at 3 wt% of silica (except the EP/KH602 at LT). This result was absolutely different from the report of Kim, 42 who found that the value of K IC decreased as the nanofiller increased. The improvement in fracture toughness of the composites at AT was smaller compared to those at LT. For the specimens modified with KH550 and KH560 (Figure 8(a)) at AT, the treatment almost achieved the same improvement of 18% in fracture toughness. For SCA-modified epoxy at LT, the results were significantly different. Fillers modified by KH550 and KH560 resulted in a maximum improvement of 25.6 and 23.5% in fracture toughness at 3 wt% silica content. The epoxy filled with 5 wt% silica treated by KH602 showed the highest increment in K IC. Usually, the metal tends to be brittle and the fracture toughness decreases quickly at LT. But it is interesting that the fracture toughness increases at LT (77 K) for the epoxy resins. The reason could be explained based on the research of Nishijima et al. They reported that the change of K IC at AT and LT was related with free volume or free space in the epoxy system, which meant unoccupied space between or within molecules in the three-dimensional networks formed by epoxy. 43 The K IC increased with the increase of free volume or free space at AT, but at LT, the free volume would disappear so that the K IC decreased. However, the free space could still exist and the intermolecular forces within molecular chains would make the K IC increase. In his another research, 44 he studied the relationship between the content of silica and SCA and the K IC at LT. It was found that the addition of silica increased the size of free volume in epoxy, which almost disappeared at LT and led to the reduction of K IC . Meanwhile, the SCA could reduce the size of the free volume by cross-linking the epoxy molecules and the silica. So, the competitive effect of silica and SCA resulted in the downward trend of K IC after first rise at AT. And the moderate hydrolysis or alcoholysis rate of –O–C2H5 than that of –O–CH3 led to the better coupled effect of KH550 with silica than that of KH540 and KH560. Besides, the number of hydrolysis functional groups of KH602 was less than that of other three SCAs. Therefore, covalent bond between the KH602 and silica was relatively weaker than that of other SCAs. So at AT, the K IC of the composite EP/KH550 and EP/KH560 was higher and the K IC of EP/KH602 was the least. At LT, the inherent free space in epoxies’ three-dimensional networks made the K IC higher than that at AT. The number of ethoxy or methoxy in SCA would bring about linear chains upon self-condensation of KH602 (see Figure 3(d)) and three-dimensional structures of KH550, KH560, and KH540 (see Figure 3(a) to (c)). 45 Different silane structures have little influence on the K IC at AT. But at LT, the K IC of composites with two-dimensional linear chains was proved to be higher than that of composites with three-dimensional cross-linked structure. 46 So at LT, the K IC of EP/KH602 was highest and the K IC of other composites was nearly the same.
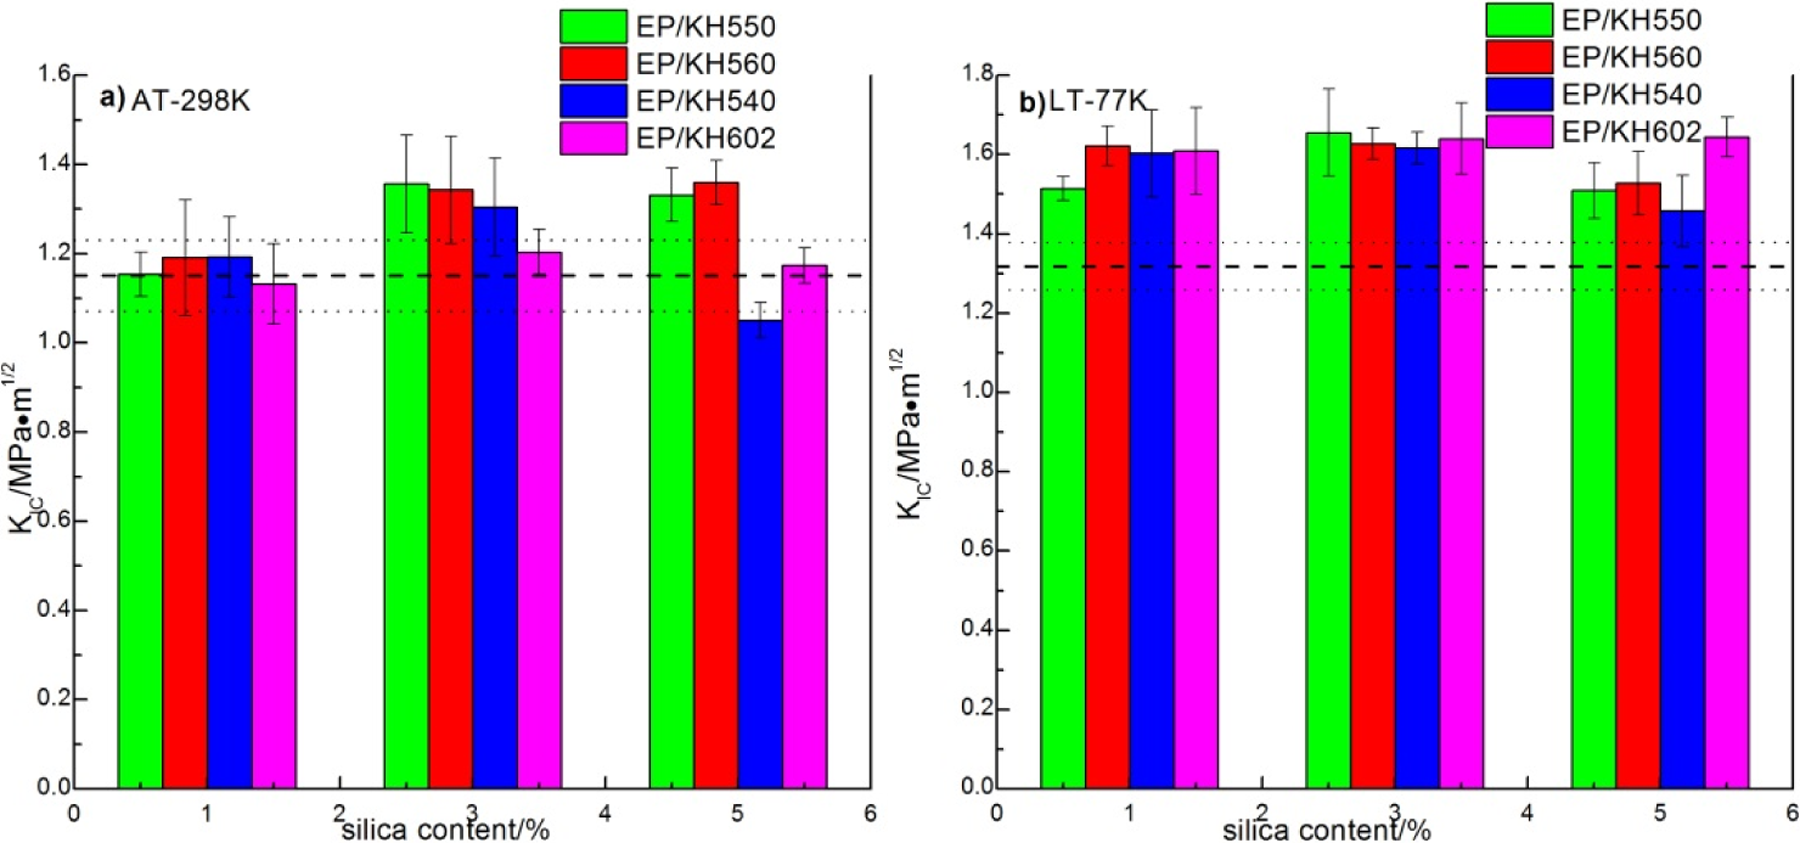
Fracture toughness test (K IC for all the composites at AT (a) and LT (b) and the dashed lines are on the behalf of the test values of the pure epoxy).
Morphological structure of fracture surfaces
The mechanical behavior of the modified system could be explained in terms of morphology observed by SEM. Images shown in Figure 9 are the tensile fracture microphotographs of the pure epoxy matrix and the composites. From the photograph (Figure 9(a) and (b)), for pure epoxy resin, a smooth and straight glassy fractured surface with cracks in different planes could be seen, while with large size fragments pulled out of the fractured surface (Figure 9(a), in red circles). This indicated the brittle fracture of the pure epoxy resin, which accounted for its poor mechanical strength at AT. Furthermore, the fracture surfaces of the samples at LT were much smoother with less ribbons and river lines than those at AT, which could account for the lower failure strain at LT (Figure 7(d)). Meanwhile, it could be explained that the high tensile strength at LT resulted from the more fracture steps on the ribbons at LT than that at AT (Figure 7(b)). For the composites both at AT and LT (Figure 9(c) to (j)), the addition of silica functionalized with SCAs led to severely corrugated surfaces, increased surface roughness, and massive shear deformation like indentations, deep cracks, or dimples with irregular shapes on the fracture surfaces.
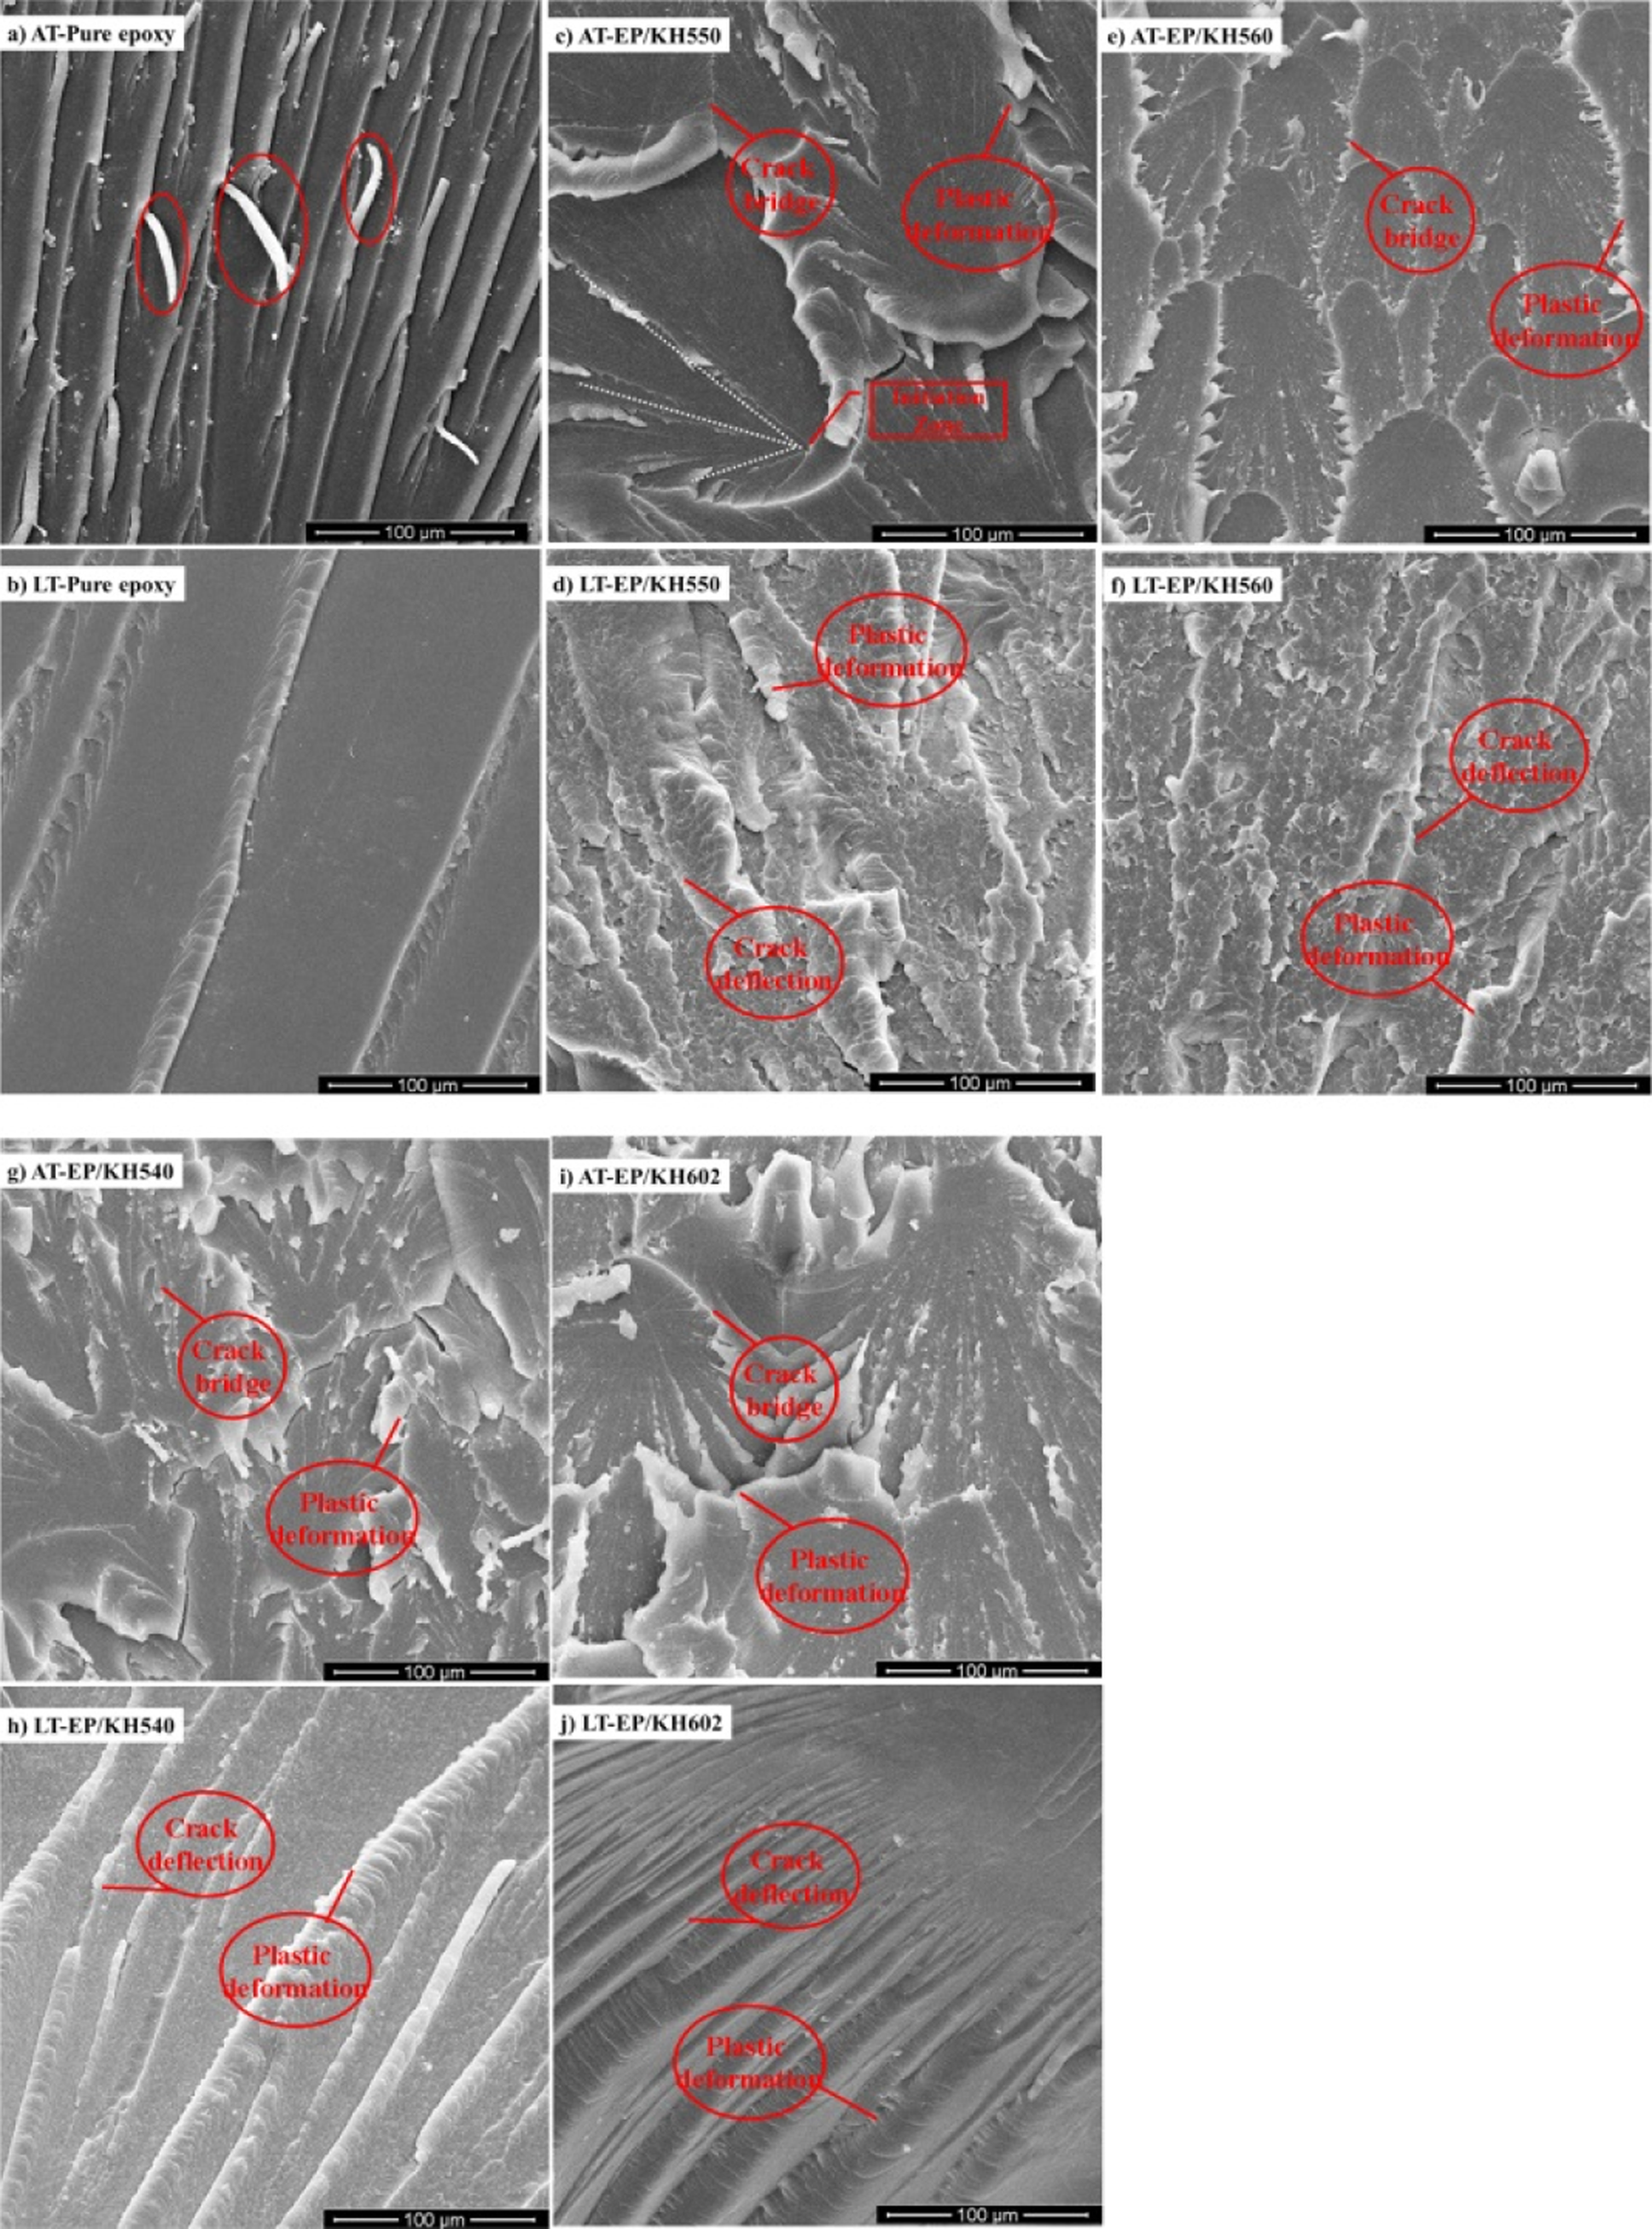
SEM images of the fracture surfaces of the composite at AT and LT: pure epoxy at AT (a) and at LT (b), EP/KH550 at AT (c) and at LT (d), EP/KH560 at AT (e) and at LT (f), EP/KH540 at AT (g) and at LT (h), and EP/KH602 at AT (i) and at LT (j). (The modified system is with the silica content of 3 wt%. Scale bars are all 100 μm.) SEM: scanning electron microscopy; AT: ambient temperature; LT: cryogenic temperature; EP: epoxy.
However, the appearance of the rough regions of composites at AT and LT was entirely disparate. At AT (Figure 9(c), (e), (g), and (i)), a large quantity of crack initiation zones could be found (typically shown in Figure 9(c)) and substantially longitudinal texture emanating radially from the dimple was indicated by the dashed lines, which was also called the direction of crack propagation. 47 As is well known, much fracture energy is consumed by the zone of critical and subcritical crack growth. And it was likely to dissipate the fracture energy by the new fracture surfaces resulted from the formation of dimples and the considerable branching of the primary crack. But there were large cracks and many segments on the surfaces (Figure 9(g) and (i)), which were detrimental to the mechanical properties of the composites. From Figure 9(c), (e), (g), and (i), there were less ridges around the dimples and less corrugated fragments on the surface of EP/KH560 than that of EP/KH550, EP/KH540, and EP/KH602. This indicated that the SCA with epoxy made the filler more compatible with epoxy than that with amino. And the density of these dimples could be sorted easily by KH560–AT > KH550–AT > KH540–AT > KH602–AT from the SEM results (Figure 9(c), (e), (g), and (i)), corresponding to the tensile results (Figure 7(a)). This could be interpreted that under the mechanical stress, the modified nanofillers seemed to increase the shear yielding of the composite and distort the path at the tip of the propagating crack throughout the entire volume. In addition, other possible reasons might be ascribed to the special interaction between the nanofiller and the polymer, which would constrain the mobility and rearrangement efficiency of the polymer chain.
For composites at LT (Figure 9(d), (f), (h), and (j)), the surface roughness and ribbons increased compared to the pure epoxy, which could presumably be responsible for the observed increase in the tensile strength (Figure 7(b)). However, the fracture pattern of EP/KH540 and EP/KH602 (Figure 9(h) and (j)) did not show an apparent difference compared to that of the pure epoxy polymer except that of EP/KH550 and EP/KH560 (Figure 9(d) and (f)). For EP/KH540 and EP/KH602, there were just more ribbons on the surface than that of the pure epoxy. But for EP/KH550 and EP/KH560, there were rougher surfaces, more tortuous deformation lines, and shear yielding deformations than those on the surfaces of EP/KH540 and EP/KH602. Besides, the slight debonding on EP/KH560 revealed a better adhesion between the nanofiller and the matrix than that of EP/KH550. The relatively high tensile strength of the composite could be partly attributed to the rough microstructures on composites, and it was also identical to the results of tensile tests (Figure 7(b)). The tortuous lines, crack forking, and feather strips on the fracture surfaces of the composites implied that the composites displayed a typical mode of brittle fracture and the crack paths were deflected from their original planes.
According to Wetzel’s research, 48 crack deflection, plastic deformation or debonding of the matrix, and crack pinning are major fracture mechanisms for thermosetting polymers and their particle-filled version. And usually two or three of these theories need to be combined together to fully explain the toughening effect of the observed behavior. Crack deflection usually means that the crack was forced by the particle to move out of its initial propagation plane by tilting and twisting. Plastic deformation or debonding of the matrix is an important toughening mechanism in particle-filled composites because the rigid particles can facilitate the change from plane strain state to plane stress conditions and result in shear yielding in the composite. Some characteristic features of this mechanism can be plastic deformation, formation of cavities/debonding, shear banding, and crack bridging. Crack pinning means that the crack is pinned by the particle that acts as obstacles in epoxy. And it usually results in secondary cracks and more new fracture surfaces.
From the results of fracture surface, a preliminary analysis is discussed and discussion about the fracture mechanism in detail will be conducted in the future. At AT (Figure 9(c), (e), (g), and (i)), some features of the plastic deformation or debonding of the matrix toughening mechanism have been marked in the SEM results and secondary cracks also could be found. So at AT, the major toughening mechanism for all modified composites was a combination of plastic deformation or debonding of the matrix and crack pinning. At LT (Figure 9(d), (f), (h), and (j)), the cracks were deflected from their original planes and plastic deformation could be found in the picture. So, for EP/KH540 and EP/KH602, the toughening mechanism at LT included plastic deformation or debonding of the matrix and crack deflection. But for EP/KH550 and EP/KH560, the rougher surface and new fracture surface revealed that crack-pinning toughening mechanism might also be incorporated. Summarily, the difference in coupling agent did influence the mechanical properties of the composites at LT.
Conclusion
In this work, silica modified by four different SCAs was used to fabricate the composites. TEM and FTIR confirmed that KH560-modified silica had better dispersion in the matrix than other amino-silane-modified silica did. And KH602-modified silica seemed to form linear chains rather than three-dimensional network formed by other SCAs, and SCAs were successfully grafted on the surface of silica. DSC analysis of the modified composites showed that the addition of SCAs could improve the thermal properties of the composites. Because of the difference in hydrolysis rate and the length of nonhydrolytic groups of SCA, it was recommended that amino–silane should better be used at low silica content, while epoxy−silane (KH560) could be utilized at high silica content. The mechanical properties of the modified composite at AT and LT were improved by incorporation of the SCAs at lower silica content, especially the failure strain. The trend of modulus at AT and LT was very complicated and needs further investigation in the future. The reactivity of functional organic group with the matrix and the hydrolysis rate of the hydrolysable functional group of SCA were used to explain the discrepancy of the tensile test data at AT and LT. For all composites, composite (EP/KH560) modified by SCA with epoxy group had a superior performance than that of the composites modified by SCA with amino groups. And in all amino-silane-modified composites, the tensile properties of composite (EP/KH550) modified by SCA with ethoxy hydrolysable functional group had an advantage over that of the others. The theory of free volume or free space in epoxy system and the silane structure was compared to explain the trends of K IC at AT and LT. Generally speaking, the K IC of the composite EP/KH550 and EP/KH560 at AT and LT was higher than that of other two composites. By comparing the different morphological structures of fracture surfaces of all composites at AT and LT, the roughness of the fracture surfaces was approximately consistent with mechanical properties and a preliminary analysis on the toughening mechanism was obtained. It seemed that the major toughening mechanism at AT was a combination of plastic deformation or debonding of the matrix and crack pinning. However, the mechanism at LT included plastic deformation or debonding of the matrix and crack deflection for EP/KH540 and EP/KH602 and crack-pinning toughening mechanism might also be incorporated for EP/KH550 and EP/KH560. Above all, it concluded that the SCA with epoxy group (KH560) and ethoxy groups (KH550) was the best choice for nanofillers toughening composites both at AT and LT with lower filler content.
Footnotes
Declaration of Conflicting Interests
The author(s) declared no potential conflicts of interest with respect to the research, authorship, and/or publication of this article.
Funding
The author(s) disclosed receipt of the following financial support for the research, authorship, and/or publication of this article: This work was supported by the National Natural Science Foundation of China (11172053, 91016024, 51102031, and 11302036), the New Century Excellent Talents in University (NCET110055), and the Fundamental Research Funds for the Central Universities (DUT12LK33 and DUT14LK26).