
Abstract
A series of new aromatic polyamides (PAs) and copolyamides (CPAs) containing fluorene group have been synthesized through polycondensation reaction. The chemical structure was confirmed by Fourier transform infrared and proton nuclear magnetic resonance (1H NMR). PAs and CPAs exhibited the higher thermal stability (Td15 > 378°C in nitrogen), the higher glass transition temperature (Tg > 345°C), and excellent solubility in polar solvent. Gas transport properties of the PA and CPA membranes were investigated using different single gases (hydrogen (H2), carbon dioxide (CO2), oxygen (O2), methane (CH4), and nitrogen (N2)). We discussed the effect of chemical structure and operating temperature on gas transport properties. The results show that PA-1 containing a hexafluoroisopropylidene moiety exhibited the highest gas permeability (PH2 = 12.71 Barrer, PCO2 = 12.26 Barrer, and PO2 = 2.62 Barrer) and reasonably good selectivity (α(H2/N2) = 27.63, α(CO2/N2) = 26.65, and α(O2/N2) = 5.70) at 25°C and 1 atm. For all the membranes, gas permeability gradually increased with the increase in operating temperature, while the selectivity gradually decreased. These gas permeation results were well correlated with fractional free volume, interchain d-spacing (dsp), and intermolecular interaction.
Introduction
Gas separation process using membrane technologies introduces significant attention over traditional separation processes, such as cryogenic distillation and pressure swing adsorption, because of its flexibility in operation, enhanced process safety, and lower operating costs. 1 –6 To date, the development of membrane sciences has undergone significant progress from the early polymeric membranes to inorganic, composited, and more advanced polymeric membranes and is capturing the attention of industrial separation area. 7 –10 When compared with the other kinds of gas separation membranes, polymeric membranes possess unique advantages such as easy fraction, low production cost, and excellent physical and mechanical properties, and these membranes are still the frontiers in gas separation area. 11 –13 Today, polymeric membranes mainly include rubbery, glassy, and block copolymer membranes, which have been successfully used in gas separation precesses. 14 –16 However, the gas separation performance of polymeric membranes always suffers from an inherent trade-off between permeability (P) and selectivity (α), which limit the application of polymeric membranes in large-scale industrial processes. 17,18 The development of effective strategies to overcome the above trade-off challenges is necessary in membrane science and technologies. 19,20
Gas molecules use pressure-driven gas separation process and comply with solution-diffusion mechanism through the polymeric membranes. In the first stage, the gas molecules are absorbed on the high-pressure surface of polymeric membranes; then, these gas molecules diffuse through polymeric membranes by jumping through adjacent holes based on the fractional free volume (FFV). Finally, these gas molecules are desorbed on the low-pressure surface of the polymeric membranes. 21 –23 Theoretically, high FFV in polymeric membranes leads to higher gas permeability. In general, high selectivity can be attained by increasing backbone chain rigidity and glass transition temperature (Tg) in polymers. 13,15,24 A polymer with high permeability and selectivity, along with excellent physical and mechanical properties, is considered as the most ideal material for gas separation. Thus, FFV, backbone chain rigidity, and interchain distance are crucial factors in the gas separation performance of polymeric membranes. 25
To overcome the trade-off between permeability and selectivity, an effective strategy is to design and prepare new polymers that possess high FFV, backbone chain rigidity, and excellent physical and mechanical properties. Recently, many teams have reported a host of new aromatic polyamide (PA) membranes with high FFV and backbone chain rigidity, and these membranes showed high gas permeability and selectivity for different gas pairs such as CO2/N2, CO2/CH4, O2/N2, and so on. Bera et al. introduced adamantine-substituted triphenylamine into PAs. The synthesized PAs showed excellent separation efficiency for O2/N2 gas pairs and high gas permeability for CO2 and O2 due to its full aromatic backbone and high FFV. PA 8b, in particular, exhibited high gas permeability (PO2 = 14.2 Barrer) and reasonably good selectivity (PO2/PN2 = 10.14) in the series. 26 Santiago-Garcia et al. reported novel aromatic PAs and CPAs bearing bulky functional groups such as –OH, –tert-butyl, and 3,5-bis(trifluoromethyl)benzoyl. The results showed that CPA bearing 3,5-bis(trifluoromethyl)benzoyl exhibited higher FFV, thus showing high gas permeability (PCO2 = 60.17 Barrer) as compared to the other PAs and CPAs bearing –OH and –tert-butyl. 27 Bisoi et al. prepared aromatic PAs containing trityl-substituted triphenylamine. The PA membranes exhibited a considerably high selectivity for CO2/CH4 and O2/N2 gas pairs because of its rigid backbone and high FFV. For instance, PA “A” showed high permeability (PCO2 = 141 Barrer and PO2 = 33.4 Barrer) and the excellent selectivity (PCO2/PCH4 = 44.33 and PO2/PN2 = 8.47). 28 A similar phenomenon was also reported in other studies. 29 –31 Therefore, the bulky and rigid groups were introduced into PAs, which inhibited local segmental chain mobility and increased FFV, and in turn, improved selectivity and gas permeability.
In our study, aromatic PAs and CPAs with high FFV and backbone chain rigidity were designed and prepared through the introduction of a fluorene group. We also discussed the synthesis, thermal stability, and gas transport properties of a series of full aromatic PAs and CPAs derived from the polycondensation reaction of 4,4′-(9-fluorenylidene)dianiline (9FDA) and two commercial diacids, namely, 4,4′-oxybis(benzoic acid) (OBA) and 4,4′-(hexafluoroisopropylidene)bis(benzoic acid) (HFA). In addition, we further discussed the relationships between structure and gas transport properties of PA and CPA membranes.
Experimental
Materials
OBA (purity: 98%), HFA (purity: 98%), aniline (purity: 99%), aniline hydrochloride (purity: 99%), and 9-fluorenone (purity: 99%) were purchased from Aladdin (China) and used as received. Anisole, potassium hydroxide, xylene, toluene, tetrahydrofuran (THF), chloroform, N,N-dimethylformamide (DMF), N,N-dimethylacetamide (DMAc), N-methyl-2-pyrrolidinone (NMP), dimethyl sulfoxide (DMSO), and methanol were supplied by Tianjin Reagent Co., Ltd, China, and used without further purification. Triphenyl phosphite (TPP, purity: 99%), pyridine (Py, purity: 99%), and calcium chloride were purchased from Sinopharm Chemical Reagent Co., Ltd, China, and used without further purification. Cylinders of single-gas CO2, O2, H2, CH4, and N2 (99.9%) were purchased from Gas Production Plant, Taiyuan, China. Synthesis of 9FDA was depicted in Figure 1. Detailed preparation process of the 9FDA is given in section “Synthesis of 9FDA.”
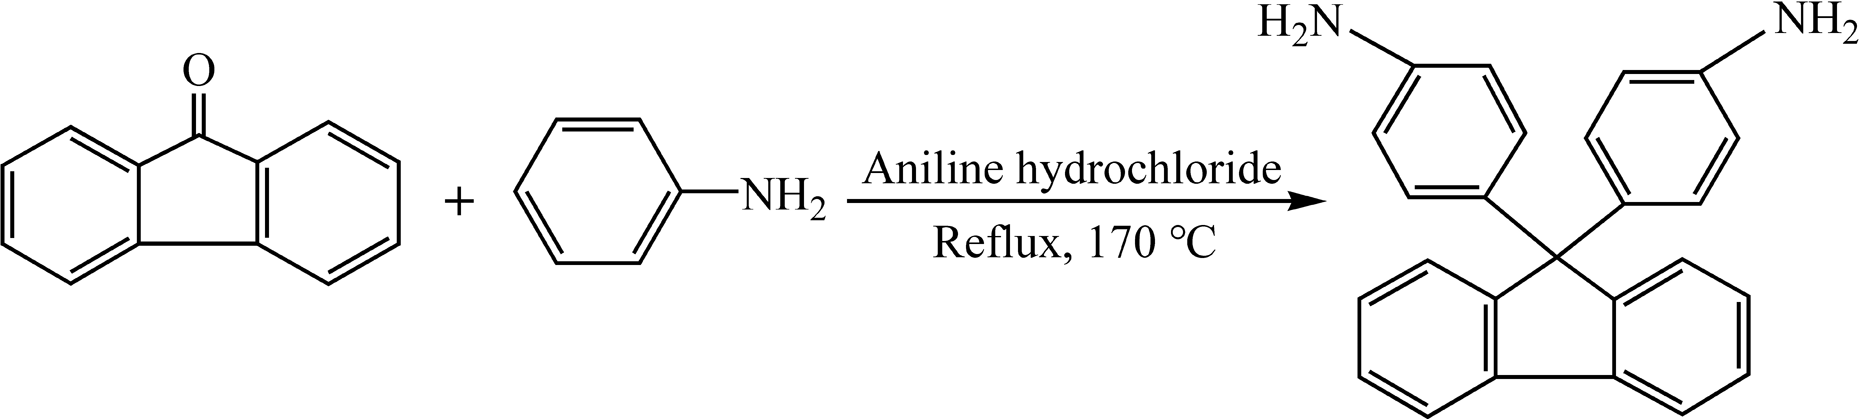
Synthesis of 4,4′-(9-fluorenylidene)dianiline monomer.
Synthesis of 9FDA
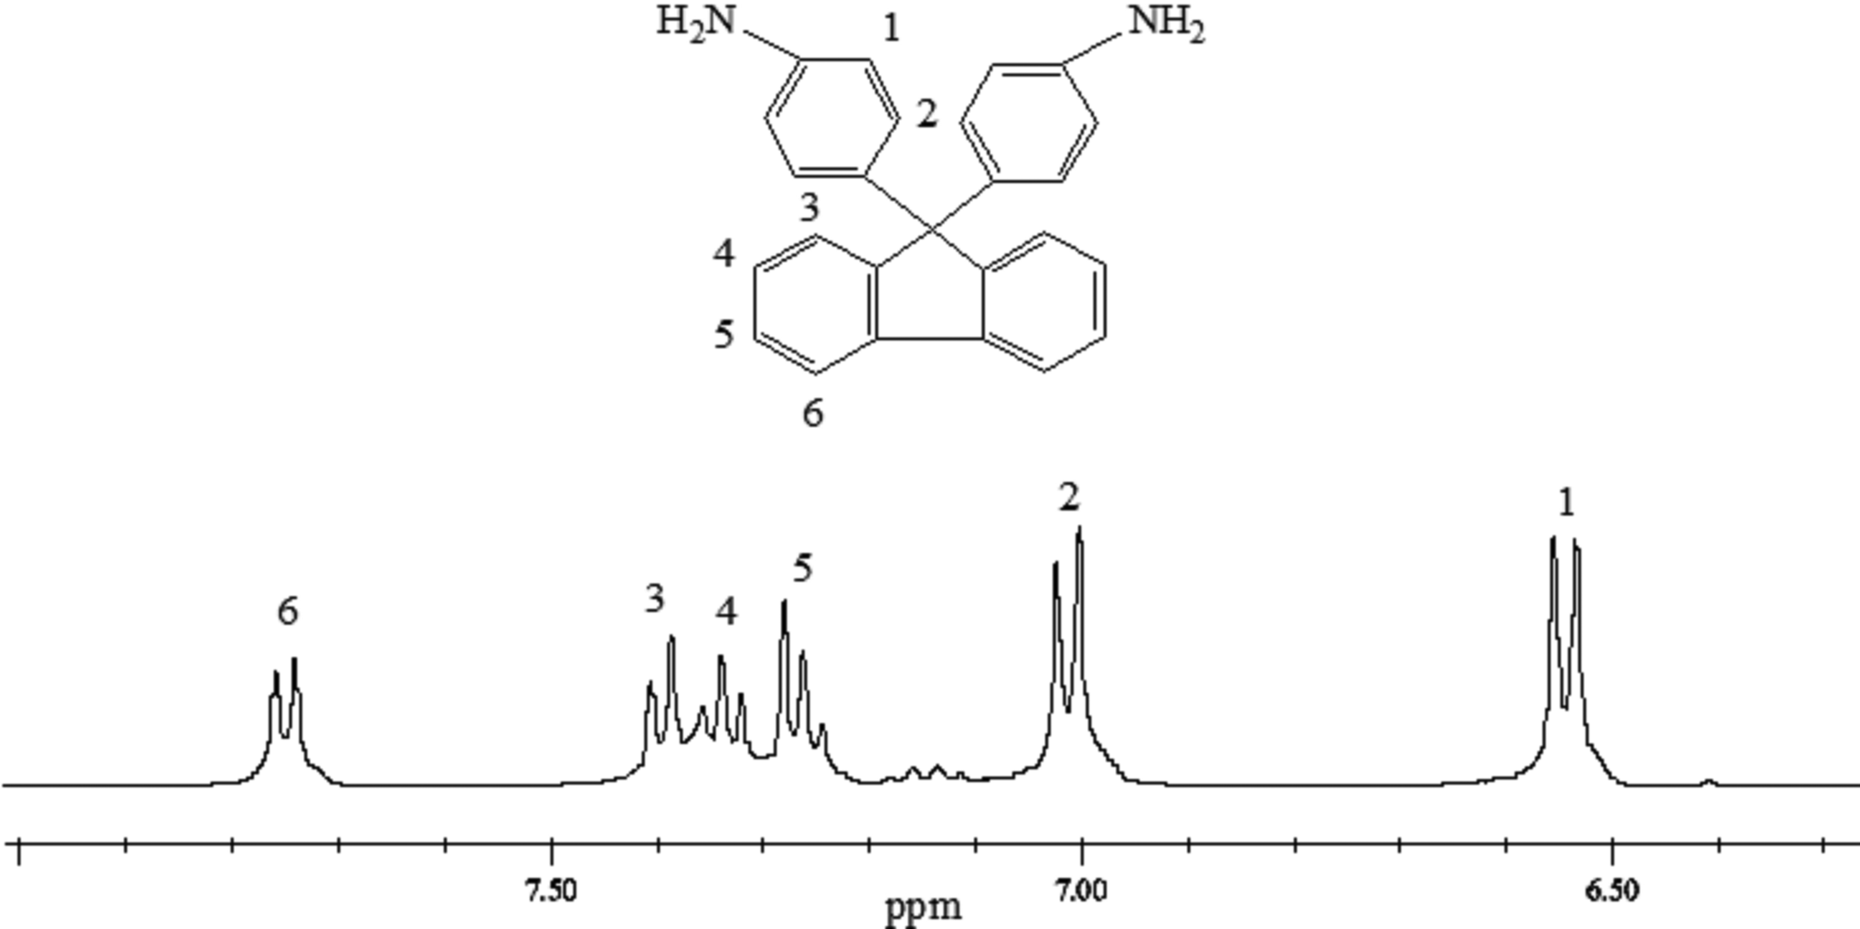
9FDA, as illustrated in Figure 1, was synthesized by the reaction of 9-fluorenone and aniline 32 , and it was then used as a monomer to synthesize polymers. A mixture of 9-fluorenone (22.5 g, 0.125 mol), aniline (182 mL, 1.375 mol), aniline hydrochloride (82 g, 0.625 mol), and 20 mL toluene were taken in a 500-mL round-bottom flask equipped with magnetic stirring bars and a reflux condenser with water separator. The mixture was heated at 170°C with continuous stirring, and the reaction was kept under reflux for 2 h under 35 mL min−1 of nitrogen flow velocity; 10 wt% KOH solution was slowly added into the aforementioned mixture until the solution became alkaline. The mixture was boiled for 10 min and was cooled at the room temperature. Then, a large number of brown powders were precipitated out from the mixture. The crude product was recrystallized for four times using the mixed solution of anisole/xylene (150%, v/v). Subsequently, the crude product was altered into the white powders. The 9FDA was dried in a vacuum oven at 60°C for 12 h. Yield: 87.9%. Nuclear magnetic resonance (NMR), deuterated chloroform, 298 K, δ ppm: 7.86–7.66 (d, 2H, H6), 7.48–7.36 (d, 2H, H3), 7.36–7.32 (t, 2H, H4), 7.32–7.20 (t, 2H, H5), 7.09–6.90 (d, 4H, H2), and 6.69–6.45 (d, 4H, H1) (Figure 2).

1H NMR spectra of 9FDA monomer in CDCl3. 1H NMR: proton nuclear magnetic resonance; 9FDA: 4,4′-(9-fluorenylidene)dianiline; CDCl3: deuterated chloroform.
Synthesis of PAs
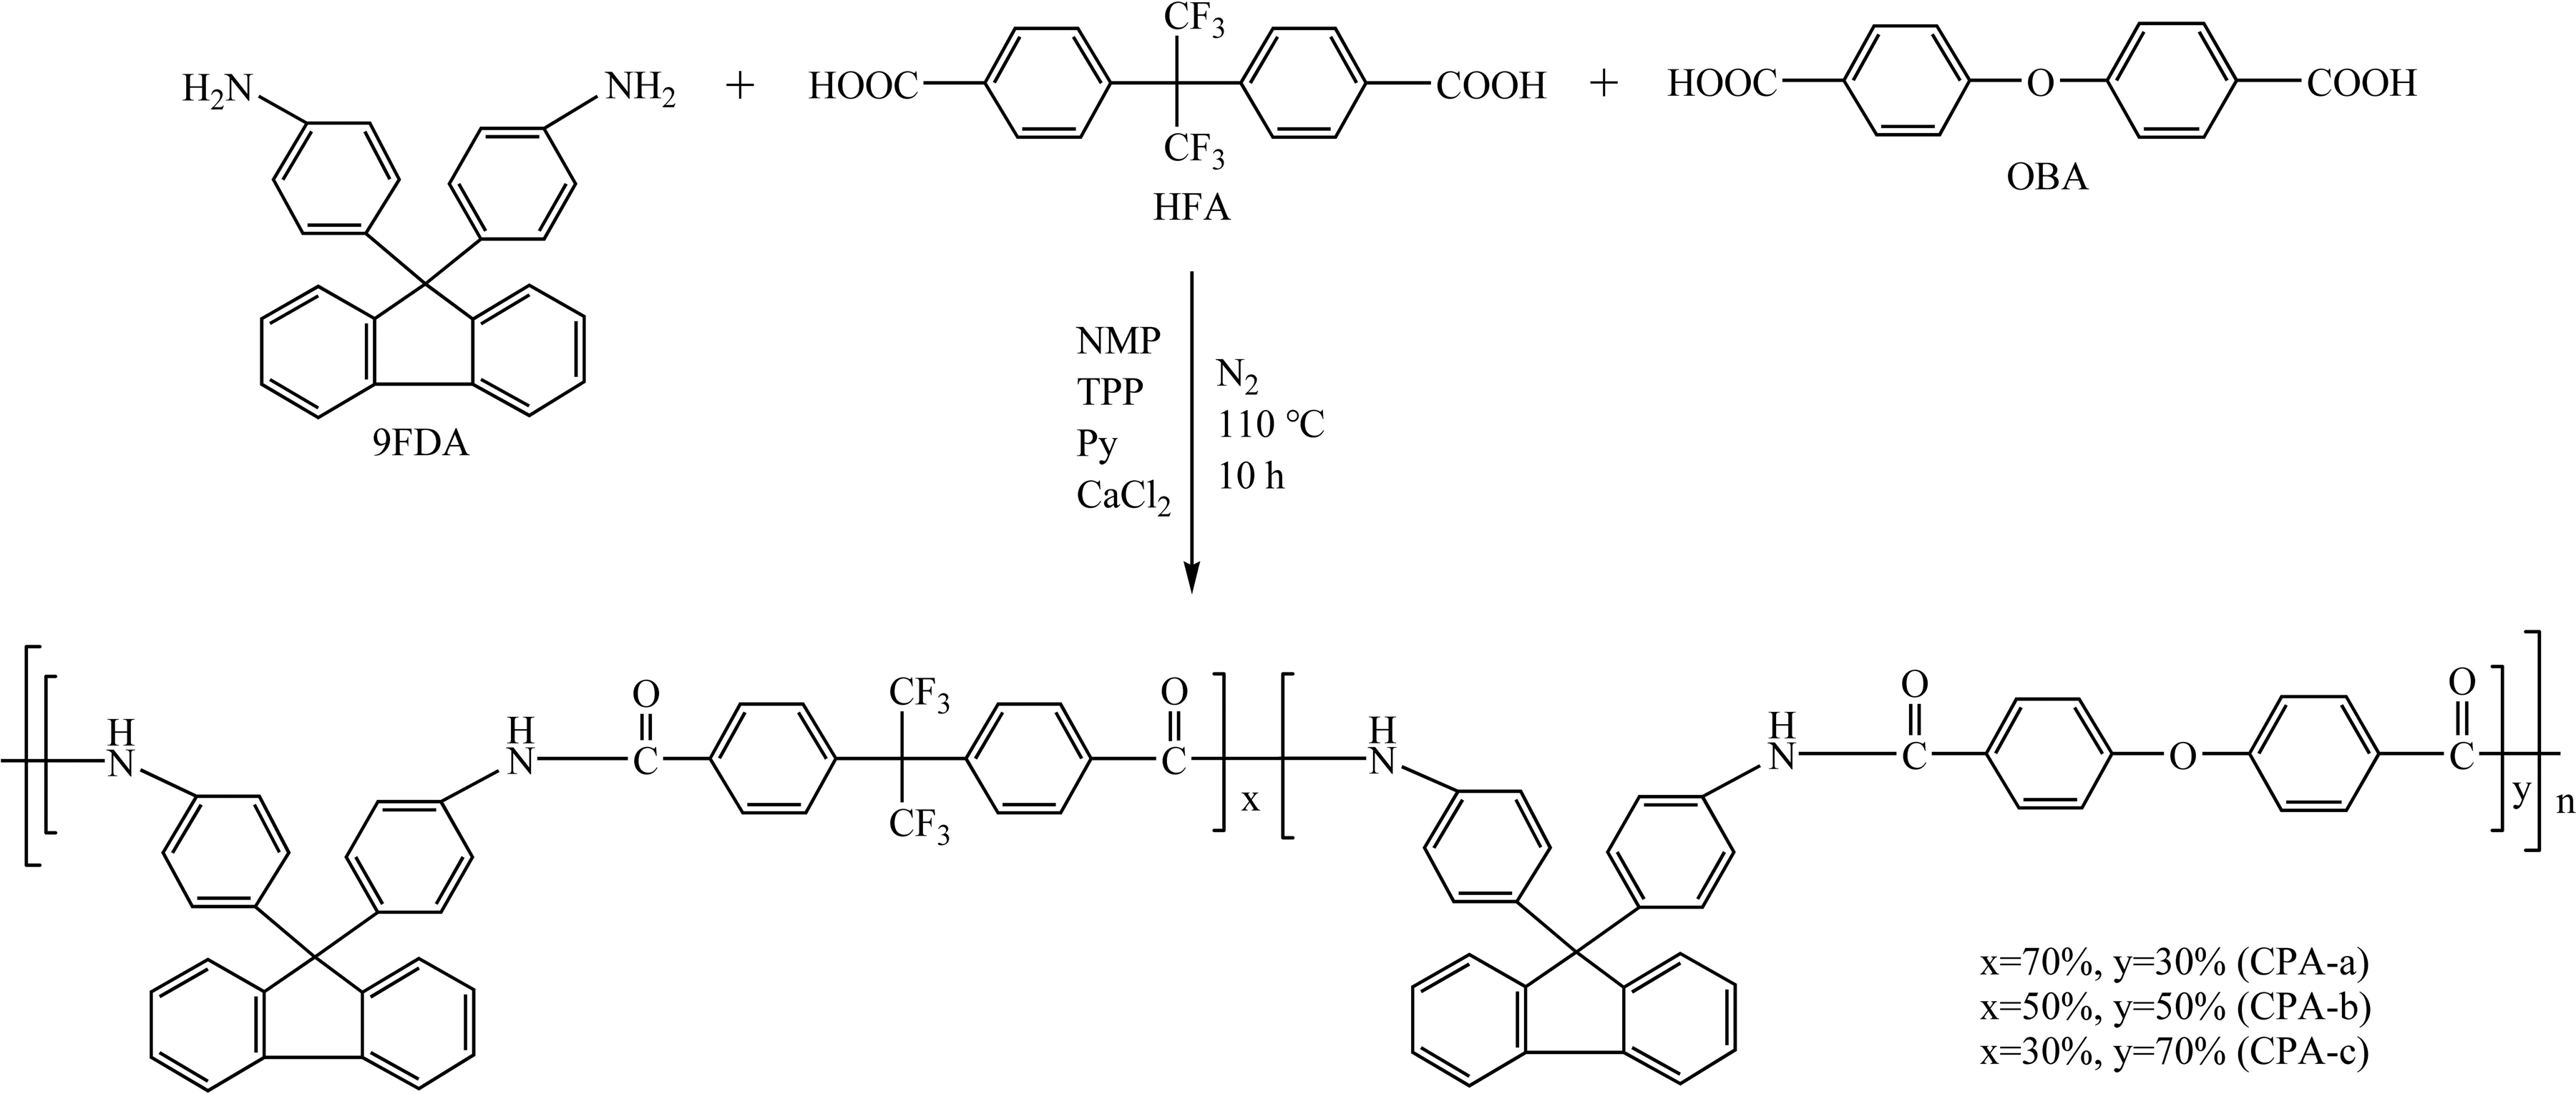
As shown in Figure 3, aromatic PAs containing fluorene group were synthesized through polycondensation reaction. A typical procedure for the synthesis of PA-1 is as follows: 9FDA (0.397 g, 1.14 mmol), HFA (0.447 g, 1.14 mmol), 1.4 mL of Py, TPP (1.4 mL, 5.34 mmol), 5 mL of N-methyl-2-pyrrolidone (NMP), and 0.36 g calcium chloride were taken in a 100-mL round-bottom flask equipped with a reflux condenser and a nitrogen inlet. The reaction mixture was heated at 110°C for 10 h with continuous stirring. The resulting polymer was cooled at the room temperature and was poured slowly into 100 mL methanol. The yellow fibrous product was obtained, filtered, and washed several times with methanol followed by hot and cold deionized water to remove the adsorbed solvent and residual CaCl2. The polymer was dried in a vacuum oven at 60°C for 24 h. Finally, 0.810 g PA-1 was obtained with a yield of 96%. PA-2 was successfully synthesized using the same procedure as described in the synthesis of polymer PA-1. The molecular feed ratio of monomers and the polymerization results are presented in Table 1.
Synthesis of PA-1(2). PA: polyamide.
The monomer feed, ηinh, ρ, and FFV of PAs and CPAs.
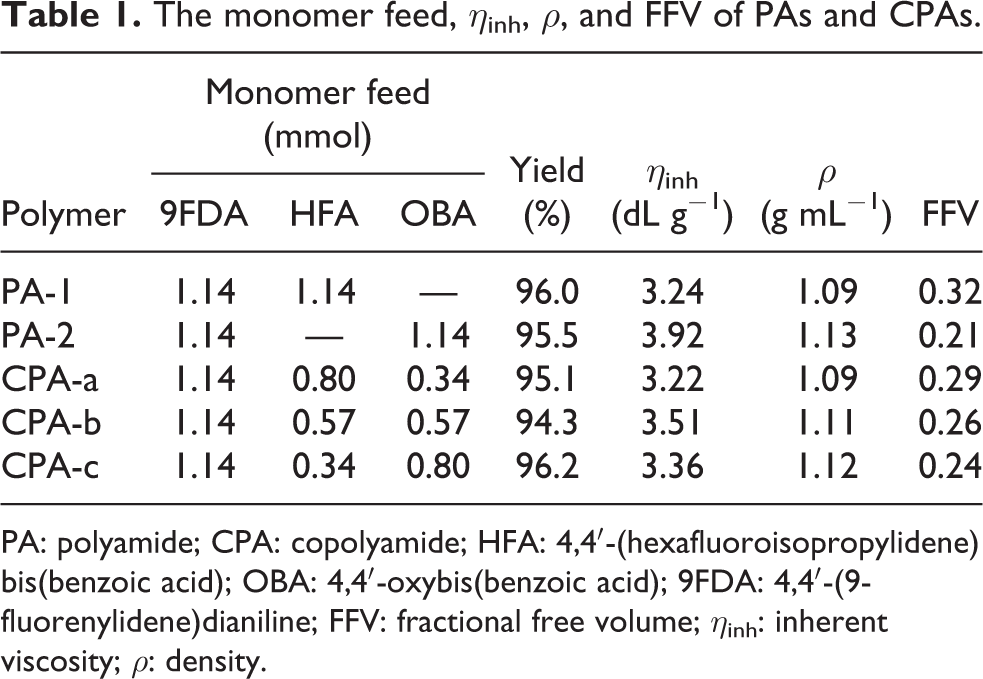
PA: polyamide; CPA: copolyamide; HFA: 4,4′-(hexafluoroisopropylidene)bis(benzoic acid); OBA: 4,4′-oxybis(benzoic acid); 9FDA: 4,4′-(9-fluorenylidene)dianiline; FFV: fractional free volume; ηinh: inherent viscosity; ρ: density.
Synthesis of CPAs
As illustrated in Figure 4, aromatic CPAs containing fluorene group were synthesized through polycondensation reaction of 9FDA and corresponding amounts of HFA and OBA monomers. The molecular feed ratio of monomers and the polymerization results are listed in Table 1. According to the mole ratio of HFA/OBA = 7/3, 5/5, 3/7 in CPAs, these polymers were named as CPA-a, CPA-b, and CPA-c, respectively. The synthesis of CPAs followed the same procedure as in section “Synthesis of PAs” regarding the synthesis of PAs.
Synthesis of CPA-a, CPA-b, and CPA-c. CPA: copolyamide.
Preparation of dense membranes
The homogeneous solutions of aromatic PAs and CPAs were prepared by dissolving the polymers in NMP solutions (8% (w/v)), and then filtering it through a 10-μm syringe filter to remove any undissolved materials and dust particles. Polymer solutions were treated by ultrasound and were then left untouched for 24 h to remove gas bubbles. The membranes were prepared by casting the solutions onto a clean and leveled glass plate using a doctor blade. The polymers on the plate were dried at 80°C for 12 h and were then put in a vacuum oven at 120°C for 24 h to remove the residual solvent. The membranes were moistened and peeled off from glass plate followed by vacuum drying at 60°C for another 6 h. The thickness of the prepared membranes measured was approximately 30 µm. The photographs of PA and CPA membranes are shown in Figure 5.
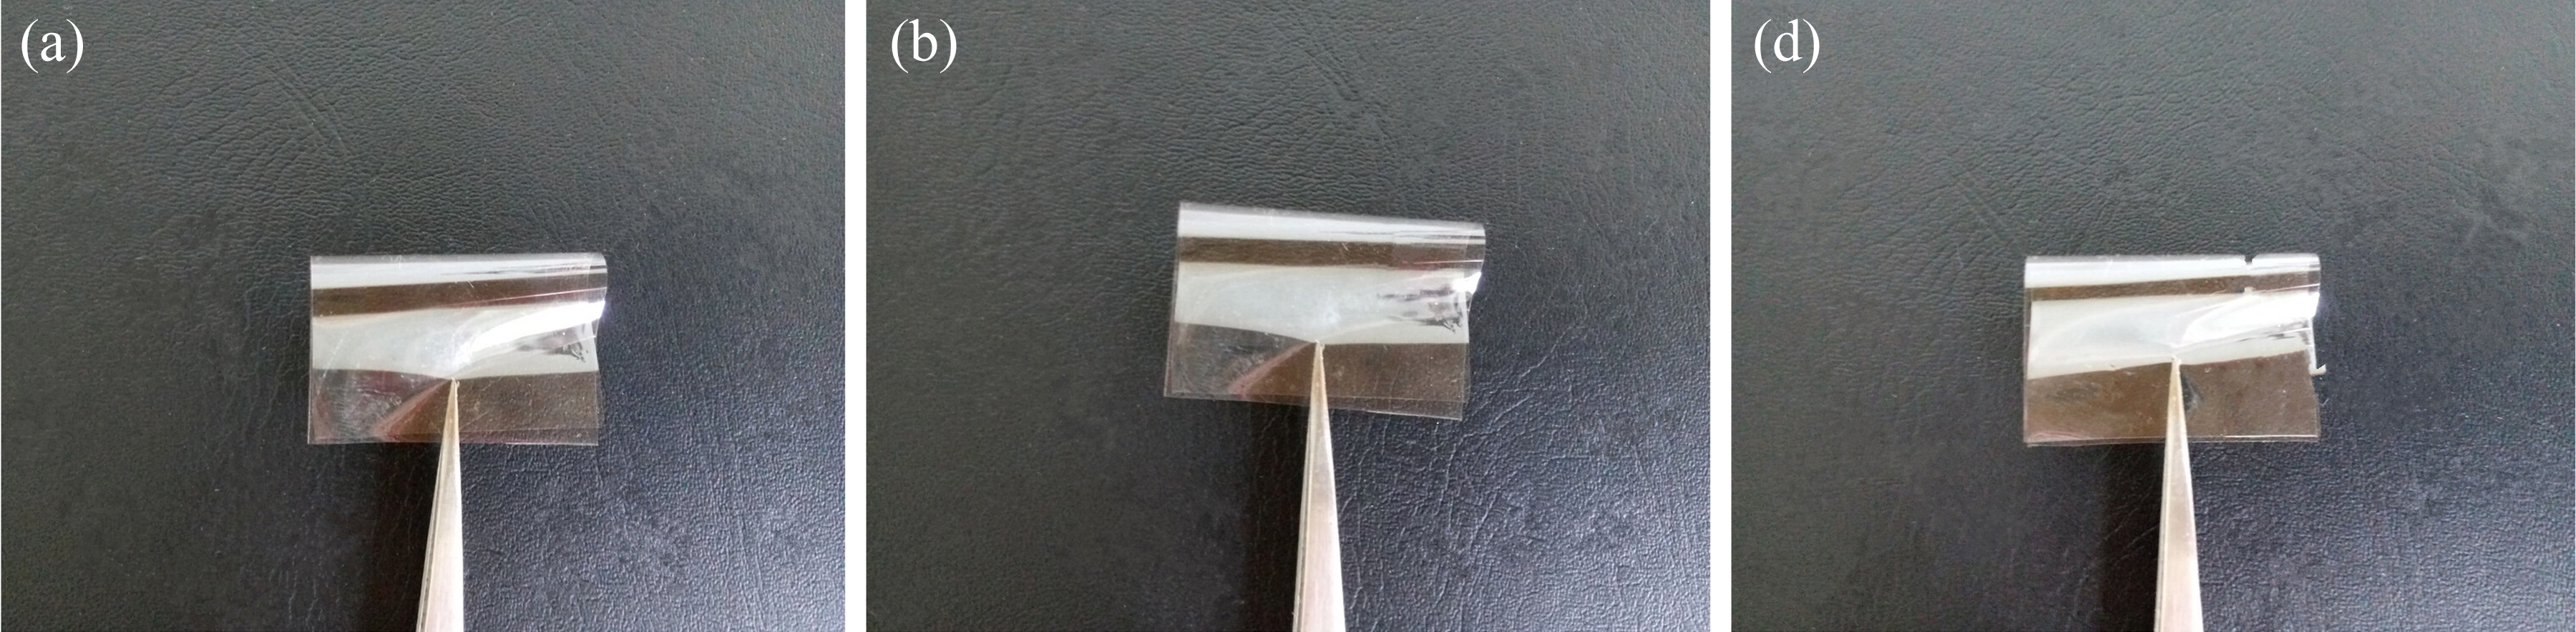
Photographs of the PA-1(a), PA-2(b), and CPA-b(c). PA: polyamide; CPA: copolyamide.
Characterization
Fourier transform infrared (FTIR) measurements were performed in the range of approximately 4000–400 cm−1 using a Bruker TENSOR II FTIR spectrometer (Germany). 1H NMR spectra were recorded on a 400 MHz Bruker NMR spectrometer using CDC13 or DMSO-d6 as the solvent at room temperature. Thermal gravimetric analysis (TGA) measurements were performed using a Netzsch STA 449C (Germany) with a heating rate of 20°C min−1 and temperature ranging from 30°C to 900°C under nitrogen atmosphere. Differential scanning calorimetric (DSC) analyses of the polymers were measured using a Netzsch STA 449C at a heating rate of 20°C min−1 for the determination of the Tg. Tgs were obtained at the midpoint of the change in slope of the baseline on the second DSC heat scan. X-ray diffraction (XRD) of the polymer membranes was performed in the range of approximately 5–60° (2θ) using a Siemens D5000 X-ray diffractometer (Germany). The copper Kα (0.154 nm) source was used and the average d-spacing (dsp) for the amorphous peak maxima was calculated using Bragg’s equation. Ultraviolet–visible (UV-vis) absorption spectra of the polymers in DMF solution were recorded on a Metash UV-8000A spectrophotometer (China) over the wavelength range of approximately 250–600 nm. The solubility of each polymer was determined by dissolving 10 mg of polymer in 1 mL of solvent, followed by continuous stirring for 24 h at room temperature. Inherent viscosities (ηinh) were determined using an Ubbelohde viscometer (JC522-1835, China) at 30 ± 0.1°C with NMP as solvent at a concentration of 0.5 g dL−1. The densities (ρ) of the PA and CPA membranes were estimated in a density gradient column (Techne Corp, Germany) based on aqueous calcium nitrate solutions between 1.0 and 1.3 (g cm−3) at 25°C. Based on the density data, the FFV was determined using the following equation 28,33 :
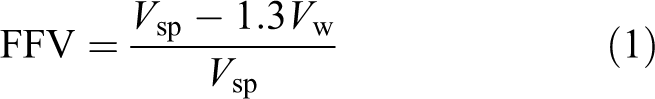
Where Vsp is the specific volume (Vsp = 1/ρ) and Vw is the van der Waals volume determined using Bondi’s group contribution method. 34 , 35 In the case of copolymers, Vw was estimated by Vw = x1Vw1 + x2Vw2, where x1 and x2 are the molar fractions of the PA-1 segments and PA-2 segments, respectively; Vw1 and Vw2 are the respective van der Waals volumes for the two segments.
Gas permeability measurements
Gas permeability measurements were performed using a gas permeability tester (VAC-V2, Labthink Instruments Company, China). The permeability was determined in single-gas H2, CO2, O2, CH4, and N2 at a feed pressure of 1 atm and different temperatures (25 ∼ 55°C). The permeability (P) of each gas was calculated by the following equation 36 :
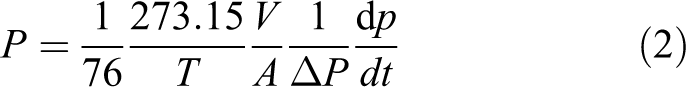
where P is the gas permeability (Barrer) (1 Barrer = 1 × 10⁻¹⁰cm3 (STP) cm (cm2 s cmHg) −1), ΔP is the transmembrane pressure difference (Pa), A is the effective membrane area (cm2), T is the operating temperature (K), l is the membrane thickness (cm), V is the downstream volume (cm3), and dp/dt is the rate of the pressure rise under the steady state.
The selectivity (αA/B) for a given pair of gases A and B was calculated from the ratio of the individual single-gas permeabilities.
Results and discussion
Synthesis and characterization of PAs and CPAs
The PAs and CPAs were synthesized through polycondensation reaction as illustrated in Figures 2 and 3. The inherent viscosities (ηinh) of the PAs and CPAs were in the range of 3.22–3.92 dL g−1 (Table 1), indicating the formation of high molar masses. The data on density and FFV of the PA and CPA membranes are calculated and listed in Table 1. The density values of the PAs and CPAs were in the range of 1.09–1.19 g mL−1, whereas the FFV values of the PAs and CPAs varied from 0.21 to 0.32. PA-1 exhibited the highest FFV value in this series as it has a higher content of bulky (–CF3)2 group as compared to CPAs.
The chemical structure of PAs and CPAs was confirmed by a Fourier transform infrared (FTIR) spectroscopy in Figure 6, wherein the absorptions at 3053 cm−1 and 1597 cm−1 are attributed to the aromatic C–H and aromatic C=C stretching vibrations 22,37 , respectively, and it suggests the presence of benzene ring component in the prepared PAs and CPAs. The absorption at 1237 cm−1 is due to asymmetric C–O–C stretching vibration of PA-2 and CPAs. 22 The absorptions at 1207 cm−1 and 1139 cm−1 are attributable to C–F stretching vibration of PA-1 and CPAs. 38,39 In addition, the peaks at 3297 cm−1 and 1671 cm−1 of PAs and CPAs can be respectively ascribed to N–H and C=O stretching vibrations of amide groups 36 , which confirms the successful synthesis of PAs and CPAs.
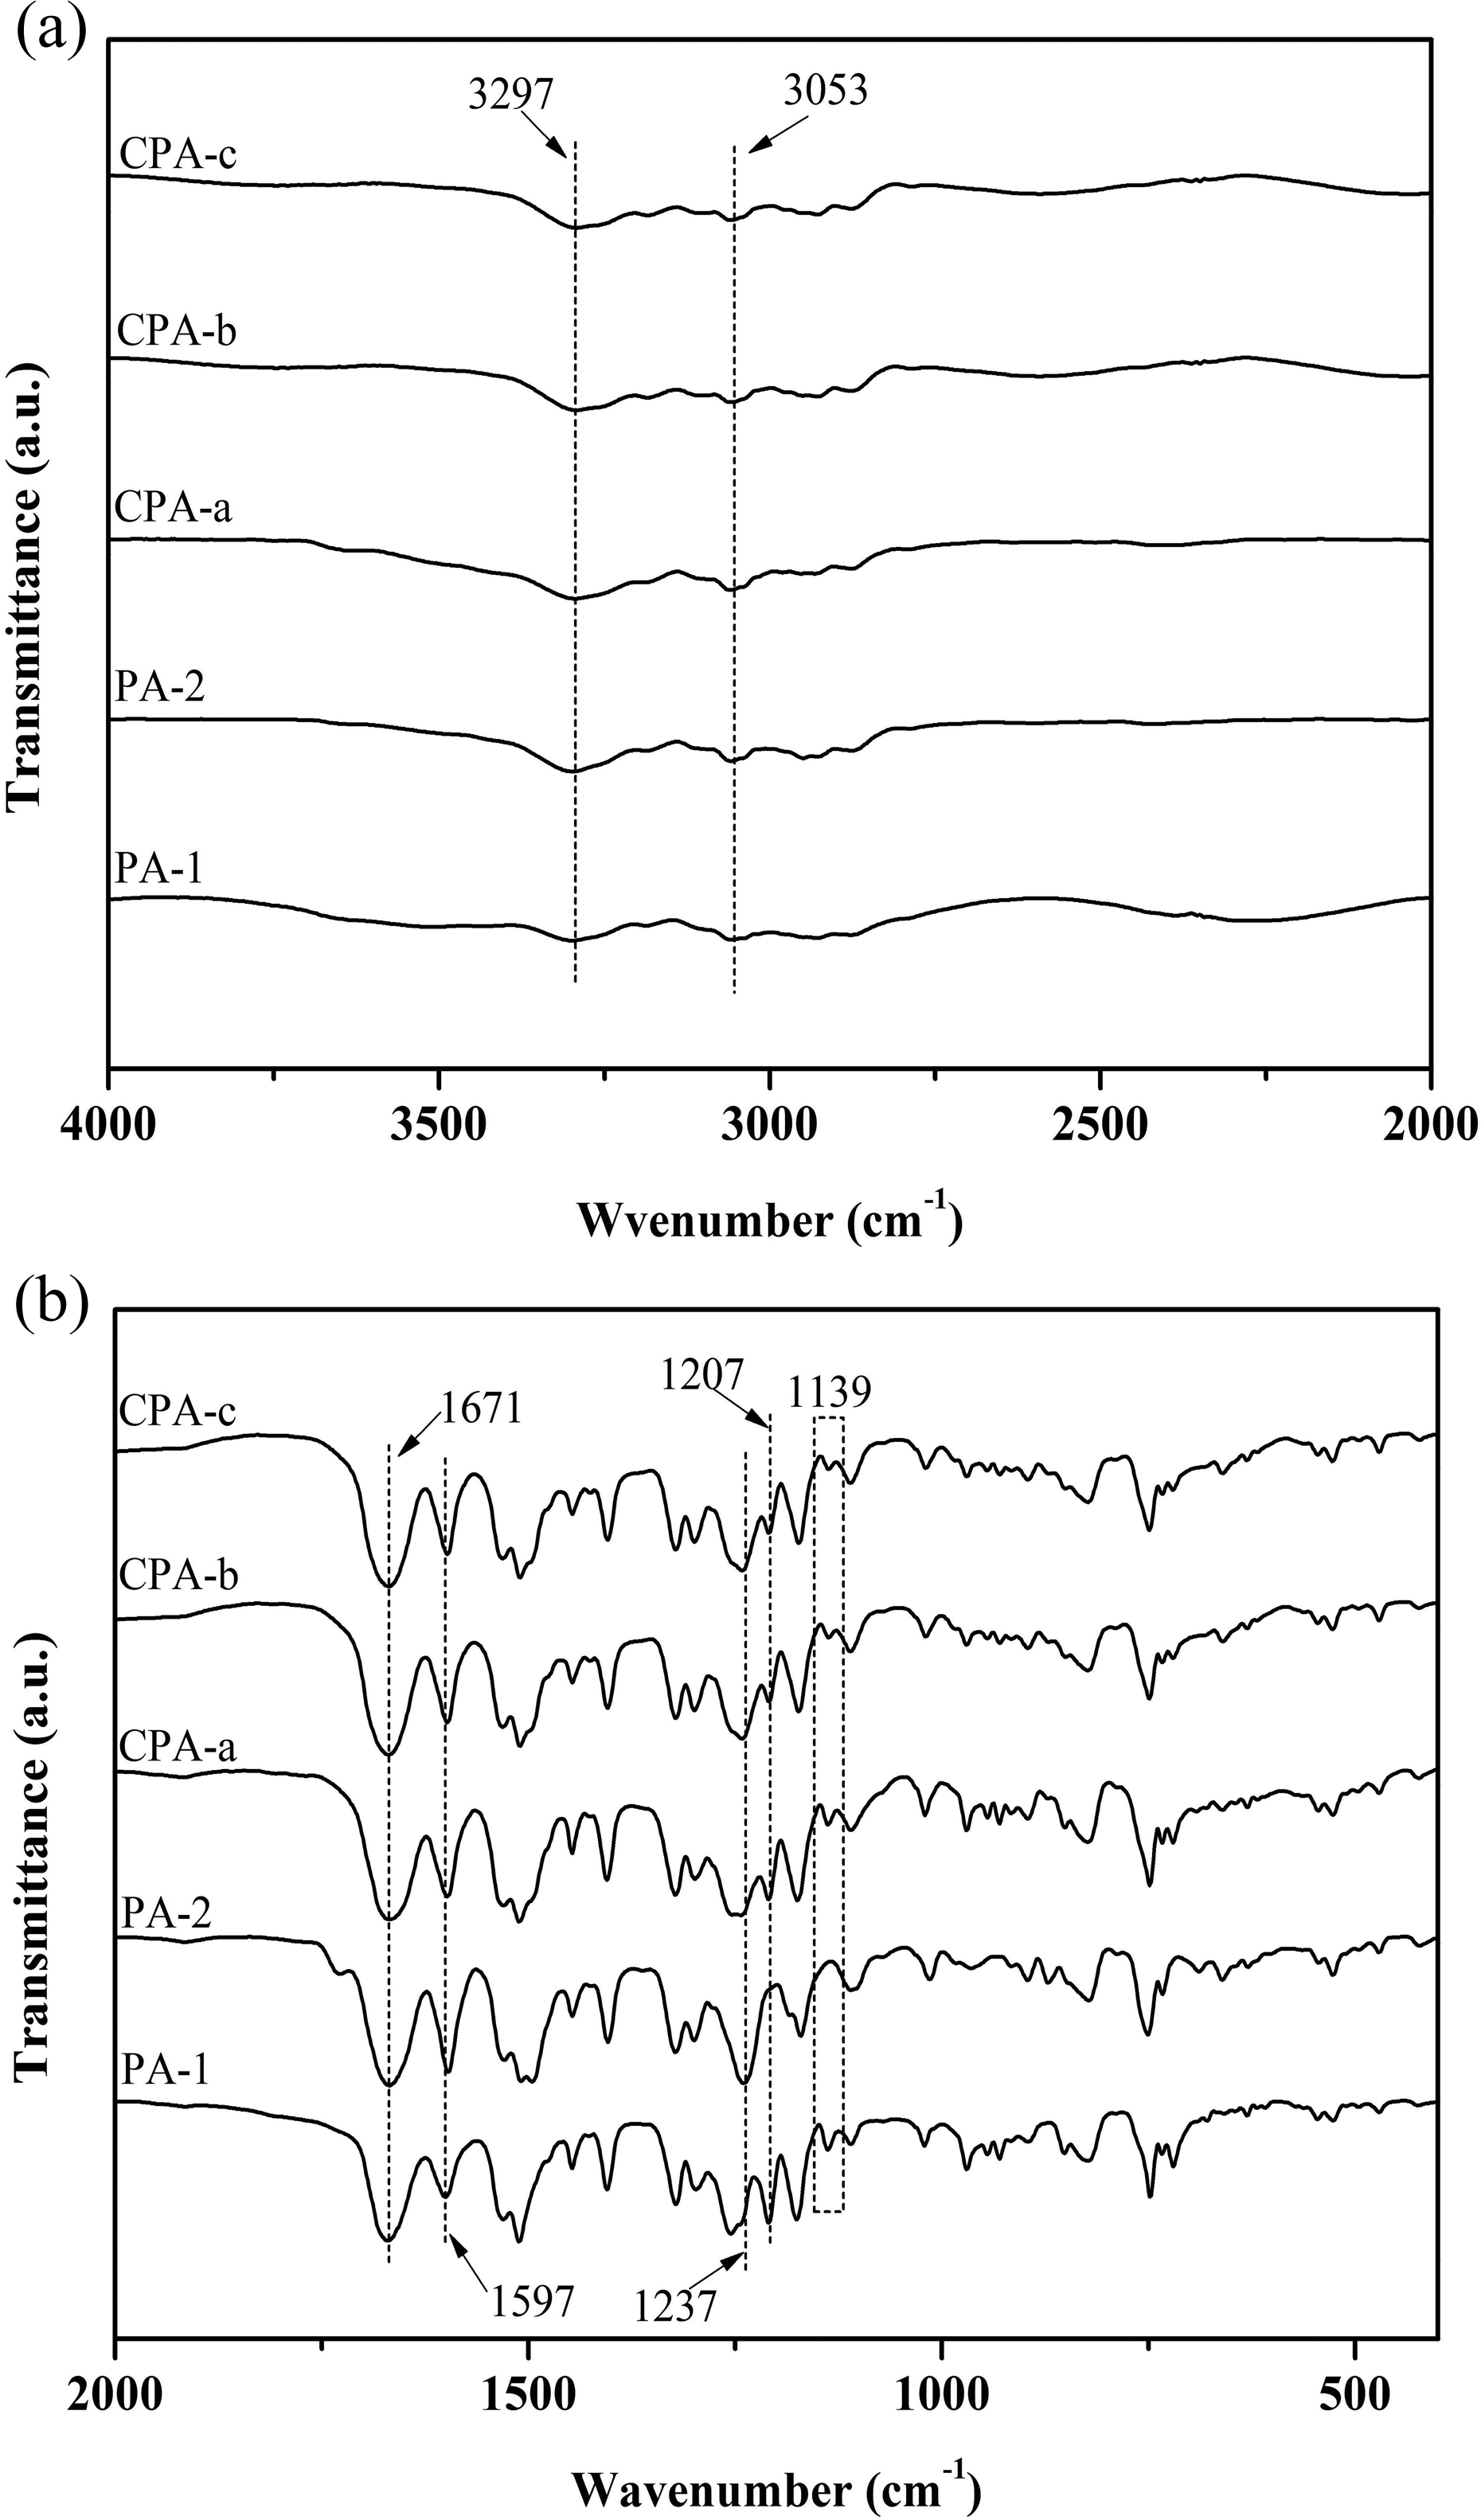
FTIR spectra in different ranges for PAs and CPAs: (a) 4000–2000 cm−1 range and (b) 2000–400 cm−1 range. FTIR: Fourier transform infrared; PA: polyamide; CPA: copolyamide.
To further confirm the formation of the prepared PAs and CPAs, 1H NMR spectrum of PA-1, PA-2, and CPA-b (9FDA: HFA: OBA feed ratio = 2:1:1 in moles) is shown in Figure 7. In the NMR spectrum of PA-1, which is illustrated in Figure 7(a), the group of peaks at 7.0–8.1 ppm corresponds to aromatic protons. 28,40,41 The peak of the amide group proton (C(=O)–NH*–) was seen at 10.42 ppm 19 , which suggests the successful preparation of PA-1. As observed in the NMR spectrum of PA-2 shown in Figure 7(b), the peaks at 7.0–8.1 ppm are due to the aromatic hydrogen of styrene, and the peak (1) at 10.23 ppm represents the amide group proton (C(=O)–NH*–), which indicates the successful synthesis of PA-2 using 9FDA and OBA monomers in 1:1 mole ratio. It can be observed in Figure 7(c) that the proton peaks of benzene ring are located at 7.0–8.1 ppm and that the proton peaks of two amide groups are at 10.42 ppm and 10.23 ppm, thus confirming the successful preparation of CPA. The NMR results are in line with the previously discussed FTIR results.
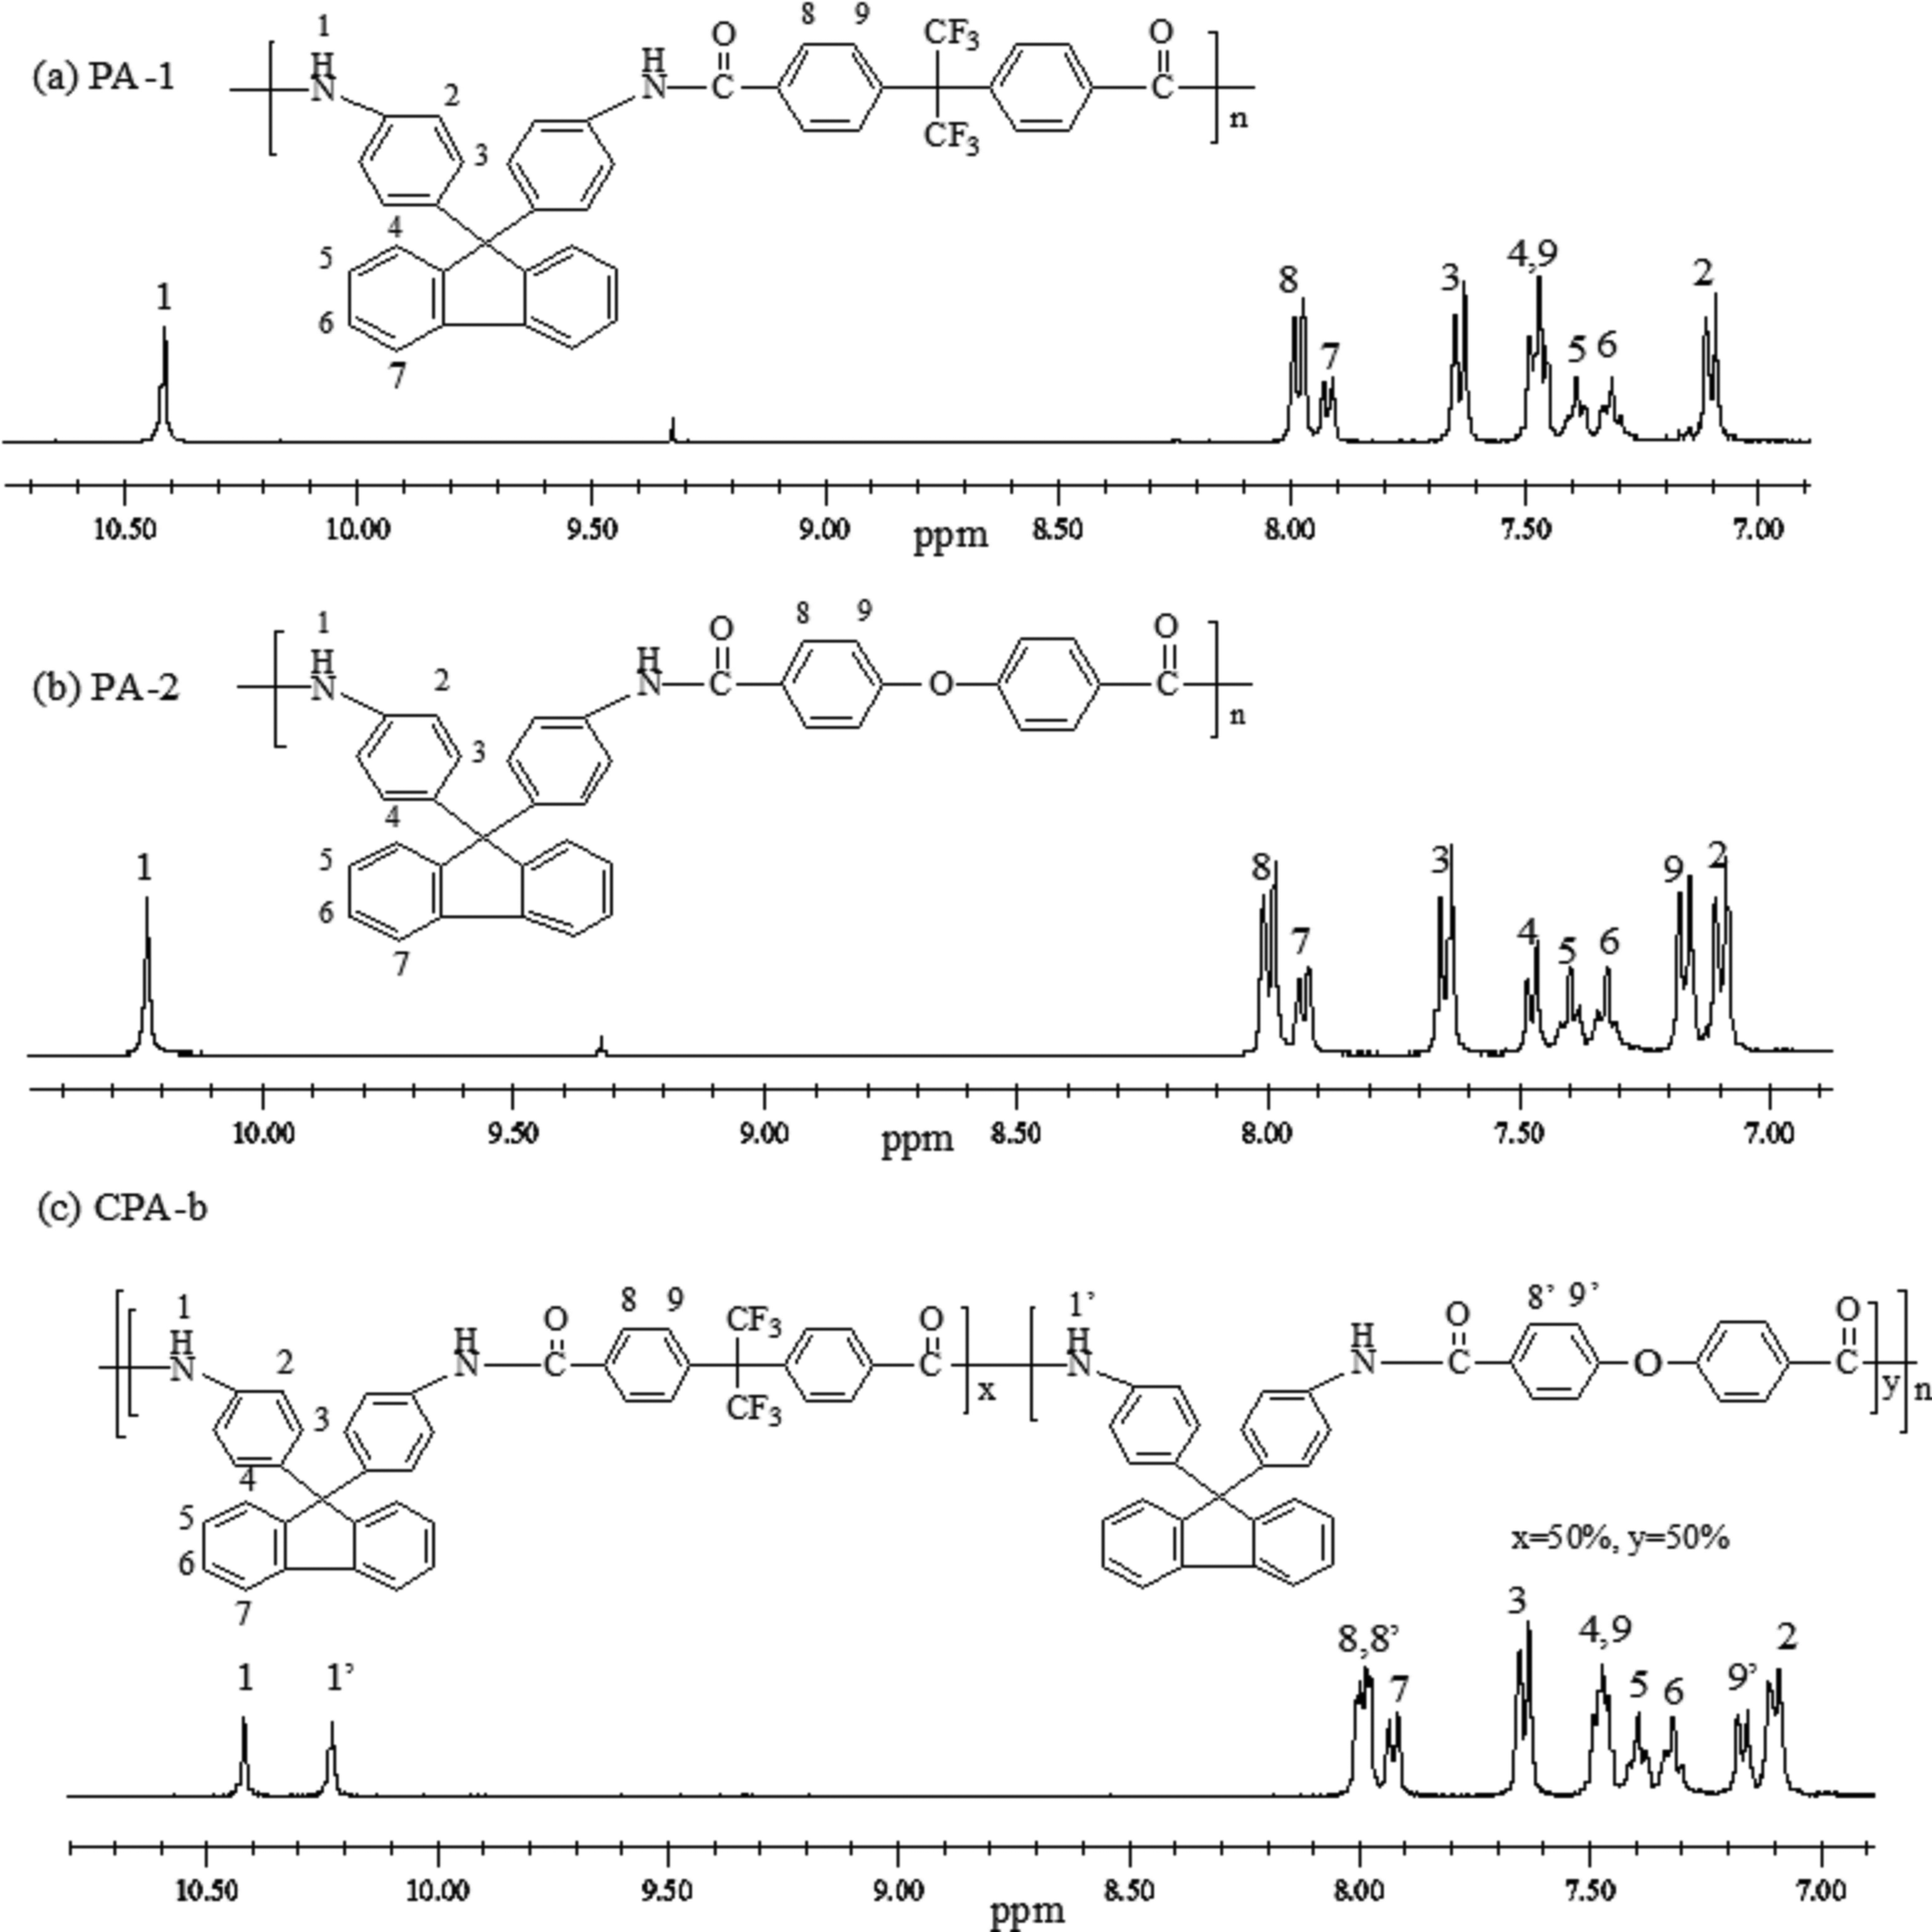
1H NMR spectra of the PA-1, PA-2, and CPA-b in DMSO-d6. 1H NMR: proton nuclear magnetic resonance; PA: polyamide; CPA: copolyamide; DMSO: dimethyl sulfoxide.
Solubility of PAs and CPAs
The solubility of the polymers was tested in a variety of solvents listed in Table 2. The PAs and CPAs have excellent solubility in strongly polar solvents, such as NMP, DMSO, DMF, and DMAc. However, the polymers were not soluble in nonpolar solvents such as chloroform and toluene. In addition to the common soluble characteristics of PAs and CPAs, PA-1 can be completely dissolved in THF, whereas PA-2 was not soluble in THF. CPAs were slightly soluble in THF, and their solubility in THF gradually decreased with the decrease in the HFA content. The dissolving of PAs and CPAs in THF is attributed to the higher volume of HFA than that of OBA. The introduction of bulky groups into polymers increased the distance between molecular chains, thus decreasing the regularity of polymer chains and improving solubility.
Solubility of the PAs and CPAs.a
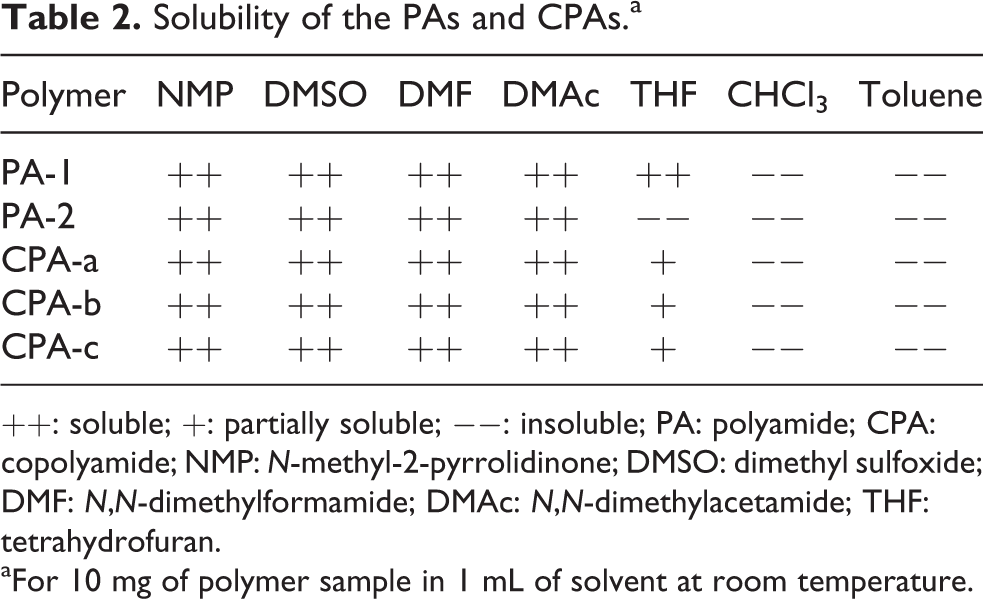
++: soluble; +: partially soluble; −−: insoluble; PA: polyamide; CPA: copolyamide; NMP: N-methyl-2-pyrrolidinone; DMSO: dimethyl sulfoxide; DMF: N,N-dimethylformamide; DMAc: N,N-dimethylacetamide; THF: tetrahydrofuran.
aFor 10 mg of polymer sample in 1 mL of solvent at room temperature.
TGA and DSC analysis
The thermal stability of the PAs and CPAs was investigated through TGA and DSC analysis (Table 3). The decomposition temperature (Td), with a 15% loss, for PAs and CPAs was in the range of 378–496°C, which indicates high thermal stability. The TGA curves of the PAs and CPAs are shown in Figure 8. The polymers exhibited a three-step thermal degradation. The initial weight loss, which is approximately 140–250°C, was mainly due to the evaporation of moisture. The second weight loss, which is approximately 250–470°C, was attributed to the decomposition of the amide bond. The final weight loss, which was approximately 470–900°C, was caused by the generalized polymer backbone degradation. 28,42 It can be observed from Figure 8 that PA-1 possesses the highest thermal stability in this series and that the thermal stability of CPAs gradually decreases with the decrease in the content of (–CF3)2 groups in CPAs. The results show that bulky (–CF3)2 groups can improve the thermal stability of the polymers. The char yields of these polymers, which could be attributable to their high aromatic content, were more than 56.9% at 900°C under nitrogen atmosphere.
Thermal properties of the PAs and CPAs.
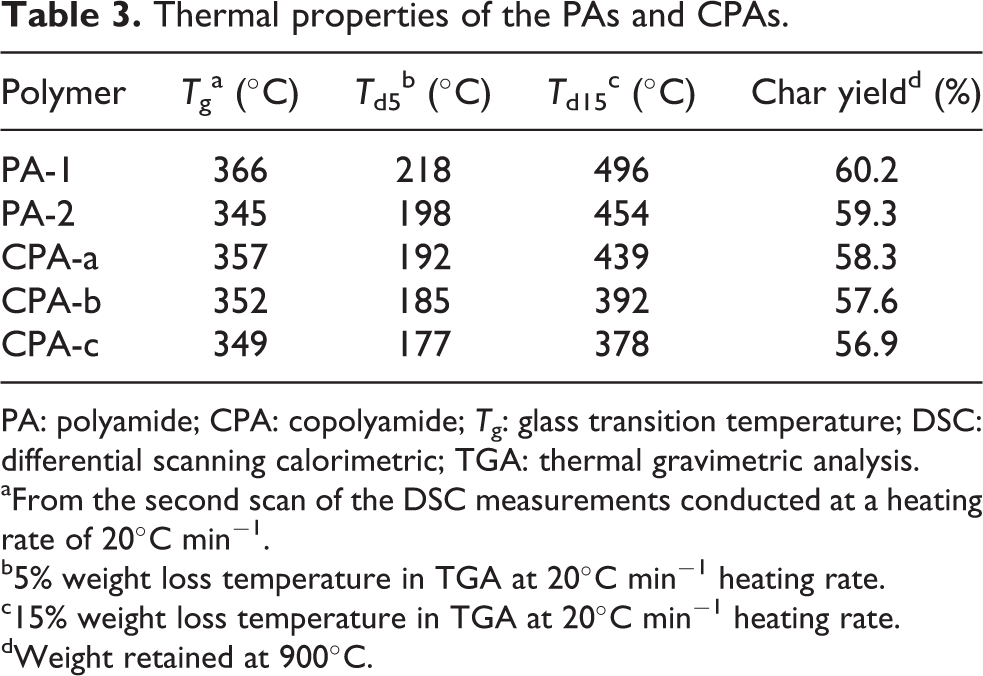
PA: polyamide; CPA: copolyamide; Tg: glass transition temperature; DSC: differential scanning calorimetric; TGA: thermal gravimetric analysis.
aFrom the second scan of the DSC measurements conducted at a heating rate of 20°C min−1.
b5% weight loss temperature in TGA at 20°C min−1 heating rate.
c15% weight loss temperature in TGA at 20°C min−1 heating rate.
dWeight retained at 900°C.
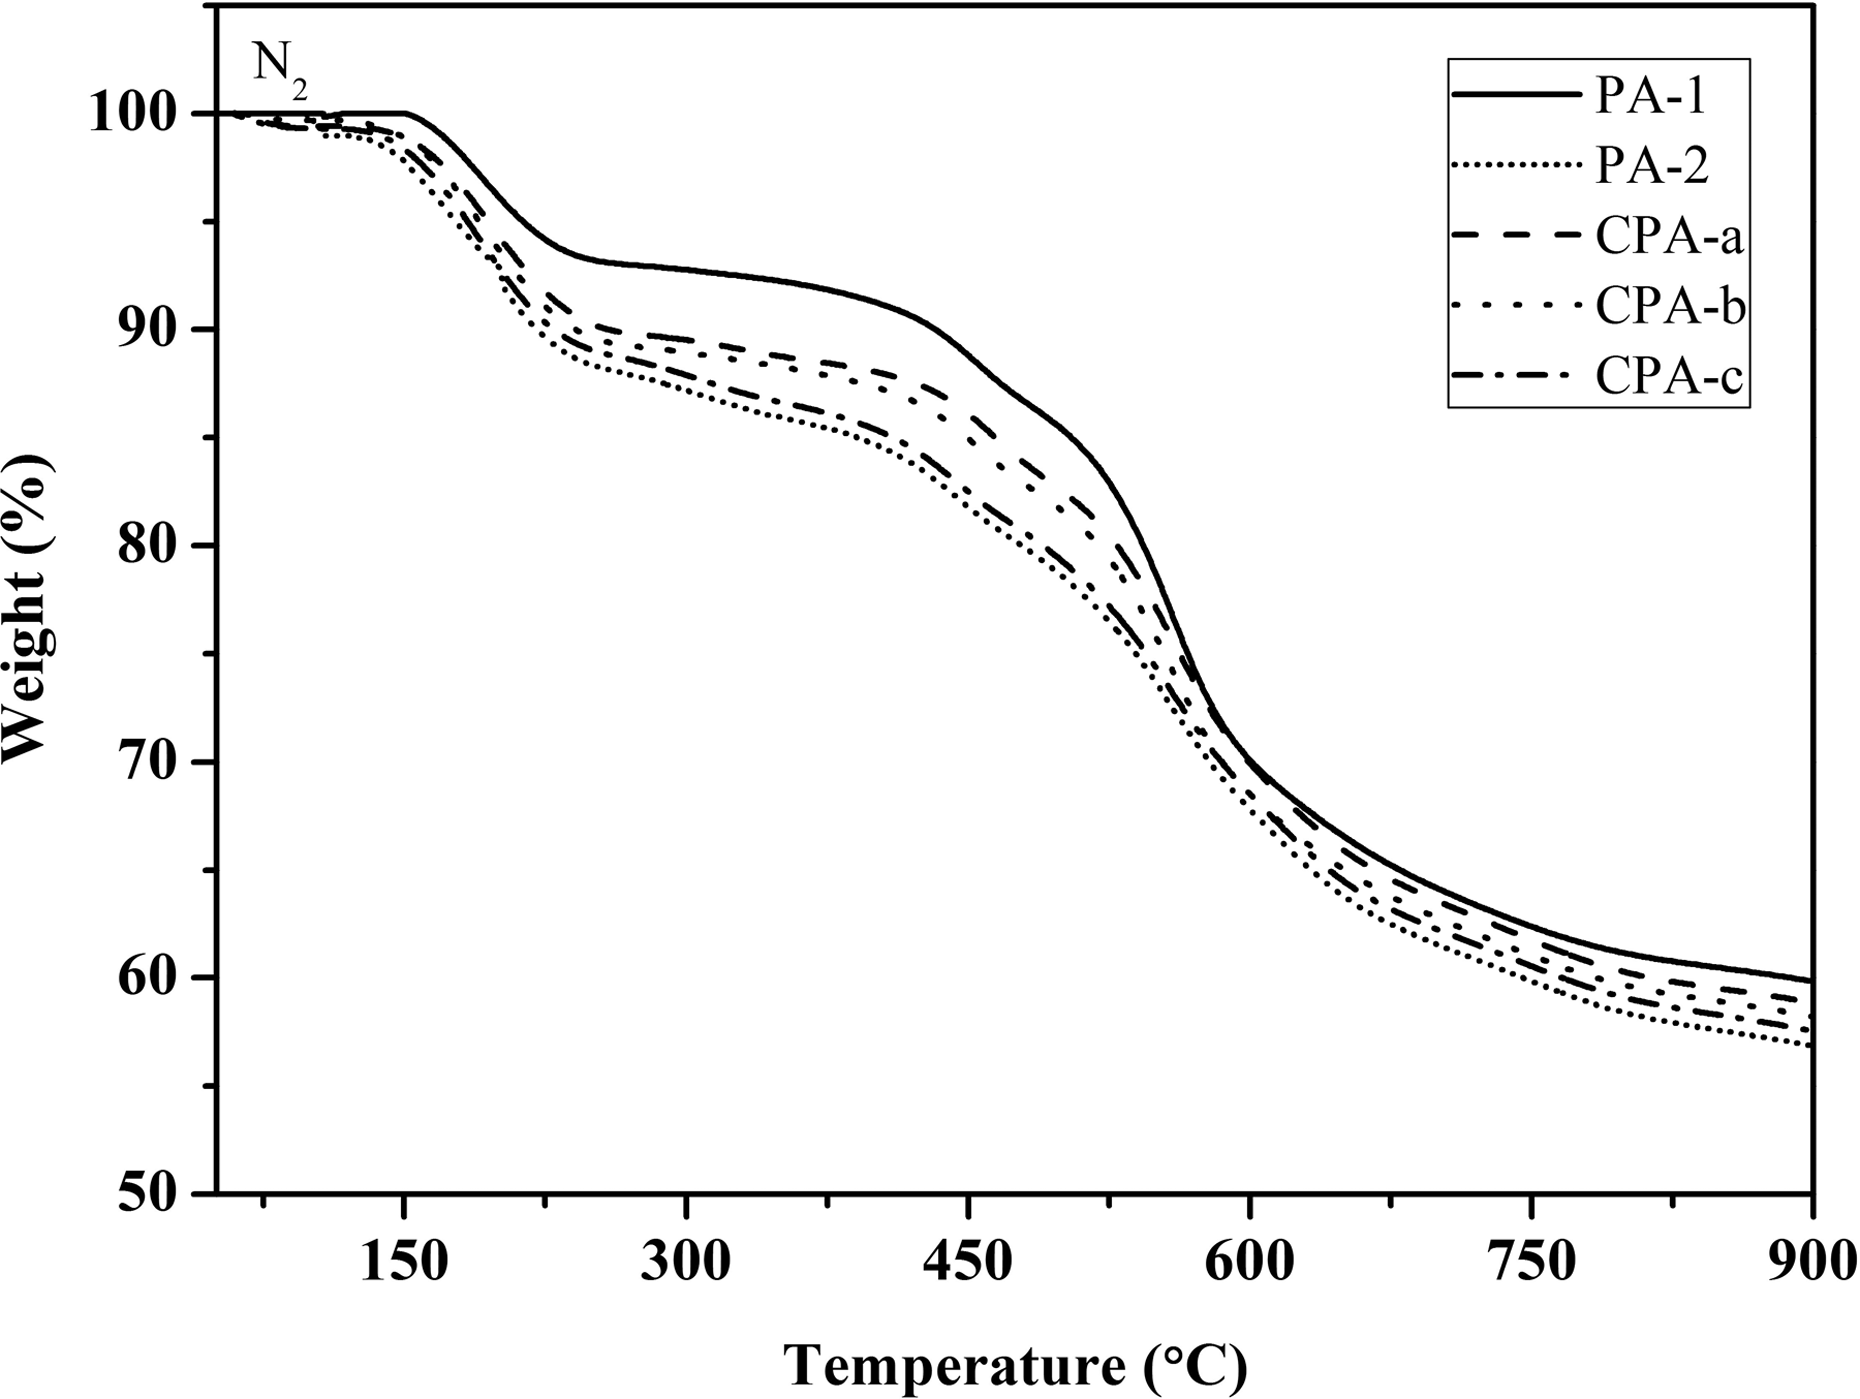
TGA curves of the PAs and CPAs under nitrogen atmosphere. PA: polyamide; CPA: copolyamide; TGA: thermal gravimetric analysis.
The Tg of PAs and CPAs was in the range of 345–366°C and it depends on the stiffness and polarity of the polymer repeat unit structures (Figure 9 and Table 3). The polymers exhibited high Tg values, which suggests the rigid nature of the polymer. The bulky fluorene pendant group of PAs and CPAs enhanced Tg values by limiting the polymer chain-chain mobility. PA-1 exhibited the highest Tg value due to the presence of the bulky (–CF3)2 group, which thereby inhibited the chain-chain mobility, and increased the rotational barrier. PA-2 showed the lowest Tg value because of the presence of the flexible ether group. This series of polymers evaporated clear melting endotherms up to their decomposition temperatures as seen in the DSC thermograms, which indicated that PAs and CPAs are ascribed as amorphous polymers.
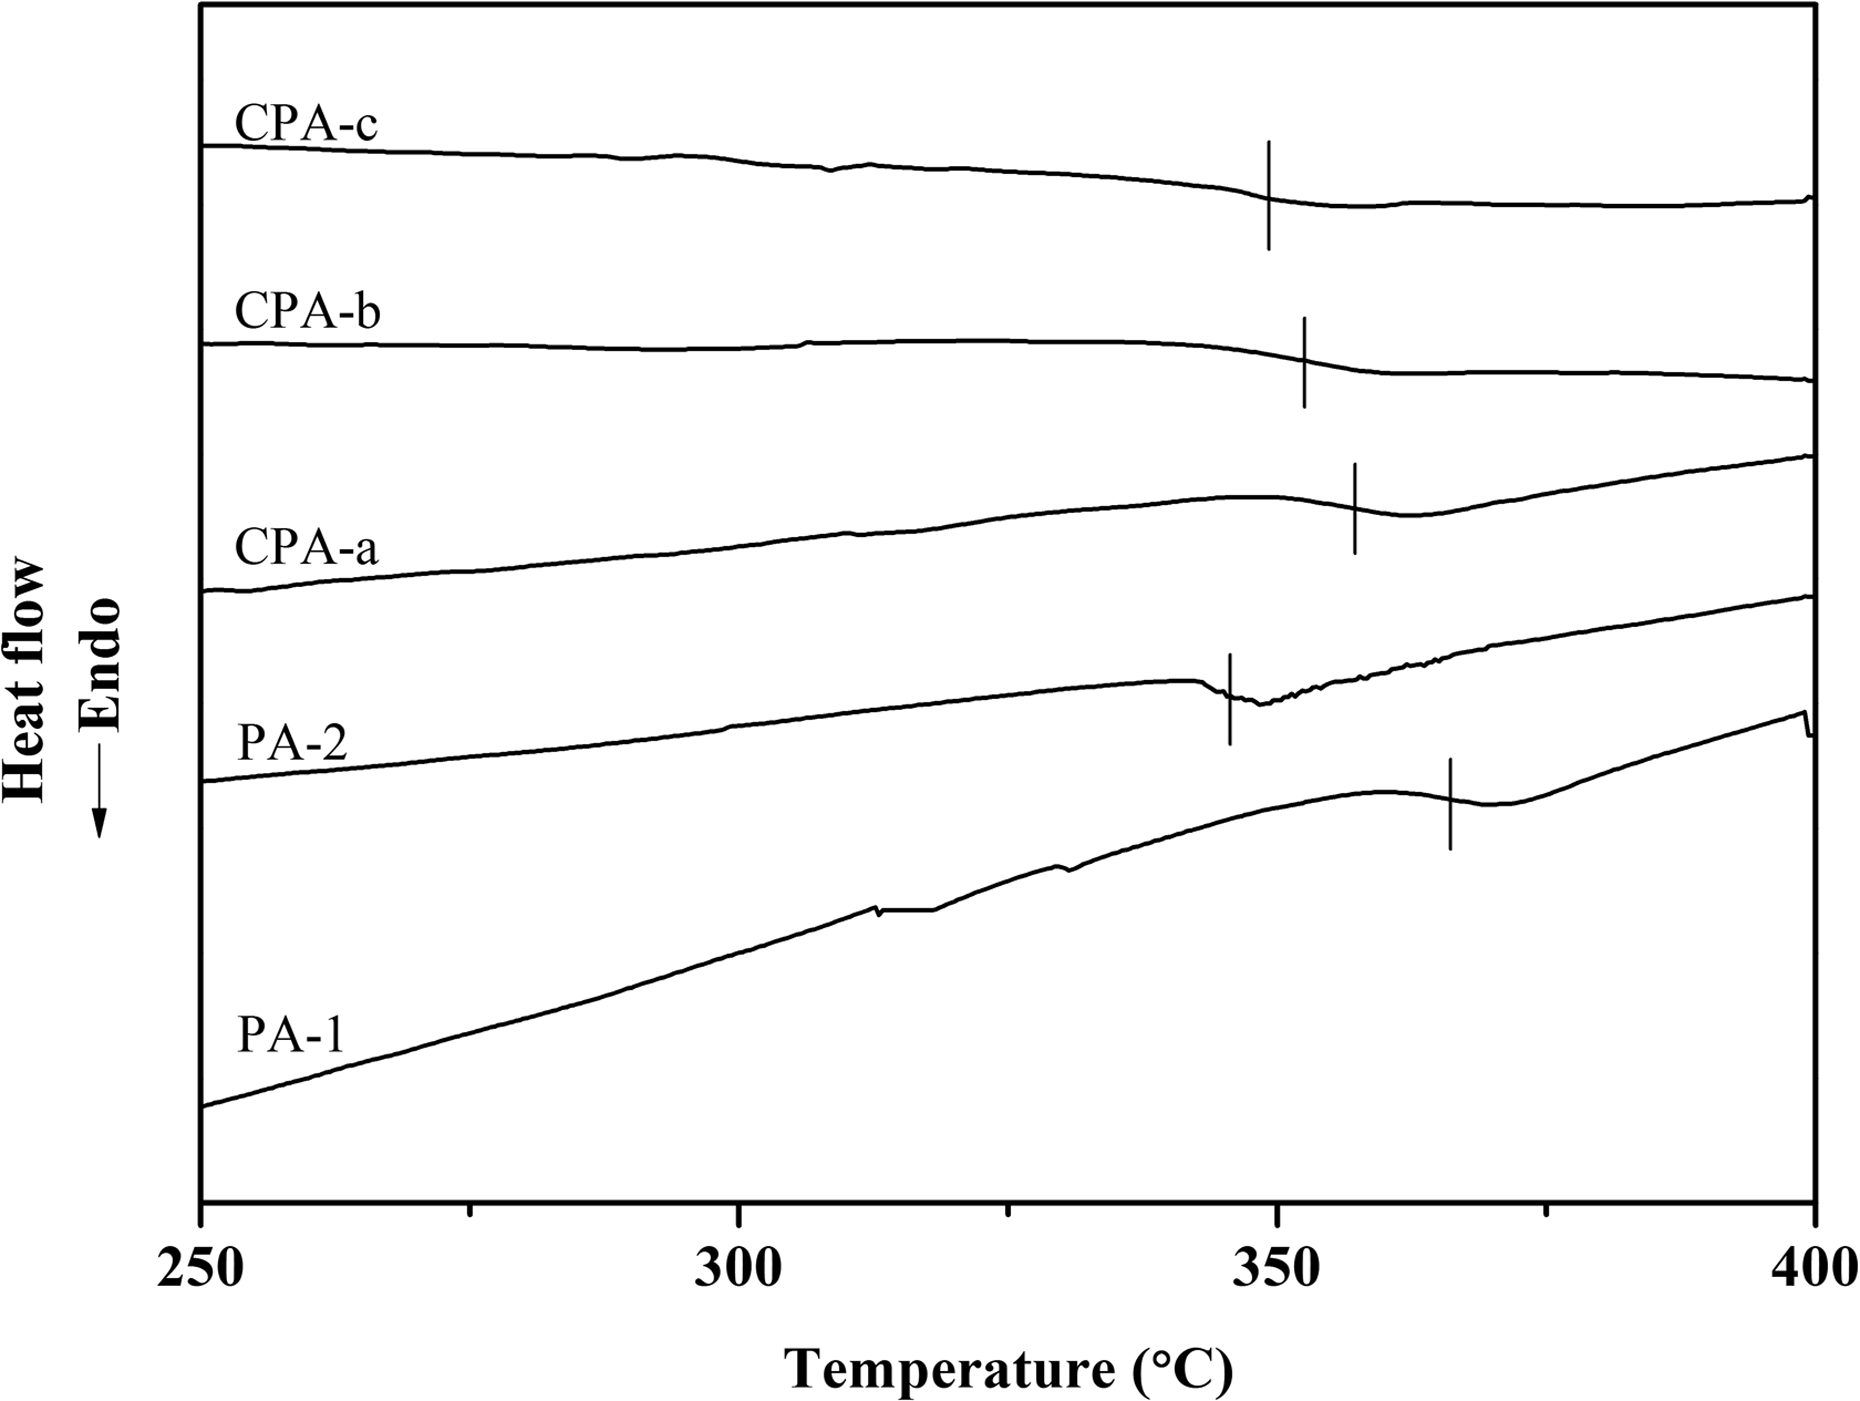
DSC curves of the PAs and CPAs. PA: polyamide; CPA: copolyamide; DSC: differential scanning calorimetric.
UV-vis absorption analysis
UV-vis absorption spectrum is a useful method in analyzing molecular interactions. 43 UV-vis absorption bands of PAs and CPAs in DMF solvent at room temperature were recorded and the results are shown in Figure 10. As illustrated in Figure 10, PAs and CPAs show a similar absorption ranging from 270 to 355 nm, which indicates that charge-transfer complexes (CTC) may occur in the form of intramolecular and intermolecular CTC. 43 It is also found from Figure 10 that the maximum absorption bands (λmax) of CPAs gradually tend to redshift toward higher wavelength, from 279.9 to 283.2 nm, with the decrease in the HFA content of CPAs; however, the λmax values of CPAs are between the λmax values of PA-1 and PA-2. The intramolecular CTC occurred in the short absorption band, whereas the intermolecular CTC occurred in the long absorption band. 43,44 The order of λmax values of PAs and CPAs is PA-2 > CPA-c > CPA-b > CPA-a > PA-1, thus the order of intermolecular interactions strength of PAs and CPAs is PA-2 > CPA-c > CPA-b > CPA-a > PA-1. The strong intermolecular interactions led to the reduction of the distance between molecular chains, which decreased FFV of polymers, and ultimately decreased gas permeability. The order of λmax values is contrary to that of FFV values.
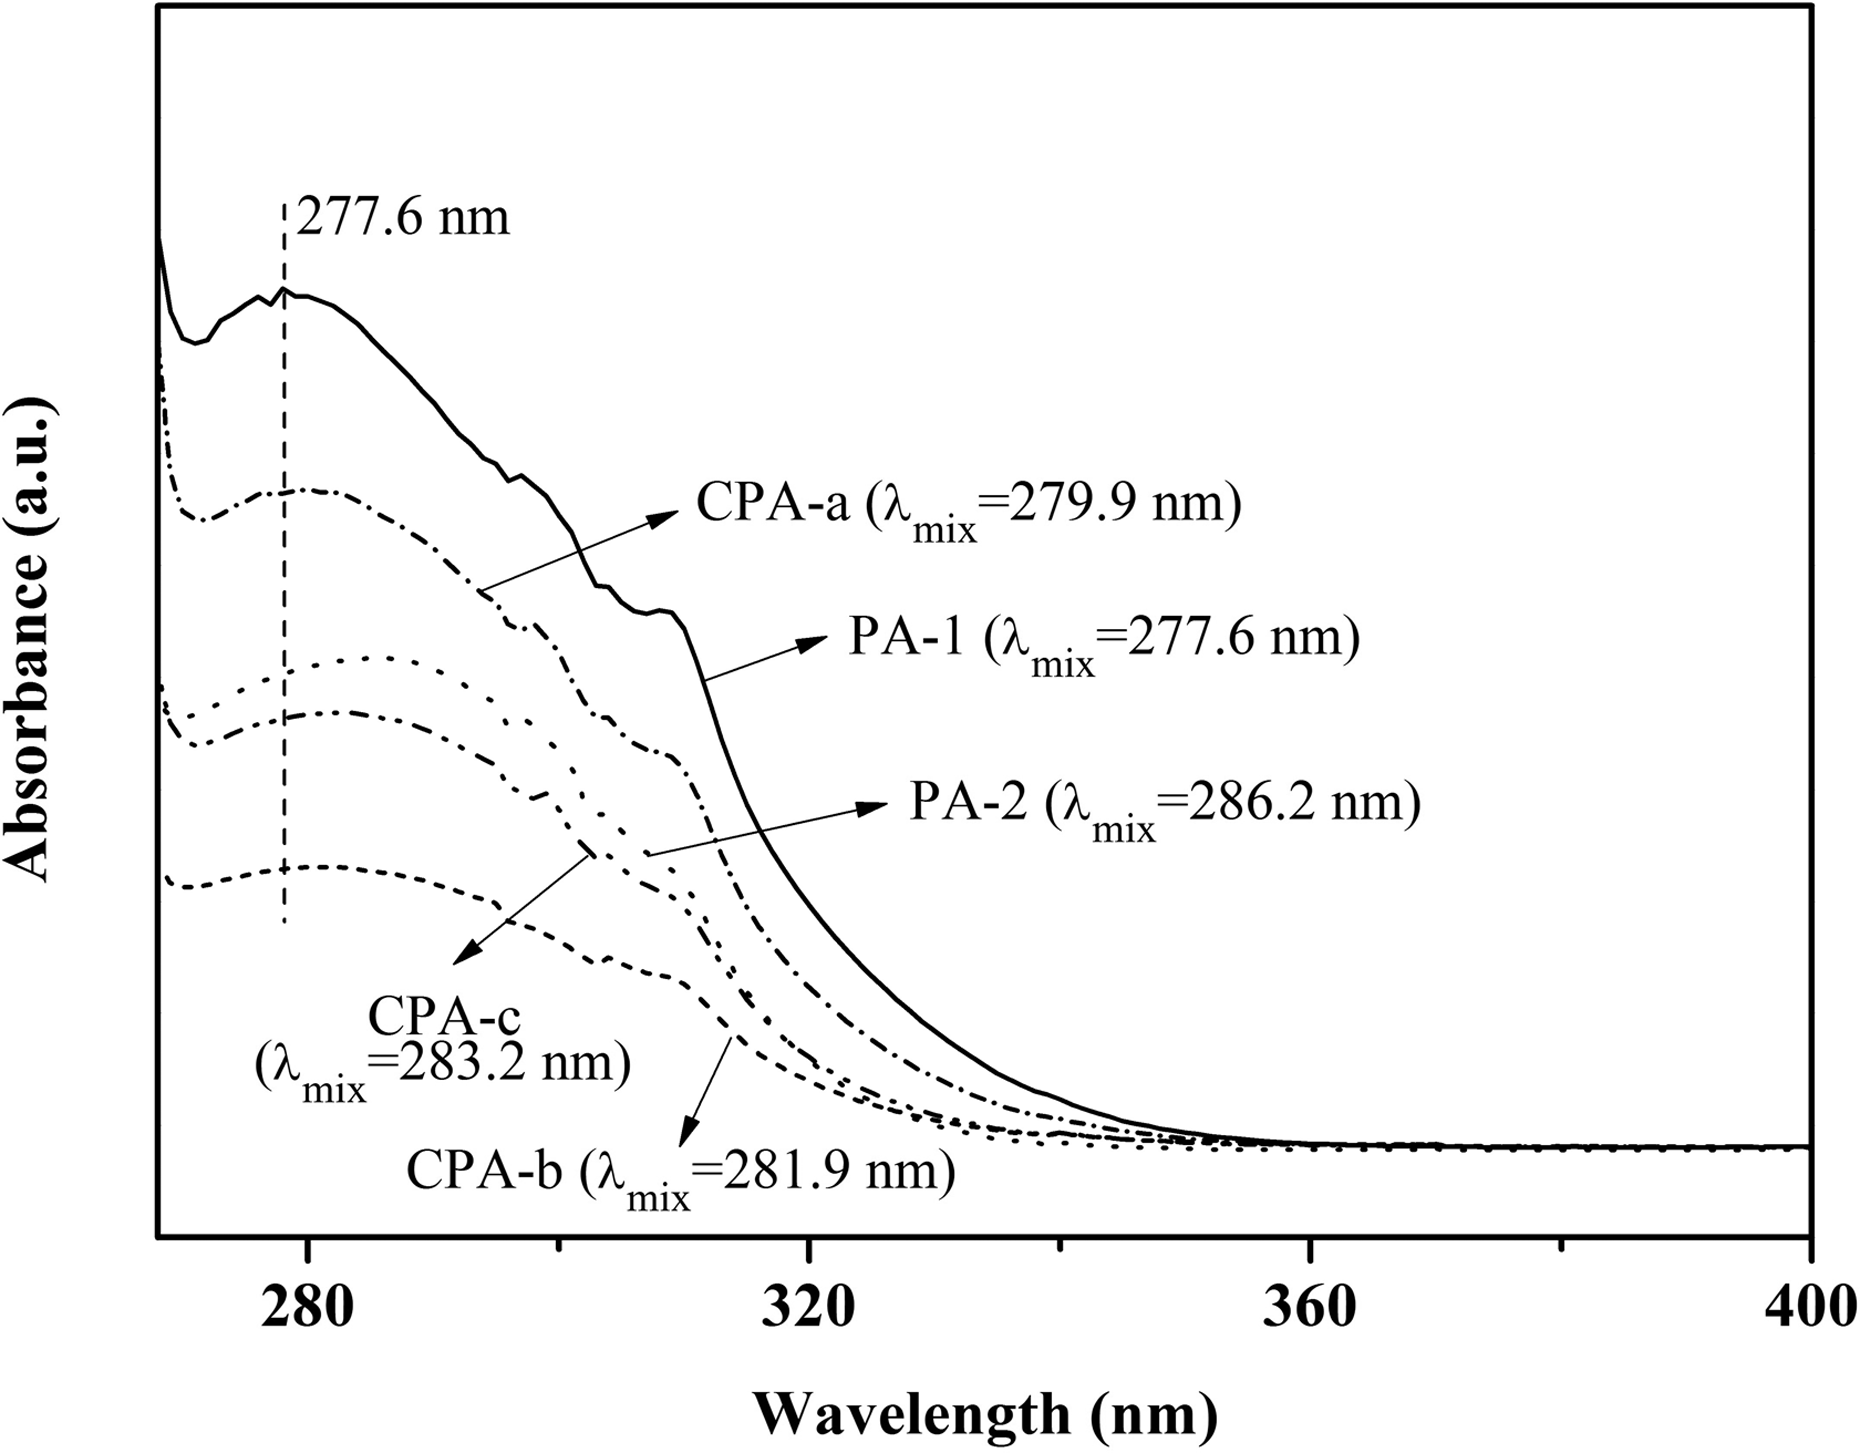
UV-vis absorption bands of the PAs and CPAs. PA: polyamide; CPA: copolyamide; UV-vis: Ultraviolet–visible.
XRD analysis
XRD measurements were carried out to investigate the chain packing in polymeric membranes. The dsp was calculated using Bragg’s equation (nλ = 2dsinθ) and was regarded as the average intersegmental distance between polymer chains. 45,46 The XRD patterns are shown in Figure 11. As illustrated in Figure 11, PAs and CPAs typically behave like amorphous polymers, and these results were also confirmed by DSC analysis. PA-1 and PA-2 showed a peak in the amorphous halo that corresponds to 6.14 Å (2θ = 14.4°) and 4.37 Å (2θ = 20.3°), respectively. When compared with the dsp value of PA-2, PA-1 presents with larger dsp value, which can be attributed to the presence of (–CF3)2 group, thereby restricting the mobility of the polymer chains and increasing the interchain distance. It can also be observed from Figure 11 that CPAs present two peaks in the amorphous halo, which indicate that CPAs have two different order regions in polymeric membranes. The halo at lower angles around 2θ = 15° was due to loosely packed regions of polymer chains and the halo at higher angles around 2θ = 20° was due to the chain-chain efficient packed regions. The order of the dsp values of these polymers is the same as that of FFV values: PA-1 > CPA-a > CPA-b > CPA-c > PA-2. XRD results were consistent with the previously discussed UV-vis absorption results.
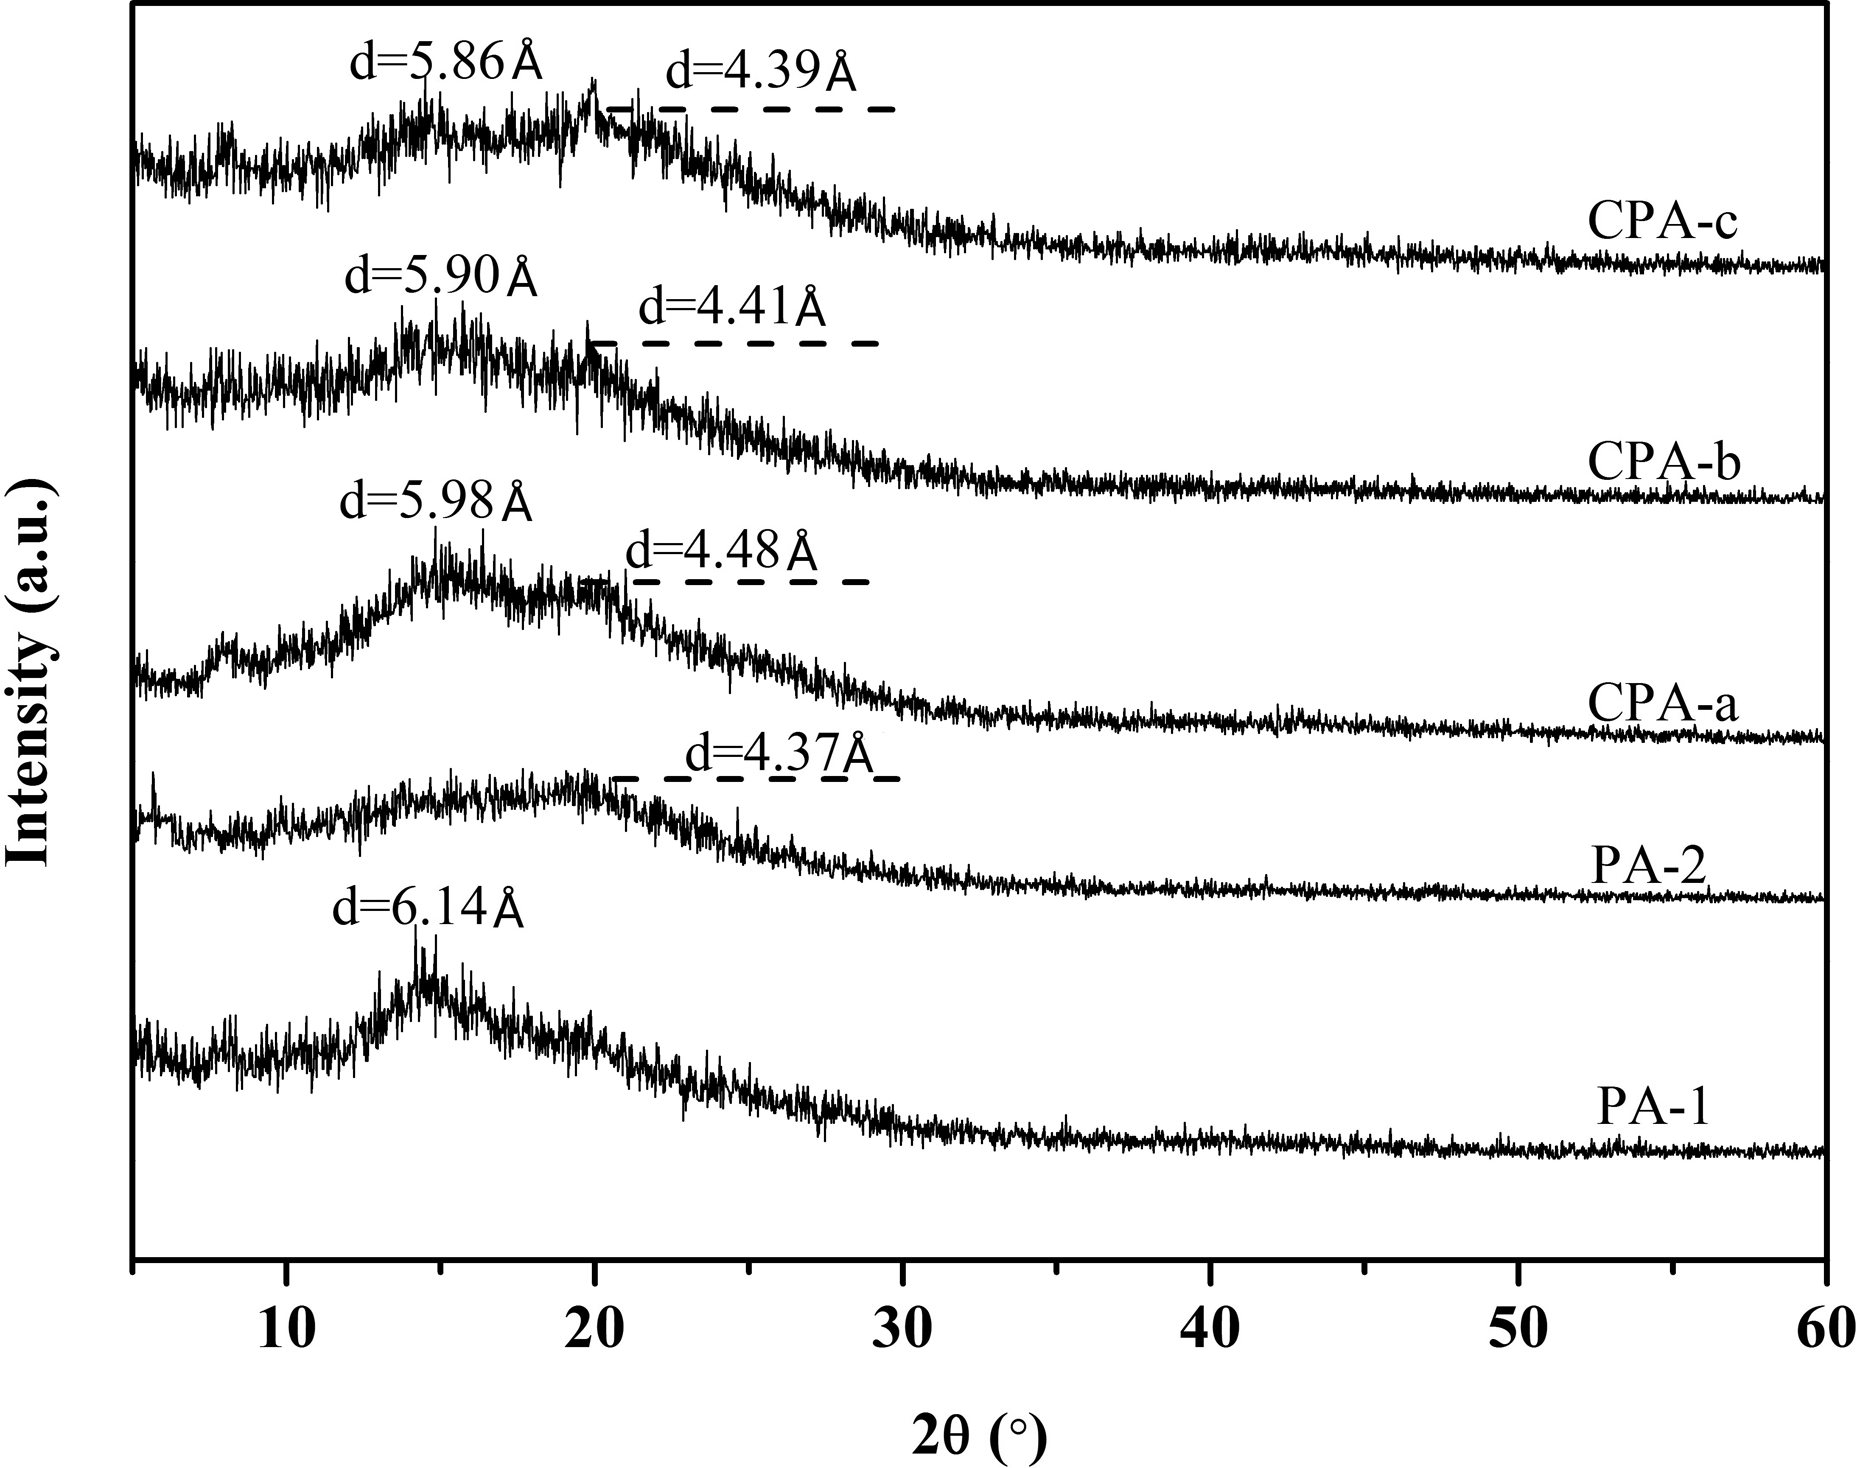
XRD patterns of the PAs and CPAs. PA: polyamide; CPA: copolyamide; XRD: X-ray diffraction.
Gas transport properties
Effect of chemical structures on gas transport properties
To investigate the effect of chemical structures on gas transport properties, single-gas permeability of PA and CPA membranes with five single gases (H2, N2, O2, CH4, and CO2) was measured using the constant-volume/variable-pressure method at 25°C and 1 atm. The results were summarized in Table 4.
Gas permeability (P) and selectivity (α) of PA and CPA membranes at 25°C and 1 atm.
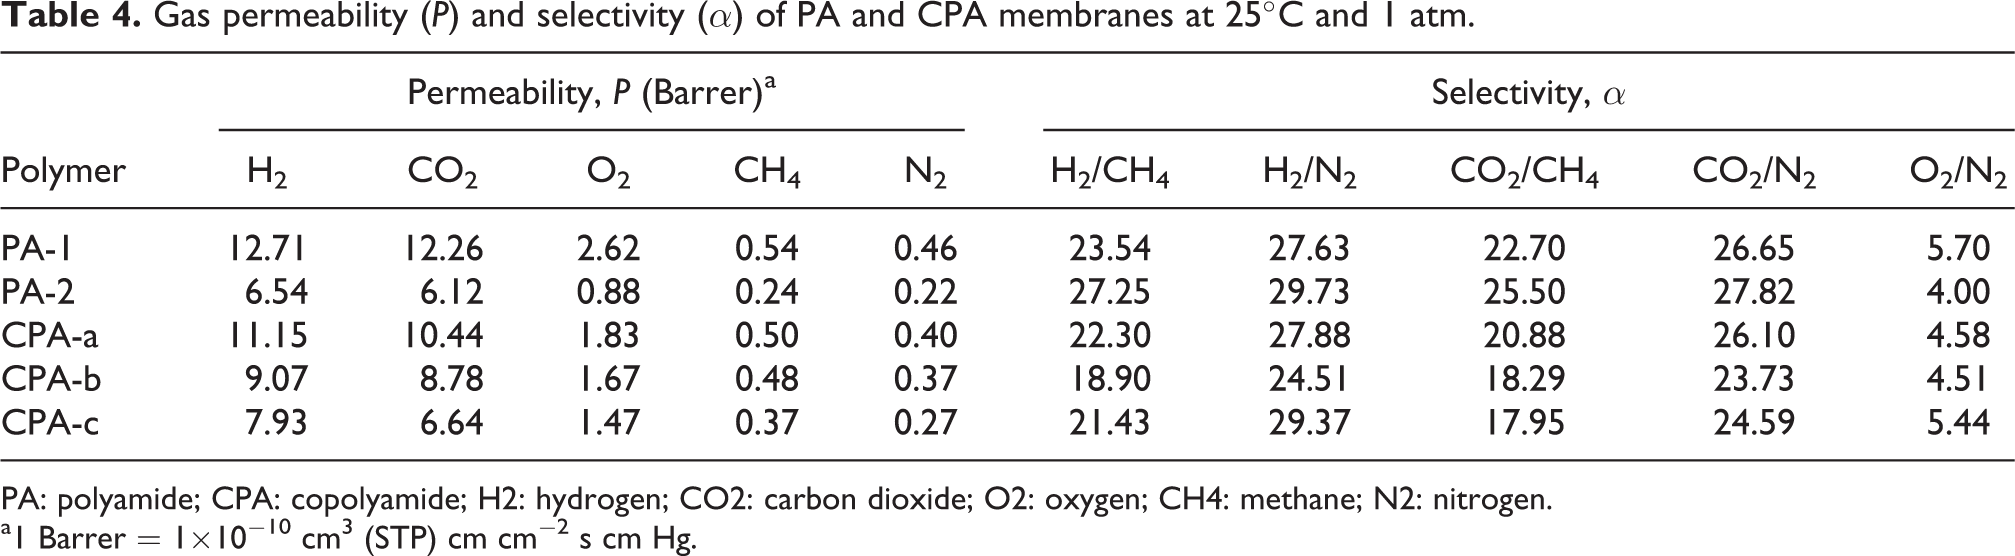
PA: polyamide; CPA: copolyamide; H2: hydrogen; CO2: carbon dioxide; O2: oxygen; CH4: methane; N2: nitrogen.
a1 Barrer = 1×10⁻¹⁰ cm3 (STP) cm cm−2 s cm Hg.
The gas permeability of PA membranes showed the following behavior: P (H2) > P (CO2) > P (O2) > P (N2) ∼ P (CH4), which is related to the order of kinetic diameter (Å) of gas molecules in which H2 (2.89), CO2 (3.3), O2 (3.46), N2 (3.64), and CH4 (3.8). 28 This trend is commonly observed in most glassy polymeric membranes. 47,48 In general, gas permeability and FFV maintain a linear relationship; and as FFV decreases, gas permeability decreases as well. 49 The order of gas permeability of PA and CPA membranes was PA-1 > CPA-a > CPA-b > CPA-c > PA-2, and this in line with the FFV values of polymers. Gas permeability mainly depends on FFV and is determined by the following empirical equation 22,27 :
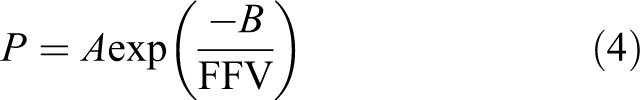
where A and B are constants and depend on the temperature and gas type. In general, the logarithm of permeability roughly decreases linearly with the reciprocal increase in FFV. 19 Moreover, this trend was satisfactorily followed by a series of PA and CPA membranes in our study (Figure 12).
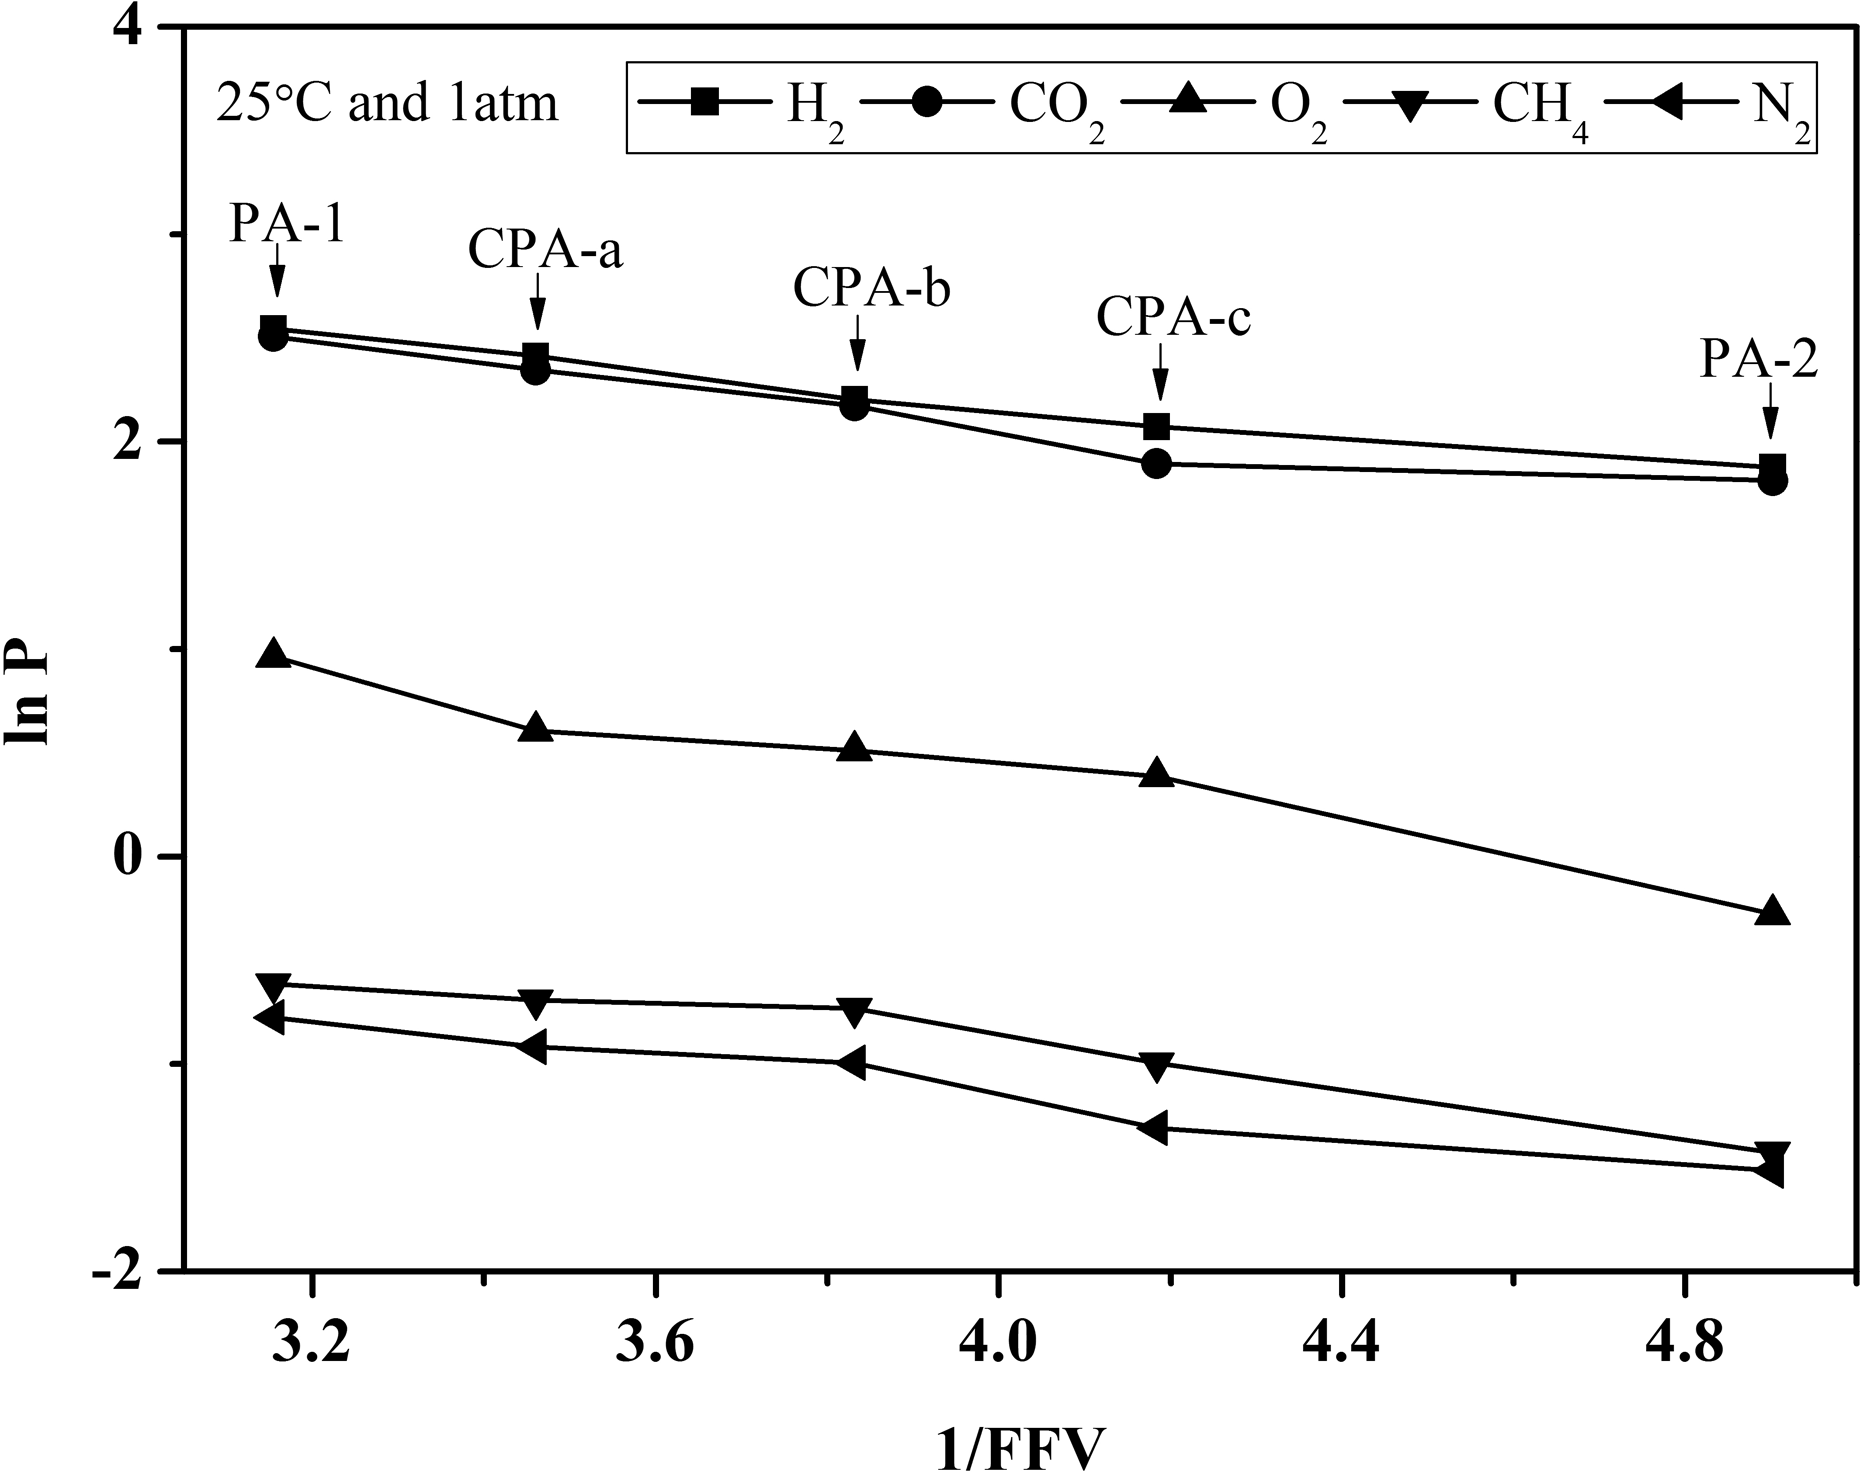
The dependence of gas permeability versus reciprocal of FFV of PA and CPA membranes for H2, CO2, O2, CH4, and N2 gases. PA: polyamide; CPA: copolyamide; FFV: fractional free volume; H2: hydrogen; CO2: carbon dioxide; O2: oxygen; CH4: methane; N2: nitrogen.
The increasing order of the PA and CPA membrane permeability for different gases was in accordance with that of dsp as obtained from XRD. PA-1 with the bulky 6F group had the highest gas permeability in this series, it obtained the highest FFV and dsp values as well (Table 1 and Figure 11). 19 The gas permeability values of PA-1 were greater than that of PA-2 due to the presence of bulky (–CF3)2 group, which restricted the polymer chain-chain packing and increased FFV. In CPA membranes, gas permeability values displayed a gradually increasing trend with the increase in the HFA content, which is attributed to the increase in bulky (–CF3)2 group.
As illustrated in Table 4, the α values of H2/N2, CO2/N2, and O2/N2 gas pairs varied between 24.51–29.73, 23.73–27.82, and 4.00–5.70, respectively. PA-1 exhibited higher α values in PA and CPA membranes which is attributable to the combination of FFV, rigid backbone, and molecular interaction caused by the polar (–CF3)2 groups. Recently, the gas separation performance of other polymers containing fluorene group was also investigated (Table 5). Compared with the other polymers containing fluorene group, PA-1 simultaneously exhibited excellent H2/N2, CO2/N2, and O2/N2 selectivity. For CPA membranes, the α values displayed a decreasing trend due to the concurrent decrease in the HFA content and an increasing trend due to a more flexible C–O–C group from OBA introduced into the CPA backbones. 19 In summary, PA-1 had the highest gas permeability, along with higher selectivity, as compared to the other membranes due to its rigid backbone and high FFV.
Comparison of gas transport properties of the PAs and CPAs with other polymers containing fluorene group.
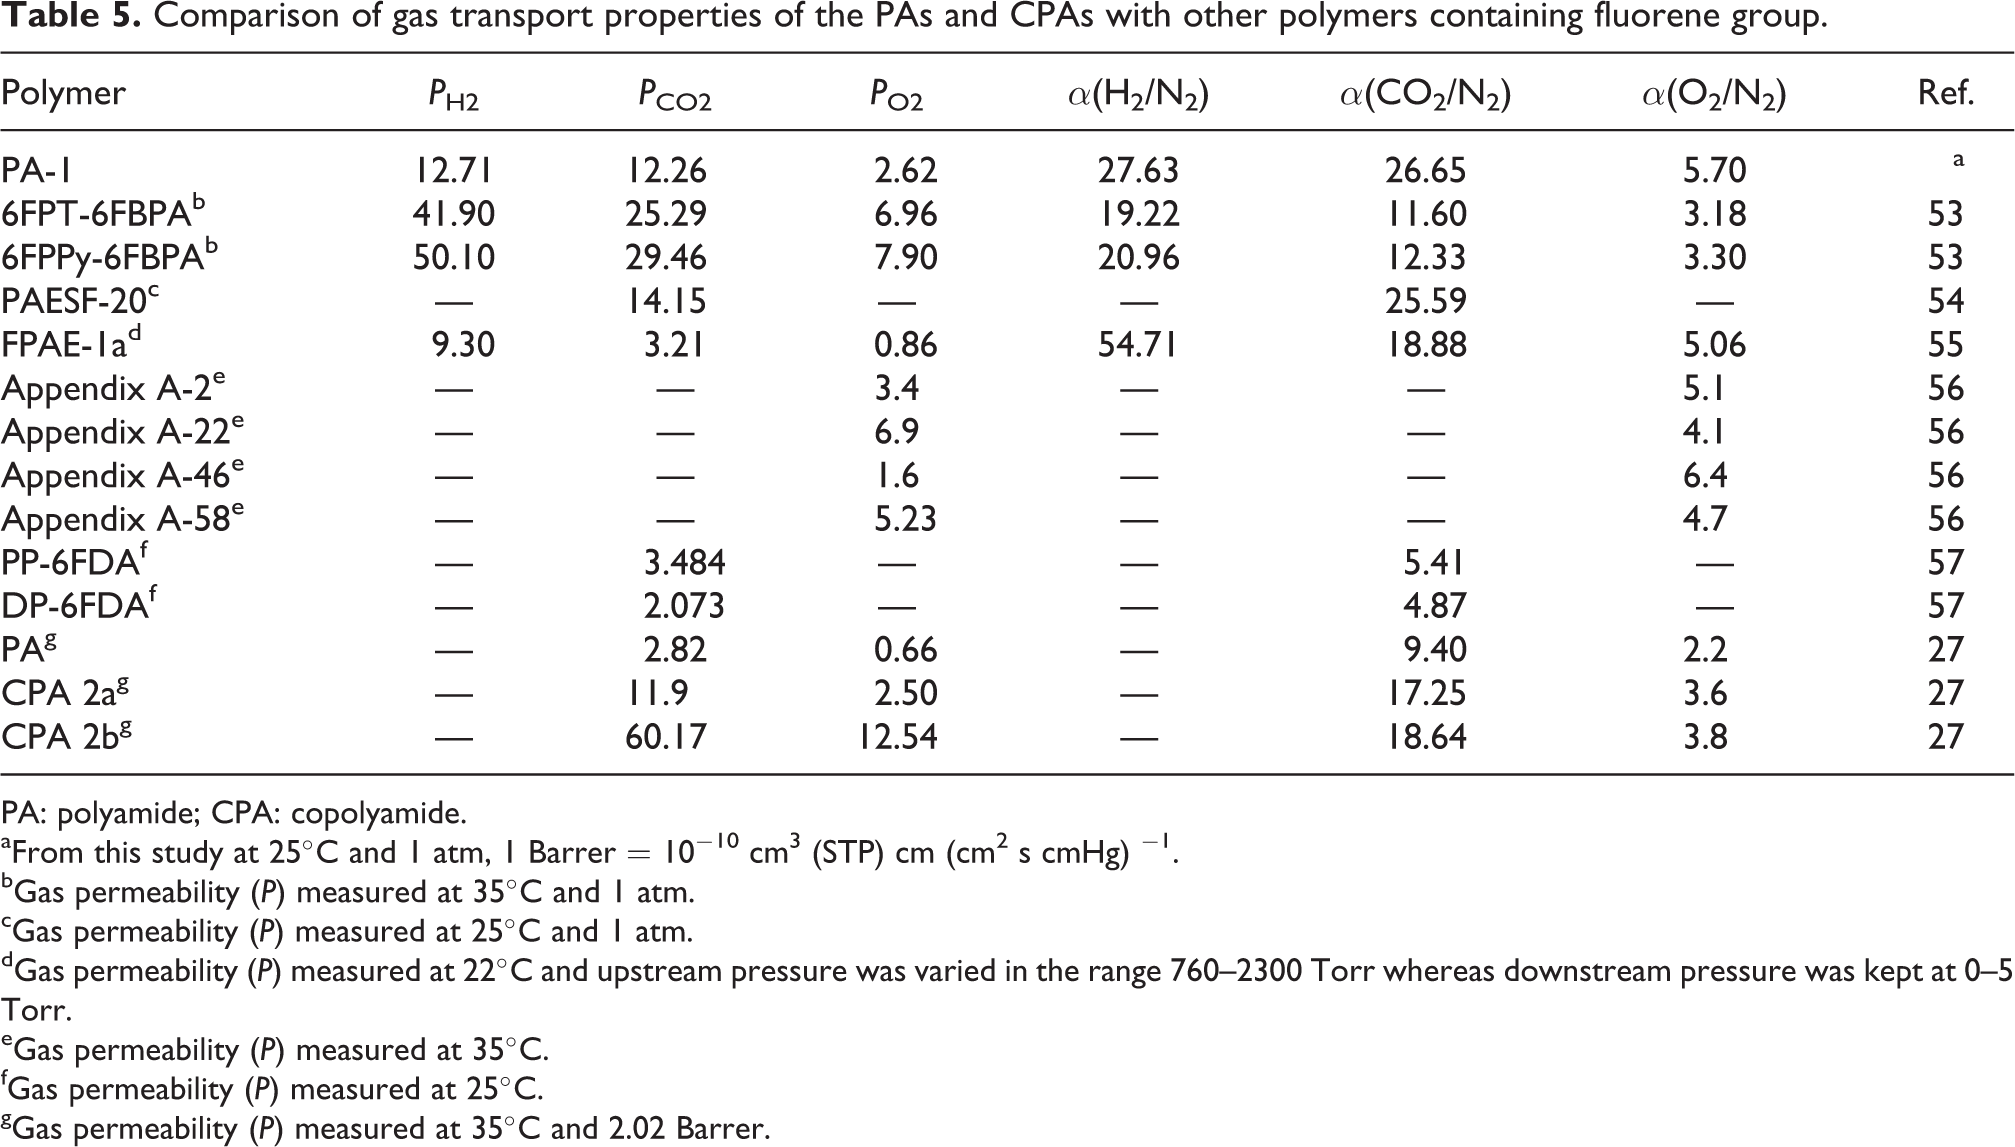
PA: polyamide; CPA: copolyamide.
aFrom this study at 25°C and 1 atm, 1 Barrer = 10−10 cm3 (STP) cm (cm2 s cmHg) −1.
bGas permeability (P) measured at 35°C and 1 atm.
cGas permeability (P) measured at 25°C and 1 atm.
dGas permeability (P) measured at 22°C and upstream pressure was varied in the range 760–2300 Torr whereas downstream pressure was kept at 0–5 Torr.
eGas permeability (P) measured at 35°C.
fGas permeability (P) measured at 25°C.
gGas permeability (P) measured at 35°C and 2.02 Barrer.
Effect of operating temperature on gas transport properties
The temperature dependence of permeability and selectivity of PA-1 membrane was studied over the permeation test range of 25–55°C at 1 atm. The results are shown in Figures 13 and 14. As illustrated in Figure 13, the permeability of all gases (H2, CO2, O2, CH4, and N2) increased with the increase in temperature and they followed the Arrhenius equation (5):
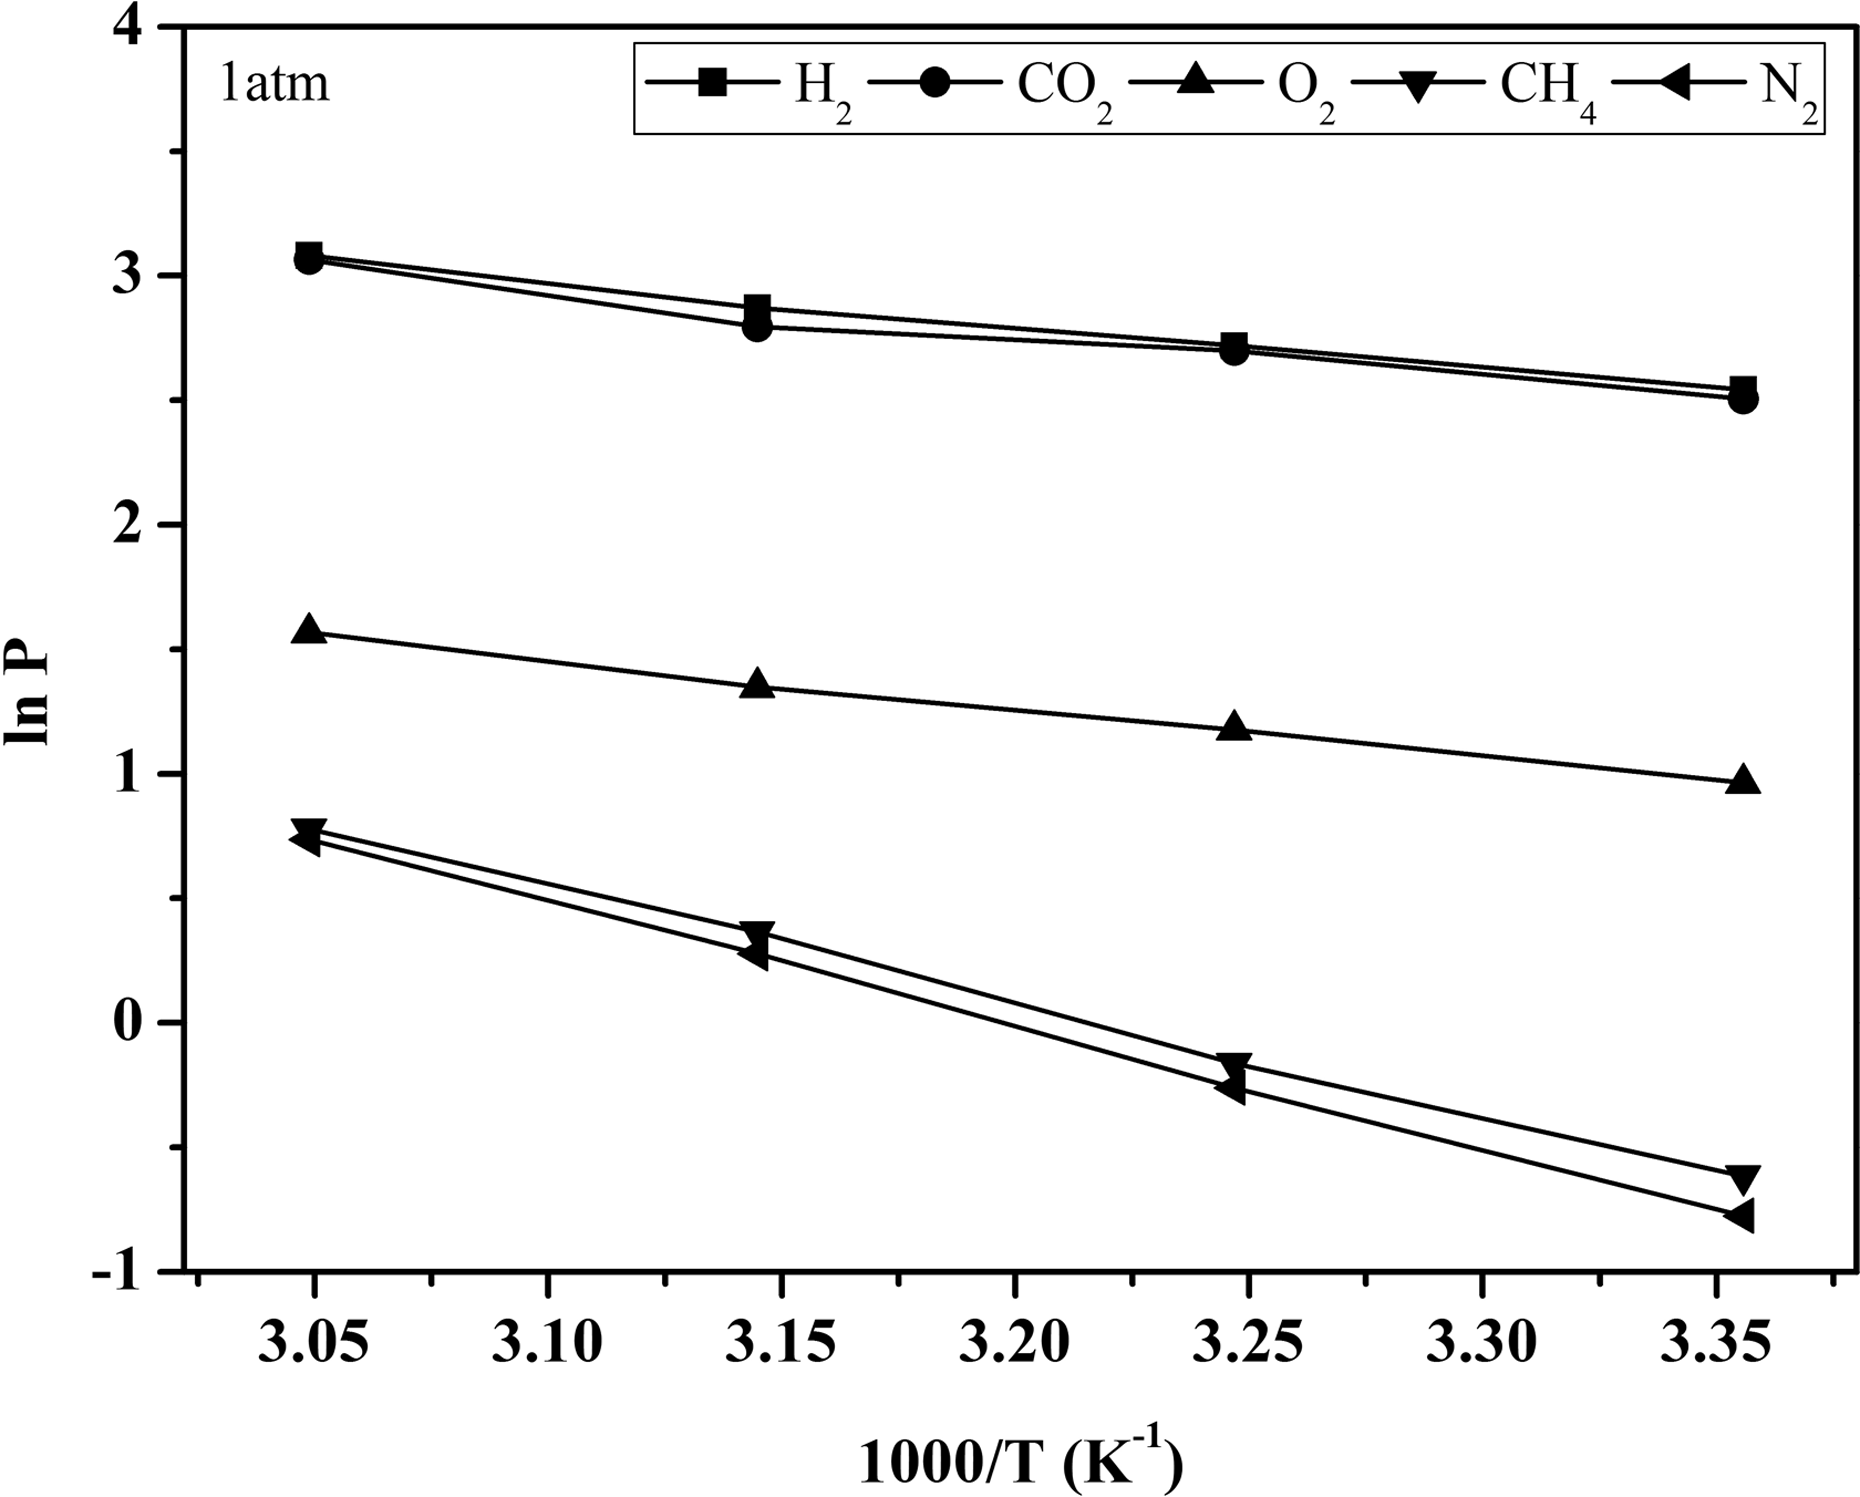
Temperature dependence of single-gas permeability of PA-1 membrane at 1 atm. PA: polyamide.
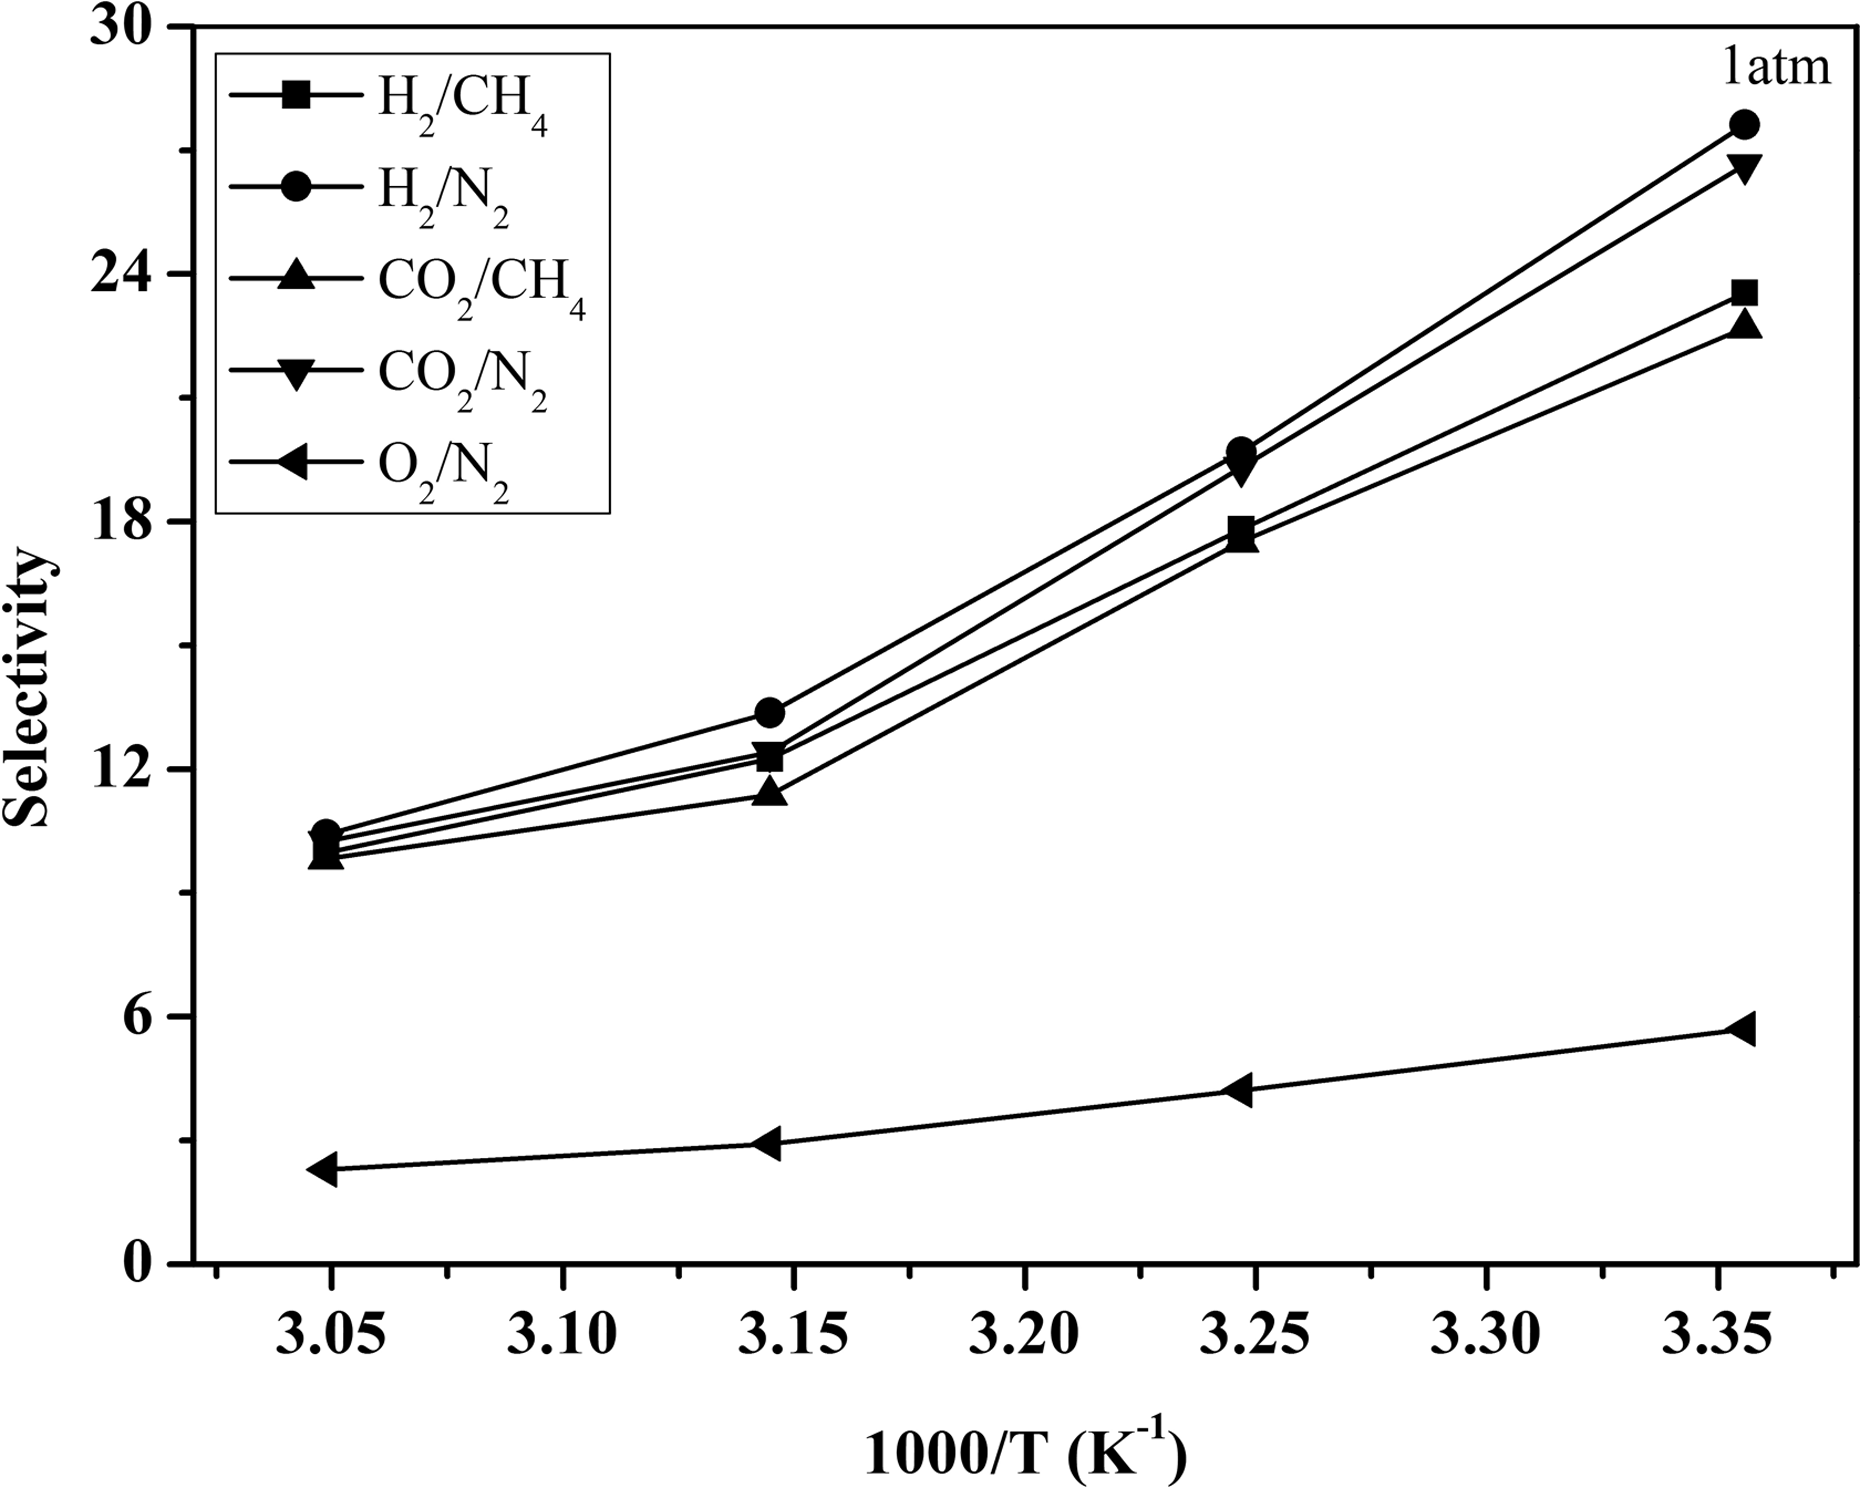
Temperature dependence of selectivity in PA-1 at 1 atm. PA: polyamide.
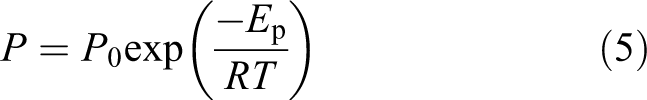
where P0 is the pre-exponential coefficients, EP is the apparent activation energy for permeation process, R is the gas constant, and T is the absolute temperature (K). The permeability logarithm almost linearly decreased with the increase in operating temperature (25–55°C) and plots of lnP versus 1/T (Figure 13) presented this observation. These results were also observed in most polymers 50 , and the improvement in permeability can be attributed to two major reasons: First, the thermodynamic energy of gas molecules increased with the increase of temperature, thus leading to an increase in frequency of the jumps of gas molecules; second, the polymer chain-chain mobility increased with an increase in operating temperature, which created numerous FFV for molecular transport. 51
Increasing operating temperatures led to a decrease in selectivity values (Figure 14). The trend of activation energies for the permeation process was EP (H2, 14.3 kJ mol−1) < EP (CO2, 14.7 kJ mol−1) < EP (O2, 16.1 kJ mol−1) < EP (CH4, 38.3 kJ mol−1) < EP (N2, 41.3 kJ mol−1). The trend was in contrary to the permeability values: P(H2) > P(CO2) > P(O2) > P(CH4) > P(N2). N2 penetrant with higher permeation activation energy showed stronger temperature dependency. Thus, an increase in operating temperature results in a higher percentage of permeability increase for gas penetrant with higher permeation activation energy, which consequently reduced selectivity values. 52 The above results may be due to the polymer chain mobility and the frequency of intersegmental jumps of gas molecules, which were directly affected by temperature. At the same time, widening of the chain segment motions and low gas pair selectivity were also observed.
Conclusions
Aromatic PAs and CPAs containing fluorene group were designed and obtained from full aromatic diamine and diacid monomers. The fluorene group endowed PAs and CPAs with high Tg, high thermal stability, and excellent solubility in polar solvent such as NMP, DMF, DMSO, and DMAc. In particular, PA-1 containing fluorene group and (–CF3)2 group possesses the highest Tg (366°C) and the highest FFV (0.317), thus obtaining the highest gas permeability (PH2 = 12.71 Barrer, PCO2 = 12.26 Barrer, and PO2 = 2.62 Barrer) and the high selectivity (α(H2/N2) = 27.63, α(CO2/N2) = 26.65, and α(O2/N2) = 5.70) in this series. The CPA membranes exhibited an increasing trend in gas permeability with the increase of HFA content in CPAs.
Footnotes
Acknowledgements
The authors would like to thank the various helps from the Key Laboratory of Low-carbon Chemistry & Energy Conservation of Guangdong Province in Sun Yat-sen University, China.
Declaration of conflicting interests
The author(s) declared no potential conflicts of interest with respect to the research, authorship, and/or publication of this article.
Funding
The author(s) disclosed receipt of the following financial support for the research, authorship, and/or publication of this article: This work was financially supported by the National Natural Science Foundation of China (51572185).