
Abstract
A novel intumescent flame retardant, PPMD, was designed from phosphaphenanthrene and nitrogen heterocycles through the two-step gut reactions of 1,4-phthalaldehyde and 3-methyl-1-phe-nylpyrazol-5-ylamine. After determination of its structure by nuclear magnetic resonance and Fourier-transform infrared analyses, PPMD was added to an epoxy resin (EP) to facilitate a curing process. Thus, EP/PPMD samples with excellent transparency and flame retardancy were acquired. For example, the EP sample satisfied the UL-94 V-0 standard and achieved a limiting oxygen index value of 30.5% because of the incorporation of 5 wt% PPMD. The cone calorimeter test of the EP/5% PPMD sample revealed that its total smoke production (TSP) and total heat release (THR) values of EP/5% PPMD was only 22.5% and 56.4% of the control group, respectively. Moreover, the average effective heat of combustion (av-EHC) value of EP/5% PPMD was reduced by 34.1%, indicating that PPMD possessed high flame-inhibition activity and smoke suppression efficiency. The flame-retardant mechanisms of PPMD were also investigated in gas phase by pyrolysis-gas chromatography/mass spectrometry (Py-GC/MS) and in condensed phase by XPS and IR.
Introduction
Presently, epoxy resin, a kind of popular thermosetting resin, has been widely utilized in infinite fields such as coatings, electronic insulation, epoxy anticorrosive paints and electronics, because of its adhesive properties, attractive chemical resistance, superior mechanical properties, and outstanding mechanical stiffness.1–3 However, the applications of EP in specific fields are limited by its ignitability.4–6 Moreover, EP materials are required to possess transparency and flame retardancy in some specific fields, such as arts, special coatings, and the production of light-emitting diodes (LEDs), etc.
Generally, the utilization of organic or inorganic flame retardants as additives into EP was a beneficial method to resolve its ignition and combustion challenges.7–10 Although, the incorporation of the halogen-containing flame retardants has been determined to be the most effective and popular approach,11,12 the combustion of the resulting halogen-containing epoxy resin is harmful to the environment and human health. Thus, the halogen-containing flame retardants are gradually being replaced by the safer phosphorus-containing flame retardants. 13 In recent years, 9,10-dihydro-9-oxa-10-phosphobenzophenanthrene-10 oxide (DOPO) or its derivative has been added to EP to achieve materials with superior thermal stability and excellent flame retardancy.14–18 For example, Shi et al. 19 reported the successful design and synthesis of a novel phosphorus-containing halogen-free ionic liquid ([Dmim]Tos), which concurrently improved the flame retardancy and mechanical property of EP were concurrently improved. When 4 wt% [Dmim]Tos was added to EP, the subsequent EP/4.0% [Dmim]Tos achieved the LOI value of 32.5% and had a triumphant UL-94 V-0 rating. The CC test also obtained prosperous results, for instance, the peak heat release rate (p-HRR) values of EP/4.0% [Dmim]Tos was reduced by 37.0%. Previously, our team had synthesized a novel polymer, piperazine phosphaphenanthrene (DOPMPA), 20 and its incorporation of 13.0 wt% DOPMPA into EP, the EP/13.0% DOPMPA sample had a triumphant UL-94 V-0 rating and had LOI value up to 34.0%. Moreover, the result of the CC test showed that the p-HRR value of EP/13.0% DOPMPA was reduced by 73.1%. It was remarkably observed that the two DOPO derivatives [Dmim]Tos and DOPMPA significantly improved the thermal stability and flame retardancy of EP.
Unfortunately, the poor compatibility of most flame retardants with EP destroyed thermal stability and mechanical strength.21–23 Therefore, it was impending to avert those shortcomings. Recent studies have established that some DOPO derivatives with azole-containing heterocycles manifested simultaneous excellent transmittance and flame retardancy24–29 when added to EP. For instance, Wang et al. 30 reported that the incorporation of ATZ, a novel compound composed of phenanthroline and a tetrazole ring (ATZ) dramatically improved the flame retardancy of EP. Meanwhile, the result showed that EP/6% ATZ composite passed a UL-94 V-0 rating and its LOI value increased to 33.7%. Moreover, the EP/ATZ composites had excellent transparency. 3-Methyl-1-phenylpyrazol-5-ylamine was generally utilized as an intermediate for dyes and medicines. In this paper, due to the presence of amino groups in its structure, it has been confirmed to react with aldehyde and further with DOPO to form phosphaphenanthrene/phenylpyrazole-containing flame retardancy.
Experimental section
Materials
EP (E-44, diglycidyl ether of bisphenol A) was supplied by Xingchen Material Co., Ltd. 9,10-Dihydro-9-oxa-10-phospha-phenanthrene-10-oxide (DOPO) (98%) were provided by Ge’ao Technology Co., Ltd. 4,4′-Diaminodiphenylmethane (DDM) (99%) and 1,4-Phthalaldehyde (99%) were purchased from Sinopharm Chemical Reagent. And 3-Methyl-1-phenylpyrazol-5-ylamine (99%) and ethanol (99%) were obtained from Aladdin Chemistry.
Synthesis of PPMD
The product PPMD was synthesized in two steps. The synthetic route of the intermediate was a typical Schiff-base reaction. Firstly, in nitrogen atmosphere, 3-methyl-1-phenylpyrazol-5-ylamine (5.83 g, 0.033 mol) dissolved in ethanol (50 mL) was mixed in a 250 mL three-necked round flask equipped with a mechanical stirrer and a reflux condenser. Subsequently, 1,4-phthalaldehyde (2.27 g, 0.016 mol) dissolved in ethanol (20 mL) was introduced drop by drop into the flask within 20 min. The reaction temperature was maintained at 70°C and the mixture was stirred for 4 h until a homogenous solution was obtained.
Secondly, under the nitrogen protection, the intermediate PPM, ethanol (50 mL) and DOPO (7.34 g, 0.033 mol) was successively added into a three-necked container (200 mL) with a mechanical stirrer. With the help of reflux condenser, the reaction temperature was maintained at 70°C and the reaction lasted for 18 hours. After cooling down to room temperature, and removing the solvent, the target product PPMD was acquired. Finally, PPMD with a yield of 87% was vacuum-dried for 18 h at 65°C. The synthetic route of PPMD was shown in Figure 1, and the 1H NMR spectra and 31P-NMR spectra of PPMD was shown in Figure 2.
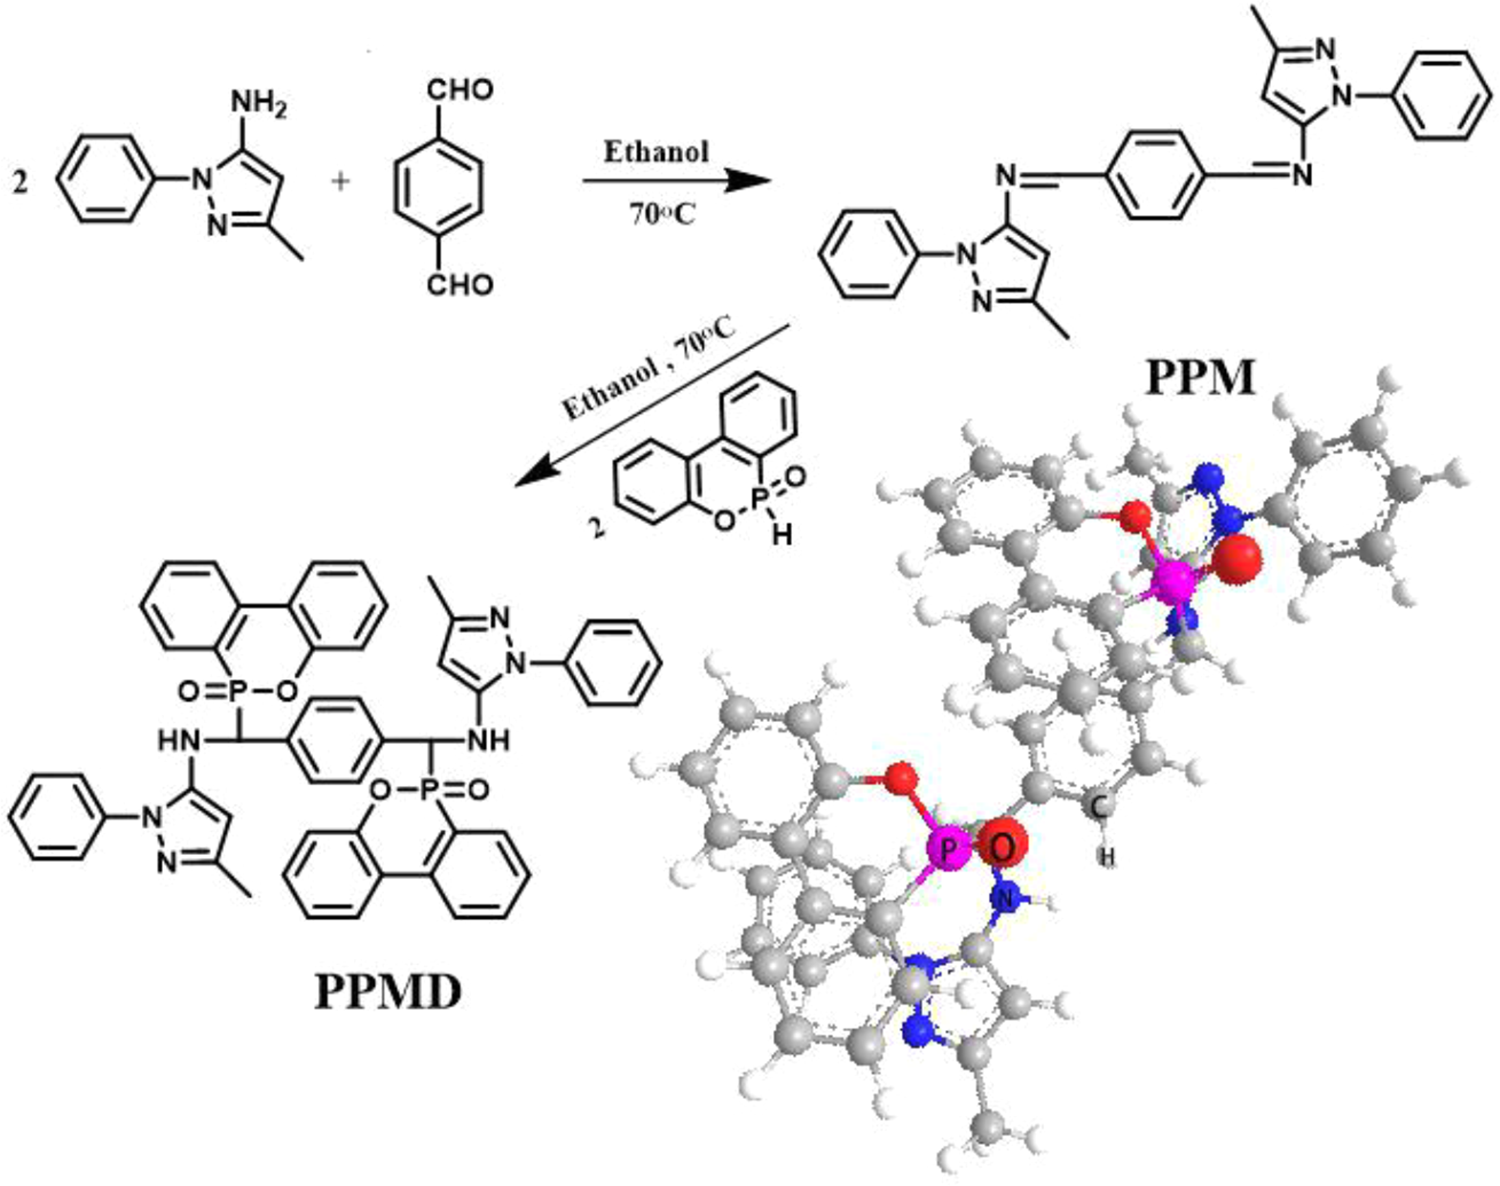
Synthetic route of PPMD and 3D structure of PPMD.
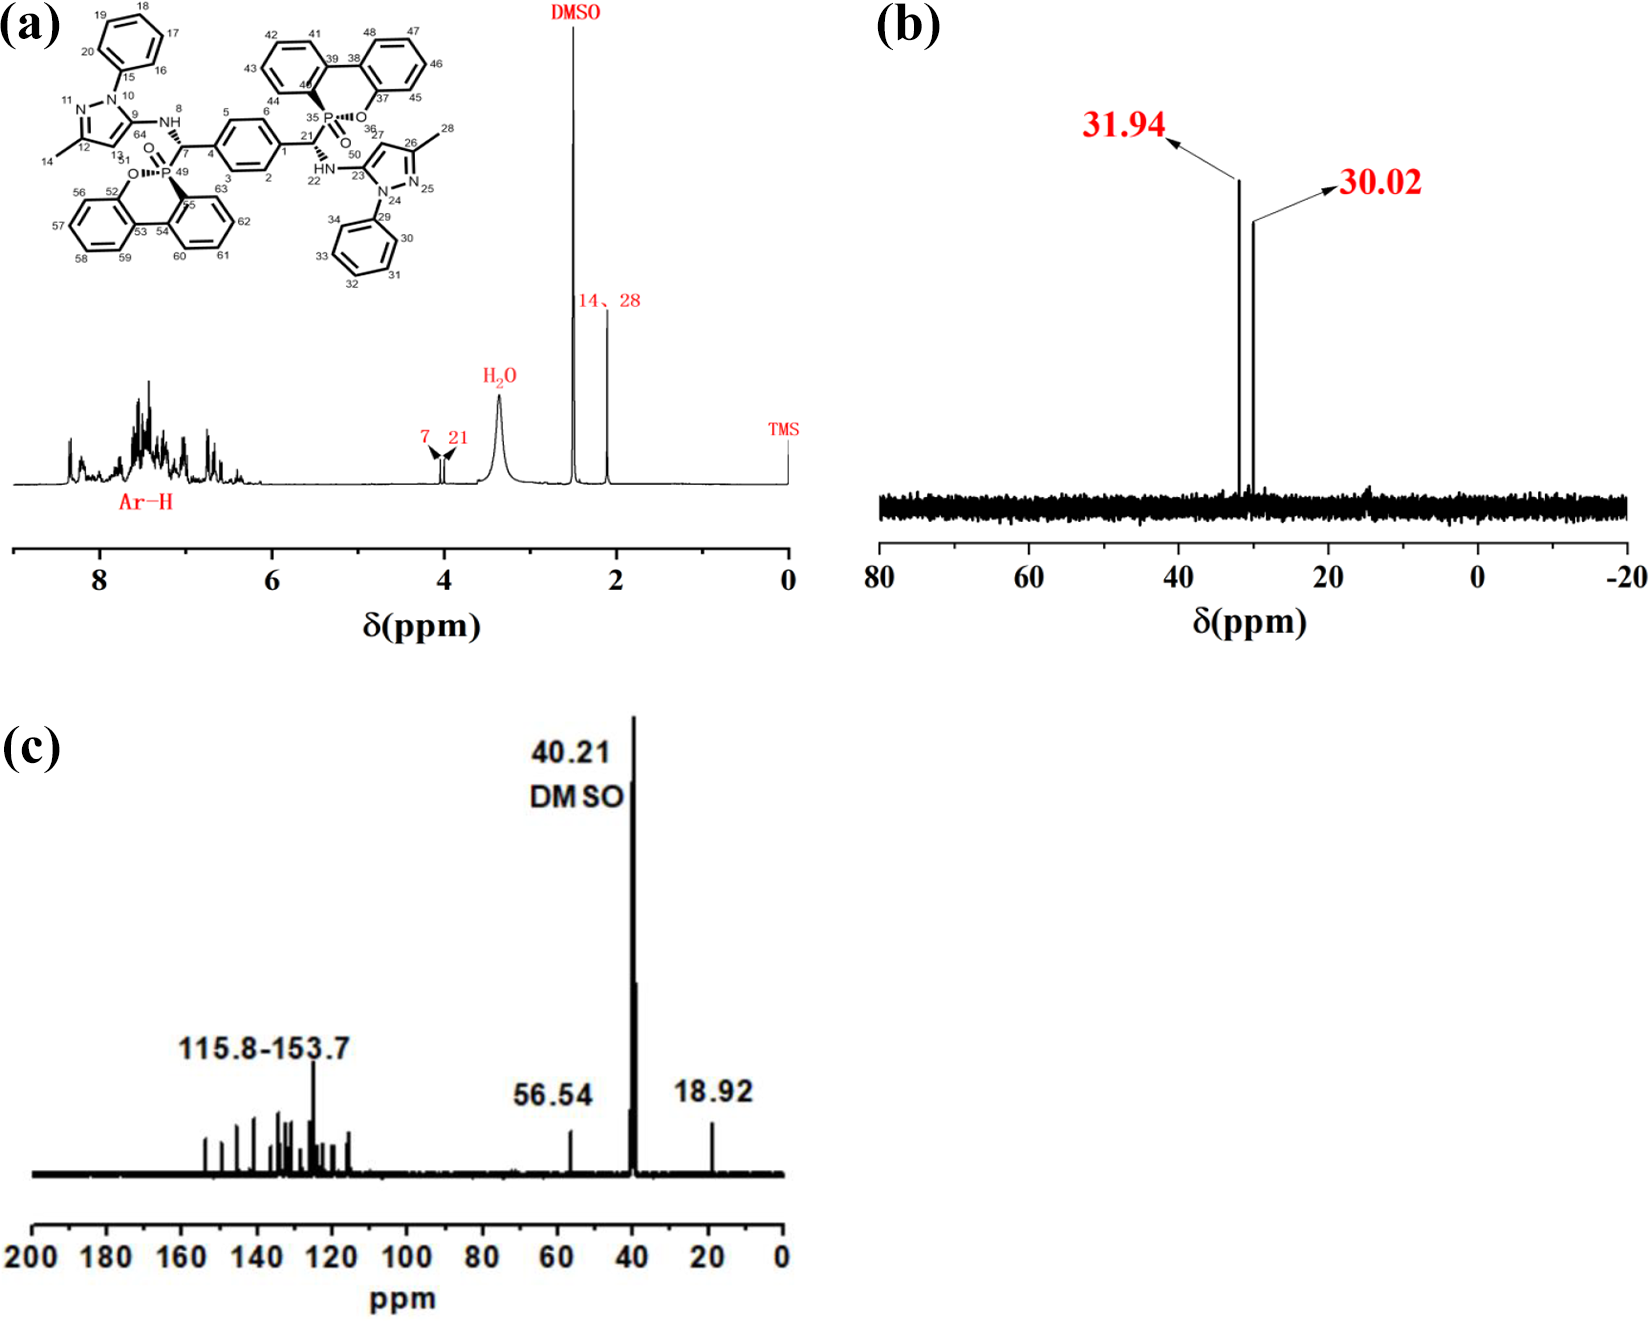
NMR spectra of PPMD. 1H NMR spectrum (a), 31P NMR spectrum (b) and 13C NMR spectrum (c).
Preparations of the cured EP and EP/PPMD
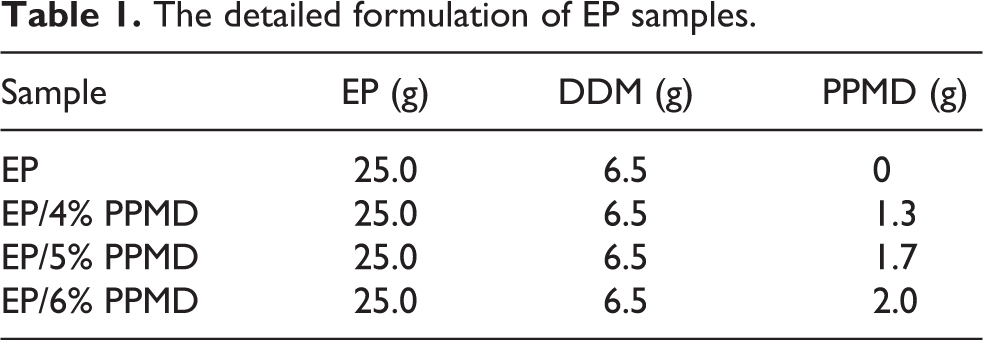
The detailed preparation processes of the cured EP and EP/PPMD were described as follows: firstly, the neat EP and different amounts of PPMD were blended together. The mixture was stirred at 95°C in a vacuum until PPMD was entirely dissolved in EP and thus, obtaining a transparent solution. Secondly, DDM was introduced into the mixture at 95°C, and then the mixture was completely stirred under vacuum for 5 min. Afterward, the resulting solution was quickly poured into PTFE mold. The thermal curing process was carried out at 100°C for 2 h and followed at 150°C for 3 h in an air-circulating oven. The preparation of the cured neat EP followed the same procedure above without the addition of PPMD. The detailed formulation of EP samples was shown in Table 1.
The detailed formulation of EP samples.
Characterization
The 1H NMR and 31P NMR spectra were tested by Bruker Avance III-400 NMR instrument (Rheinstetten, Germany) with PPMD dissolved in d6-dimethyl sulphoxide.
A UV1800 UV-Vis scanning spectrophotometer (SHIMADZU, Japan) was used to record the transmittance in the range of 400 to 800 nm.
FTIR spectra of PPMD and the residue of EP/5% PPMD was recorded by Nicolet 6700 FTIR employing KBr pellets.
The specific process of glass transition temperature test was as follows: The Tg was recorded on a TA Q200 DSC with the help of nitrogen atmosphere, and the test temperature was arisen from 40 to 300°C. The calorifying rate of the test was 5°C min−1, 10°C min−1, 15°C min−1 and 20°C min−1, respectively.
The specific process of thermogravimetric analysis was as follows: under the protection of nitrogen, 7.0 ± 0.5 mg of the EP/PPMD sample was calorified from 40°C to 800°C at a heating rate of 10°C min−1.
The LOI value of EP/PPMD samples was measured by an HC-2C oxygen index meter (Jiangning, China), and the dimensions of the samples were 130 × 6.5 × 3.2 mm3. The UL-94 for of EP/PPMD samples were evaluated by CZF-2 vertical burning instrument (Jiangning, China) and the dimensions of samples were 130 × 13 × 3.2 mm3.
The CC test was performed to analyze the detailed combustion behavior of the EP/PPMD composites on CC device. The EP/PPMD samples with a dimension of 100 × 100 × 5 mm3 were tested under heat flux of 35 kWm−2.
The surface morphologies of the EP/PPMD samples were observed after the CC test by scanning electronic microscopy (SEM) under high vacuum protection and a voltage of 20 kV.
XPS was performed with an instrument from Thermo fisher Scientific Co., USA. The specific conditions were as follows: ultrahigh vacuum and Al Kα excitation radiation at 1486.6 eV.
DMA was tested on a DMA Q800 apparatus (TA instruments) at a heating rate of the process was 10°C min−1. The other specific conditions were as follows: the constant frequency and oscillation amplitude were controlled at 1.0 Hz and 10.0 μm, respectively, and the dimension of samples was 40 × 10 × 4 mm3.
A gas chromatography-mass spectrometer (Perkin-Elmer Clarus 680 GCSQ8MS) was employed to identify the pyrolysis gases in the CDS 5200 pyrolyzer. The specific steps were as follows: The sample (500 ug) was tested from 25°C to 600°C in a helium atmosphere for 10 seconds. The capillary column at 40°C lasted for 2 min. Thereafter, the temperature was increased from 40°C to 280°C at a rate of 10°C min−1 and held for 5 min. The MS indicator was selected for the operation in an electron bombardment mode with an electron capacity of 70 eV. The injection temperature was maintained at 300°C and the ion source temperature was held at 250°C.
Results and discussion
Structure characterization of PPMD
Figure 3 showed FTIR spectrum of PPMD. The characteristic absorption peaks were observed at 3242 cm−1 (N–H), 1601cm−1 (P–C), 1505 cm−1 (P–CAr), 1205 cm−1 (P=O) and 919 cm−1 (P–O–C). 31 The IR analysis conformed the synthesis of the target product PPMD.
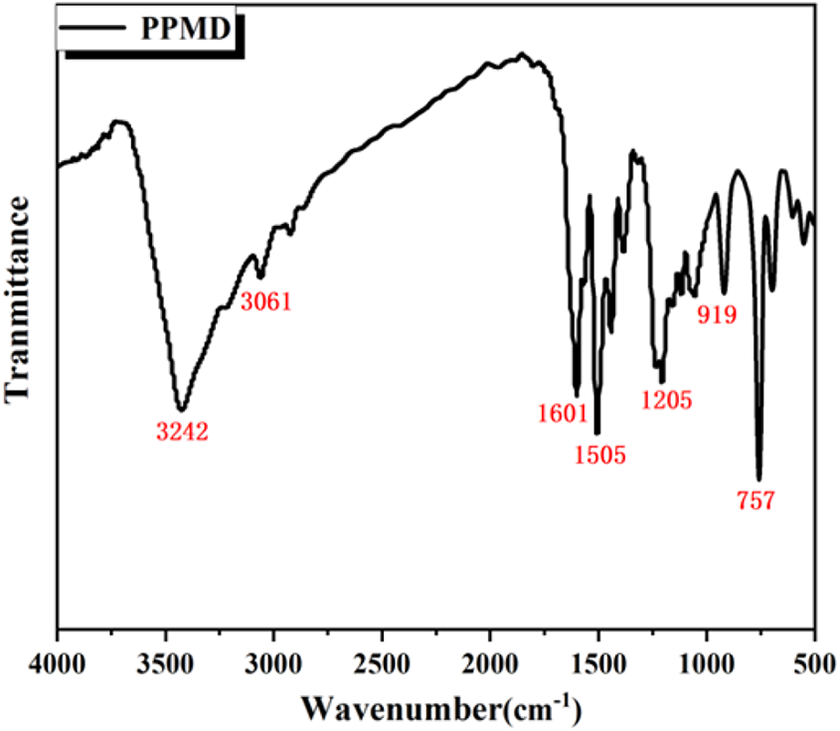
FTIR spectrum of PPMD.
The NMR spectra of PPMD were shown in Figure 2. In 1H NMR spectra, the peaks at 6.7–8.4 ppm were assigned to signal of the hydrogen proton of imidazole and benzene ring. The signal of the hydrogen proton of the newly formed chiral carbon atom was observed at 3.8–4.2 ppm. The peaks at 2.0 ppm were assigned to the signal of the hydrogen proton of –CH3. The intensity ratio of Ar–H to –CH3 was 1.00:0.19 in the spectrum, which corresponded to the ratio of hydrogen proton number 16:3 in PPMD. Figure 2(b) illustrated 31P NMR spectrum of PPMD. The peaks at 31.94 and 30.02 ppm was ascribed to the newly formed chiral carbon.32,33 Figure 2(c) illustrated 13C NMR spectrum of PPMD. The peaks at 115.8–153.7 ppm were assigned to the signal of the carbon proton in the imidazole and benzene rings. The signal of new formed chiral carbon atom was observed at 56.54 ppm. The peaks at 18.92 ppm were assigned to signal of the carbon in –CH3.
Thermal analysis
The TGA and DTG curve of PPMD was showed in Figure 4(a) and the thermal degradation of EP/PPMD was shown in Figure 4(b). The maximum weight loss temperatures (Tmax) for PPMD were 163.7°C, 221.3°C, 353.6°C and 533.8°C respectively. The process of weight loss was decomposition of PPMD into poly-/pyro-/ultraphosphoric acids, which then promoted the dehydration and carbonization of epoxy resin. The TGA curves of EP/PPMD were shown in Figure 4(b), and the key data were summarized in Table 2. Under the protection of N2, the initial temperature (T5%) of pure EP was 355.8°C, and the Tmax of EP reached 380.5°C. Moreover, the T5% of EP/4% PPMD, EP/5% PPMD and EP/6% PPMD were 364.0°C, 355.9°C and 346.2°C, respectively. The EP/PPMD thermoset materials were in the one-pace thermal weight-loss course, which was similar to that of the neat EP. With the increase of PPMD, T5% of the EP/PPMD thermoset exhibited a downward trend. On the contrary, the Tmax of the EP/PPMD thermoset demonstrated an upward trend. Meanwhile, the residue rate of flame retardant EP/PPMD thermoset decreased, indicating that it was easier to decompose PPMD at a high temperature compared with EP.
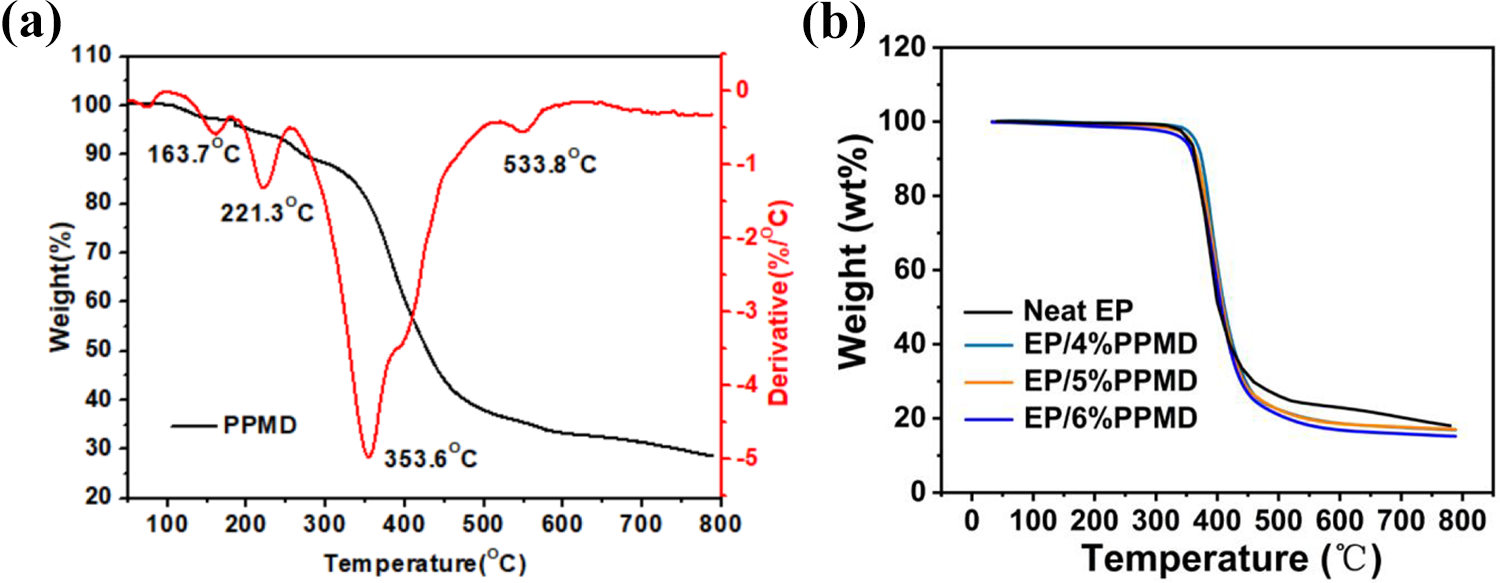
TGA curves of PPMD (a) and EP/PPMD (b).
TGA results of EP samples in nitrogen atmosphere.
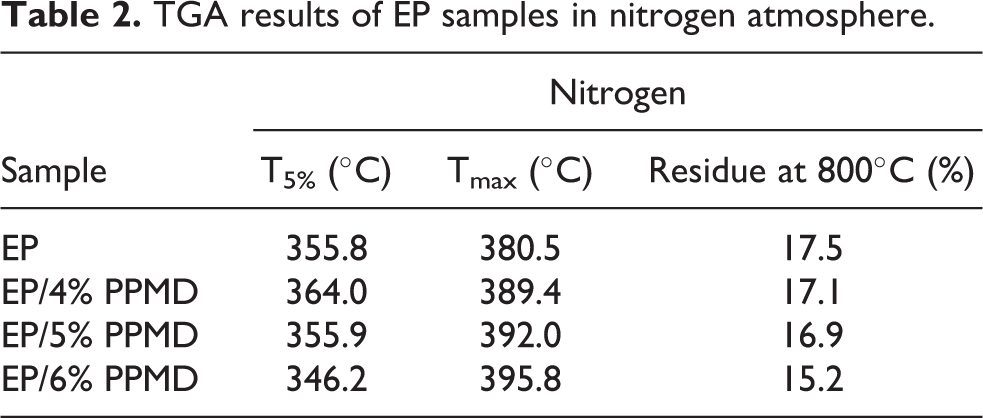
Non-isothermal DSC test of EP/PPMD at different heating rates (5, 10, 15 and 20 K/min) was employed to detect the impact of PPMD on the curing behavior of epoxy resin. As shown in Figure 5(a), with the increase of the heating rate, the Tp vaules of EP gradually moved toward higher temperature. In Figure 5(b), with the increase of the heating rate, the Tp vaules of EP/ PPMD showed the same trend. Notable, the Tp vaules of EP were higher than those of EP/5% PPMD at same heating rate, which showed that EP/5% PPMD system had more active sites and required lower energy to participate in the curing reaction at the beginning stage.
DSC curves of cured EP (a) and EP/PPMD (b).
Mechanical properties and transparency of the cured PPMD
The cross-linking density of the cured EP was determined by DMA test. The tan delta and storage modulus (E′) curves of EP and EP/5% PPMD were shown in Figure 6. Ve values of EP and EP/5% PPMD was evaluated by according to the following equation34,35:

R was the ordinary gas constant (8.314 J/K/mol). T was the absolute temperature and E′ was the storage modulus, which was usually measured at Tg+40°C.
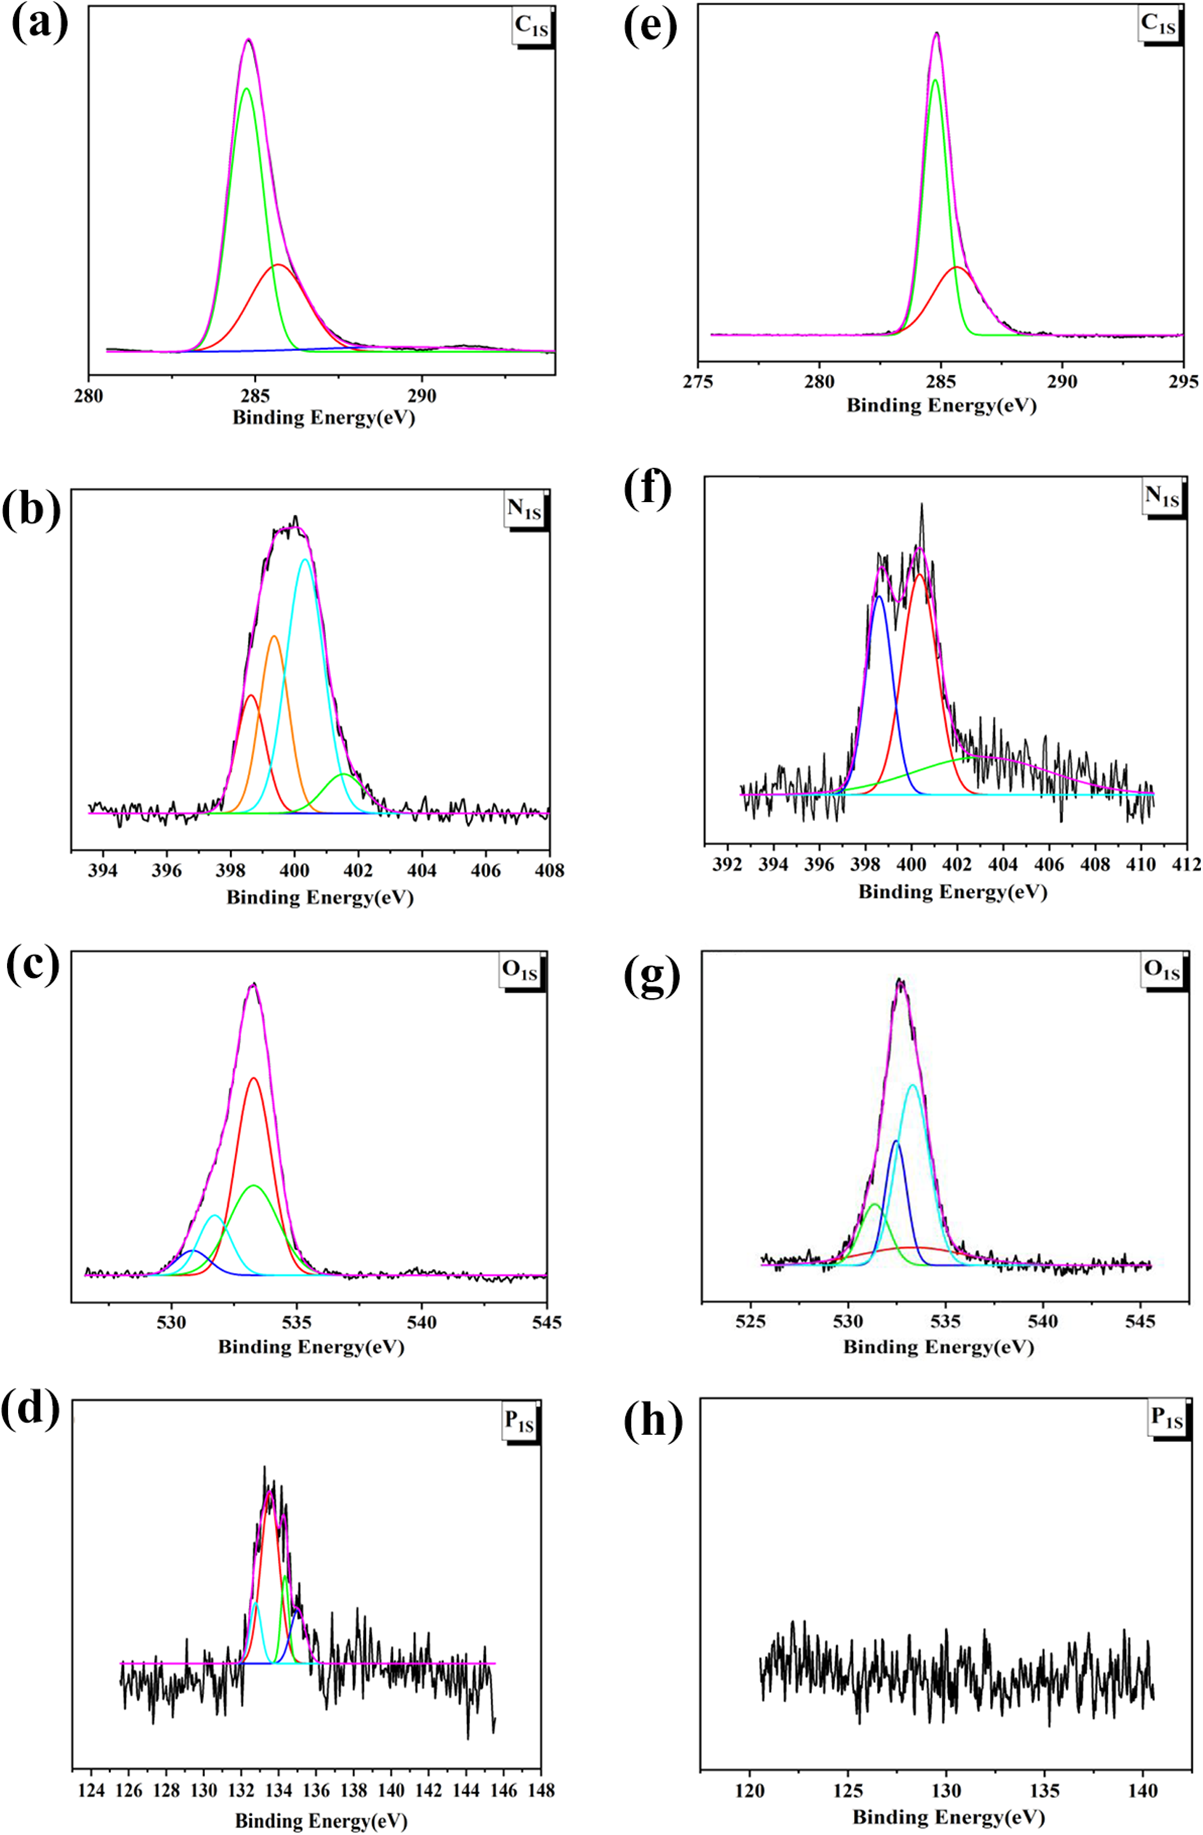
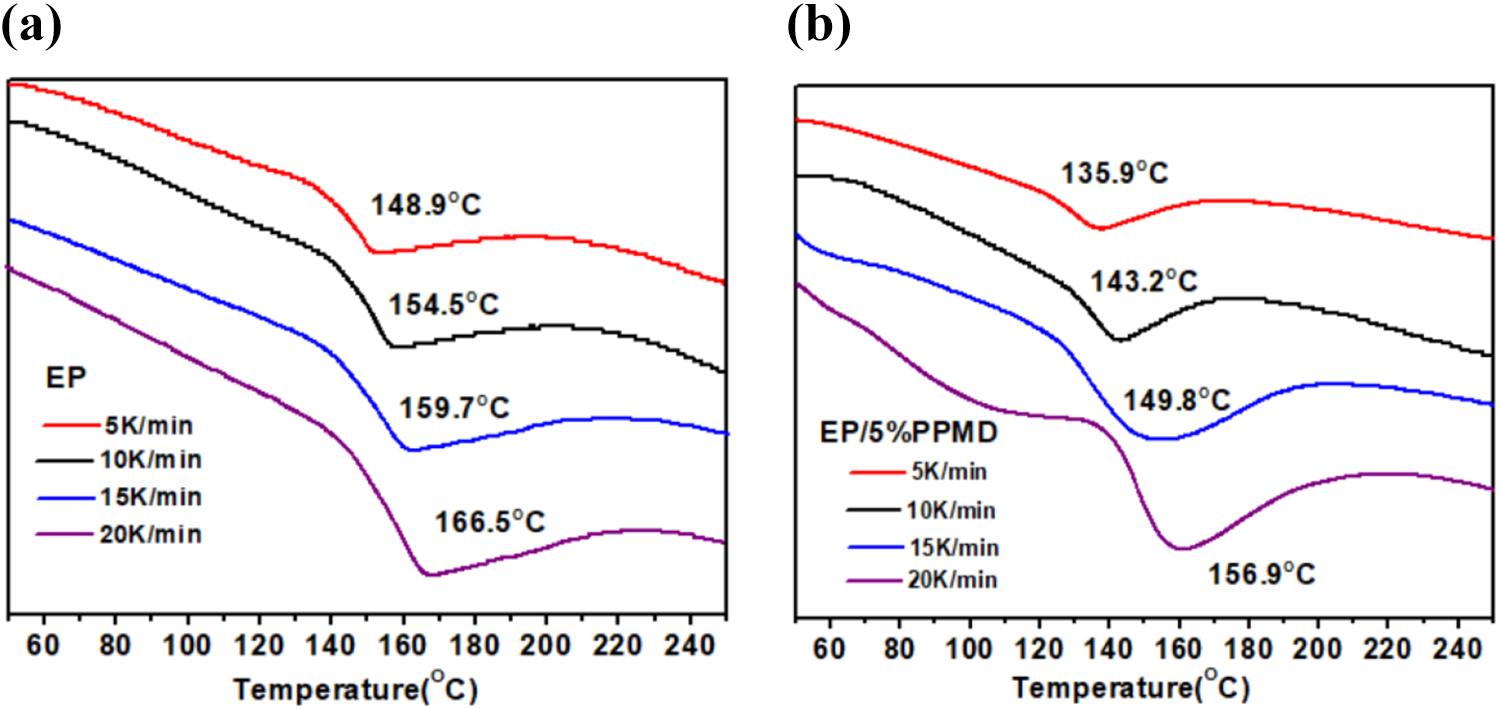
C1s (a), O1s (b), N1s (c), and P2p (d) spectra of char residues for EP (e to h) and EP/5% PPMD (a to d).
As shown in Figure 7, the Tg values of EP and EP/5% PPMD were derived from the peak temperature of tanδ. The calculated Ve were listed in Table 3. In the heating rate of 5 K/min, the Tg values of EP and EP/5% PPMD determined by DSC were 154.5°C and 143.2°C, respectively, while the Tg values of EP and EP/5% PPMD determined by DMA were higher, at 161.6°C and 146.3°C. 36 Moreover, the Ve reduced from 2215.8 mol m−3 to 1299.9 mol m−3 with the addition of PPMD to EP, thus indicating that PPMD affected the curing process of EP.
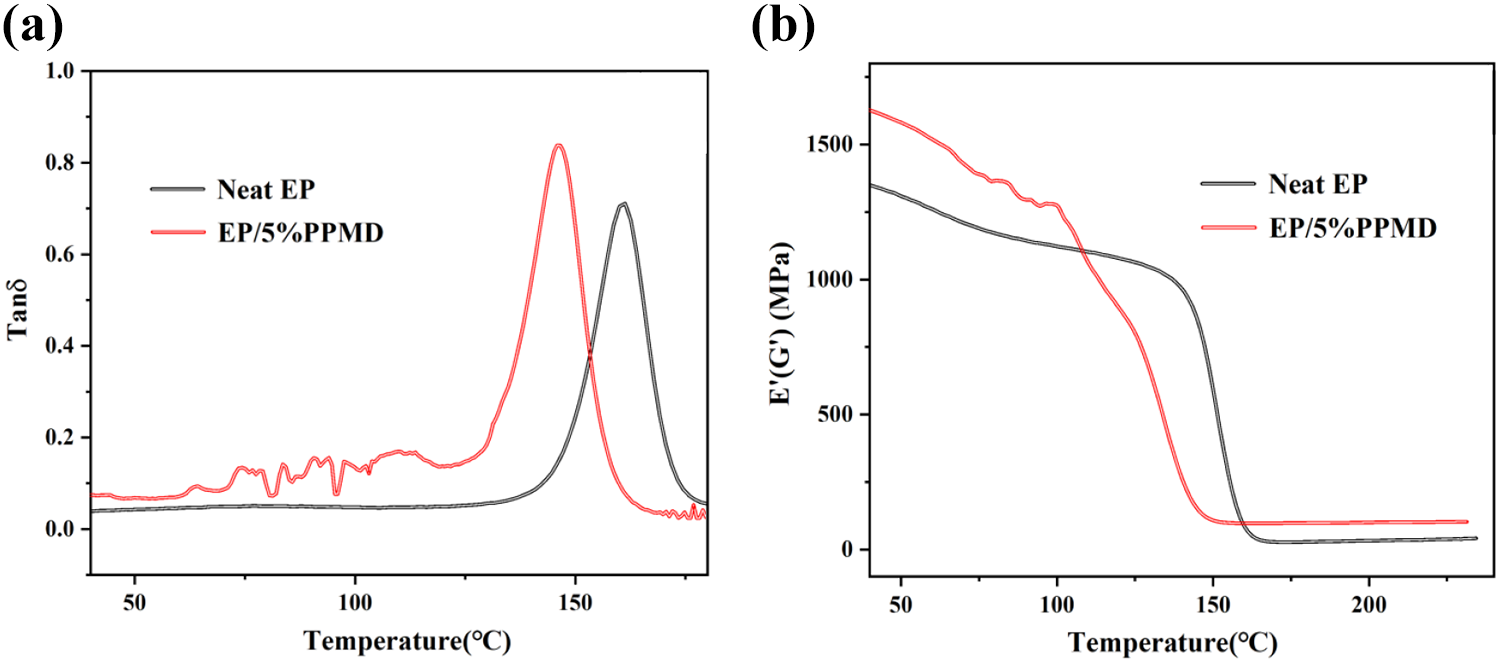
(a and b) DMA curves of EP and EP/5% PPMD.
Storage modulus at 50°C, Tg, and the crosslink density (ve) of EP and EP/5% PPMD.
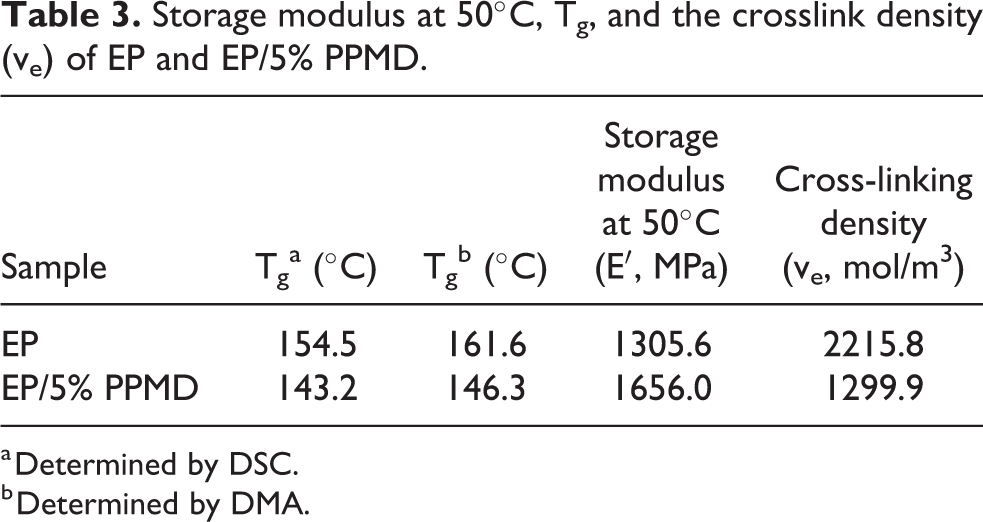
a Determined by DSC.
b Determined by DMA.
The digital photographs of EP/4% PPMD thermoset and EP/5% PPMD thermoset were shown in Figure 8(a) and Figure 8(b), respectively. It was evident that the letters at the bottom of the molds were visible, however, there was no noticeable difference between their transparencies. To further explore the transparency of the EP/PPMD thermoset, EP/PPMD was poured into a cuvette with a dimension of 30 × 10 × 10 mm3. The EP/4% PPMD and EP/5% PPMD samples with thickness of 10 mm were prepared after the curing process and their UV-vis transmittance spectra were analyzed. As shown in Figure 8(c), the EP/PPMD thermoset had good transparency in the wavelength range of 400 nm–800 nm because of the good compatibility of PPMD and EP.
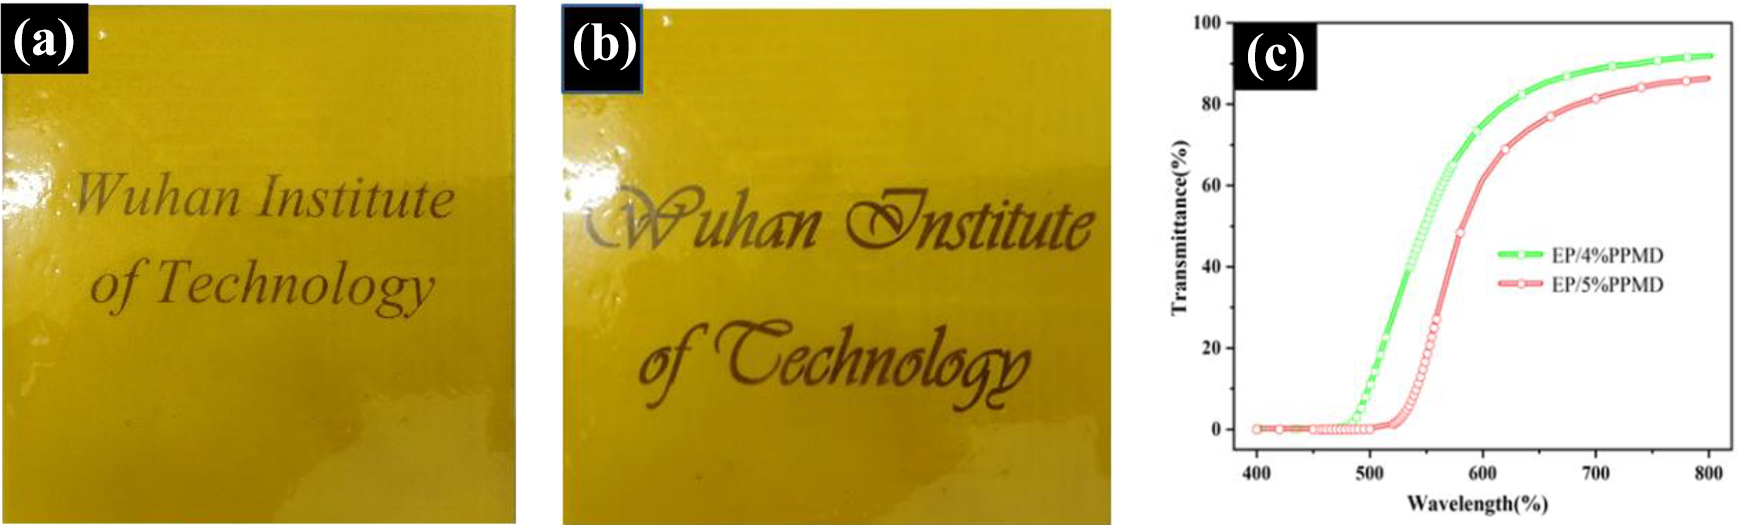
Digital photos of the EP/4% PPMD (a), EP/5% PPMD (b) and the transmittance of EP/4% PPMD and EP/5% PPMD (c).
Flame retardancy of cured PPMD
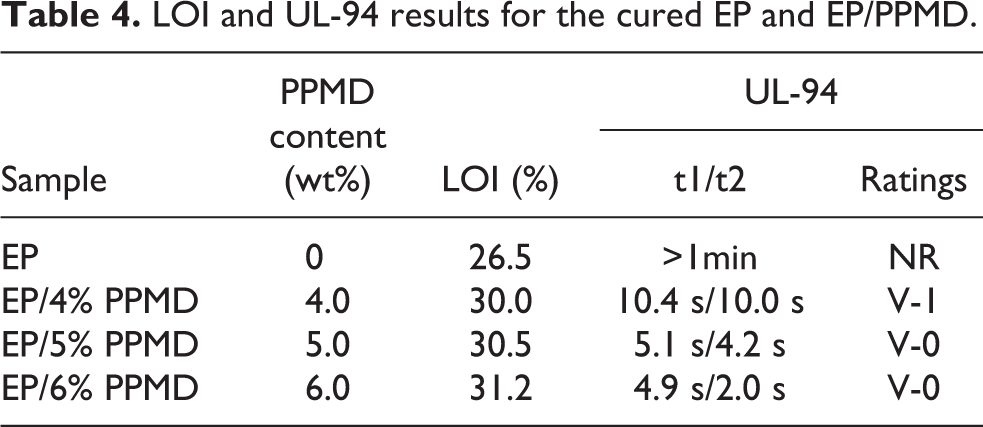
The LOI and UL-94 tests were conducted to estimate the impact of PPMD on EP. As illustrated in Table 4, the pure EP failed the vertical combustion test with an LOI value of 25.8%. However, when PPMD was immitted, the flame retardancy of the EP samples was significantly enhanced. It was evident that the LOI values of EP/4% PPMD, EP/5% PPMD and EP/6% PPMD thermosets increased to 30.0%, 30.5% and 31.2% respectively. Furthermore, when the PPMD content reached 5 wt%, the EP/PPMD thermoset successfully passed UL-94 V-0 rating. The comprehensive and accurate data of the impact of 5 wt% PPMD on the flammability of EP was further obtained by the subsequent CC test.
LOI and UL-94 results for the cured EP and EP/PPMD.
The curves of THR, HRR, TSP and SPR of pure EP and EP/5% PPMD were shown in Figure 9 and the detailed results of the CC test were listed in Table 5. As illustrated in Table 5, the TTI of the EP/5% PPMD was slightly higher than that of the control group due to the decomposition of PPMD into volatile products. Further, PPMD suppressed PHRR and THR by 42.6% and 43.6%, respectively, thus indicating that PPMD effectively inhibited the exothermicities of EP samples during the combustion. FGR 37 was calculated by the following equation to evaluate the fire hazard of EP/5% PPMD.
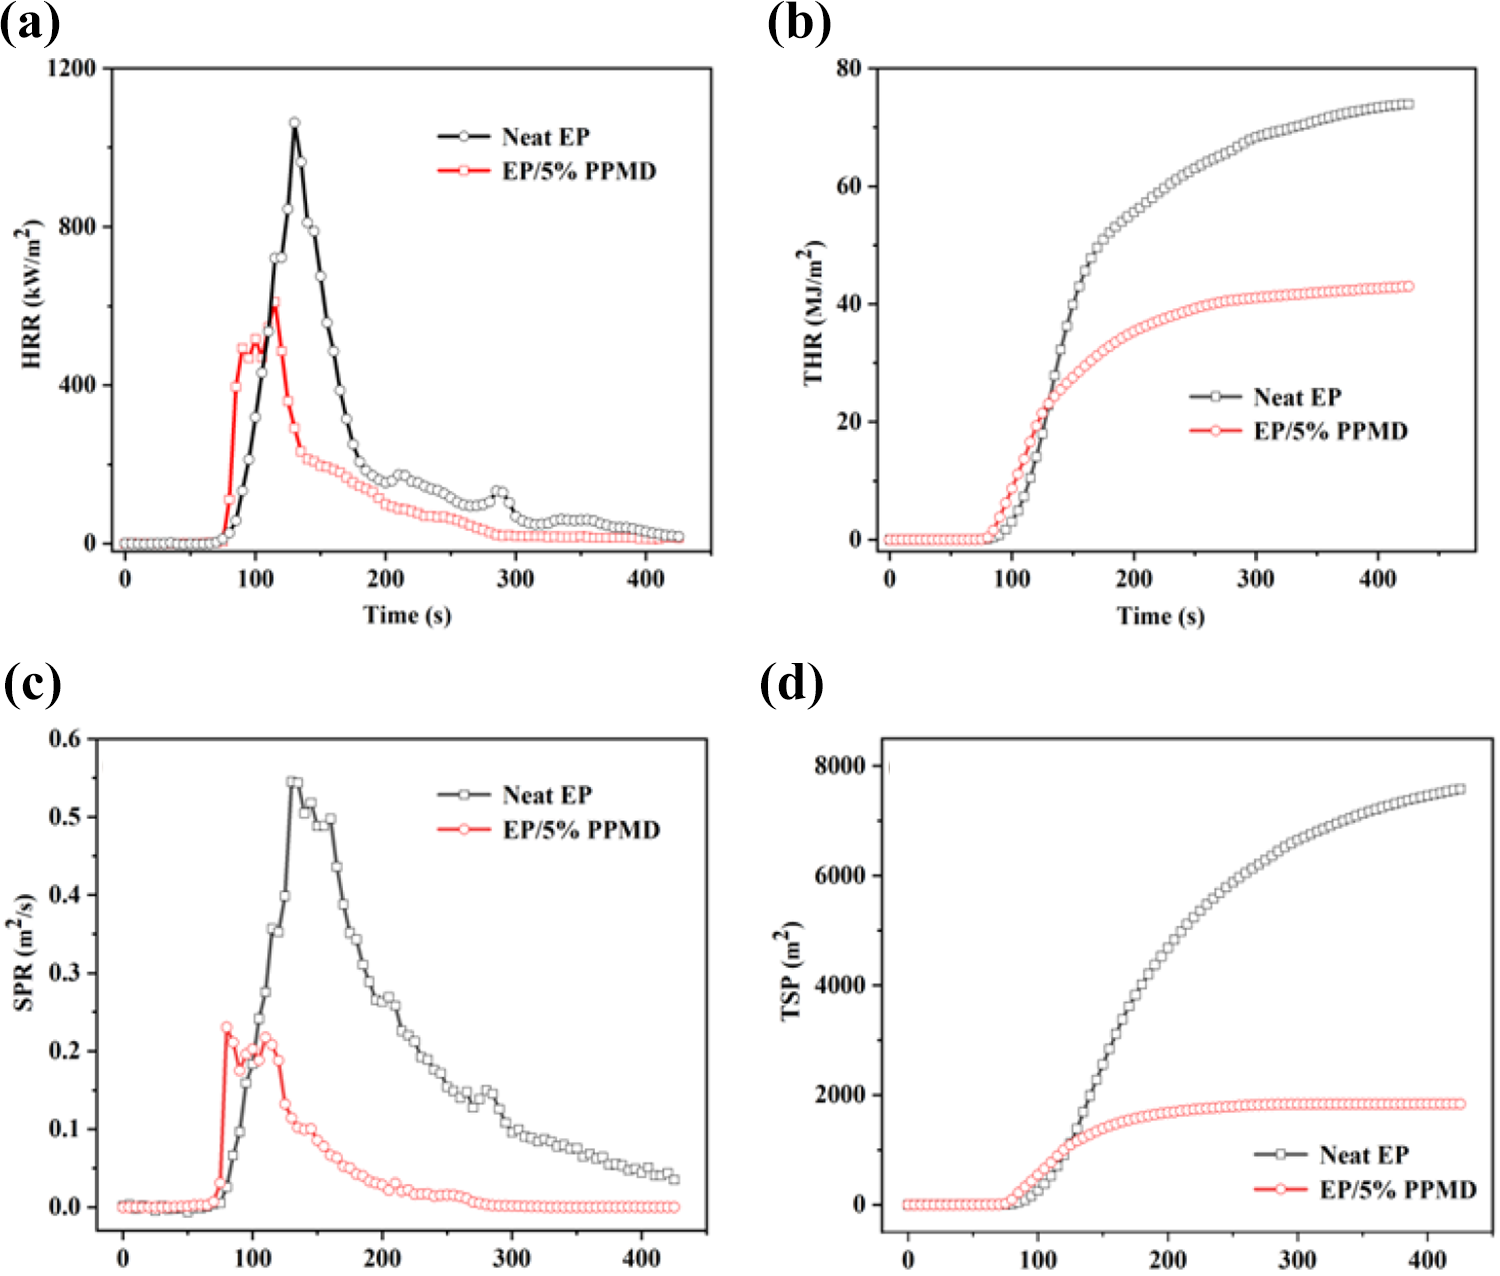
The curves of (a) HRR, (b) THR, (c) SPR and (d) TSP of EP and EP/5% PPMD.
CC test results of pure EP and EP/5% PPMD.
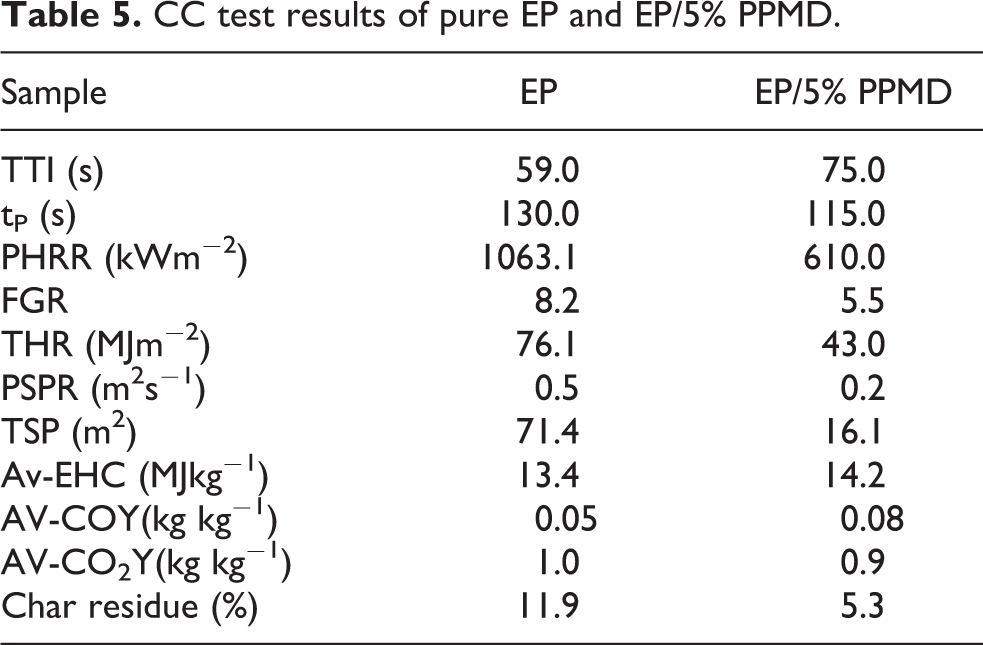
Generally, a lower FGR value meant that the time to flashover was delayed, thereby indicating increased security and adequate time to evacuate. 38 As illustrated in Table 5, the FGR value of pure EP was higher than that of the EP/PPMD samples, indicating that EP/PPMD afforded higher security. Noteworthily, the PSPR and TSP of EP were significantly higher than those of EP/5% PPDM, indicating that PPMD efficiently suppressed the generation of fume by cured EP during the combustion process. 33 Table 5 revealed that the average CO yield (av-COY) of EP/5% PPMD was increased, while the average CO2 production (av-CO2Y) of EP/5% PPMD decreased. Considering that the CC test of EP/5% PPMD was ended in 425 s, these results indicated that PPMD effectively inhibited combustion and reduced the release of the gases.
Char residues analysis
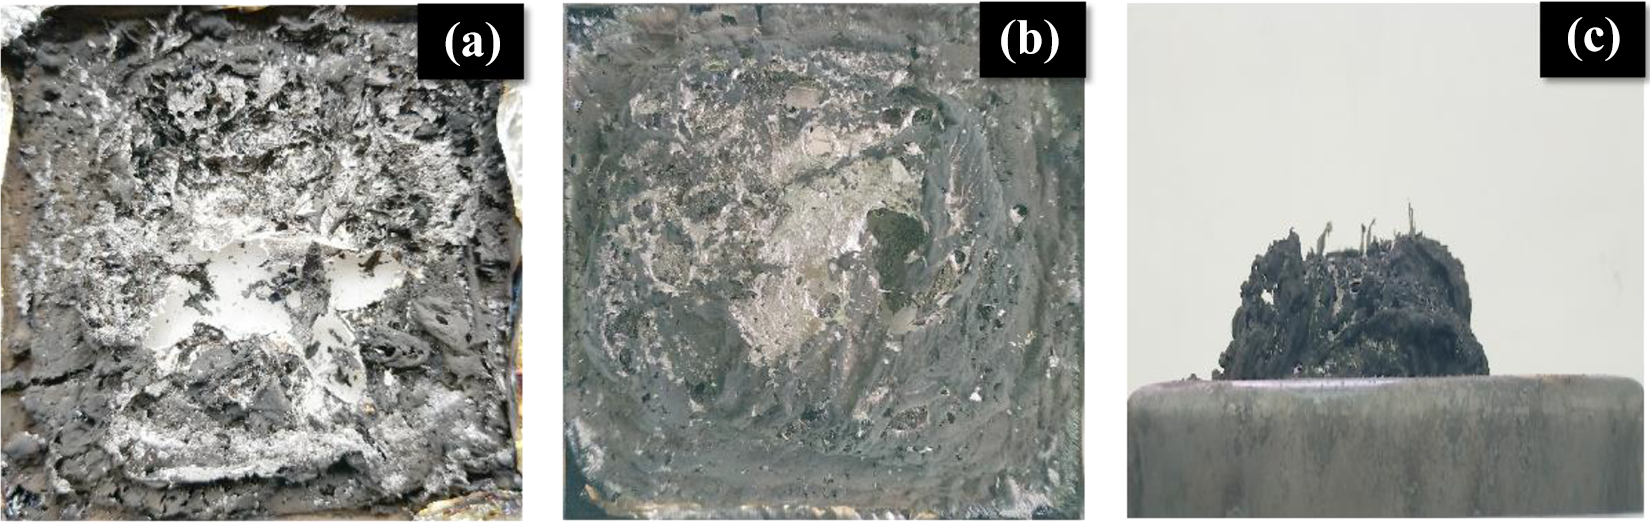
A digital camera and a scanning electron microscope (SEM) were employed to evaluate the morphologies of the char residues for EP/5% PPMD. The pure EP was nearly burnt out, and a small amount of desultory cokes with a thickness of 0.5 cm was left, while the residue of EP/5% PPMD was an intumescent and continuous coke. As shown in Figure 10(c), the thickness of the residue form EP/5% PPMD was 5.1 cm, which was 10 times of thickness of the residue from the control group.

Digital image of residue for EP (a) and EP/5% PPMD (b and c).
The SEM photographs of EP and the EP/5% PPMD char residues were showed in Figure 11. The residual carbon of pure EP possessed a discontinuous structure on the outer surface, while the char residue of EP/5% PPMD39,40 was smooth and continuous, with some holes on the surface. This structure was expected to be a barrier to prevent further combustion.
SEM images of the external coke residues of EP (d to f) and EP/5% PPMD (a to c).
As illustrated in Figure 12, the characteristic absorption peaks of char the residue of EP/5% PPMD were observed at 1106 cm−1, 1237 cm−1, 1507 cm−1, and 1607 cm−1. The C=C bond of the aromatic compound exhibited a characteristic peak around 1607 cm−1. Compared with the IR spectrum of the EP thermosetting material combustion residue, the peak at 1237 cm−1 was the characteristic absorption peak of combustion residue of the EP/5% PPMD thermoset, caused by vibrations of the P=O and P–O–C bonds. 41 Moreover, the absorption peak of the C–P bond was appeared at 1507 cm−1. 42 These results indicated that the graphite-like complex and organophosphorus compound were the main products of the char residue of EP/5% PPMD, which were crucial to its stability and compactness.
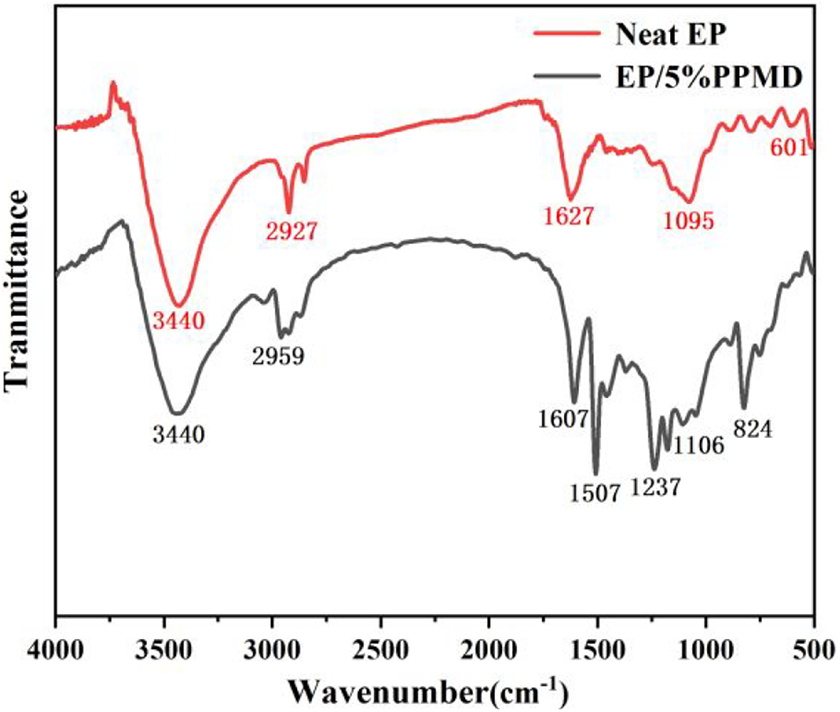
FTIR spectrum of the char residues for EP and EP/5% PPMD.
The C1s, O1s, P2p and N1s XPS spectra of the EP/5% PPMD thermoset residue after combustion were shown in Figure 6. In the C1s spectrum, the absorption peaks of the residues of neat EP and EP/5% PPMD thermosets after combustion were observed at 284.8 eV due to the superposition of characteristic absorption peaks. For example, characteristic absorption peaks of C–C and C–H bonds were at 284.6 eV, while the characteristic absorption peaks C–O and C–N bonds were at 285.7 eV. 42 The signals of the C=C and C=O bonds were observed at 286.2 eV and 287.7 eV.
As shown in Figure 6(b) and (f), in the N1s spectrum, the signals of the C–N or P–N bonds appeared at 398.6 eV, and the characteristic absorption peaks at 400.5 eV was assigned to the N–H bonds. 43 As shown in Figure 6(c) and (g), the signals of C=O and P=O bonds of EP and EP/5% PPMD residues appeared at 531.7 eV and 531.1 eV, respectively. In Figure 6(c), the peaks at 532.8 eV was assigned to the P–O–P, C–O–C and C–O–P bonds. 44 In Figure 6(d), the signals of P–O and P=O bonds was observed at 133.4 eV and 134.2 eV, respectively, but they were not observed in the control group (Figure 6(h)).
Pyrolysis behavior of EP and EP/PPMD
The flame retardant mechanism in the gas phase referred to the substances that interrupted or delayed the chain reaction behavior of the polymer in the gas phase. In the process of heating, EP and EP/PPMD was decomposed into 16 and 24 substances, respectively and their structures were presented in Table 6. In the pyrolysis of EP, some products were directly generated from the thermost, such CO2 (Peak 1), formaldehyde (Peak 2), acetone (Peak 3), phenol (Peak 4), aniline (Peak 5), 6-methyl-2,3-benzofuran (Peak 6), 4-methylaniline (Peak 7), 4-isopropylphenol (Peak 8) and 4-(prop-1-en-2-yl)phenol (Peak 9),34,35 while the product 4-(1-cumene) phenol (Peak 16), 4-(1-cumene)-2-methylphenol (Peak 17), 4-(1-(4-methoxy)cumene) phenol (Peak 18), 4-(1-(4-hydroxy)cumene) phenol(Peak 19), 4-(6-isopropylbenzofuran) phenol (Peak 20), 1-aniline-N-methyl-4-aniline (Peak 21) and 1-aniline-4-aniline (Peak 22) were ascribed to the recombination of the direct decomposed products. 42 Compared with the pyrolysis of EP, 3-amino-5-methylpyrazole (Peak 10), biphenyl (Peak 11), O-hydroxy-biphenyl (Peak 12), hydrazine (Peak 13), dibenzofuran (Peak 14) and 3-methyl-1-phenylpyrazol-5-ylamine (Peak 15) were detected during the pyrolysis of EP/PPMD and were attributed to the decomposition of PPMD. Phosphorus oxide was not detected in the gas phase and this phenomenon was observed in the studies of Zhu et al. 39 and Liang et al. 43 It was concluded that, phosphorous-containing flame retardants, produced unstable P• and PO• free radicals, which captured radicals or other substances, and further changed into involatile phosphorus oxides during combustion. Ultimately the phosphorus oxides were in the solid-state, and P2p XPS spectrum confirmed this conclusion.
Products in pyrolysis of EP and EP/5% PPMD.
Conclusion
In this work, a novel flame retardant PPMD was successfully designed and synthesized from phosphaphenanthrene and phenylpyrazole. The flame retardant performance tests revealed that the incorporation of 5 wt% PPMD into EP made it possible for thermost pass the UL-94V-0 test and obtain an LOI value of 32.5%. Compared with that of pure EP thermost, pHRR, av-EHC, THR, TSP, and PSPR values of EP/5% PPMD reduced significantly, indicating that PPMD effectively inhibited the combustion of EP and reduced the release of smoke. The flame retardant mechanism of EP/PPMD was explored through the analyses of the char residues and the pyrolysis of PPMD. It was concluded that the flame retardant mechanism of PPMD on EP was the effect of the bi-phase. Due to its outstanding flame retardancy and excellent compatibility with EP, EP/PPMD exhibited simultaneous transparency and flame retardancy, thereby exhibiting extensive applications in the fields of art, special coatings, and the production of LED.
Supplemental material
Supplemental Material, sj-pdf-1-hip-10.1177_0954008321992412 - A transparent and intumescent phosphaphenanthrene/phenylpyrazole-containing epoxy resin system and its flame retardancy
Supplemental Material, sj-pdf-1-hip-10.1177_0954008321992412 for A transparent and intumescent phosphaphenanthrene/phenylpyrazole-containing epoxy resin system and its flame retardancy by Zijin Luo, Zhe Chen, Jun Wei, Dongchao Wang, Han Chen and Rui Chen in High Performance Polymers
Footnotes
Declaration of conflicting interests
The author(s) declared no potential conflicts of interest with respect to the research, authorship, and/or publication of this article.
Funding
The author(s) disclosed receipt of the following financial support for the research, authorship, and/or publication of this article: This work was supported by Hubei Provincial Science and Technology Department (2018ACA158) and Anhui Provincial Department of Education (KJ103762015B17 and KJ103762015B18).
Supplemental material
Supplemental material for this article is available online.
References
Supplementary Material
Please find the following supplemental material available below.
For Open Access articles published under a Creative Commons License, all supplemental material carries the same license as the article it is associated with.
For non-Open Access articles published, all supplemental material carries a non-exclusive license, and permission requests for re-use of supplemental material or any part of supplemental material shall be sent directly to the copyright owner as specified in the copyright notice associated with the article.