
Abstract
In this work, a series of polylactic acid/thermoplastic polyurethane/polyaniline (PLA/TPU/PANI) blends with different weight ratios were prepared by Fused deposition molding First, six groups of PLA/TPU (U9A1/U8A2/U7A3/U6A4/U5A5/U4A6) and three groups of PLA/TPU/PANI (821/823/825) with different ratios were fabricated by melt blending. Then, the effects of different filament forming and printing process parameters on print resolution and quality were investigated. Next, printed samples were characterized by Fourier transform infrared (FTIR), Thermogravimetric analysis (TGA), Scanning electron microscopy (SEM) and mechanical experiments. The results of FTIR and TGA showed no chemical reaction between different components, and uniform distribution of the material was observed in the SEM. The tensile and compressive curves of the samples showed an inverted U-shape. Finally, the shape-memory property was evaluated by differential scanning calorimetry. For PLA/TPU blends, U8A2 had the best shape memory capability (
Keywords
Introduction
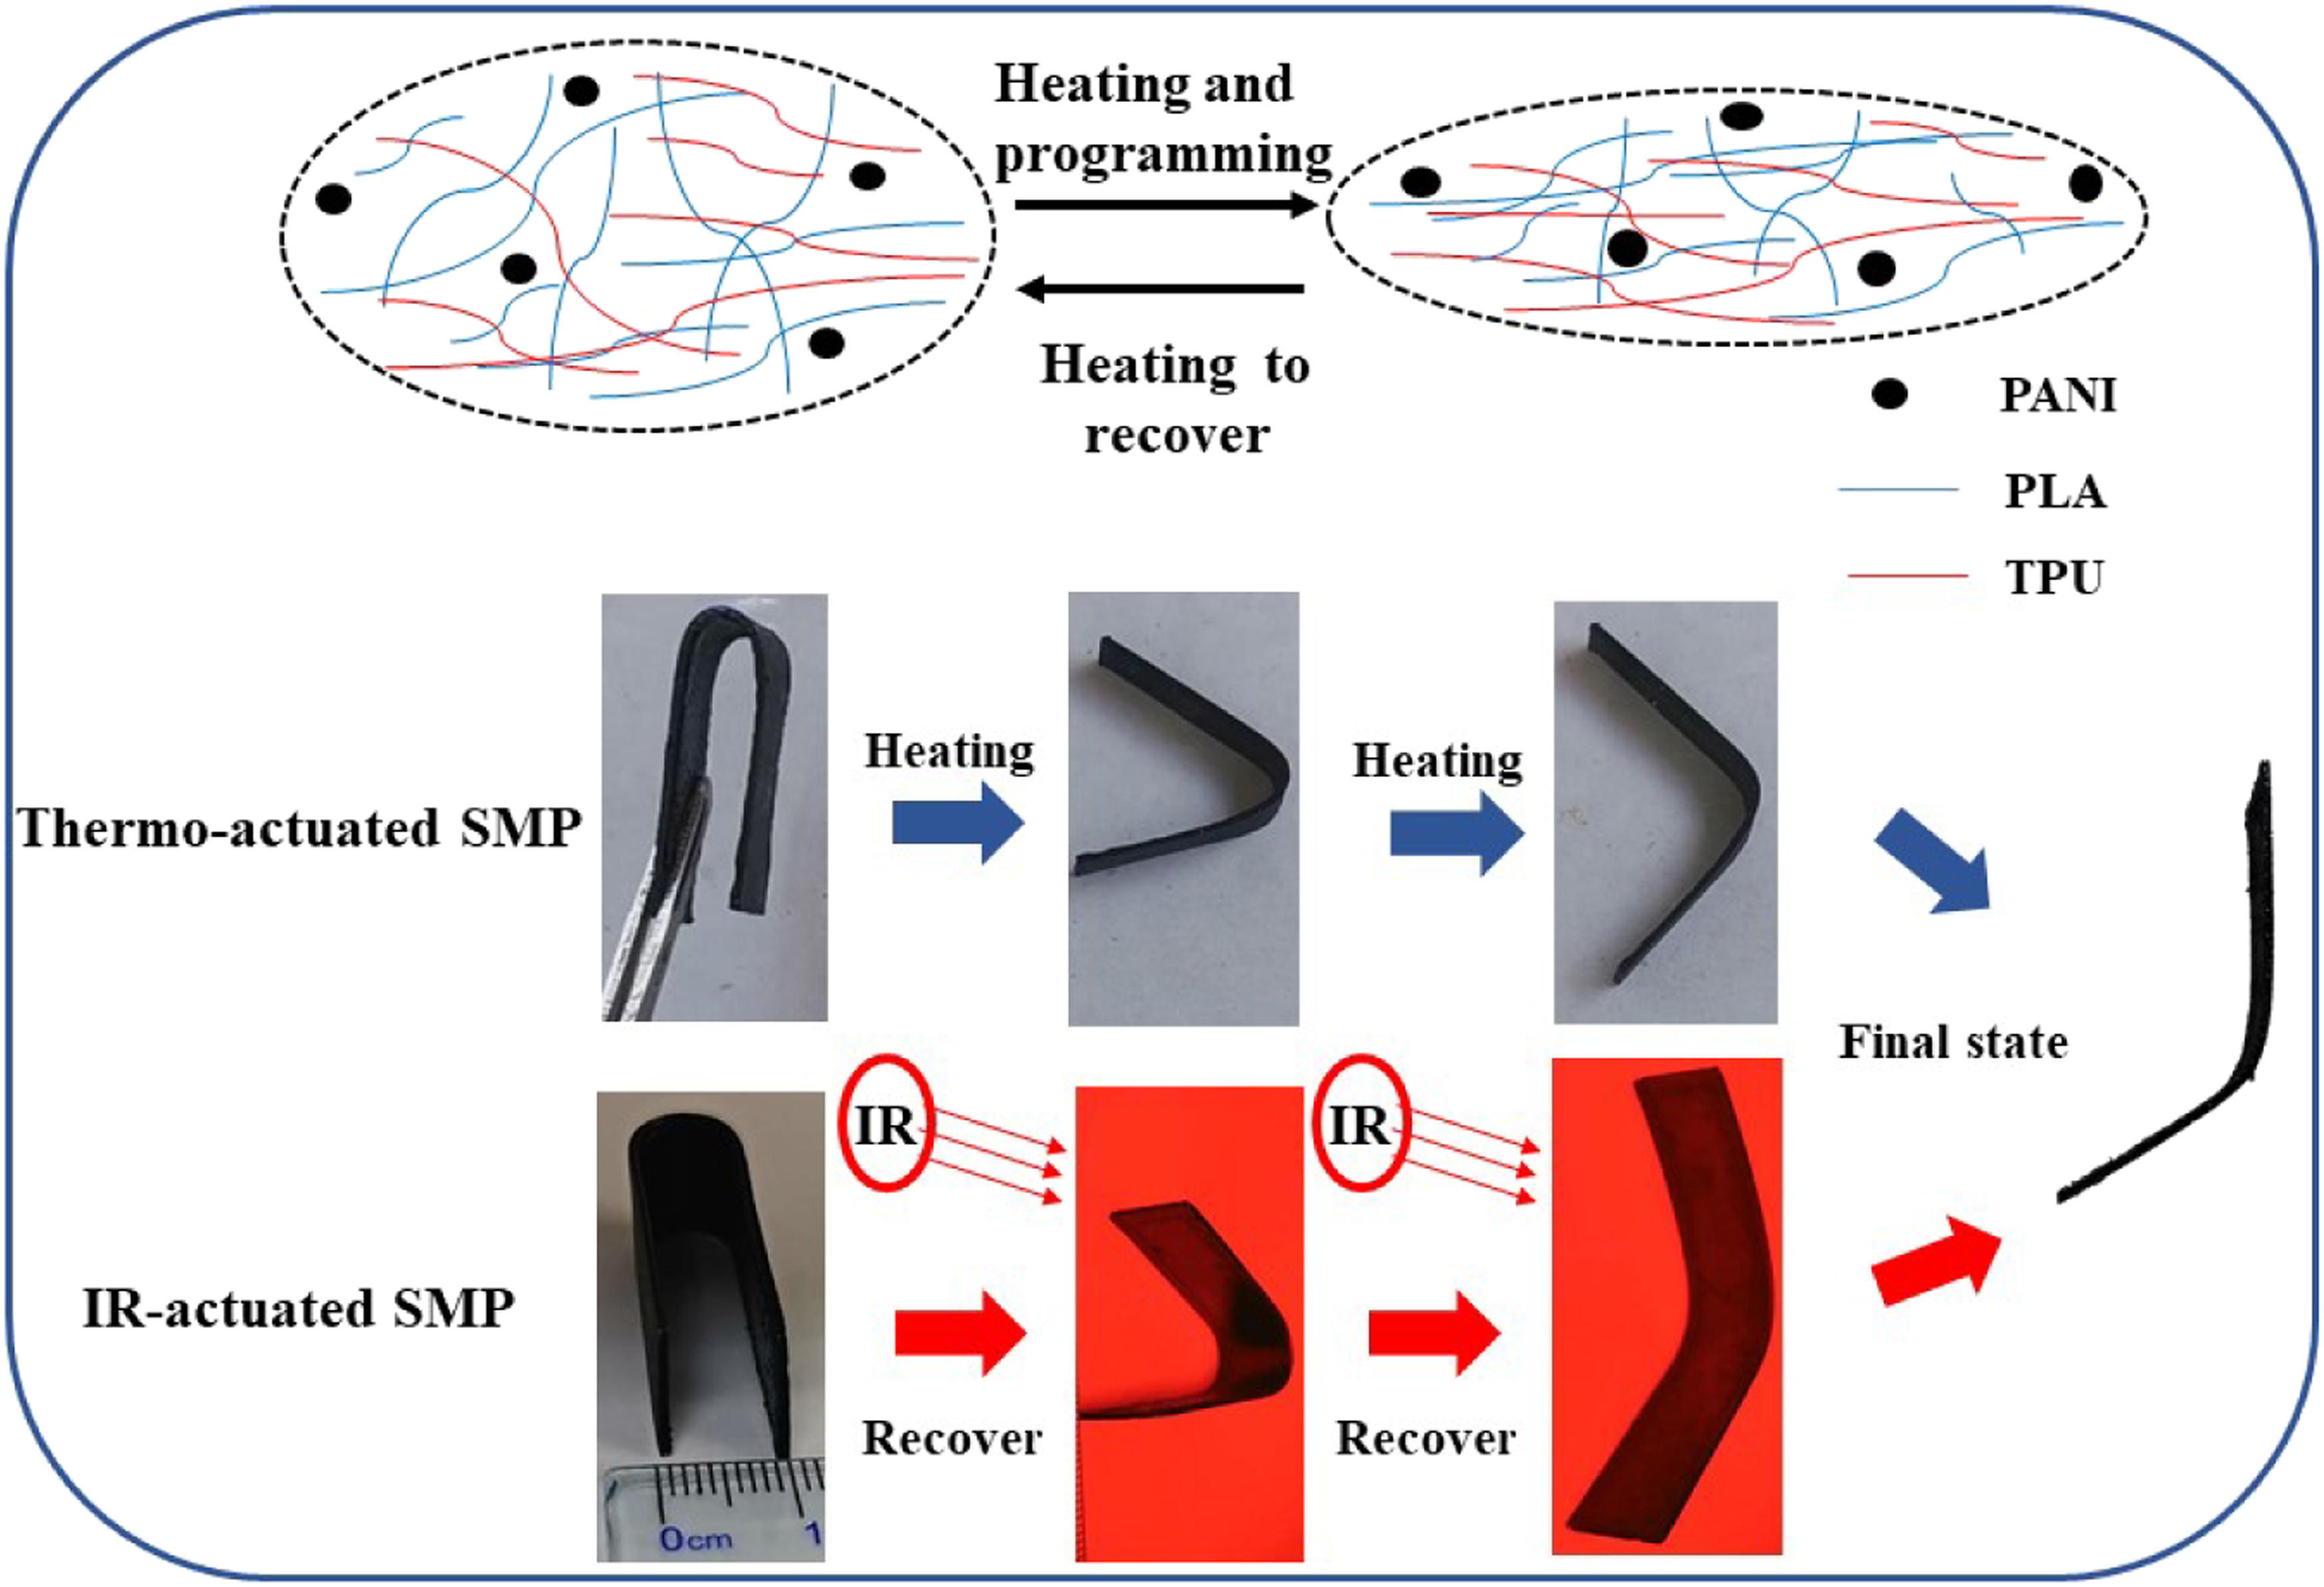
Intelligent materials, especially shape memory polymer composites (SMPC), can recover the state from programmed conditions to the initial situation under a specific stimulus. According to the shape memory actuation method, SMPC can be categorized into thermal responsive, 1 light-actuated, 2 electrical-driving, 3 magnetized-stimulating, 4 PH-incentive 5 and water-triggered, 6 and so on. The thermal responsive SMPC is the most familiar due to the easy manipulation, such as constructing the warm environment via direct heating (warm water 7 ) or indirect heat transfer (Joule heat 8 and light irradiation warming 2 ). Joule thermal triggering usually requires that the material be electrically conductive and equipped with the appropriate power supply and wires, which is a tedious process. The photothermal SMPC should have the photothermal conversion ability and a photo source that emits specific wavelengths of light. 2 In addition, photo stimulation has the advantages of fixed-point transformation and remotely controllable deformation. 9 Therefore, this paper will focus on photothermal-driven SMPC.
Additionally, structure is essential for the optimum use of photosensitive materials. The commonly fabricating methods include injection molding,
10
compression,
11
electrospinning
12
and 3D printing,
13
etc. Among these, 3D printing can manufacture structures with complex shapes, it has high molding accuracy and fast printing speed. Fused deposition molding (FDM) is a widely used 3D printing technology, which has the advantages of low equipment price, easy operation, and a wide range of material sources.1,7,14 Such as polylactic acid (PLA) is the most common material and generally originates from renewable plant starch, cassava, etc. Besides, as a shape memory material, PLA has weak shape memory properties (
Therefore, the fabrication of PLA and TPU composites is a solution. So far, scholars have investigated the shape memory behavior of PLA/TPU blends under different pre-deformation temperatures 16 and annealing effects 17 by varied preparing processes.18,19 However, both PLA and TPU do not have the photothermal conversion ability. Thus, the photothermal conversion agents need to be added to the matrix to impart them with the photo-driving shape memory properties. Based on the previous report, 2 photothermal conversion materials include carbon-based materials (i.e. graphene, graphene oxide (GO), carbon nanotube (CNT), and carbon black), metal nanoparticles, and noble metals (gold and silver), polydopamine (PDA), polypyrrole (PPy), polyaniline (PANI), dyes, rare earth, etc. And researchers have added CNT, 20 carbon nanofiber, 21 montmorillonite, 22 PPy, 23 and GO 24 into PLLA/TPU blends and explored their shape memory behavior. However, as fillers, they are either expensive or complicated to fabricate. Polyaniline is a conductive material with infrared thermal conversion properties, good biocompatibility, and low price. Wibowo et al. 25 studied 3D printed PCL/PANI electroactive scaffolds for bone tissue engineering, Min-Su Heo et al. 26 explored the near-infrared light-responsive shape memory polymer properties from maleated polyolefin elastomer and PANI. But few studies were about the dual-drive shape properties and FDM technology based on PLA/TPU/PANI blending (or 4D printing 27 ). Commonly, 4D printing is based on the traditional 3D printer and intelligent materials (such as shape memory materials) to fabricate structures which can change form or function after giving specific stimulus.
Therefore, this work focuses on the properties of the PLA/TPU/PANI composites under different mass ratios. The main research contents include filament-forming parameters, 3D printing process parameters, thermal properties (thermogravimetric analysis (TGA), fourier transform infrared (FTIR), differential scanning calorimetry (DSC)), mechanical properties, microscopic phase distribution and dual-driving shape memory effects.
Experimental section
Materials
Thermoplastic polyurethane powder (Texalan 385A, Mw = 50,000 g/mol, particle size less than 45 μm) was purchased from Austin Novel Materials Technology (China), and PLA powder (Mw = 50,000 g/mol, particle size less than 35 μm) was purchased from Dongguan xingwang Plastic Raw material Co., Ltd. (China), and PANI powder (Mw = 60,000 g/mol, particle size less than 30 μm) was purchased from Anhui Kuer Biological Engineering (China). All materials are used directly without any other treatment.
Filament preparation of TPU/PLA and TPU/PLA/PANI blends
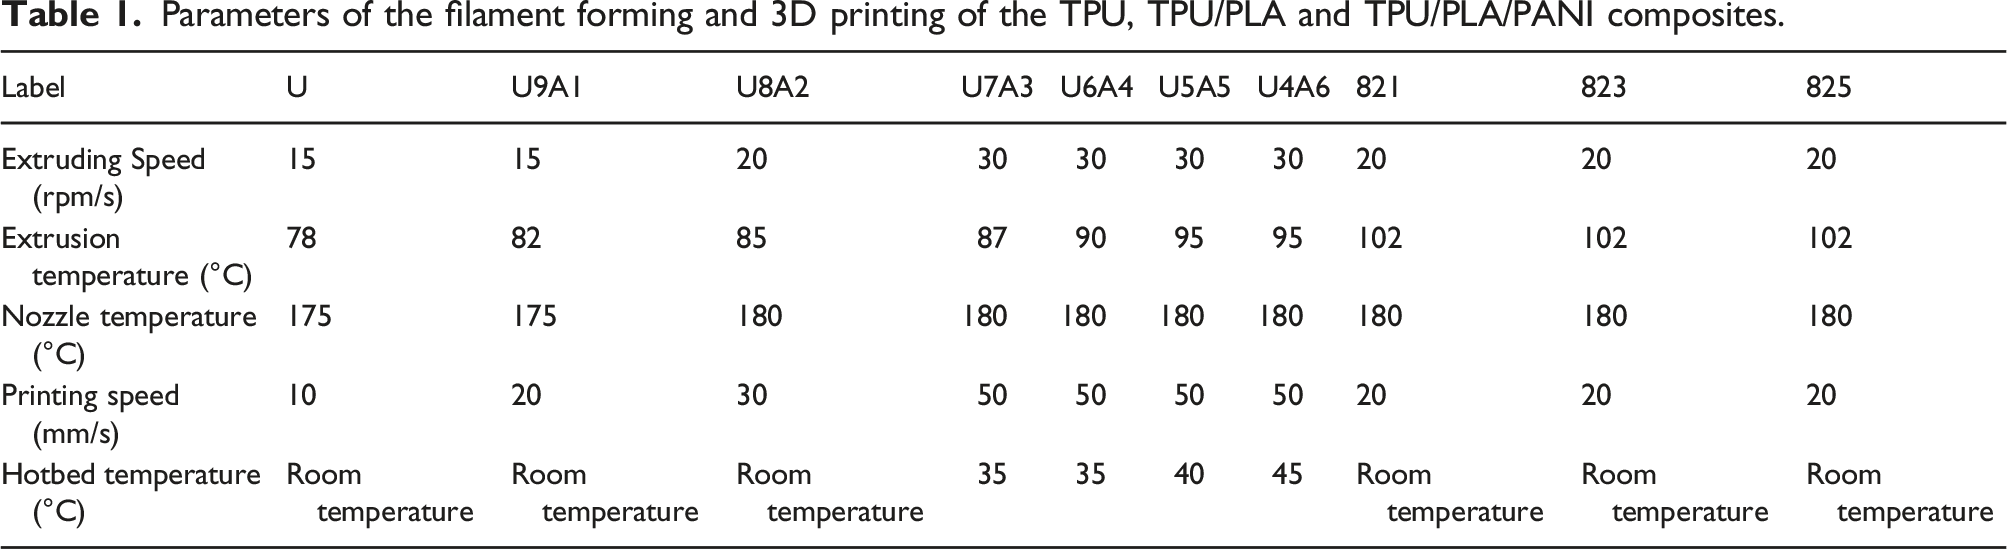
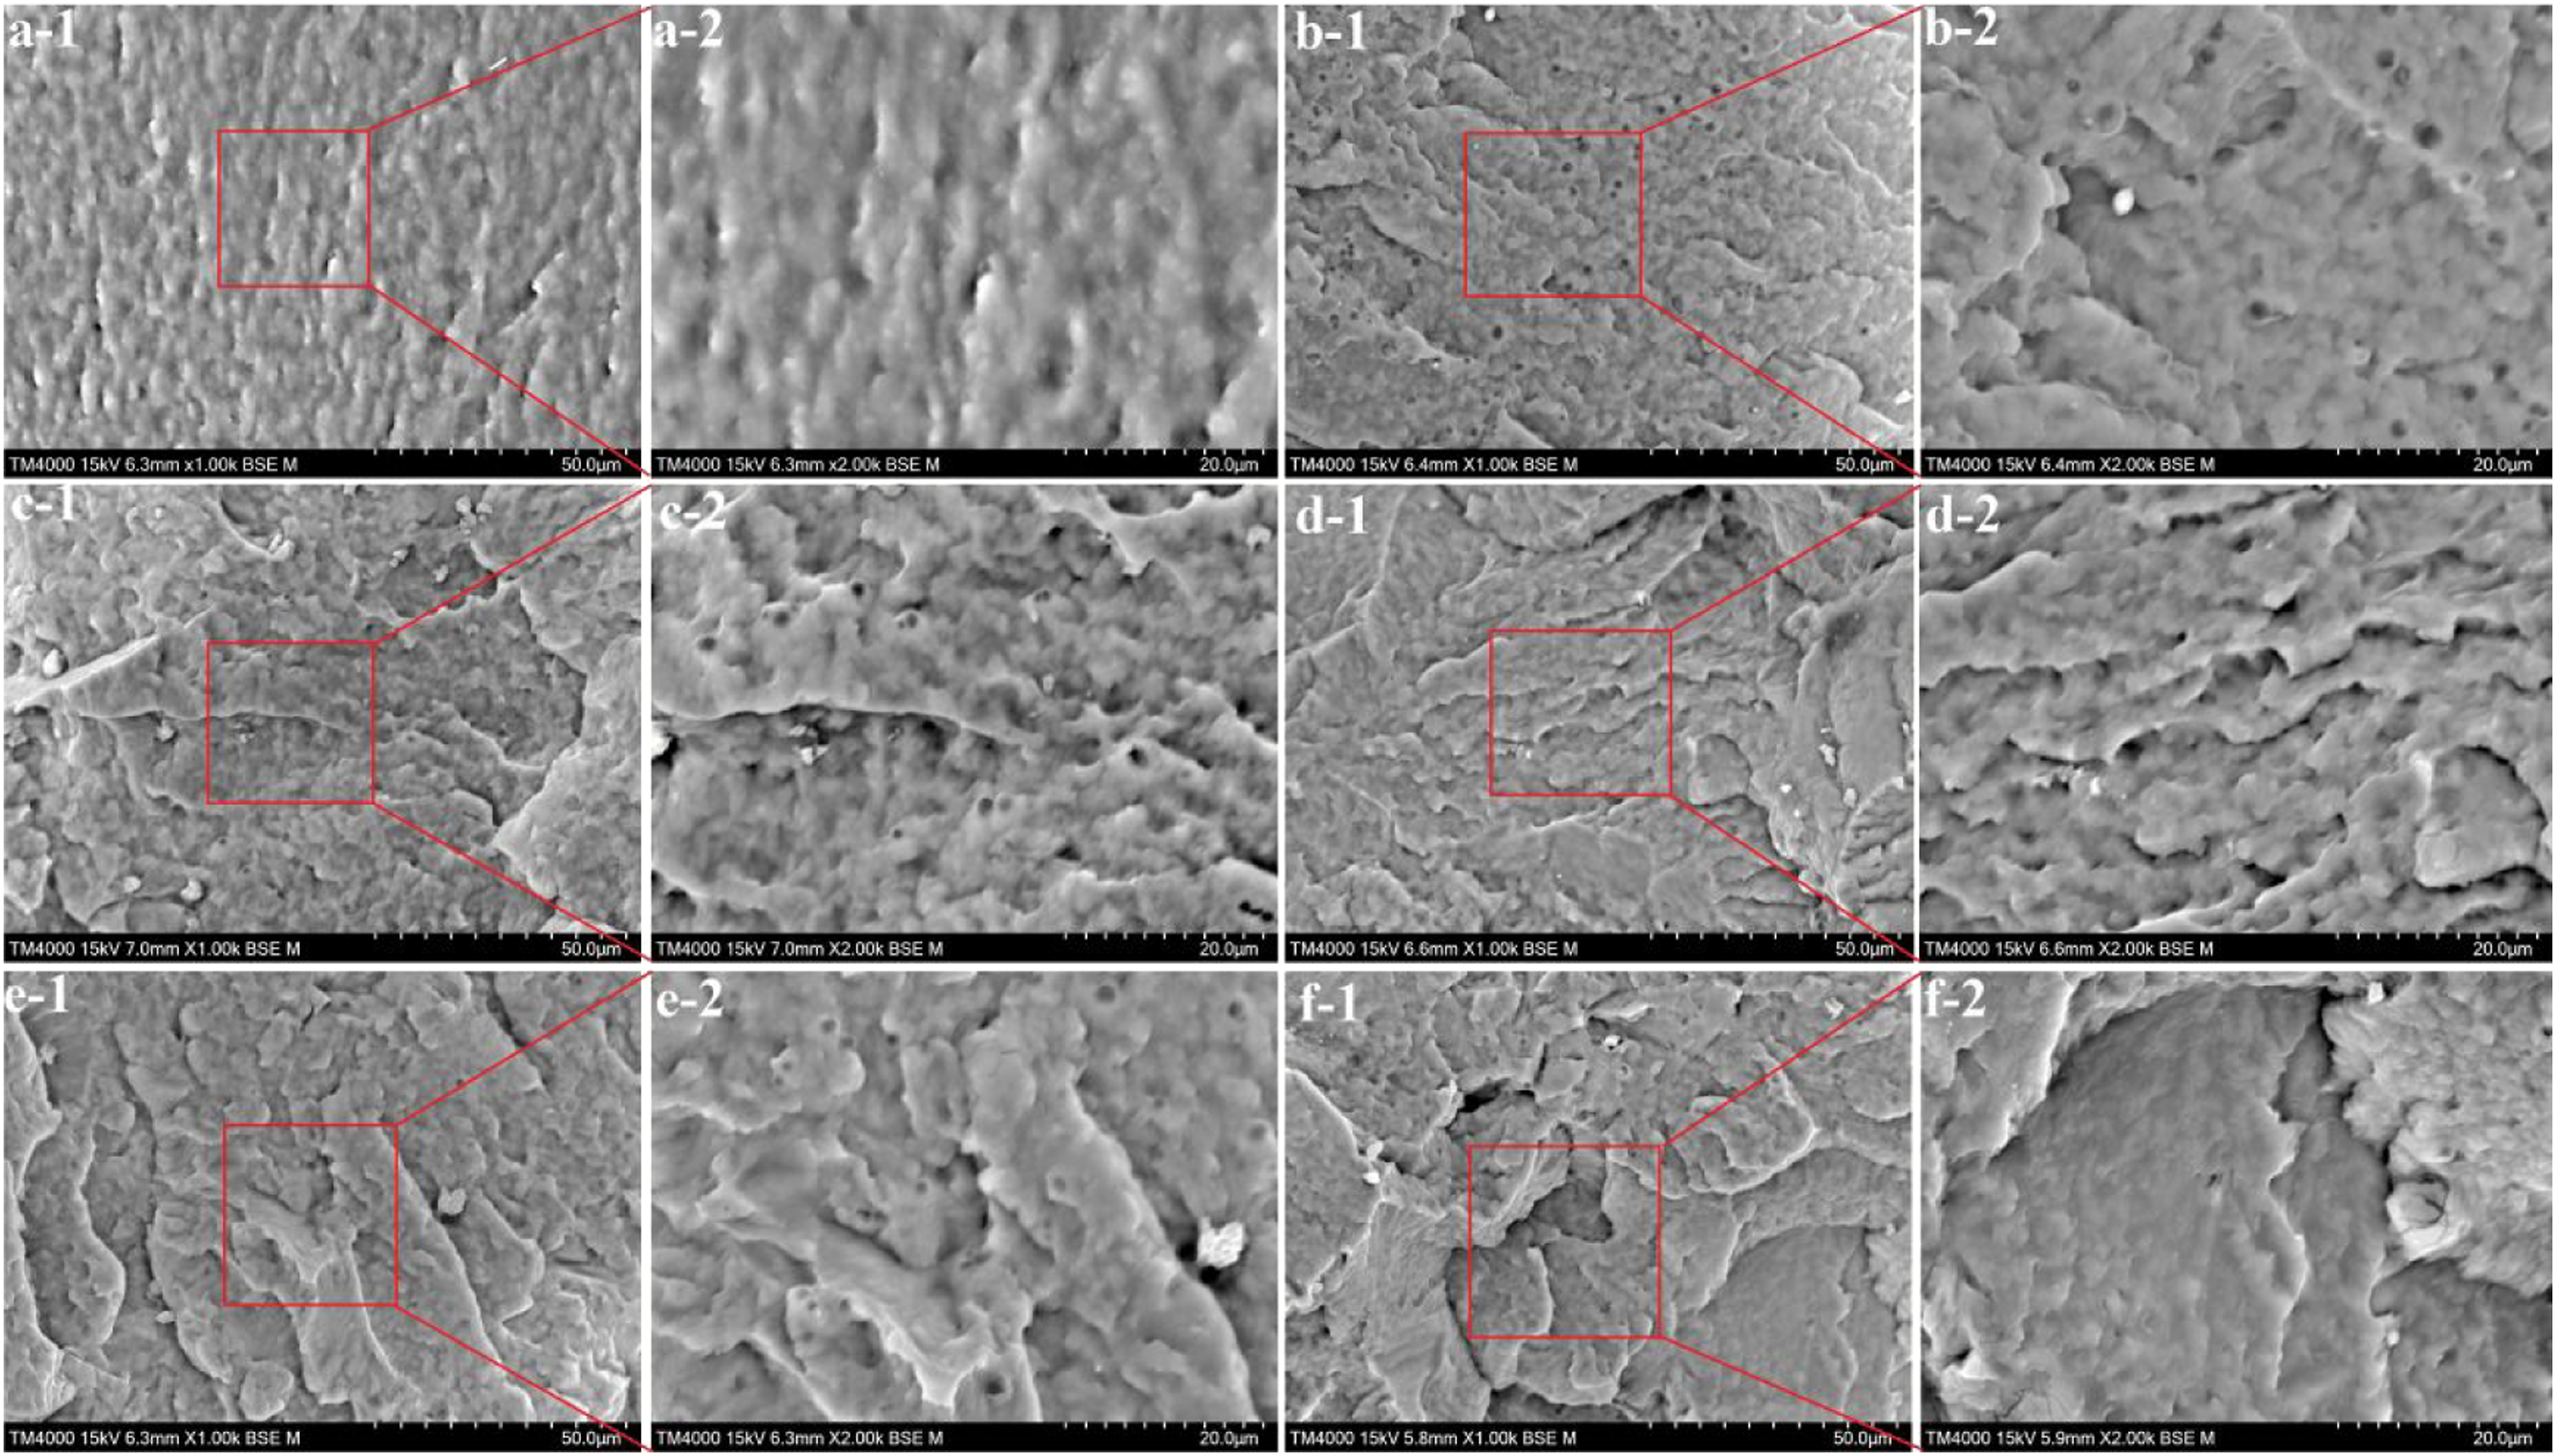
Thermoplastic polyurethane/polylactic acid composites were prepared by mixing different ratios of PLA with TPU as the base material. Here, six TPU/PLA blends were prepared and named UxAy for simplicity, where U represents TPU, A represents PLA, x and y is the weight ratio of the two materials (i.e. U9A1 means the weight ratio of TPU and PLA is 9:1). The PLA and TPU were dried in a vacuum oven for 48 h before mechanical mixing, and then the composite filaments were prepared by an extruder (Figure 1(a)). Table 1 shows the forming parameters. Afterward, three TPU/PLA/PANI composite filaments (i.e. 821, 823, and 825, Figures 1(a)–7) were fabricated by selecting the best formulation (U8A2) as the base material. The numbers of the blends represent the weight content of PANI in the TPU/PLA/PANI blends of 1%, 3% and 5%, respectively, and the detailed information is in “Results and Discussion” (Table 1). (a) Prepared composites filament. (b) 3D printing process with masking tapes. (c) 3D printed samples. Parameters of the filament forming and 3D printing of the TPU, TPU/PLA and TPU/PLA/PANI composites. Thermogravimetric analysis analysis results: (a) The pure thermoplastic polyurethane and neat polylactic acid. (b) thermoplastic polyurethane/polylactic acid composites. Fourier transform infrared results of the pure thermoplastic polyurethane, neat polylactic acid and thermoplastic polyurethane/polylactic acid composites. Mechanical properties of the pure thermoplastic polyurethane and thermoplastic polyurethane/polylactic acid blends: (a) The tensile curves of the pure thermoplastic polyurethane, thermoplastic polyurethane/polylactic acid blends; (b) Flexural curves of the pure thermoplastic polyurethane, thermoplastic polyurethane/polylactic acid blends. Scanning electron microscopy images of the cross-section view of the 3D printed rectangular of the thermoplastic polyurethane/polylactic acid composites: (a-1). U4A6, (b-1). U5A5, (c-1). U6A4, (d-1). U7A3, (e-1). U8A2, (f-1). U9A1, and the (a-2), (b-2), (c-2), (d-2), (e-2), (f-2) are their enlarged graph, respectively. (a) Scanning electron microscopy curve of the pure thermoplastic polyurethane, pure polylactic acid and thermoplastic polyurethane/polylactic acid composites. (b) The shape memory recovery ratio and shape memory fixed rate of pure thermoplastic polyurethane and thermoplastic polyurethane/polylactic acid blends with different compositions. (a) Thermogravimetric analysis analysis. (b) fused deposition molding spectra. (c) Stress-strain curves of 3D printed samples. (d) Mechanical results of flexural tests. TGA results of PLA/TPU composite filaments with different weight ratio.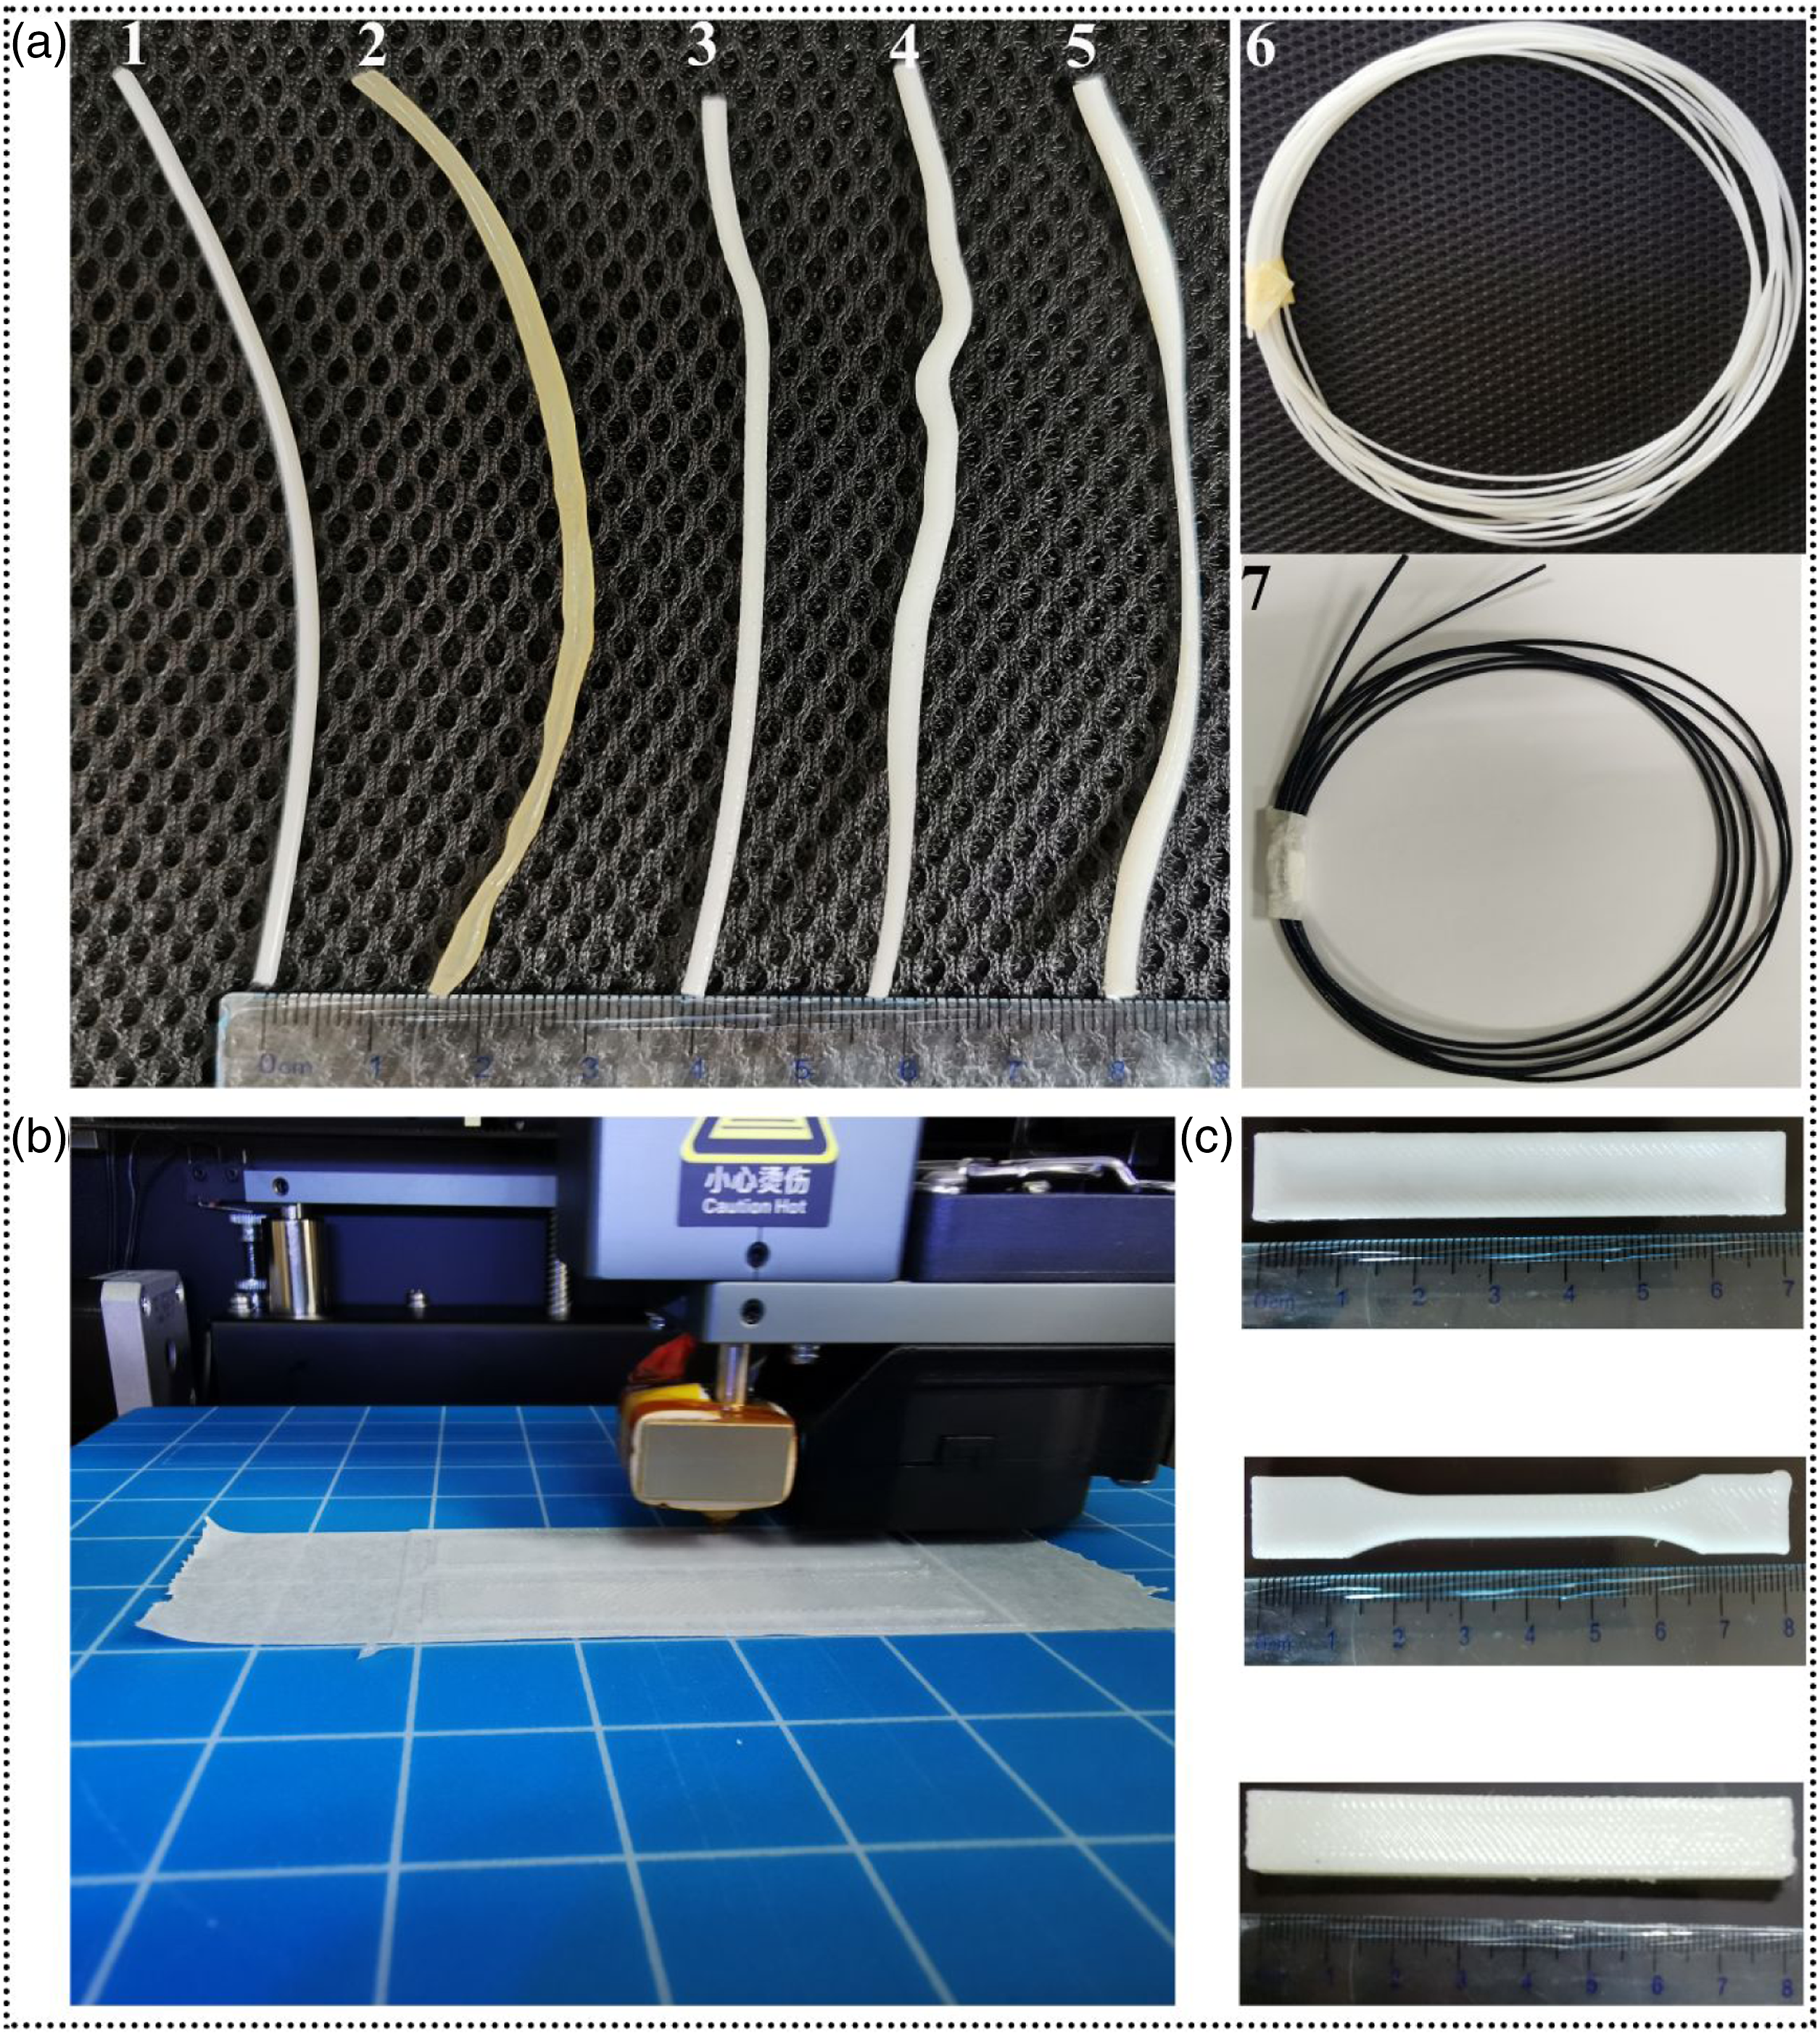
3D printing
Samples were prepared by the Creativity CR2020 printer (Shenzhen Chuangxiang 3D Technology Co. Ltd., China). As shown in Figure 1(b), when printing TPU, U9A1, U8A2 and TPU/PLA/PANI (821, 823, 825) composites, considering the high viscosity of the materials, masking tape was applied to the hotbed to facilitate sample removal. The fill rate was maintained at 100% throughout the 3D printing process, and the detailed printing parameters for both the TPU and PLA/TPU blends are shown in Table 1. Figure 1(c) shows the 3D printed samples used for mechanical, SEM and shape memory tests.
Shape memory testing
Five rectangles (80 × 10 × 0.8 mm3, Figure 1(c)) were printed for each group of materials to measure and average to evaluate the shape memory performance, which contains two parameters, shape memory fixation rate (
Characterizations
TGA testing
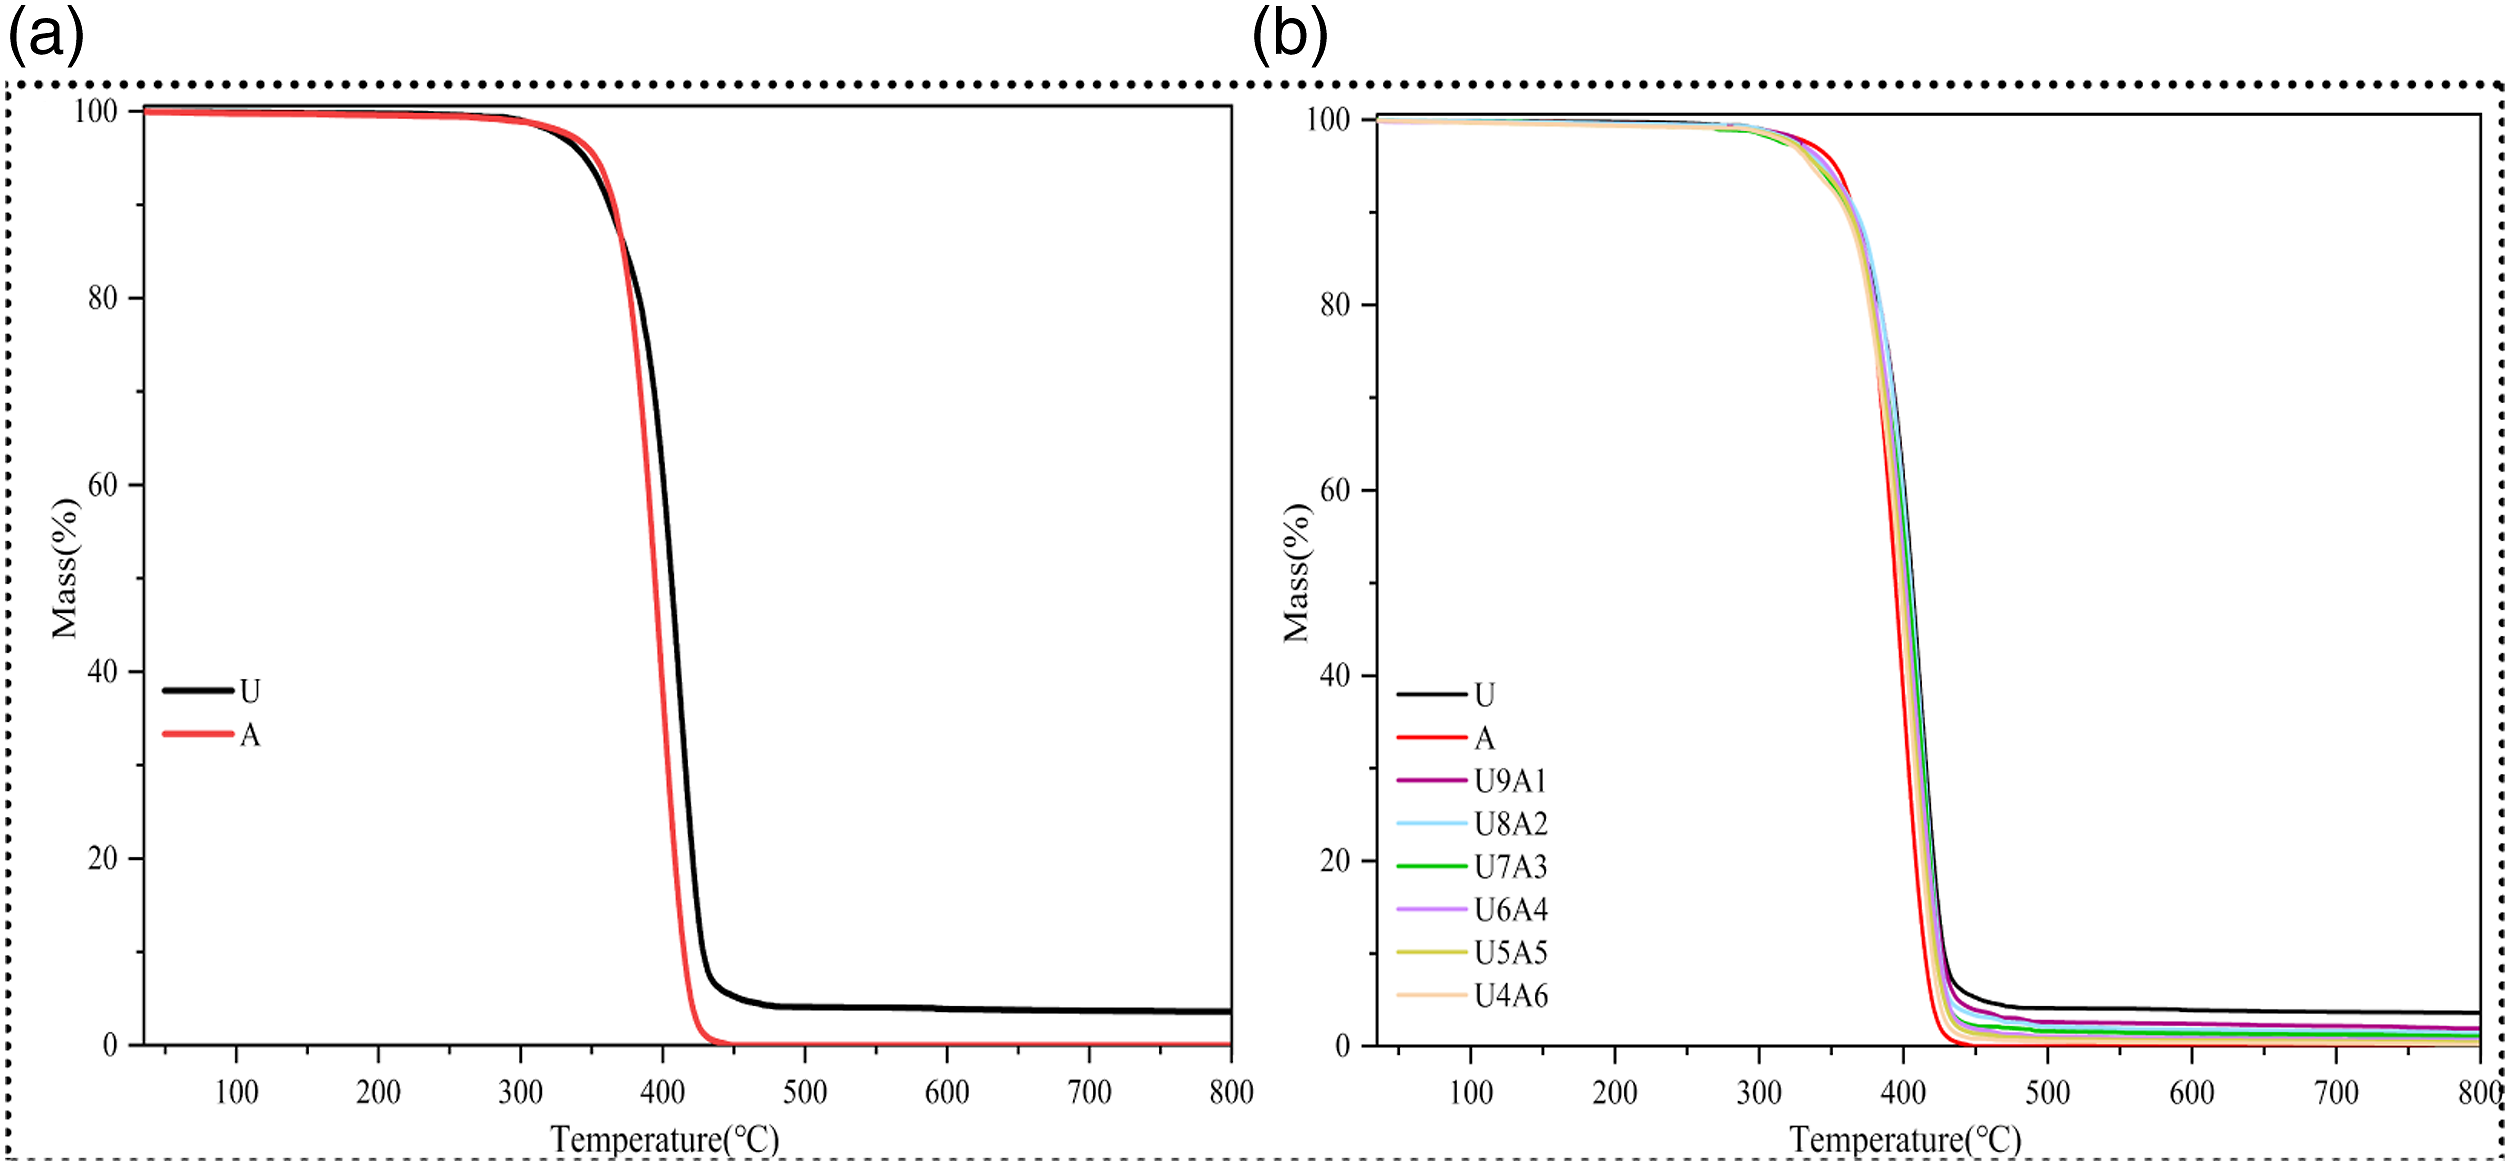
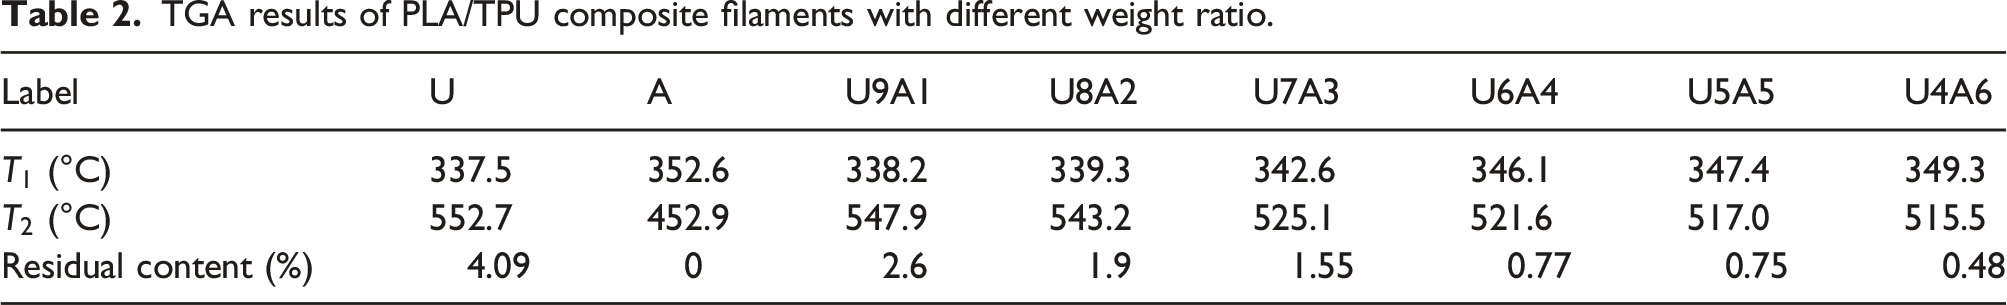
Thermal stability and decomposition temperature of composite filaments were tested in nitrogen atmosphere with a TGA analyzer (STA 449F3TGA, Mettler-Toledo, Germany Netsch). The starting temperature was room temperature and the ending temperature was 800°C, with an increased temperature rate of 10°C/min.
FTIR analysis
The functional groups of the components in the composites were observed by FTIR (Satellite FTIR spectrometer, Mattson) to analyze whether chemical reactions or new substances were formed between the composites (PLA, TPU and PANI). The resolution was set to 4 cm−1 and the scanning range was from 400 cm−1 to 4000 cm−1.
Mechanical measurement
The tensile and bending properties of the samples were tested on an electronic universal testing machine (Wance, ETM504C, Shenzhen, China) with a loading speed of 100 mm/min and 2 mm/min, respectively. Regarding the measurement results, the experimental apparatus directly provides the function of tensile stress-strain curves, compressive load and displacement and a summary of the mechanical properties of the measured sample. In addition, five samples of each material were 3D printed for testing and take the average. Detailed information is provided in “Results and Discussion 3”.
SEM observation
The microtopography of the composites was performed by SEM (HITACHI’s TM4000PLUS) on cross sections of 3D printed rectangular specimens that were prepared via liquid nitrogen fracture and then gold-coated (Hitachi MC1000).
DSC testing
The composites were tested by DSC (DSC214, Germany Netzsch) in the nitrogen atmosphere, 5 mg of each material was placed in an aluminum pan and gas purging at a rate of 40 mL/min. The DSC measurement process consists of three temperature changes, i.e. heating-cooling-heating. The first heating is to eliminate the thermal history, and the second heating curve is used as the final result. The temperature change was set to be room temperature −240°C–−50°C–240°C with a ramp rate of 10.0°C/min. The test results can provide the glass transition temperature (
Results and discussion
PLA/TPU composite filaments forming and 3D printing procedure
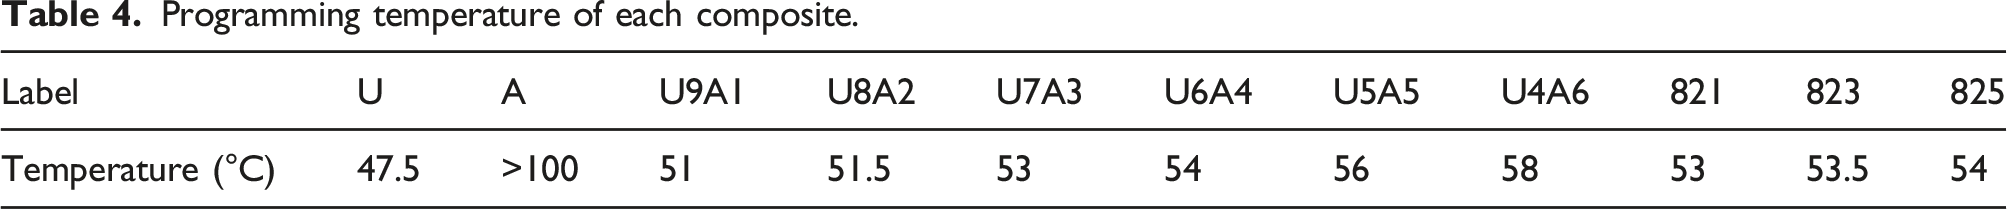
Considering the characteristics of the FDM printing process, the fabricated composite filaments should be strong enough to withstand the forces exerted by the feeding gears to ensure printing smoothly. Commonly, the dimension of the fabricated filament depends on the combination of extrusion temperature, extrusion speed, pulling speed, preload force and cooling method. The extruding temperature generally depends on the melting point of the component materials. An extrusion temperature usually above about 10.0°C than the melting point of all components is usually desirable because high temperature will affect the thermal characteristics of the material, such as yellowing (Figures 1(a) and 2). If the temperature is too low, some of the components are not melted, resulting in a rough surface of the filament (Figures 1(a)–3). At the same time, excessive preload will flatten the filament (Figures 1(a)–4). Besides, insufficient coordination between hauling speed, extrusion velocity, preload force and cooling method can affect the dimensional accuracy of filament (Figures 1(a)–5). In addition, due to the high viscosity of TPU, the filament was not been shaped thoroughly before packaging and was prone to bonding. Therefore, a combination of water cooling and air cooling was chosen to fix the filament shape. Finally, the optimal filament forming parameters of each composite filament were obtained through experimental verification (Table 1), and Figures 1(a) and 6 shows the prepared filaments for subsequent 3D printing research.
Meantime, Table 1 revealed the optimum printing parameters of each material based on the fabricated composite filaments. Among all PLA/TPU composites, due to TPU, U9A1 and U8A2 having high viscosity, the printed samples were attached to the hotbed closely, thus difficult to remove. Therefore, as Figure 1(b) shows, the masking tape was attached to the hot bed before printing TPU, U9A1 and U8A2 composites. Meanwhile, set the hotbed temperature at room temperature to ensure the smooth removal of the sample. Similar to our previous study, 7 when the nozzle temperature is too low during 3D printing, the filament cannot be melted completely, which affects the overall printing fluency. Higher temperatures can impair the quality of the printed structures, such as yellowing, structural collapse, and dimensional inaccuracy. As for the fill rate, printing consumables and printing time are directly proportional to the fill rate, and the lower the fill rate, the faster the heat transfer rate and the shorter the shape memory recovery time. In this work, the fill rate was set to 100% in order to better measure the performance of the 3D printed samples. A low print speed was chosen to improve the print quality, where the previous layer was solidified before depositing the new layer. Based on the optimal printing parameters (Table 1), samples were printed for micromorphological observations, mechanical experiments and shape memory tests.
TGA analysis
Summary of tensile and flexural testing results.
FTIR measurement
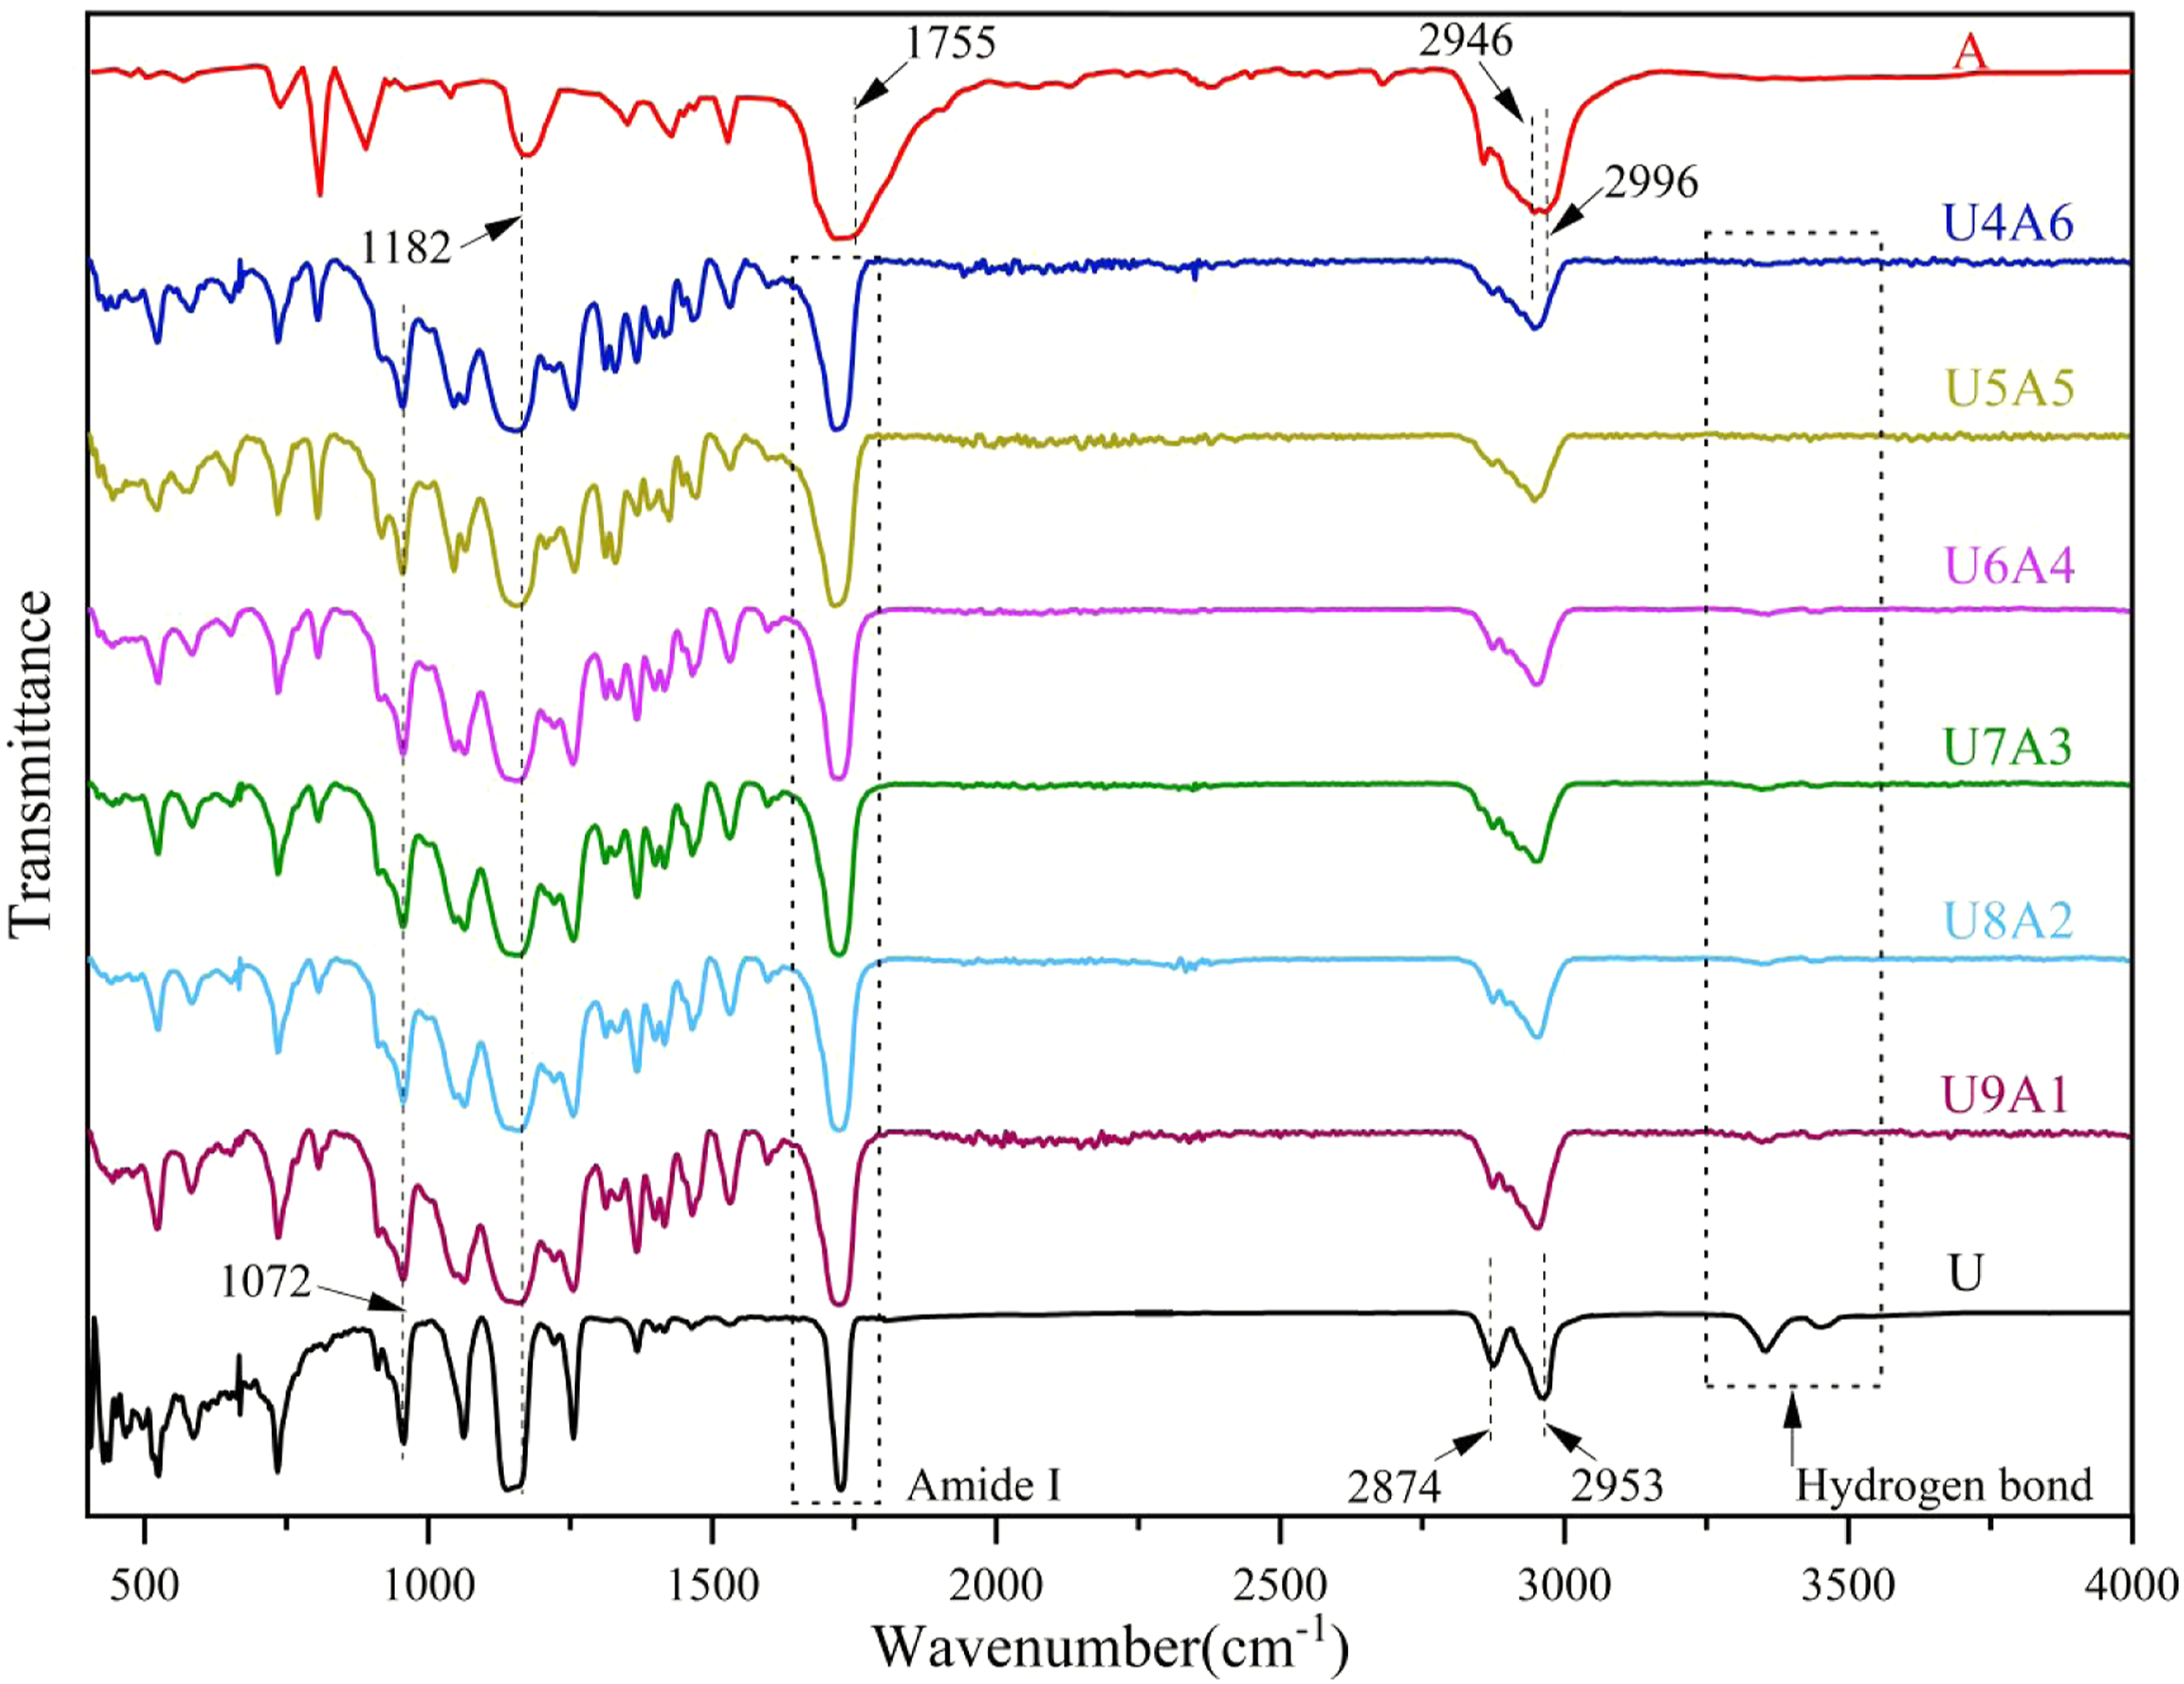
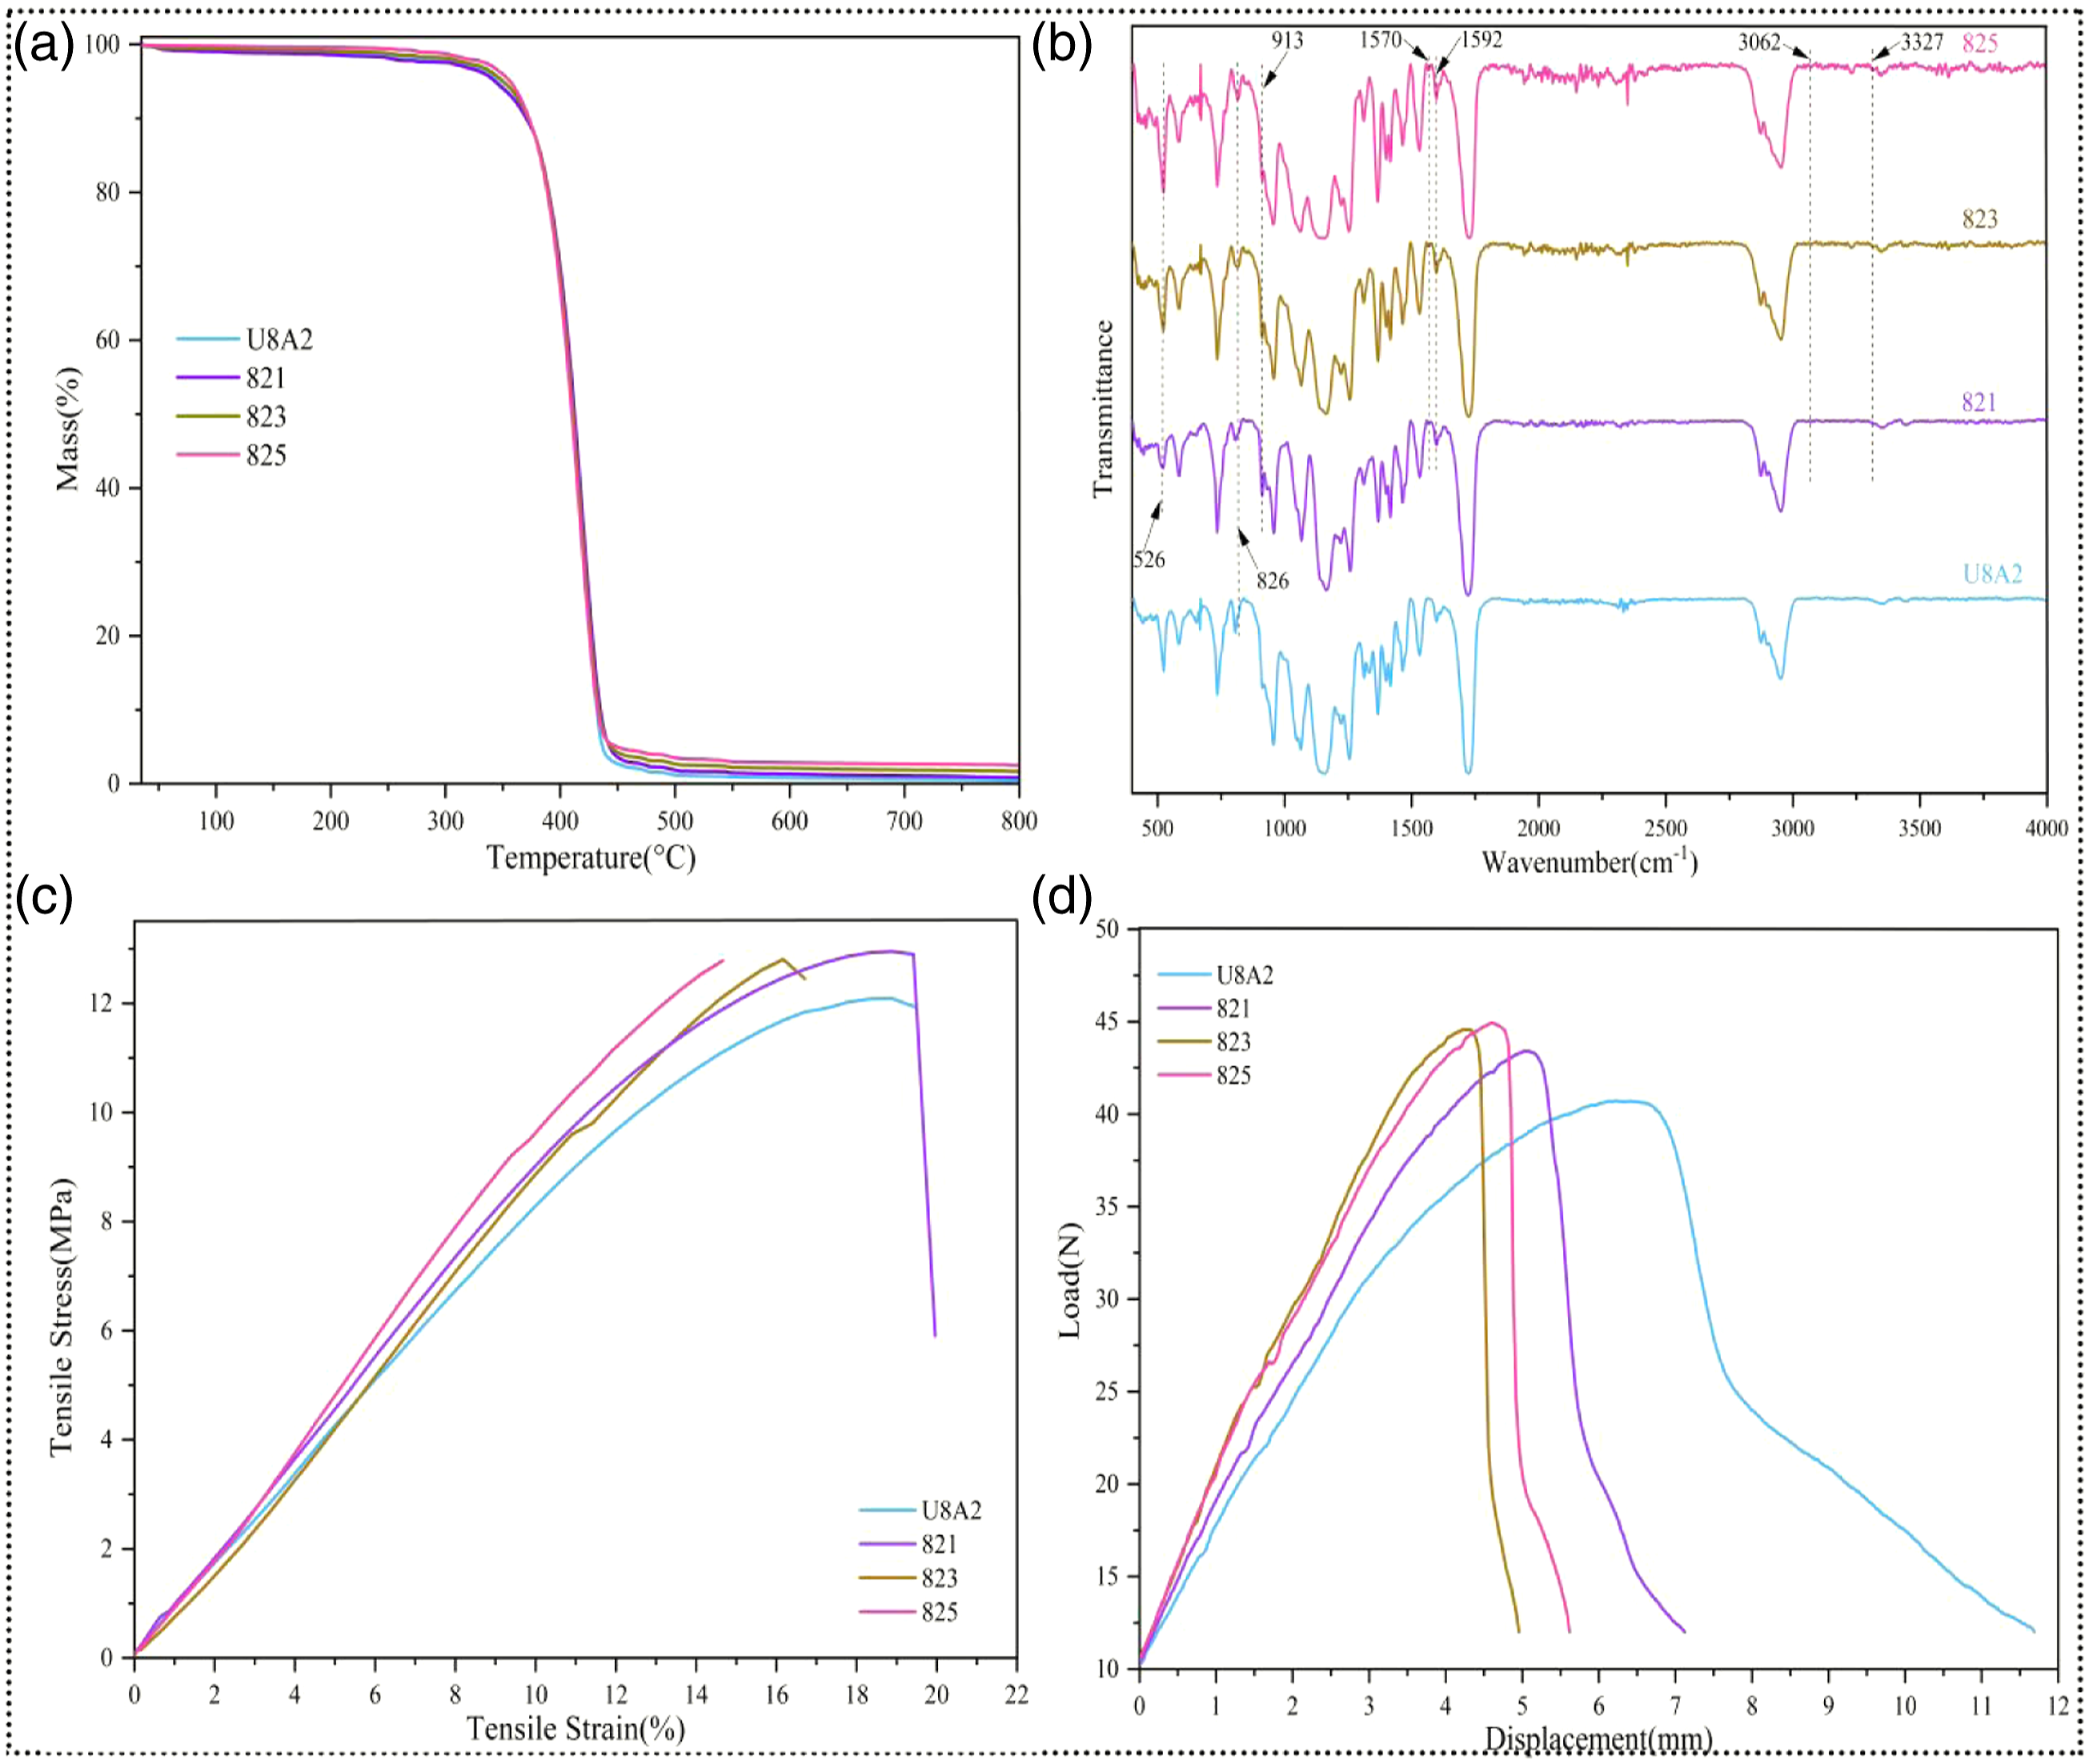
The FTIR analysis spectrums were elucidated in Figure 3 to characterize the chemical structure of samples. For TPU, hydrogen bonding was distributed in the range of 3000–3500 cm−1. The asymmetric and symmetric methylene stretching peaks fell in 3000 ∼ 2800 cm−1, respectively. 1730 ∼ 1700 cm−1 was the hydrogen-bonded urethane groups (amide I), the peak at 1072 cm−1 belonged to C–O–C stretching.28,29 For PLA, 2996 cm−1 and 2946 cm−1 were assigned to the stretching modes of asymmetric and symmetrical C–H bonds, respectively. The stretching vibration of the C = O bond peak located at 1755 cm−1, and 1182 cm−1 corresponds to the stretching of the ether bond. 30 Even though the preparation process experienced high temperatures, no new peaks appeared in FTIR, which indicated that the mixing of TPU and PLA did not produce a chemical reaction, but only a physical mixing, and the results were also consistent with the TGA test.
Mechanical properties measurement
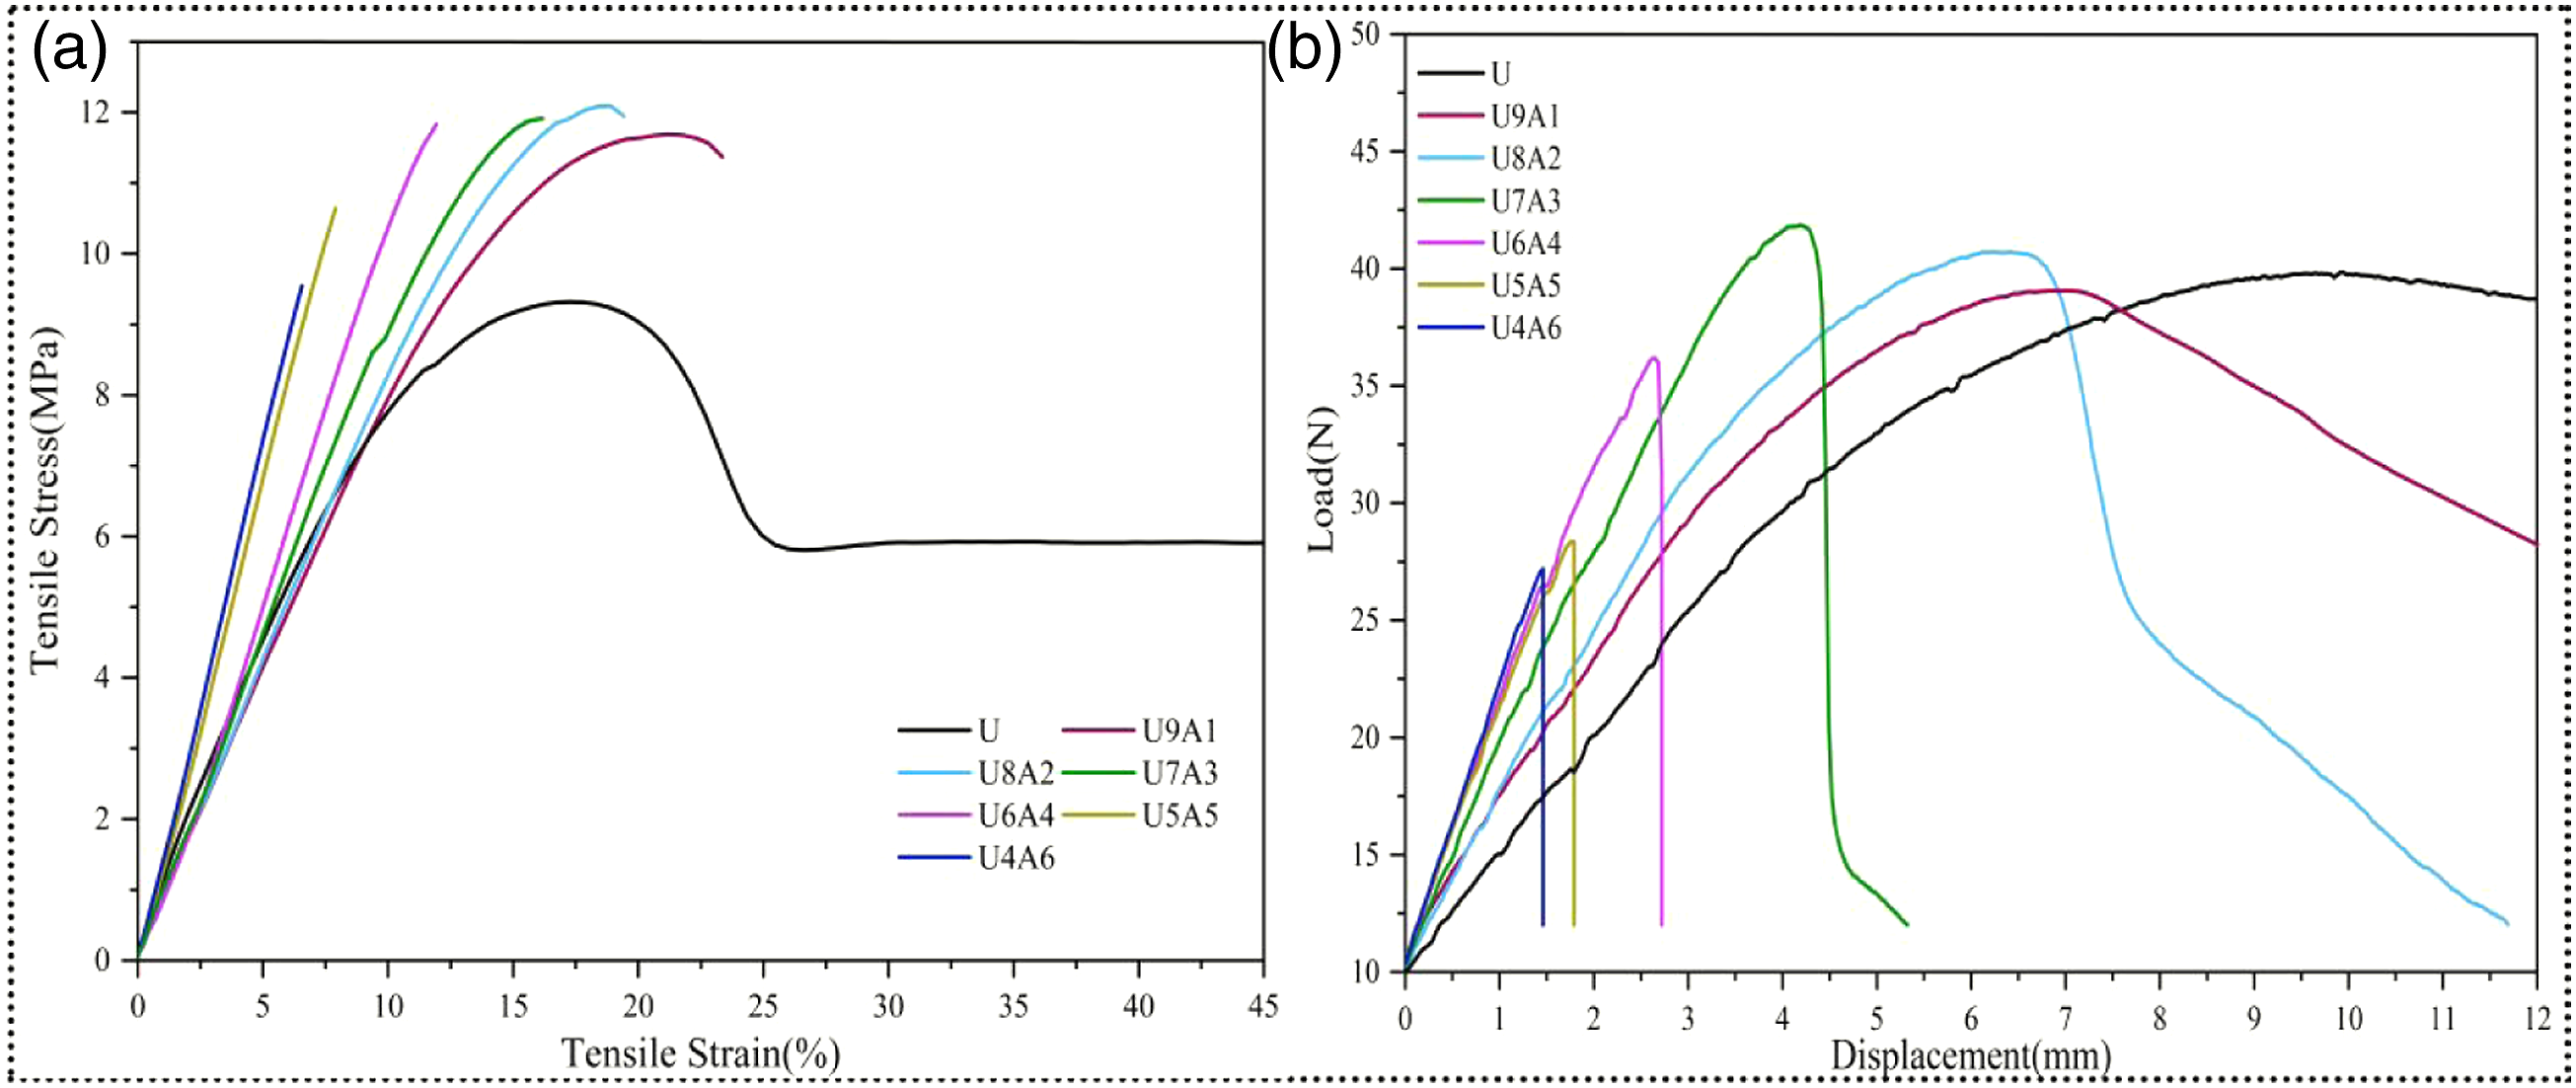
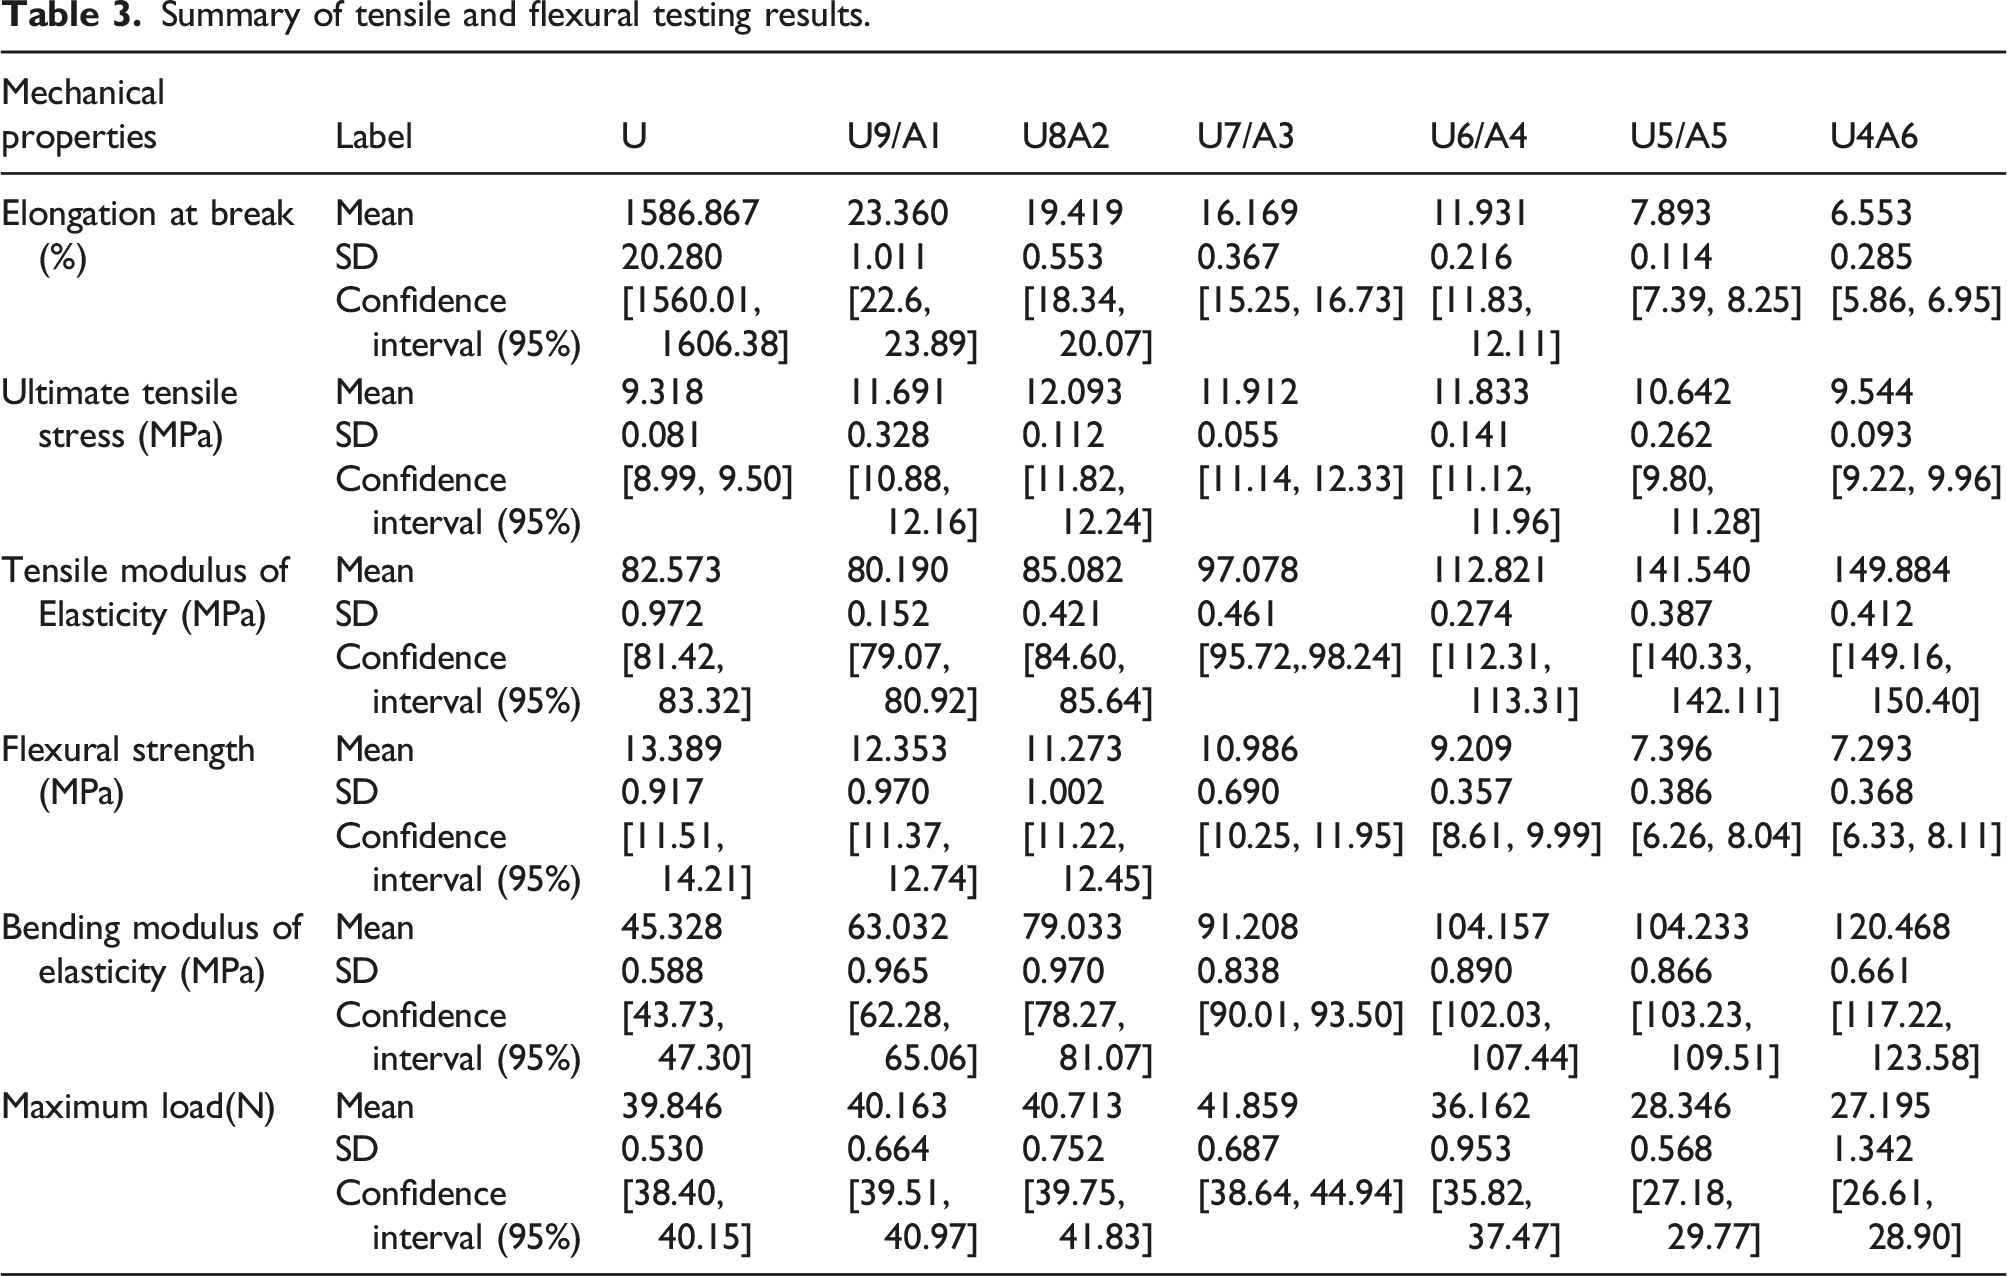
Figure 4 and Table 3 manifested the mechanical properties of pure TPU and TPU/PLA composites. The tensile stress-strain curves in Figure 4(a) show the typical elastomeric behaviour of the matrix material TPU. With the addition of PLA, the ultimate tensile stress of TPU/PLA composites presented an inverted U-shape and reached the maximum value when PLA content was 20%. Meanwhile, with the increase of PLA content, the elongation at break reduced and the tensile modulus of elasticity increased accordingly, and the flexural strength showed a decreasing trend, while the flexural modulus of elasticity also increased accordingly. The maximum load first increased and then decreased as the PLA increased. This indicated that when the content of PLA was ≤20%, the TPU/PLA blends still had some toughness attributed to the TPU. Whereafter, due to the high strength and brittleness of PLA and its increasing dominance in composite, the properties of other prepared TPU/PLA composites gradually approached the pure PL. Additionally, to verify the mechanical properties stable of the prepared composite materials, Table 3 also presented the standard deviation and 95% confidence interval. According to the value, we can find that the mechanical properties of the composites are stable. In conclusion, the trend of mechanical properties with the varied weight ratio of each component also showed that no new substances were produced between TPU and PLA after blending, which was also constant with the results of TGA and FTIR testing.
Microstructure of the composites
The SEM of the 3D printed rectangular cross-section of the TPU/PLA composites are exhibited in Figure 5. For the composites, TPU was used as the matrix material and PLA was mixed with it as filler in different weight ratios. When TPU was in the dominant state, such as the U9A1, U8A2 and U7A3, TPU tended to agglomerate, while less PLA is evenly dispersed in it. With the PLA content continuing to increase, the co-continuous phase morphology diminished and the components were is uniformly distributed in the composites. That is because PLA and TPU were physically mixed without chemical reaction, which was also consistent with the previous TGA, DSC and FTIR analyses.
DSC analysis
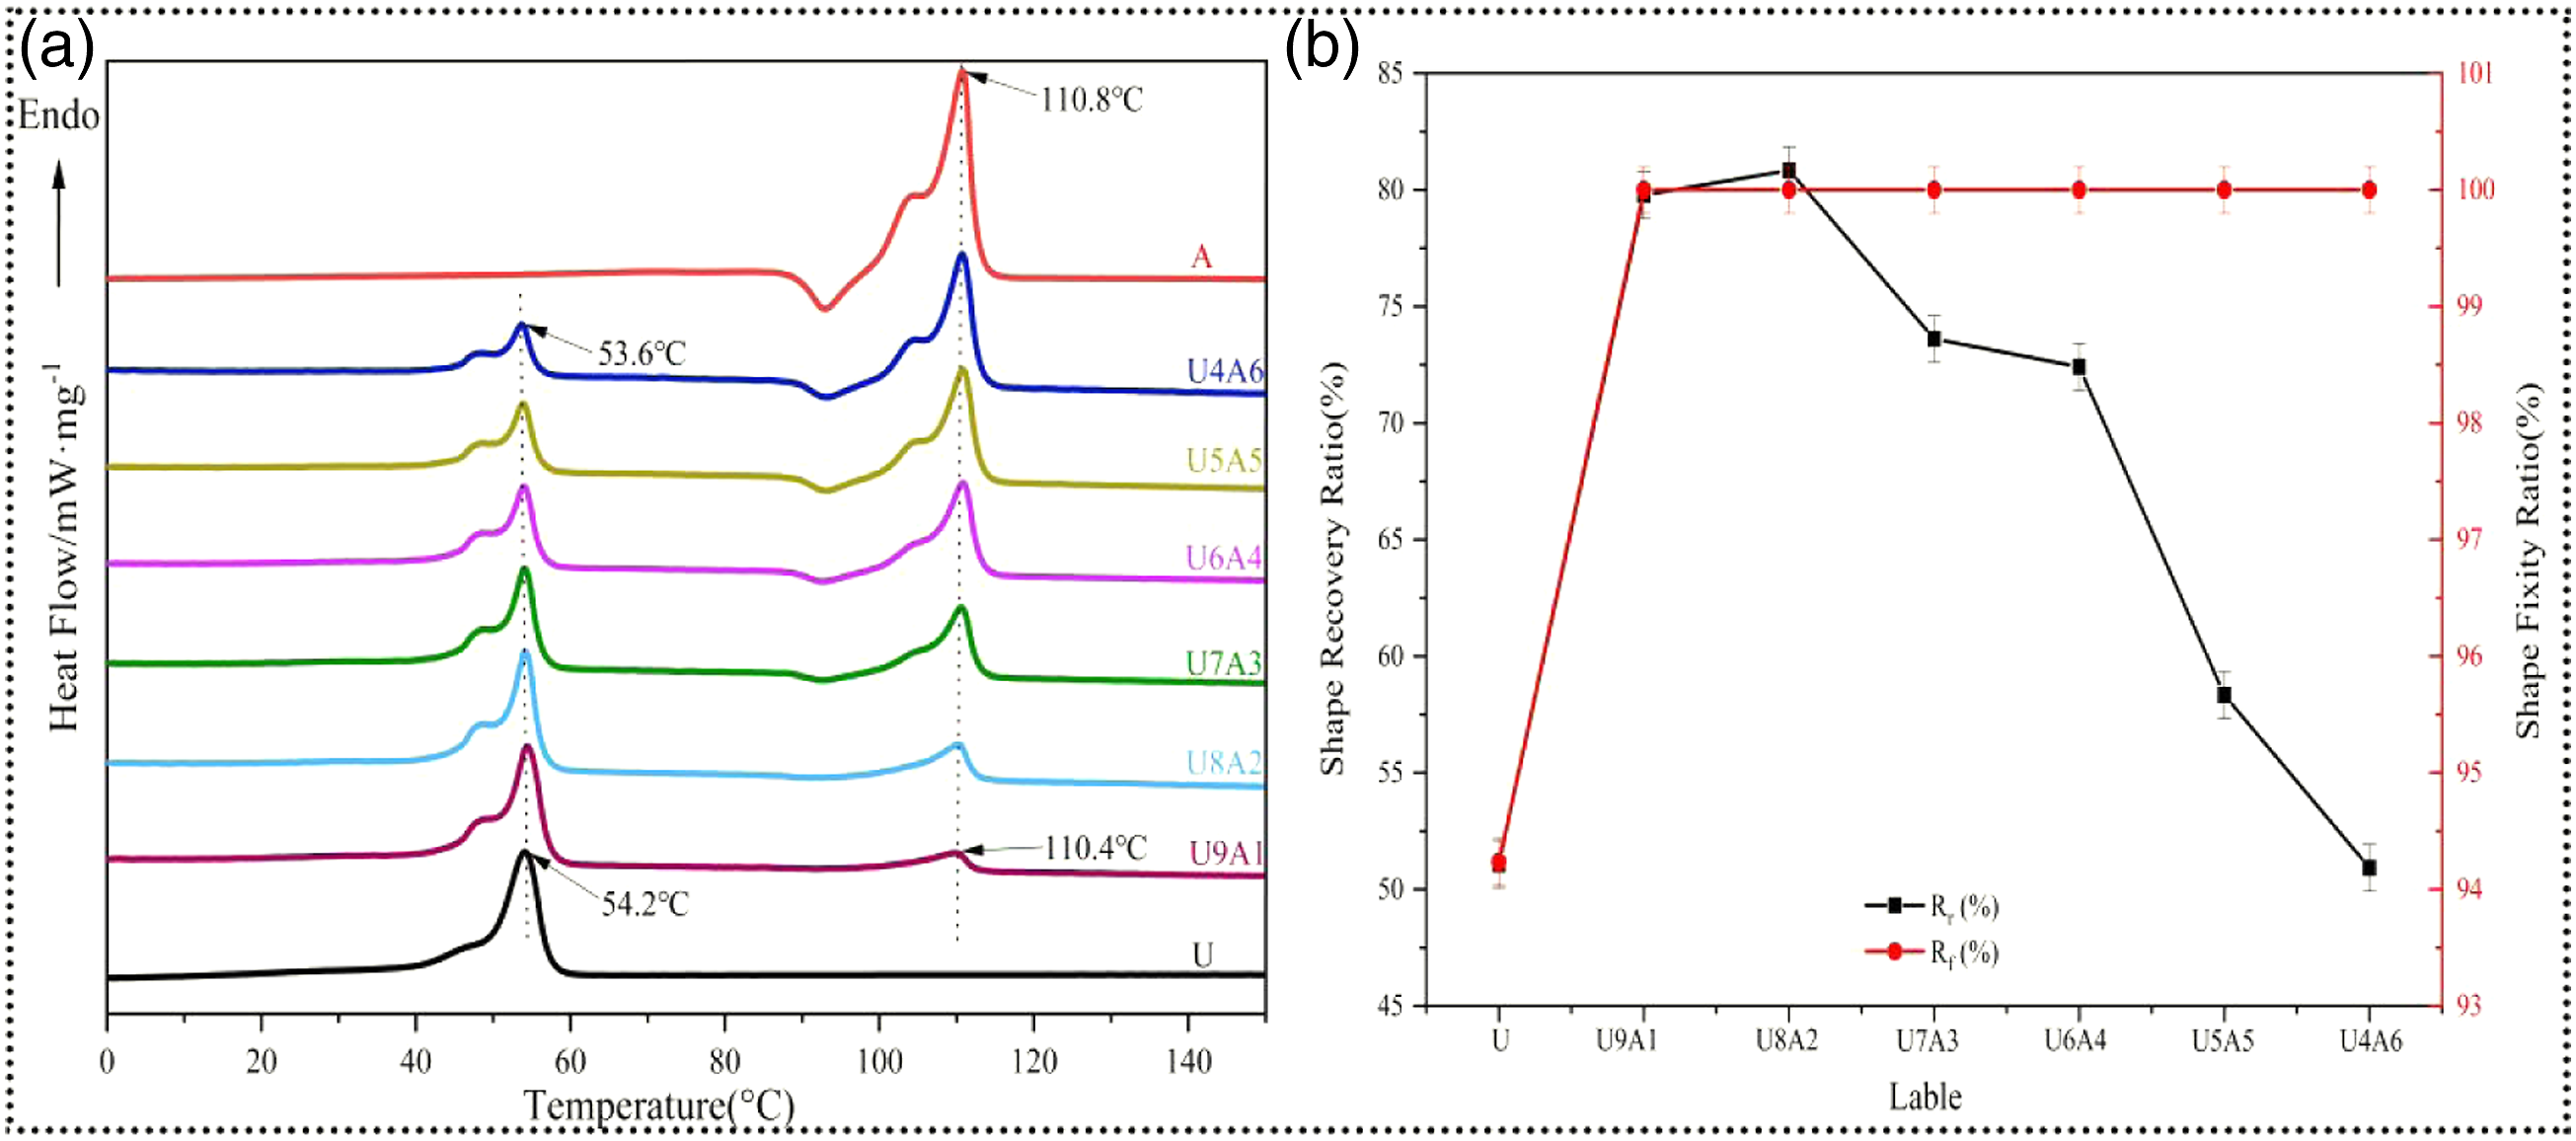
As displayed in Figure 6(a), the DSC analysis results provided the glass transition temperature (
Shape memory properties measurements
Programming temperature of each composite.
Same as previous studies,
7
five sets of samples were printed for testing and averaged, and Figure 6(b) showed the shape memory testing results of pure TPU and TPU/PLA blends. Herein, we can find that the
In summary, the U8A2 composite had moderate mechanical properties and the highest shape memory recovery rate (80.8%) among all prepared composites. Therefore, it was chosen as the substrate material and blended different proportions of PANI to measure the photosensitive shape memory characteristics. The mass content of PANI in the TPU/PLA/PANI composites was set as 1%, 3% and 5%, and labeled as 821,823 and 825, respectively. Before mixing, TPU, PLA and PANI were dried in a vacuum drying oven at 45°C for 48 h. Subsequently, referring to the preparation method of TPU/PLA composite filaments, the three components were blended in different mass ratios and prepared into filaments with a diameter of 1.75 mm±0.5 mm by an extrusion mechanism. Table 1 exhibited the filament-forming and 3D printing parameters for 821,823 and 825. Besides, the temperature of the hotbed was set to room temperature with masking tape in order to remove the samples more easily.
The effect of PANI on the U8A2 composite properties
Summary of tensile and flexural testing results.
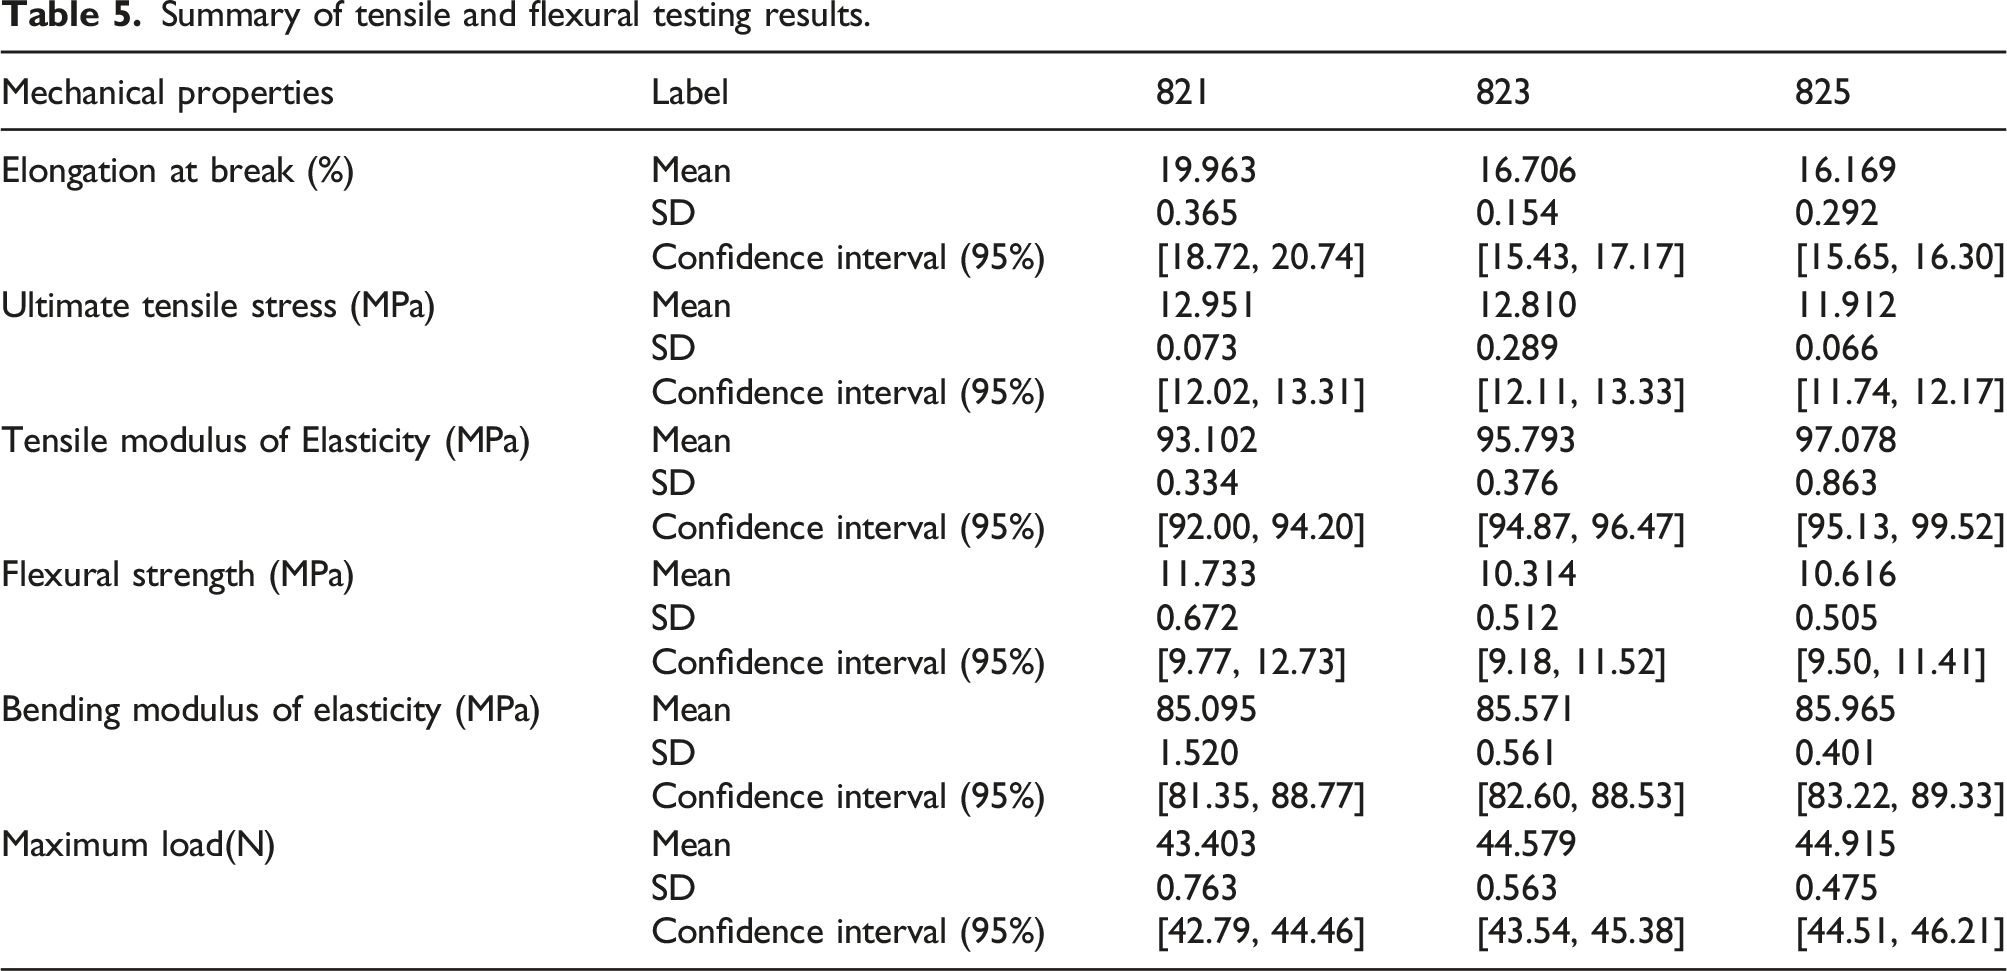
Differential scanning calorimetry analysis was carried out to investigate the effect of PANI on the driving temperature. As shown in Figure 8(a), for TPU/PLA/PANI composites, the addition of PANI amplified the peak of (a) Fused deposition molding analysis of U8A2 and thermoplastic polyurethane/polylactic acid/polyaniline composites. (b) Shape memory properties of U8A2 and thermoplastic polyurethane/polylactic acid/polyaniline blends.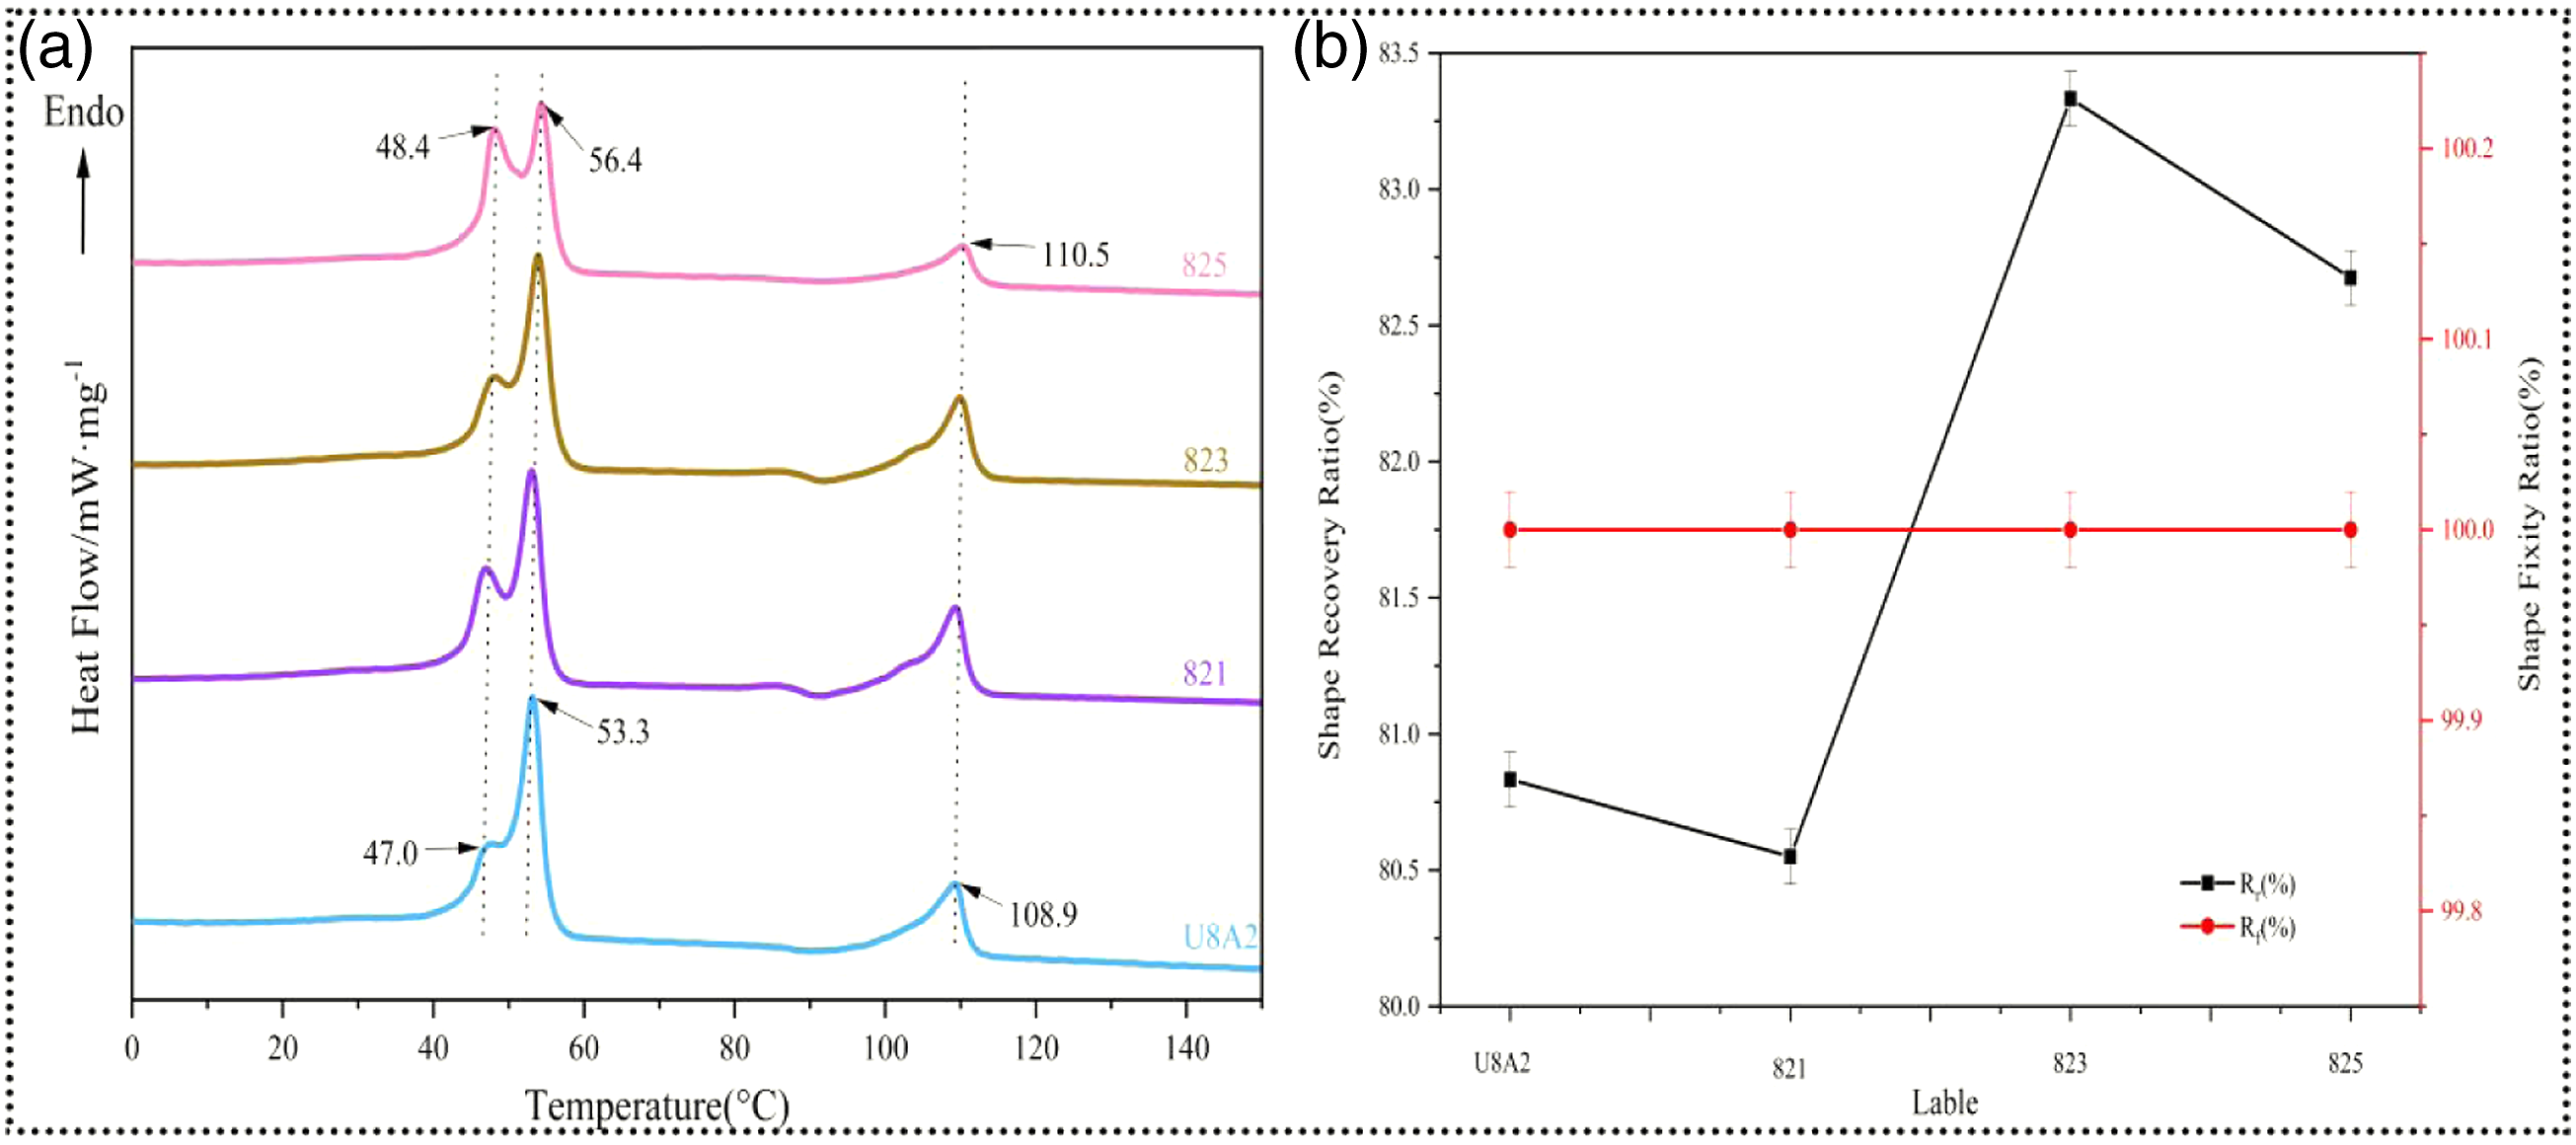
Subsequently, the photosensitive shape memory performance of the composites (821, 823 and 825) was tested in a process similar to the temperature triggering. Firstly, the 3D printed samples were deformed around the programmed temperature under illumination, and then cooled and shaped in room temperature water. The shape memory properties were evaluated by placing the samples under an infrared light (the distance between the light and the product was about 20 cm). Compared with the thermal actuation, the infrared light triggered
Following, uncovered box, rectangular bar and reseau structure were printed using 825 and U8A2 to verify the shape memory effects, and Figure 9 shows the shape-changing under different stimuli. As the temperature of 825 continued to rise under IR illumination until the temperature exceeded the melting point of PLA, the box opened completely. Namely, the combination of the movement of the hard segment (PLA) and gravity effects leaded to the flat situation (shape memory recovery), the detailed information is in the supplemental video. Dual actuating shape memory processing: The shape recovery procedure of U8A2 and 825 blend under thermal actuating (54°C), light-actuating.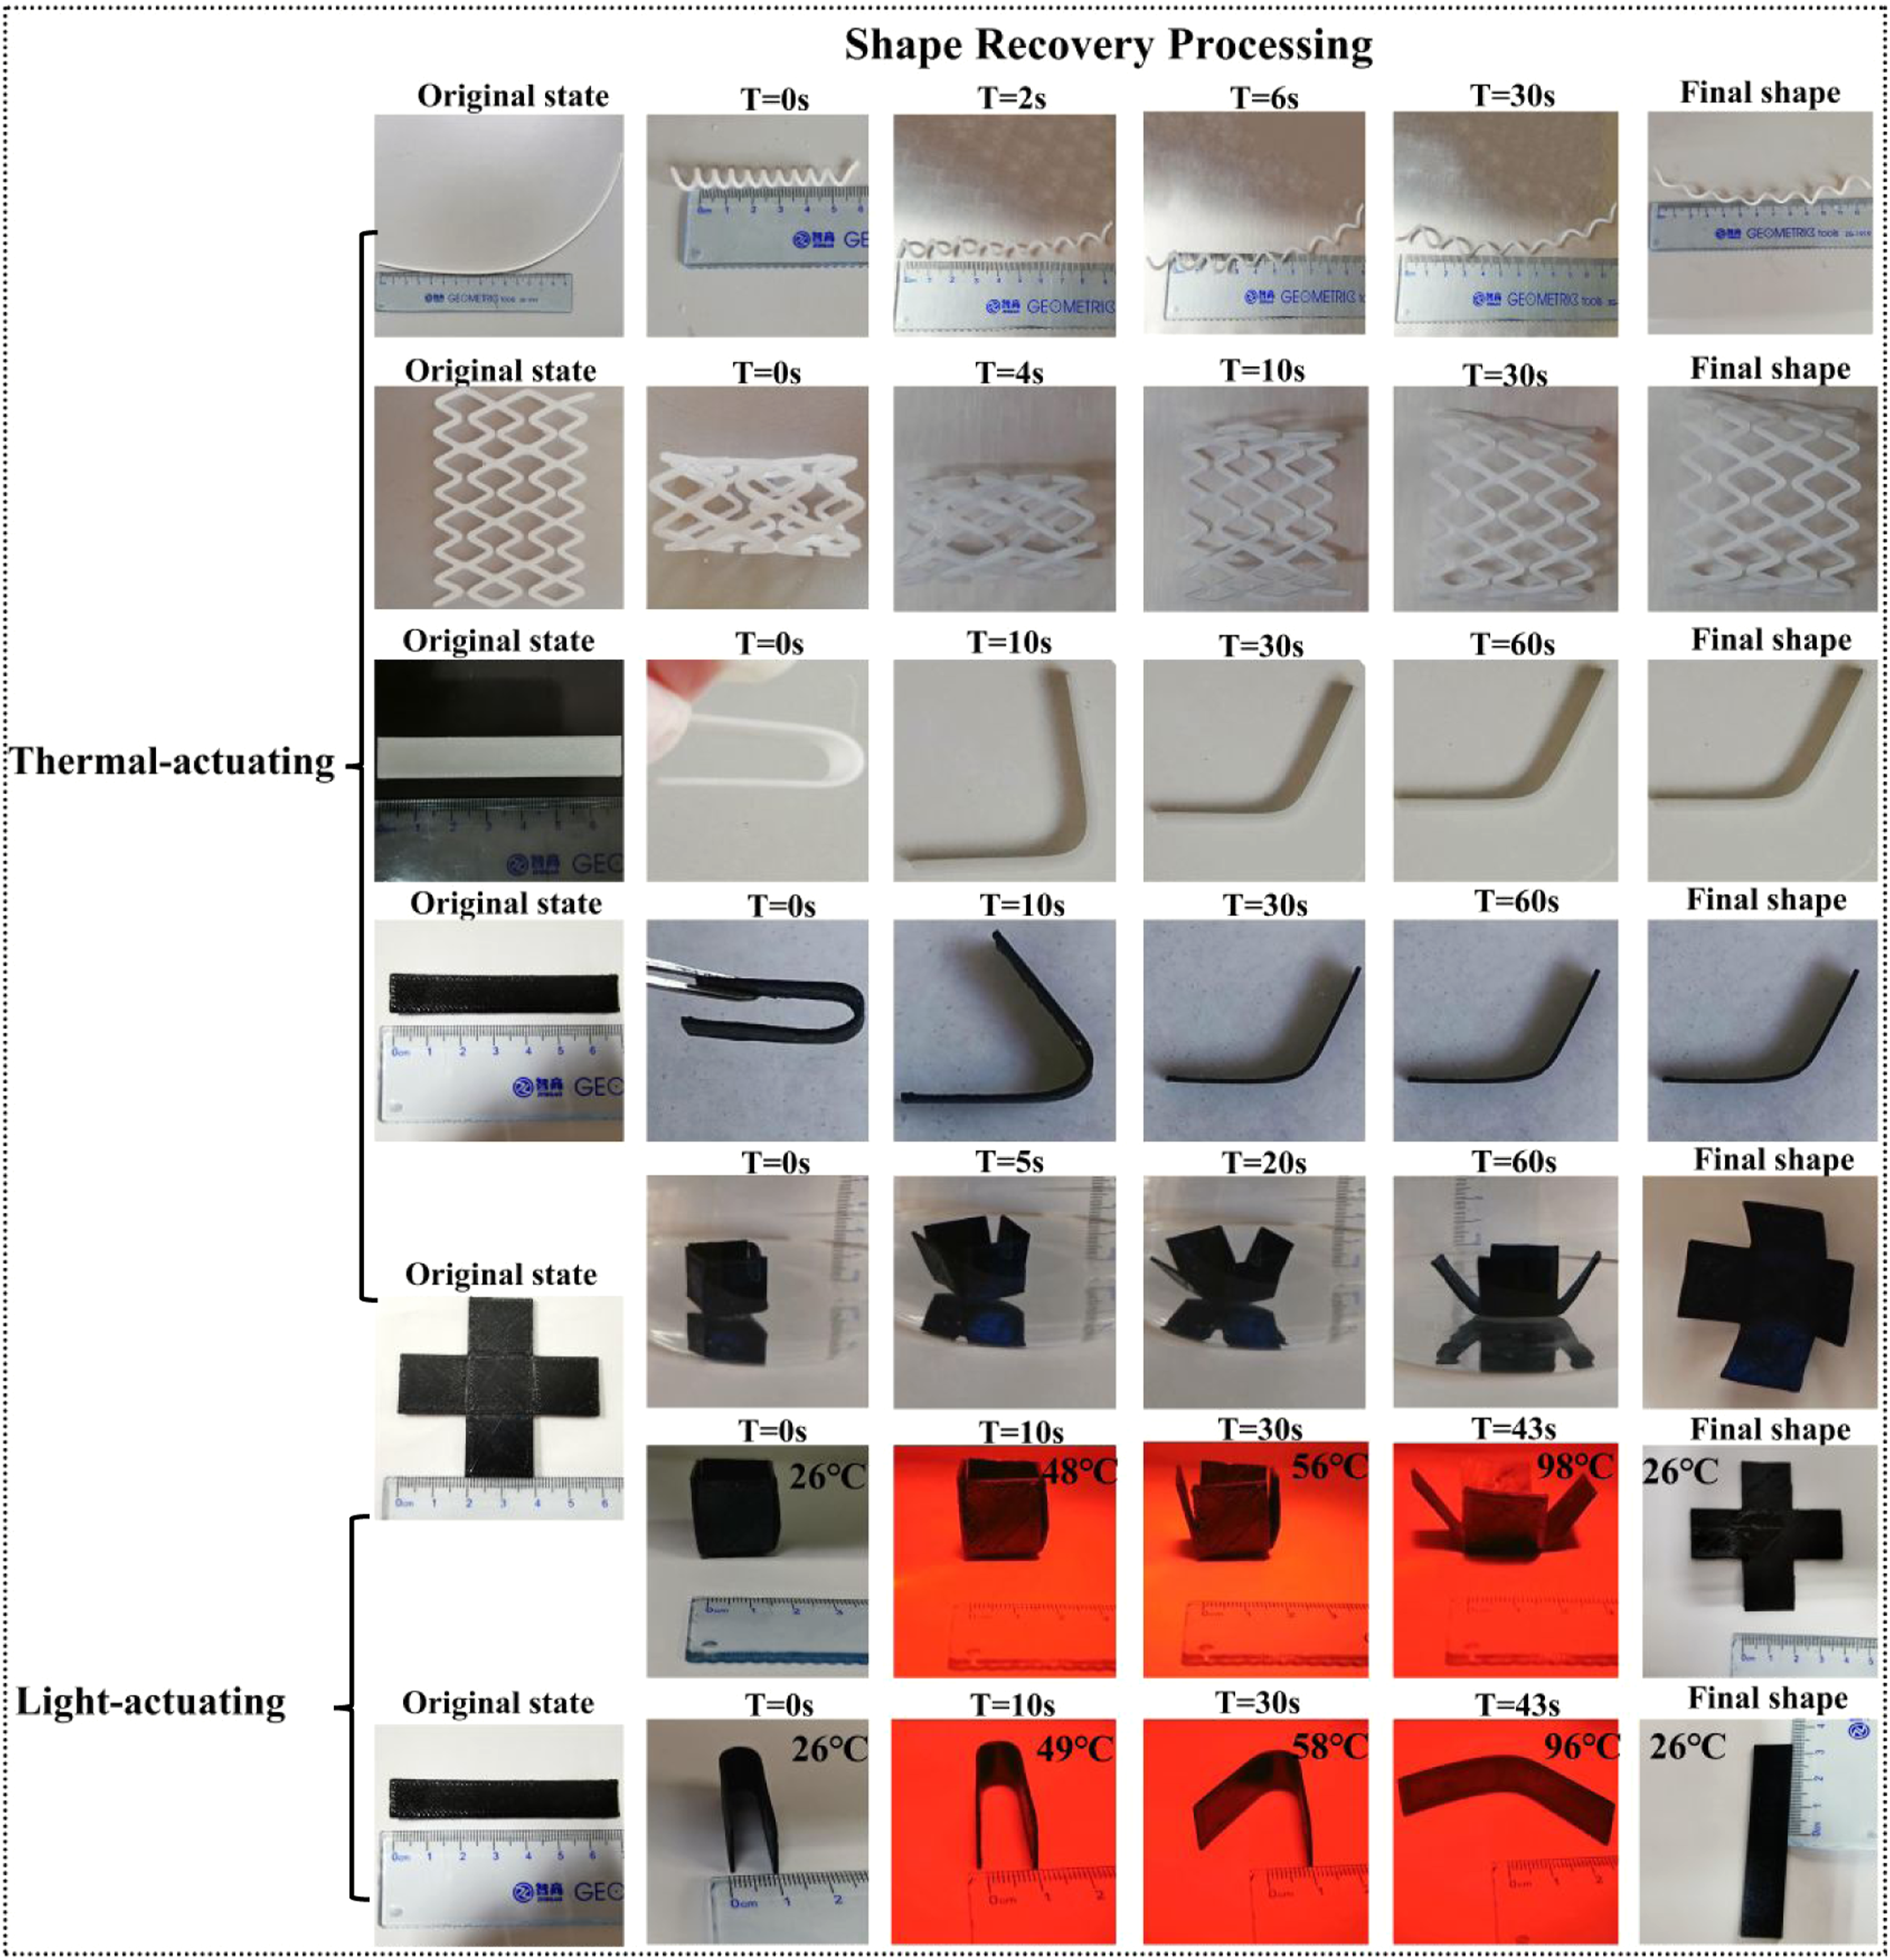
Conclusion and outlook
In this work, six types of TPU/PLA composites were fabricated at first. Then, the filament forming and FDM printing parameters were explored and the optimum values were selected. Whereafter, the TGA, FTIR, mechanical properties, SEM and DSC analyses were executed, and based on these results, it can be concluded that TPU and PLA were only physically mixed. No new substance was generated and the composite material was characterized as a superposition of the PLA and TPU. Thermoplastic polyurethane/polylactic acid composites had thermally responsive shape memory properties. According to the shape memory test, U8A2 had the best shape memory recovery ratio (around 80.8%). Based on the excellent shape memory performance of U8A2, the addition of PANI can introduce a light-actuated mechanism to form a binary-driven shape memory material.
Combining the above characterization with 3D printing parameters allow easy, fast and low-cost fabrication of the dual-drive functional structure. For potential applications, subsequent research can favor the preparation of soft robots with remotely controlled deformation based on photosensitive shape memory properties. Considering the biocompatibility of the matrix material (TPU, PLA and PANI), the materials can also be applied to tissue engineering, such as tissue engineering scaffolds with photothermal therapy effects, tracheal scaffolds and pathological intestinal scaffolds with remotely controlled deformation.
Supplemental Material
Footnotes
Acknowledgements
We would like to thank the Analytical and Testing Center of Northwestern Polytechnical University for DSC, SEM and TGA tests.
Declaration of conflicting interests
The author(s) declared no potential conflicts of interest with respect to the research, authorship, and/or publication of this article.
Funding
The author(s) disclosed receipt of the following financial support for the research, authorship, and/or publication of this article: This project was sponsored by the National Natural Science Foundation of China (Grant No. 51905438), The National Key Research and Development Program of China (Grant No. 2019QY(Y)0502), the Fundamental Research Funds for the Central Universities (Grant No. 31020210506006), the Key Research and Development Program of Shanxi Province (Grant No. 2022GY-228), and the Fund of Foshan Science and Technology Research (2018AB002711).
Data availability
The raw data required to reproduce these findings are available to download.
Supplemental Material
Supplemental material for this article is available online.
References
Supplementary Material
Please find the following supplemental material available below.
For Open Access articles published under a Creative Commons License, all supplemental material carries the same license as the article it is associated with.
For non-Open Access articles published, all supplemental material carries a non-exclusive license, and permission requests for re-use of supplemental material or any part of supplemental material shall be sent directly to the copyright owner as specified in the copyright notice associated with the article.