
Abstract
Radiolucent lines (RLLs) observed adjacent to a cementless stem following Total Hip Arthroplasty (THA) have been linked to stem loosening. Their manual assessment is susceptible to observer error. In this study a semi-automated (Auto) method was developed to characterise RLLs from Anterior-Posterior (AP) and Lateral (Lat) radiographs, evaluate their time progression and effects on clinical outcomes. The study comprised of 237 subjects with postoperative, 1 and 10 Y radiographs. Of these 131 also had 4–7 Y radiographs. All subjects also had accompanying implant, demographic and clinical outcomes data. An algorithm was written to evaluate the incidence of RLLs and post-processing was performed to characterise RLLs as ‘not present’ or ‘benign’, or significant (‘SigRLL’). The criteria for SigRLL were tuned to minimise the number of false negatives compared to a manual characterisation. The incidence of SigRLL using AP/Lat or AP only was compared and the latter was used to monitor their development over time. The relationship with clinical outcomes was evaluated. Incidence of SigRLLs using the Auto and Manual AP/Lat methods agreed in 199/237 (84.0%) of subjects. The discrepancies included seven false negatives. The Auto AP/Lat and AP methods agreed in 221/237 (93.2%) of subjects. Twenty-eight subjects with a 4–7 Y review had SigRLLs at 10 Y. Of these, 23 had SigRLLs at 4–7 Y. Greater pain was reported in the SigRLLs group (p = 0.003). Four out of five stems subsequently revised for loosening exhibited 10 Y SigRLLs.
Keywords
Introduction
Cementless Total Hip Arthroplasty (THA) is well established and the Corail® cementless stem (DePuy Synthes, Warsaw, IN) is one of the most frequently used and successful cementless stems worldwide.1,2 However, certain factors have been attributed to increasing the likelihood of revision, these include: the use of lateralised stems,3,4 collarless or smaller stems, 4 female patients > 70 years, 5 large femoral offsets 6 and non-cross-linked polyethylene as a bearing material. 7 Radiographically, these factors have been linked to the appearance of discrete lines adjacent to the stem and the bonded bony condensate and are known as radiolucent lines (RLLs). RLLs which are >2 mm wide and/or are progressive have been related to stem loosening, necessitating revision. 8 Therefore, accurate clinical assessment of radiolucencies in cementless THA is an important observational measure. However, manual clinical assessment is time consuming and susceptible to wide intra-observer subjective bias9,10 regardless of surgeon experience.
In a retrospective study, Karayiannis et al. 11 assessed Anterior-Posterior (AP) and Lateral (Lat) radiographs to assess a cohort of Corail® stems that were unrevised at a minimum of 10 years (Y) after primary THA surgery. Three types of radiographic appearance were defined as summarised in Figure 1 but repeated here in full for clarity.
1. No observable RLLs (NoRLLs): A complete absence of RLLs.
2. Benign RLLs (BenRLLs): Included at least one of the following: (i). Line either incomplete or complete in zone 1 but width not greater than 1 mm (ii). Incomplete line in zone 8 but width not greater than 1 mm
3. Significant RLLs (SigRLLs): Included at least one of the following: (i). Any line greater than 1 mm in width (ii). Any complete lines in 2 or more zones (iii). Any line in zone 7
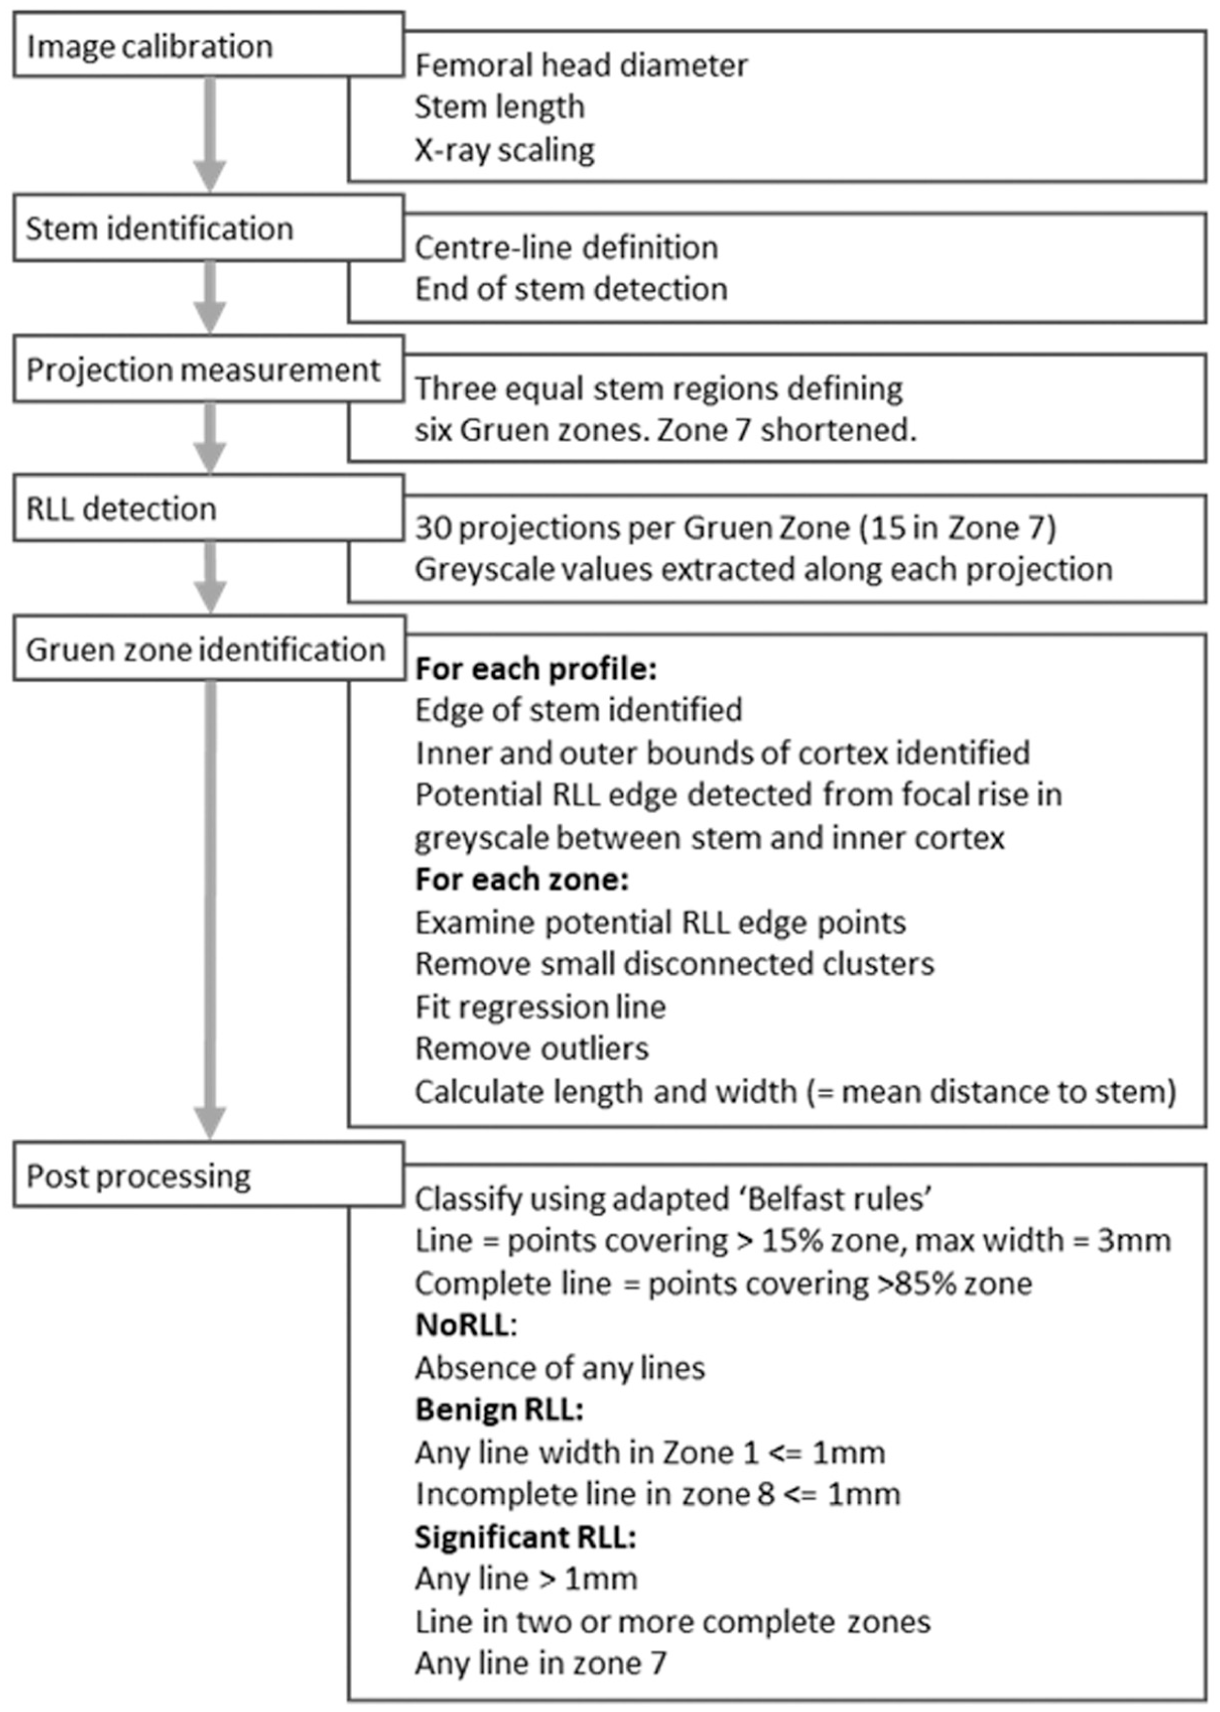
Flowchart summarising the processes used in the semi-automated analysis of the radiographs.
SigRLLs were associated with non-cross-linked polyethylene, absence of a collar, stem, undersizing (defined as two or more sizes less than the ideal metaphyseal fit) and higher pain scores. A limitation of the general applicability of this study was that, in clinical practice, follow-up radiographs usually only comprise AP radiographs with Lat radiographs taken less frequently.
While previous measurement of RLLs in the hip have been manual, semi-automated methods have been developed to assess radiolucencies following uni-compartmental knee replacement 10 which demonstrated the potential to develop a more objective automated reading of radiographs to facilitate RLL detection.
Aims
The aim of this study was to develop and assess the efficacy and advantages of a more objective, quicker and less labour intensive, semi-automated method to determine the incidence of RLLs and assess whether in the future it has an application in clinical practice.
The specific objectives were to:
Compare the detection of SigRLLs using the semi-automated objective method to a manual subjective review of the same subjects at a minimum 10 Y follow-up.
Compare the detection of SigRLL using both AP and Lat radiographs to using only AP radiographs (which is often all that is available in clinical practice).
Assess the development of RLLs over time and determine whether the observation of SigRLLs at 10 Y, can be predicted by the observation of RLLs at an earlier review period along with their significance to clinical outcomes.
The methods and data associated with this paper is available from University of Leeds at https://doi.org/10.5518/1866. 12
Methods
Inputs–identification of radiographs to be included
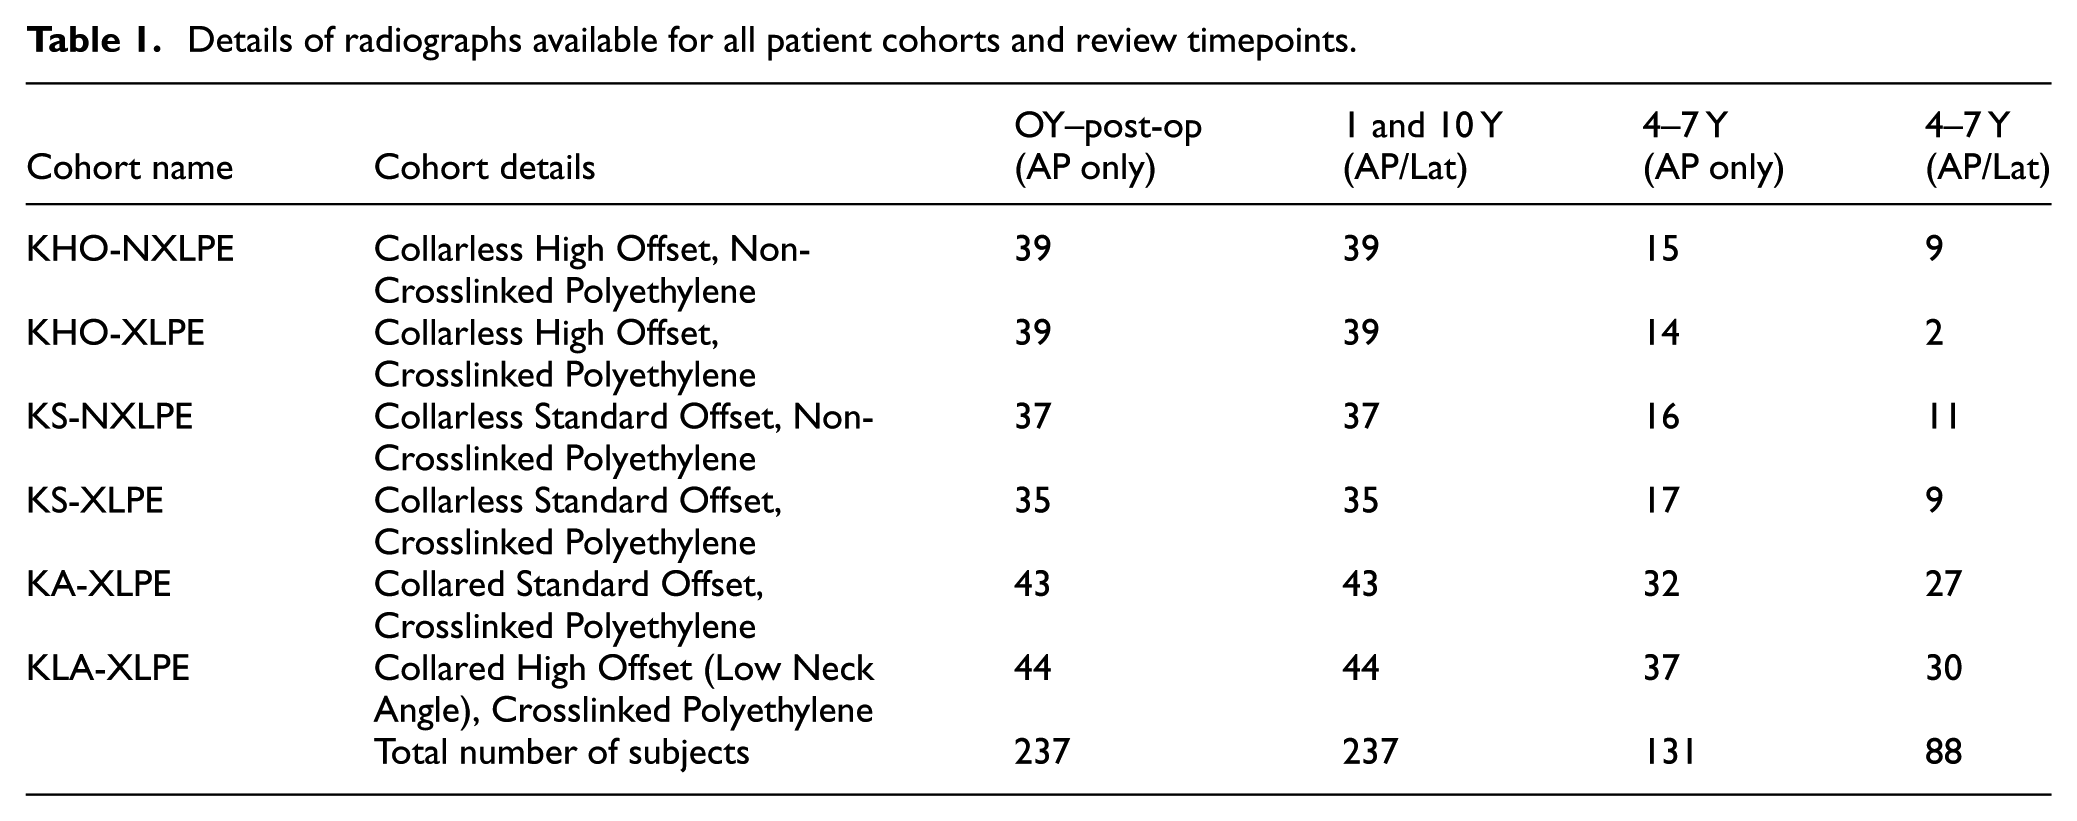
The radiographs used in this study were from a subset of 288 subjects all of whom had been implanted with a variant of a cementless Corail® femoral stem and a cementless Pinnacle™ acetabular cup (DePuy Synthes, Leeds, UK) and had a minimum 10 Y follow-up, previously reported by Karayiannis et al. 11 Local ethical approval was obtained for the study (20091DB-SW). The minimum requirement for inclusion criteria for subjects was AP radiographs at 0, 1 and 10 Y as well as Lat radiographs at 1 and 10 Y, with accompanying implant specification and demographic data. Application of this inclusion criteria reduced the number from 288 to 237, comprising 133 female (56.1%) and 104 male (43.9% subjects). Of these, 131 subjects had an additional intermediate AP radiograph taken between 4 and 7 Y, 88 of these also had a Lat radiograph. Subjects comprised six cohorts dependent on the variant of Corail® stem design and bearing material. This is detailed, together with a description of available radiographs in Table 1.
Details of radiographs available for all patient cohorts and review timepoints.
Processing
The semi-automated process used is summarised in Figure 1 and is briefly described as follows: Radiographs were processed using a bespoke algorithm (Matlab version R2019b, MathWorks Inc, MA, USA). After image calibration, the axis of the stem was identified and a series of projections were made perpendicular to the axis in each Gruen zone (with the exception of zones 4 and 11, at the stem base). The edge of the stem, and the internal and external edges of the cortical bone were detected by changes in the greyscale along each projection. To detect the edge of a RLL, a series of rules were used to search for local maxima in the greyscale between the edge of the stem and inner boundary of the cortex on each projection. A RLL was defined within a Gruen zone if the number and consistency (goodness of fit to a straight line) of the detected points met a set of criteria. The rules for the size of the maxima, distance from the stem edge, number of detected points and goodness of fit were tuned using an initial set of 10 radiographs which had been assessed by three independent clinicians. The detected lines were displayed a on screen to permit a manual confirmation step to determine if there was ambiguity, such as interference from annotation, cropping of distal tip of the stem, discontinuities in the detected RLL (also mentioned in the supplementary data and now shown in Figure 2) or poor (low contrast) radiographic quality. This would typically take a few seconds to check and 1–2 min if a manual intervention was necessary. For each Gruen zone where a RLL was detected, the length and width (i.e. distance from the RLL edge to the stem) were recorded. A full description of this methodology may be found in the RLL Detection Methodology Detail file in Supplemental Data. 12
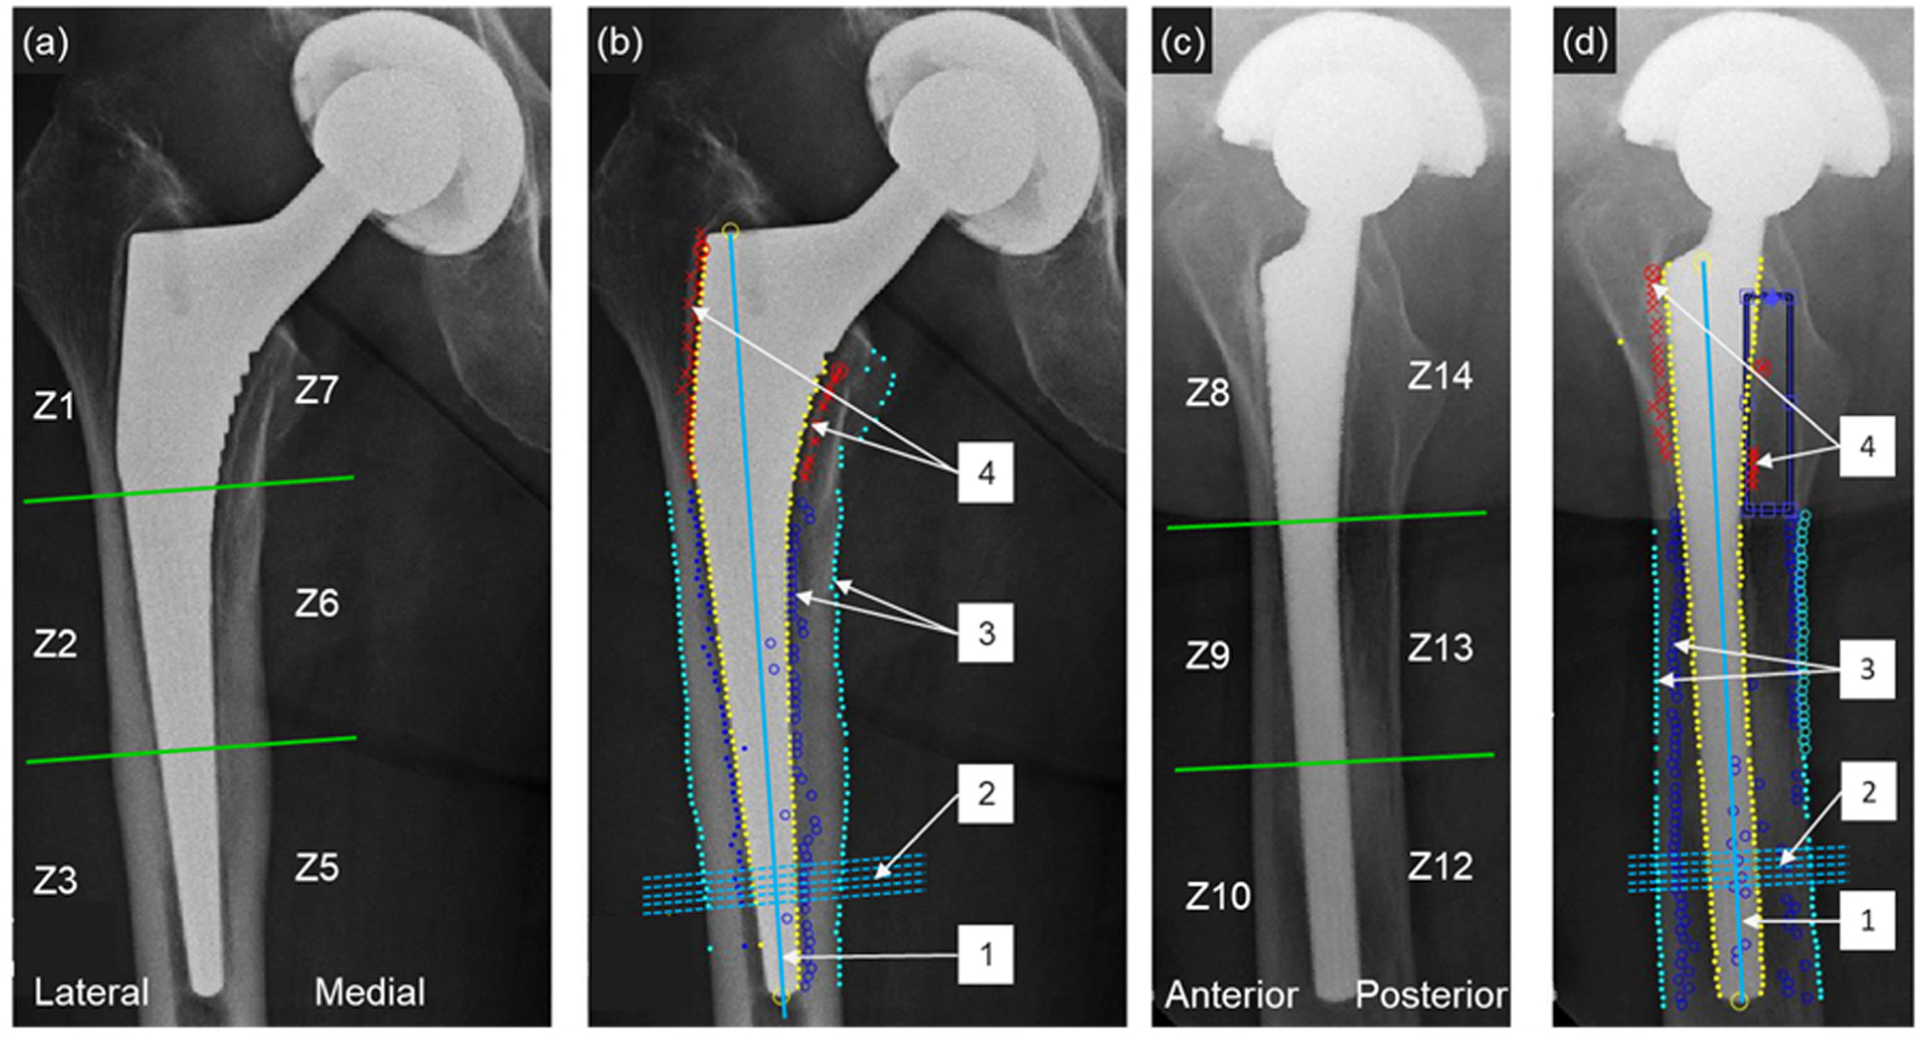
(a) Example 10 Y AP radiograph with Gruen zones showing visually apparent RLLs in zones 1 and 7, (b) stages of the RLL detection code on the same AP radiograph, (c) corresponding 10 Y Lat radiograph with Gruen zones showing visually apparent RLLs in zones 8 and 14 and (d) stages of the RLL detection code on the same Lat radiograph. The detection stages in (b and d) show 1: identification of the stem centre line; 2: projections perpendicular to this line–projections are made along the full length of the stem, five adjacent lines shown here as an example; 3: identification of the inner and outer cortex and 4: identification of potential points on a RLL. In (d), the detected RLL in zone 14 is discontinuous and is flagged for manual checking.
An example of AP and Lat view radiographs of a subject at 10 Y review with distinct, well defined RLLs is shown in Figure 2(a) and (c). The key points ascribed by the algorithm can be observed in Figure 2(b) and (d). It should be noted that in some cases (predominantly Lat views) the RLLs were much less well defined.
Post-processing and tuning
A post-processing step (Excel, Microsoft Corp, USA) was then performed. The previously developed definitions of RLLs, 11 as summarised in Figure 1 and hereafter referred to as ‘Belfast rules’, were applied to the AP/Lat radiographs of the cohort of radiographs taken at 10 Y which were the most likely to exhibit RLLs, a collarless standard stem with a non-crosslinked polyethylene acetabular liner. This gave the greatest likelihood of capturing the range of RLL appearance in a subset of the whole study group. The semi-automated assessments of the RLL classification were then compared with those observed in the manual review. It was noted that the semi-automated software generated a number of spurious results, and to minimise these, the ‘Belfast rules’ were expanded to include variables which described the length of line in each Gruen zone and maximum line width.
Output analysis
The above steps were then applied to all the available radiographs for each of the 237 subjects (total 1,492 images) and the RLL classification determined. Outputs generated for 10 Y radiographs by the semi-automated method using AP and Lat radiographs (Auto AP/Lat method) were then compared with observations from a previous manual review (Manual AP/Lat). 11 The expanded ‘Belfast rules’ were refined to give the minimum number of false negatives (the number of times the Auto AP/Lat method did not identify a SigRLL subject when the Manual AP/Lat method did identify a SigRLL. This resulted in the following refined definitions of RLLs:
A series of points were not considered to be a line if their total length was <15% of the zone length
A series of points were considered to be an incomplete line if their total length was >15% but <85% of the zone length.
A line was deemed to be complete if its length was >85% of the zone length.
To avoid spurious shadows that occurred in the proximal zones, a maximum thickness of 3 mm was specified for any line (complete or incomplete) to be categorised as a RLL in zones 1, 7, 8 and 14.
Where there was discrepancy between Auto AP/Lat and Manual AP/Lat methods, a blinded independent clinical review was completed.
To evaluate the necessity of using the Lat radiographs, a further analysis was performed on the 10 Y dataset comparing the incidence of RLLs when using the Auto AP/Lat method with the incidence using only the AP radiographs (Auto AP method). Subjects with post-operative and 4–7 Y radiographs were used to determine the progression of RLLs with time. The occurrence of Sig RLLs was then compared to subject clinical outcomes, which comprised the Oxford Hip Score (OHS) at the 10 Y review and incidence of any subsequent surgery.
Statistical analysis was carried out using SPSS (version 29.0 IBM SPSS statistics for Windows Armonk, NY) and applied to Auto AP/Lat, Manual AP/Lat and Auto AP methods. Regression analysis, was used to compare the incidence of SigRLLs with age, sex, polyethylene type and stem factors [collar, sizing and offset]. OHS were used to define clinical outcomes, with question 1 of the OHS used to determine pain. Statistical significance was set at p < 0.05.
Results
Comparison of methods
The radiographs described in Table 1 were analysed using the Auto AP/Lat method. There was a total of 237 patients with 10 Y post-operative radiographs available for review. Of these, 114 (48.1%) had NoRLLs, 56 (23.6%) had BenRLLs and 67 (28.3%) had SigRLLs. The same results generated by the Manual AP/Lat method were 90 (38.0%), 104 (43.9%) and 43 (18.1%) respectively. The comparable results for the Auto AP method were 135 (57.0%), 51 (21.5%) and 51 (21.5%) respectively.
Further analysis was performed by combining the NoRLLs and BenRLLs together into one group representing non-significant RLLs (NoSigRLL).11,12 A full description of this methodology may be found in the Multinomial Regression Analysis file in Supplemental Data. 12 Correspondence of the Auto AP/Lat and Manual AP/Lat methods for categorising SigRLLs and NoSigRLLs is shown in Table 2(a). Auto and Manual AP/Lat methods agreed in 199/237 subjects (84.0%). The measure of agreement between the Auto AP/Lat and Manual AP/Lat methods across all RLLs was (Kappa) 0.557, p < 0.001. Sensitivity and specificity for the detection of SigRLLs = 83.7% (36/43) and 84.0% (163/194) respectively.
Correspondence between methods of detecting RLLs with outcomes divided into two groups: NoSigRLL and SigRLL. The comparisons show (a) auto AP/Lat and Manual AP/Lat methods (agreement across all RLLs (Kappa) = 0.557, p < 0.001) and (b) auto AP/Lat and Auto AP methods (agreement across all RLLs (Kappa) = 0.820, p < 0.001).
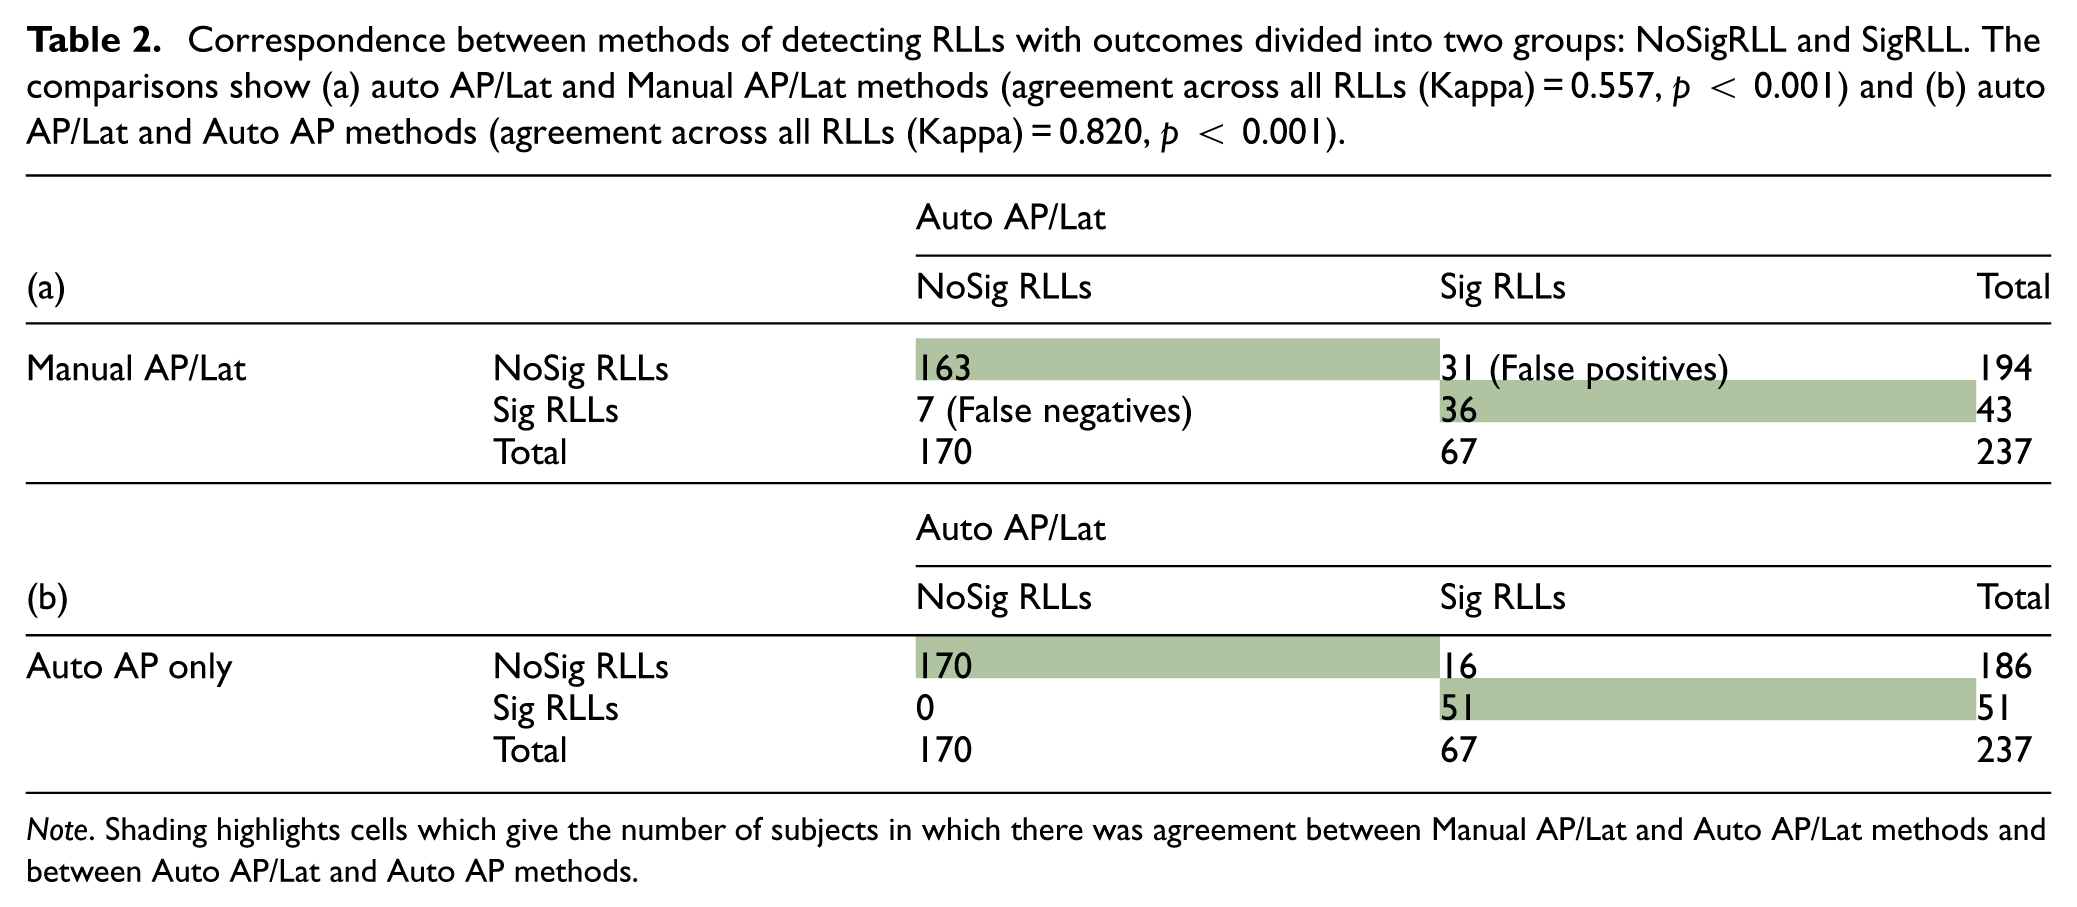
Note. Shading highlights cells which give the number of subjects in which there was agreement between Manual AP/Lat and Auto AP/Lat methods and between Auto AP/Lat and Auto AP methods.
The correlation between Auto AP/Lat and Auto AP methods is shown in Table 2(b). The outputs agreed in 221/237 (93.2%) subjects and the measure of agreement across all RLLs was (Kappa) 0.820, (p < 0.001).
Progression of RLLs over time
The incidence of BenRLLs was included in this analysis because, whilst not clinically significant, their presence may be a pre-cursor to SigRLLs. At the 4–7 Y time point, of the 237 subjects in this study 131 (55.3%) had AP radiographs of which 88 (37.1%) also had a Lat radiograph. The increased numbers available using the Auto AP method and high level of agreement with Auto AP/Lat method reported above, as well as the fact that only AP radiographs were taken post-operatively, made the Auto AP method a more appropriate means to assess the progression of RLLs with time.
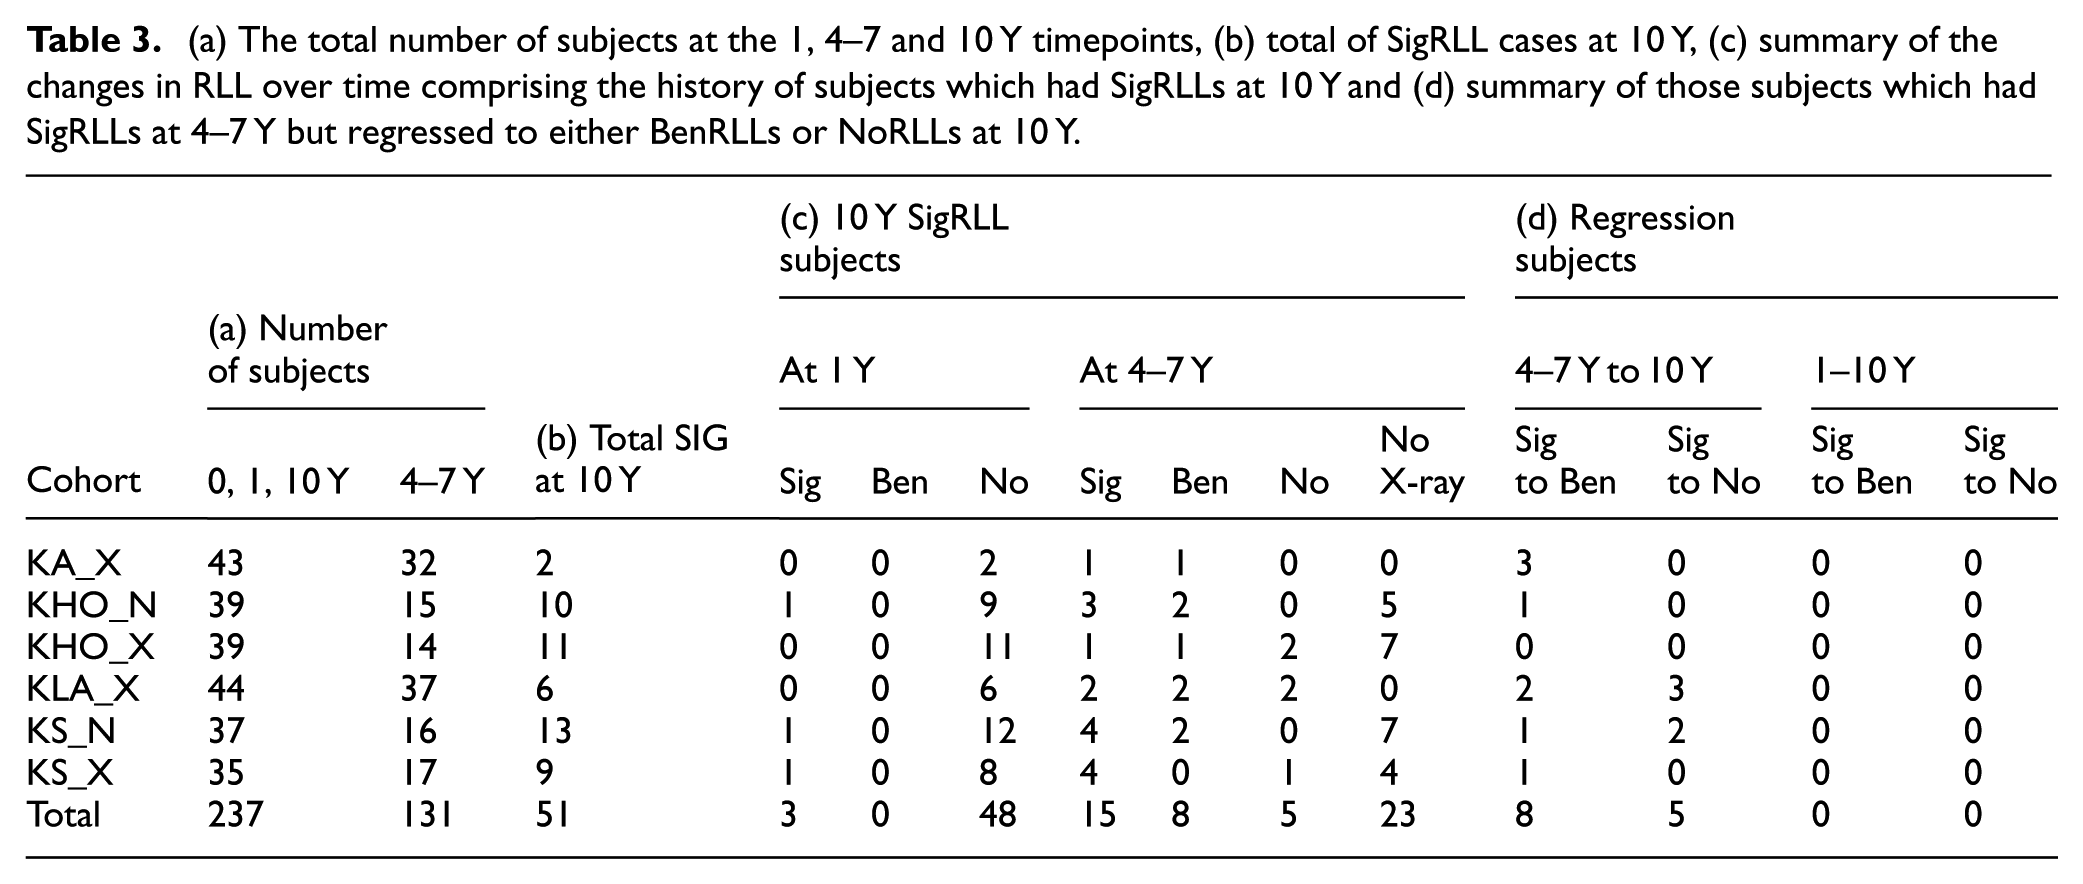
Of the 131 cases which had a radiograph at 4–7 Y, no SigRLLs were detected at the post-operative time point. At 1 Y review 3/131 subjects (2.3%) exhibited SigRLLs. This increased to 28/131 (21.4%) subjects at the 4–7 Y time point and remained the same at 10 Y. However, the subjects identified with SigRLLs at 4–7 Y and those identified at 10 Y were not the same in all cases. Table 3(a) shows the total number of subjects by cohort at each time point. A total of 51 subjects were identified with SigRLLs at 10 Y using the Auto AP method (Table 3(b)). All had 1 Y radiographs of which three had SigRLLs and none had BenRLLs. At 4–7 Y, radiographs were available in 28/51 of the subjects which had SigRLLs at 10 Y and of these, 15 had SigRLLs, 8 BenRLLs and 5 NoRLLs. The balance (23 subjects) did not have a 4–7 Y radiograph (Table 3(c)). Of the subjects with A/P radiographs at 4–7 Y that did not have SigRLLs at 10 Y (103 in total), 13 were identified as having SigRLLs at 4–7 Y which had ‘regressed’ at 10 Y to either BenRLLs (eight subjects) or NoRLLs (five subjects; Table 3(d)).
(a) The total number of subjects at the 1, 4–7 and 10 Y timepoints, (b) total of SigRLL cases at 10 Y, (c) summary of the changes in RLL over time comprising the history of subjects which had SigRLLs at 10 Y and (d) summary of those subjects which had SigRLLs at 4–7 Y but regressed to either BenRLLs or NoRLLs at 10 Y.
Comparison of SigRLLs to clinical outcomes
All subjects with a 10 Y radiograph also had an OHS. A Krustal-Wallis test indicated that there was significantly greater pain in the SigRLLs group than in the NoSigRLLs group using all three methods; Auto AP/L (p = 0.005), Manual AP/L (p = 0.011) and Auto AP (p = 0.003). When total OHS was similarly compared, no difference in score was observed using any of the three methods.
Excluding infection, to date in this series 15/237 (6.3%) subjects have undergone further surgery subsequent to the 10 Y review. Of these, using the Auto AP only method, seven had SigRLLS at 10 Y and of those three at 4–7 Y.
Discussion
Algorithm development
The ‘Belfast rules’ definition of RLLs
11
as described above, were adequate when used by an experienced observer, however, they were found to be lacking in detail when used in developing objective assessment by an algorithm. Specifically, the rules needed to be refined to give a precise definition of an ‘incomplete line’ and a ‘complete line’ and a limit placed on the thickness of a line in zones 1, 7, 8 and 14. By varying these definitions number of strategies were tested including minimising the overall number of discrepancies between the Manual and Auto methods. Minimising the number of false positives and minimising the number of negatives. It was decided that the last of these was the most clinically useful. However, this resulted in 31 false positives. The minimum number of false negatives was seven. The values that were associated with this aim were (15–85% and >85% of the length of the Gruen zone for incomplete and complete zones respectively). Setting a maximum zone width of >3 mm wide, designed to eliminate shadows falsely identified as RLLs in zones 8 and 14 and to a lesser extent in zones 1 and 7, was only partially successful. This was because the outline of the greater trochanter could result in a line close to the stem and satisfy the criteria for a RLL line. However disregarding lines >3 mm wide did eliminate some false positives. Further reduction of the maximum line width to <3 mm resulted in more false negatives. These refinements corresponded with the subjective assessment of a clinician (DB). Another source of false positives was the line identified by the software at the proximal part of zone 1 which an experienced clinician would discount as a SigRLL. The false negatives recorded were usually caused by the boundary of the RLL being directly adjacent to the femoral cortex in distal portions of zones 1 and 7, or in zones 2 and 6 or a poor quality, low contrast radiograph.
Comparison of semi-automated and manual methods
In this study the Manual and Auto AP/Lat methods agreed in 199/237 (84.0%) subjects.
The Auto AP/Lat method identified a greater number of SigRLLs compared with the Manual AP/Lat method (67 (28.1%) and 43 (18.1%) respectively, Table 2(a)). This was primarily because the input parameters for the post-processing rules were varied to minimise the number of false negatives (seven) which resulted in 31 false positives. Only 36 cases were designated as SigRLLs by both methods (Table 2(a)) and had a ‘moderate’ level of correspondence.
To understand the reasons for this difference, all 38 subjects where there was a discrepancy were reviewed blind by an experienced clinician. Of these, 16 subjects were assigned a different outcome. These subjects were further reviewed and in 14, it was concluded that the software assigned the correct classification according to the ‘Belfast’ rules and the difference was as a result of clinical judgement. In the two remaining subjects, the software had incorrectly designated the cortex as a SigRLL or it had misinterpreted an artefact as a SigRLL. The former being more likely with tight fitted oversize stems. This review illustrated the subjective nature of manual, clinician based RLL assessment which is not fixed and may be prone to changes and reinforces the need for a more objective methodology. It also demonstrated that whilst one of the aims of this study was to develop software which would mirror the results obtained by the experienced observer using the Manual method, this may not be the most appropriate goal. This is especially important when examining the development of RLLs over time a using a longitudinal series of radiographs. It also raises the question of whether clinical judgement has changed over time. The original observations were made at least 5 years prior to the discrepancy review outlined above.
A similar study was carried out by Pegg et al. 10 and although site of interest (knees) was different, the results were similar; their software had an average Area Under Curve value of 0.82, which represented a ‘good’ agreement between the manual and the semi-automated assessment. In this study, the agreement between Auto and Manual AP/Lat was moderate. However, the aim in this study was to minimise the number of false negatives, not to optimise agreement.
Use of AP and lateral or AP only radiographs in analysis
The Auto AP method reduced the number of subjects identified with SigRLLs compared to that with Auto AP/Lat method from 67 to 51, the difference was mainly caused by the identification of shadows in zones 8 and 14 of the Lat radiograph as SigRLLs which an experienced observer would likely disregard hence making the Auto AP method less likely to produce a false positive.
Some previous studies have assumed that both AP and Lat radiographs are needed to reliably detect RLLs, 11 whereas others have recommended only AP radiographs need to be reviewed. 8 In this study using Auto AP compared with Auto AP/Lat method resulted in the same RLL classification in 93.2% of subjects with a kappa value of 0.81. This demonstrated that the use of AP radiographs alone can be used to identify the development of SigRLLs, obviating the need for Lat radiographs. This is of interest as many institutions do not routinely take Lat radiographs.
The progression of SigRLLs
The total number of subjects by cohort at each time point is shown in Table 3. In this study, 131/237 (55.3%) of subjects had a 4–7 Y review and an AP radiograph with 51 of these (38.9%) exhibiting SigRLLs. The general trend, identified via analysis using the Auto AP method, was for the incidence of SigRLLs to increase up to the 4–7 Y time point with modest changes thereafter. Of the 28 subjects who had SigRLLs at 10 Y and a 4–7 Y review, 23 (82.1%) had either BenRLLs or SigRLLs at the 4–7 Y review (Table 3(c)). At the 1 Y review this value was three subjects (2.3%) with SigRLLs. This indicated that an intermediate (4–7 Y) review was a useful predictor of longer-term changes (>10 Y) whereas an early review (1 Y) was not.
Thirteen subjects who had SigRLLs at 4–7 Y had BenRLLs or NoRLLs at 10 Y (Table 3(d)). A review of these indicated that in seven subjects this was a result of small changes in either line thickness and/or length in proximal zone 1. In four cases, the 10 Y radiograph exhibited only very faint lines resulting in no SigRLLs being detected. In the two remaining subjects, a manual inspection showed that the 4–7 and 10 Y radiographs were visually identical.
Correspondence of RLLs with clinical outcomes
In this study all three methods (Auto AP/Lat, Man AP/Lat and Auto AP) linked increased Oxford pain score with the incidence of SigRLLs at 10 Y but not the overall OHS.
To date in this series, 15 subjects underwent further surgery for mechanical reasons subsequent to the 10 Y review. These comprised five subjects with a stem revision for loosening of which (using the AP method) four had SigRLLs at 10 Y and all of these subjects which had 4–7 Y radiographs (three out of four, one radiograph was missing) had SigRLLs at this intermediate time period. Ten subjects underwent non-revision treatment for peri-prosthetic fracture of which three had SigRLLs at 10 Y and none of these had SigRLLs at 4–7 Y. This indicates there was a partial correspondence between the incidence of RLLs and clinical outcomes requiring a further surgical intervention and suggests that this link was stronger in stem revision for loosening than re-operation for peri-prosthetic fracture. However, the number of revisions was small and the majority of subjects with SigRLLs at either or both 4–7 Y and 10 Y time points did not require revision within the timescale of this study. A confounding factor was that the revision time for these 15 subjects was up to 6 Y after the 10 Y review. Radiographs prior to revision were not available for this study and it is possible that SigRLLs may have developed in the intervening period. Interestingly, the previous study of these subjects 11 noted that of all the procedures carried out with this implant design, 16 were excluded because they revised prior to the 10 Y review. Of these, six were revised for stem loosening and all of these were determined to have significant RLLs when assessed by a clinician using a manual method. Previous studies 8 also identified a link between RLLs and revision but suggested that this was related to RLLs >2 mm not >1 mm as found in this in this study.
Limitations
In this study, only one stem design was considered comprising a fully hydroxy-apatite coated macro-textured stem of standard length. Differences in stem geometry and fixation methodology makes applicability to other designs difficult. This would be especially apparent in short stems which are also likely to have significantly different patient demographics.
The primary purpose of this study was not to make comparisons between the various design differences because this was explored previously with the 10 Y radiographs of the same subjects. 11 Given the differences between design variants found previously, the cohorts were presented separately in Table 3 for completeness, but readers should refer to the previous study for more extensive discussion of these findings. 11
This semi-automated method still requires a brief manual review and, if necessary, correction of the output. This is currently unavoidable as cases with poor-quality, low contrast radiographs, or where artefacts were present are not uncommon.
Further work
Further work needs to be performed to make the automated detection of RLLs a practical monitoring tool. Firstly, further refinement of the ‘Belfast rules’ to reflect the clinical decision-making process. Secondly, understand the relationship between the incidence of SigRLLs and any other radiological changes which may lead to loosening and revision. Thirdly, assessment of the applicability of this method to other hip implant systems. Finally, having characterised the RLLs, this dataset could be used as a training set for an Artificial Intelligence algorithm.
Conclusions
In summary, when the subjects were divided into two groups (NoSigRLL and SigRLL) the semi-automated software (Auto AP/Lat method) and the Manual A/P method agreed in 199/237 (84.0%) of subjects. These discrepancies comprised seven false negatives and 31 false positives. The Auto AP/Lat and AP methods agreed in 221/237 (93.2%) of subjects.
Overall, for subjects in this study, the incidence of SigRLLs increased up to the 4–7 Y time point with small changes thereafter up to 10 Y. Incidence of SigRLLs at 10 Y was associated with their presence at a 4–7 Y review but not at 1 Y.
The incidence of SigRLLs at the 10 Y time point were related to increased pain but not the overall OHS and in this series was a possible indicator for a future re-operation for stem loosening but not peri-prosthetic femoral fracture.
Supplemental Material
sj-docx-1-pih-10.1177_09544119261451379 – Supplemental material for Radiolucent lines in a cementless hip stem: The use of semi-automated measurements to monitor progression over a 10 year period
Supplemental material, sj-docx-1-pih-10.1177_09544119261451379 for Radiolucent lines in a cementless hip stem: The use of semi-automated measurements to monitor progression over a 10 year period by Graham H. Isaac, Rosyln S. Cassidy, Janet C. Hill, Gregory M. Pryce, Sophie Williams, Ruth K. Wilcox and David E. Beverland in Proceedings of the Institution of Mechanical Engineers, Part H: Journal of Engineering in Medicine
Supplemental Material
sj-docx-2-pih-10.1177_09544119261451379 – Supplemental material for Radiolucent lines in a cementless hip stem: The use of semi-automated measurements to monitor progression over a 10 year period
Supplemental material, sj-docx-2-pih-10.1177_09544119261451379 for Radiolucent lines in a cementless hip stem: The use of semi-automated measurements to monitor progression over a 10 year period by Graham H. Isaac, Rosyln S. Cassidy, Janet C. Hill, Gregory M. Pryce, Sophie Williams, Ruth K. Wilcox and David E. Beverland in Proceedings of the Institution of Mechanical Engineers, Part H: Journal of Engineering in Medicine
Footnotes
Acknowledgements
The authors would like to thank Professors Hemant Pandit, Tim Board and Steve Young for assessing the initial set of 10 radiographs that were used to fine tune the automated software.
Funding
The authors disclosed receipt of the following financial support for the research, authorship, and/or publication of this article: The authors received financial support from Depuy Synthes, Warsaw, Indiana, USA for the research associated with this article. The authors would also like to thank Trauma and Orthopaedics Research Charity (TORC) for the provision of support in carrying out this study (TORC charity number; NIC105791).
Declaration of conflicting interests
The authors declared the following potential conflicts of interest with respect to the research, authorship, and/or publication of this article: Author G.H.I is a committee member of the Orthopaedic Data Evaluation Panel (ODEP). Author R.S.C. No conflicts of interest. Author J.C.H. No conflicts of interest. Author G.P. No conflicts of interest. Author S.W has received research funding from DePuy Synthes. Author R.W. has received research funding from DePuy Synthes and is an Editorial Board Member of the Proceedings of the Institute of Mechanical Engineers, Part H: Journal of Engineering in Medicine. Author D.B. Is a paid consultant for and receives royalties from DePuy Synthes.
Supplemental material
Supplemental material for this article is available online.
References
Supplementary Material
Please find the following supplemental material available below.
For Open Access articles published under a Creative Commons License, all supplemental material carries the same license as the article it is associated with.
For non-Open Access articles published, all supplemental material carries a non-exclusive license, and permission requests for re-use of supplemental material or any part of supplemental material shall be sent directly to the copyright owner as specified in the copyright notice associated with the article.