
Abstract
Clinical health record data are used for HIV surveillance, but the extent to which these data are population representative is not clear. We compared age, marital status, body mass index, and pregnancy distributions in the Central Africa International Databases to Evaluate AIDS (CA-IeDEA) cohorts in Burundi and Rwanda to all people living with HIV and the subpopulation reporting receiving a previous HIV test result in the Demographic and Health Survey (DHS) data, restricted to urban areas, where CA-IeDEA sites are located. DHS uses a probabilistic sample for population-level HIV prevalence estimates. In Rwanda, the CA-IeDEA cohort and DHS populations were similar with respect to age and marital status for men and women, which was also true in Burundi among women. In Burundi, the CA-IeDEA cohort had a greater proportion of younger and single men than the DHS data, which may be a result of outreach to sexual minority populations at CA-IeDEA sites and economic migration patterns. In both countries, the CA-IeDEA cohorts had a higher proportion of underweight individuals, suggesting that symptomatic individuals are more likely to access care in these settings. Multiple sources of data are needed for HIV surveillance to interpret potential biases in epidemiological data.
Introduction
The Joint United Nations Program on HIV/AIDS’s (UNAIDS) “Know your epidemic, know your response” strategy emphasizes the need for sound data to understand and effectively combat the HIV/AIDS epidemic in different contexts. 1 Moving beyond the traditional focus on incidence and prevalence estimates, UNAIDS and the World Health Organization (WHO) have called for high-quality data collection that complements existing HIV surveillance systems and enables monitoring of local and national response strategies.2,3
Routine data from medical records are increasingly recognized as an important source of information about the HIV epidemic, particularly with the scale-up of HIV care and treatment.2,4,5 One such source of clinical data is the International epidemiology Databases to Evaluate AIDS (IeDEA), established in 2006 with funding from the United States (US) National Institutes of Health (www.iedea.org). This research consortium routinely collects, harmonizes, and analyzes clinical data of patients receiving care for HIV infection from medical records to address research questions and streamline HIV/AIDS research.6,7 IeDEA’s Central Africa cohort, Central Africa International epidemiology Databases to Evaluate AIDS (CA-IeDEA) aggregates data from HIV care and treatment clinics in Burundi, Cameroon, the Democratic Republic of Congo (DRC), the Republic of Congo (Congo), and Rwanda.6,7 The HIV response in Central Africa, especially Cameroon, the DRC, and Congo, has faced significant challenges due to lack of political support and poor resources compared to other areas in sub-Saharan Africa,6,7 making supplemental data, such as those collected through CA-IeDEA, important for informing the epidemic response in these countries.
However, the extent to which clinical health record data can be used for population-level surveillance is not clear 8 as there are selection processes by which individuals decide to seek testing and care, and among those who do, which clinic they select, which could change over time. To document the average HIV treatment cascade in a given country, for example, requires a population-representative sample of people living with HIV (PLWH) in care. Elm et al.’s STROBE guidelines for “strengthening the reporting of observational studies” call attention to the importance of establishing a study’s population representativeness, both to discourage hyperbolic reporting of results and to improve research methodology. 9 The IeDEA cohorts have been used for descriptive and scientific studies, examining, for example, the availability of tuberculosis screening in HIV treatment programs 10 and outcomes among infants exposed to HIV in utero, respectively. 11 For descriptive studies, understanding whom the cohort represents is essential and helps justify the use of such studies for guiding and improving policy and interventions.6,7,12
We sought to assess the extent to which the characteristics of PLWH in the CA-IeDEA cohort are similar to those of PLWH identified in the Demographic and Health Surveys (DHS) to inform how CA-IeDEA complements existing surveillance. Given available data, we compared the distribution of key sociodemographic and clinical characteristics—age, marital status, and body mass index (BMI) by sex, as well as women’s pregnancy status—among the CA-IeDEA cohorts in Burundi and Rwanda against the PLWH populations estimated by probability-sampled national DHS data in these two countries at multiple points in time. We focused on Burundi and Rwanda based on availability of CA-IeDEA and DHS data. Historically, the HIV surveillance programs in Rwanda and Burundi have relied on antenatal sentinel reporting; Rwanda is now implementing case-based surveillance from clinical settings. 13
Methods
Data sources
Demographic and Health Surveys use a multistage, probabilistic sampling design to be population-representative at the national and regional level by urban–rural residence.14,15 DHS HIV testing data are considered reliable estimates of national and regional HIV prevalence and can be linked to all sociodemographic variables collected through the surveys. 16 The DHS uses blood spots on filter paper from a finger prick to test for HIV using an enzyme-linked immunosorbent assay (ELISA) test, with retesting of all positive tests and 5–10% of negative tests, and a new ELISA or western blot for conflicting ELISA results. 17 HIV testing data are available from the Burundi DHS of 2010–2011 and 2016–2017 and from the Rwanda DHS of 2005, 2010–2011, and 2014–2015. 18 All five DHS surveys had high response rates at or above 96% for urban women and at or above 93% for men.15,19–22 HIV testing rates were above 89% for eligible urban women and above 87% for eligible men.15,19–22 The DHS datasets do not include a variable indicating engagement in care. Therefore, we used DHS participants’ report of having received the result of a prior HIV test as a proxy for engagement in the HIV treatment continuum. We performed one comparison using this subset of PLWH and another with all PLWH, regardless of their prior testing report in the two countries.
The CA-IeDEA cohort eligible for this study included all patients enrolled in HIV care between 1 January 2000 and 30 September 2018 at health centers and hospitals that participate in CA-IeDEA in Burundi (n = 3) and Rwanda (n = 10) (see Supplementary Appendix A for map of clinic locations). The CA-IeDEA sites are predominantly public sector clinics, selected because of their high HIV caseloads, and represent three out of 36 health facilities that provided HIV care in the capital province of Burundi and 10 out of 44 health facilities providing HIV care in the capital province of Rwanda. HIV service delivery and patient recordkeeping at CA-IeDEA sites are aligned with national guidelines; service provision is not influenced by their participation in this observational study. The initial sample included 44,468 individual patients in Burundi and Rwanda. To compare patients in longitudinal CA-IeDEA databases to cross-sectional DHS data, we identified patients with a clinic visit within 365 days of the midpoint of the data collection period for each year of the DHS survey and used IeDEA measures closest to the respective DHS survey midpoint. We considered patients with a visit record within 365 days before or after each DHS survey mid-date to be “active” in care at the time of the respective DHS. We excluded patients if they were missing a birth date or had an implausible birth date or date of enrollment in care (i.e., birth date following the date of enrollment into HIV care or death date or enrollment following death date). In addition, we excluded all visits with implausible dates (e.g., visits preceding birth or enrollment date and visits succeeding death date). To be consistent with DHS sampling procedures, we further excluded women over the age of 49 years, men over the age of 59 years, and children under 15 years of age. Excluded adults comprised 3% of the Rwanda CA-IeDEA data in 2005, 5% in 2011, and 9% in 2015, while they represented 12% and 20% of the Burundi cohorts in 2011 and 2017, respectively. After applying these criteria and excluding non-active patients, 28,478 unique patients remained in the CA-IeDEA cohort (Figure 1). Central Africa International epidemiology Databases to Evaluate AIDS cohort sample sizes by sex and relevant Demographic and Health Surveys, total before exclusion criteria, and those used for analysis after exclusion criteria.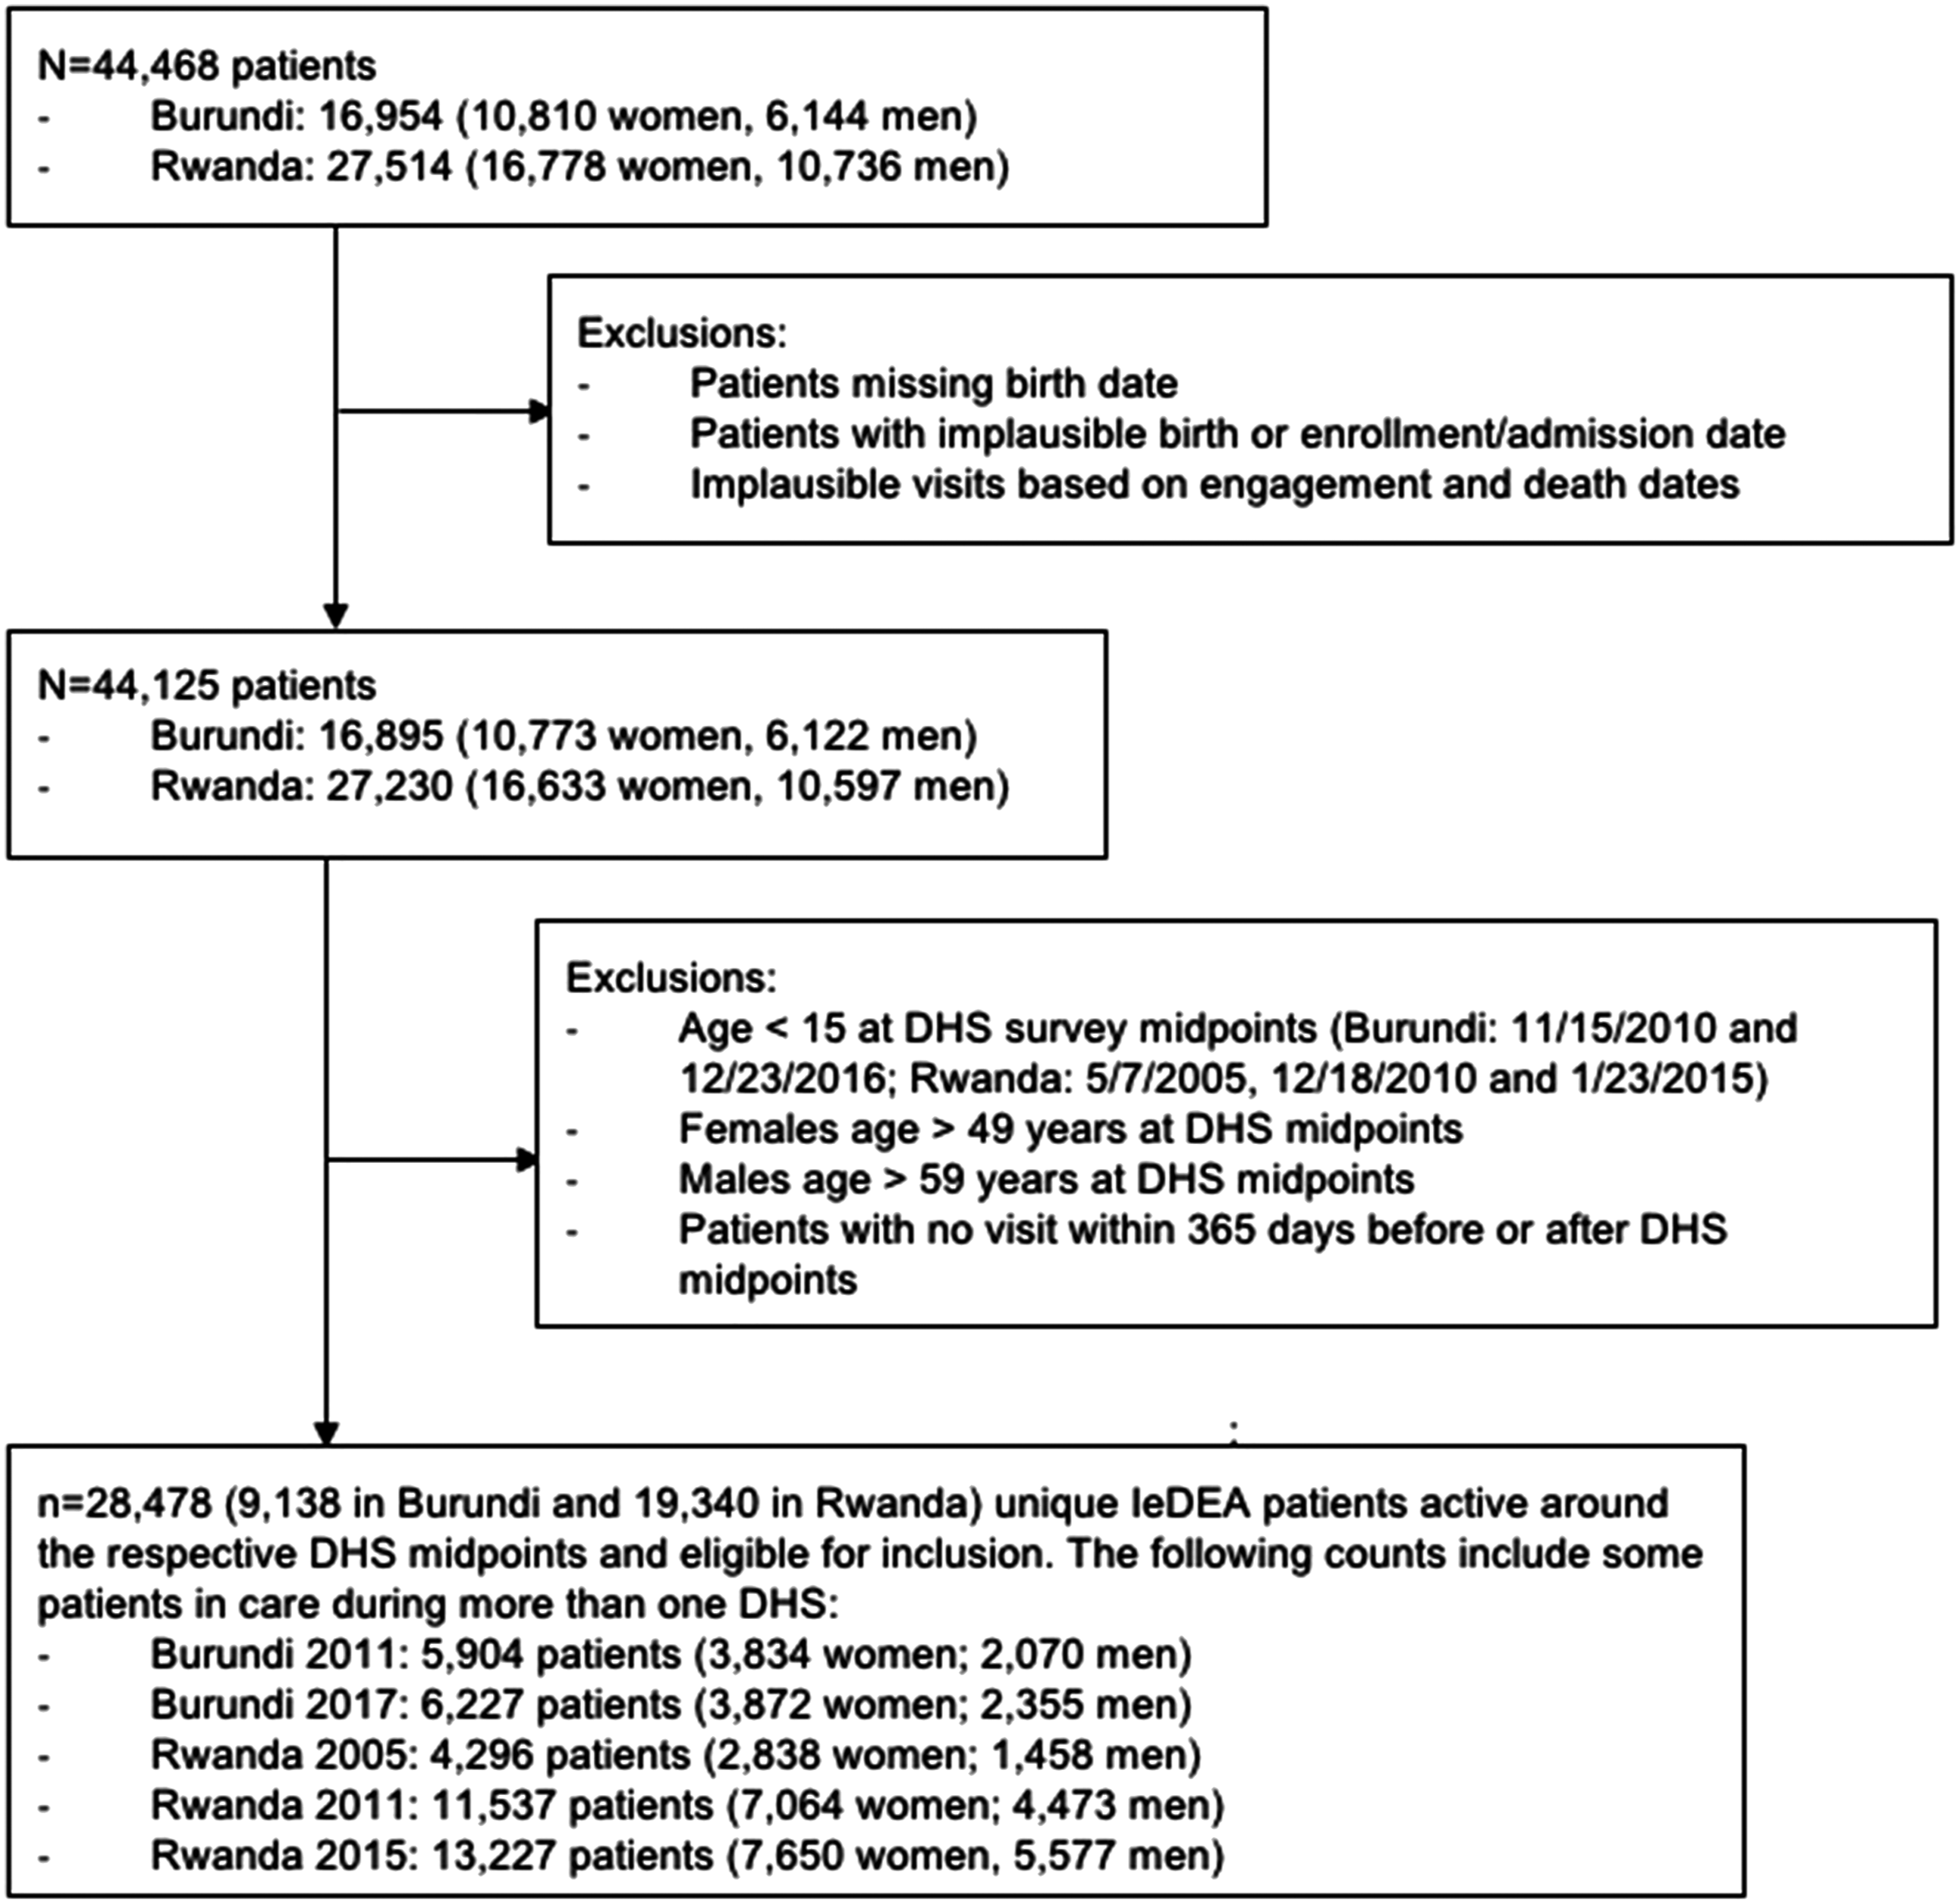
Measures
As all CA-IeDEA sites in Rwanda and Burundi are located in areas classified as urban by national censuses,23–25 we restricted our comparison to adult DHS respondents residing in urban areas in both countries. We compared age, marital status, BMI, and pregnancy status between the CA-IeDEA cohort and two DHS populations—those who reported having received their HIV result as a proxy for individuals in clinical care and all who tested positive. We focused on these characteristics because age and urban versus rural residence are correlated with retention in HIV care and with treatment outcomes and mortality in sub-Saharan Africa.26–30 Further, studies have found associations between sex and uptake of HIV care and services,31,32 medication adherence, 33 and HIV treatment outcomes and mortality. 34 Marital status has been found to be associated with retention in care for pregnant women 35 and might be interpreted as a proxy for family support, a determinant of HIV treatment adherence among populations in sub-Saharan Africa.33,36 We included BMI as an indicator of disease progression 37 and predictor of survival 38 among PLWH as the DHS surveys do not include data on immunological status.
For time-varying CA-IeDEA data patient characteristics—age, marital status, and BMI—we used clinical data observations closest to the respective DHS survey midpoint. We calculated patient age at each survey midpoint and categorized them into 5-year age-groups to align with DHS data. We recoded marital status groups to match between the datasets and combined the functionally synonymous categories “married” and “living with partner” as well as “divorced” and “separated.” If contradictory marital statuses were recorded on the same date, we recoded them as missing. For patients with incomplete data for height, weight, and marital status, we imputed missing values from the patient’s closest visit (either before or after). Pregnancy status was available only for women in the Burundi CA-IeDEA cohort. For patients with recorded pregnancy status, we considered them to be pregnant at the time of the survey if either the date of last menstrual period was within 280 days prior to the start of the observation time or if the date of delivery was within 280 days after the observation time.
We omitted weight measurements recorded on visits more than 365 days from the respective survey midpoint. If patients had more than two different height or weight measurements on the same date, we selected the modal weight. If there were only two measurements, we selected the higher value as a manual review of such cases indicated that lower values appeared implausible, likely because of errant decimal points. We further eliminated biologically implausible outliers in height and weight measurements using each DHS survey’s entire adult survey population as a reference population for height and weight measurements for the respective cross-sectional CA-IeDEA cohort. 39 We coded as missing any height and weight measurements in the CA-IeDEA dataset that were 10% smaller than the lowest value in the entire adult DHS population or 10% larger than the highest value. BMI was calculated as (weight (kg)/[height (cm)]2 × 10,000) and categorized as “underweight” (< 18.5), “normal” (18.5–25), “overweight” (25–30), and “obese” (> 30). 40 Pregnant women (Burundi only) were excluded from the BMI comparisons. BMI data were not available in all DHS surveys as indicated in the results.
Statistical analysis
We compared the distributions of age, marital status, BMI, and pregnancy status (Burundi only) by sex of active patients in the two CA-IeDEA cohorts against population-representative DHS data of (1) adults who tested positive for HIV and reported receiving the results of a prior HIV test and (2) all individuals who tested positive. Significant differences between the CA-IeDEA and DHS proportions were estimated using two-proportion z-tests.8,41 We also calculated Cohen’s h, an effect size measure for proportions, for each group comparison. Cohen’s h (calculated as h = |2*arcsine(√P1) – 2*arcsine(√P2)|) does not take sample size into account and can complement statistical significance tests.42–44
We performed analyses using SAS version 9.4 (Cary, NC) accounting for DHS’s complex survey design, including country-specific strata and clusters.45,46 To adjust for individuals’ different likelihoods of being selected for the survey, we applied DHS-provided sampling weights for the HIV testing results, which incorporate adjustment for HIV nonresponse and supersede other sampling weights when the HIV dataset is merged with the women’s, men’s, and household members’ datasets.
We generated population pyramids of the comparison variables, stratified by sex, to visualize the results. To facilitate interpretation of the graphs, Cohen’s h effect sizes were overlaid on the pyramid bars, categorized as small (< 0.30), small to medium (0.30–0.40), medium (0.40–0.60), medium to large (0.60–0.70), and large (>0.70), with statistical significance indicated. 44
Ethics
All data used in this analysis were de-identified prior to transfer and considered secondary data analysis. CA-IeDEA and DHS both reviewed and approved access to the relevant datasets for this analysis. We followed all usage restrictions to ensure the privacy and security of the data.
Results
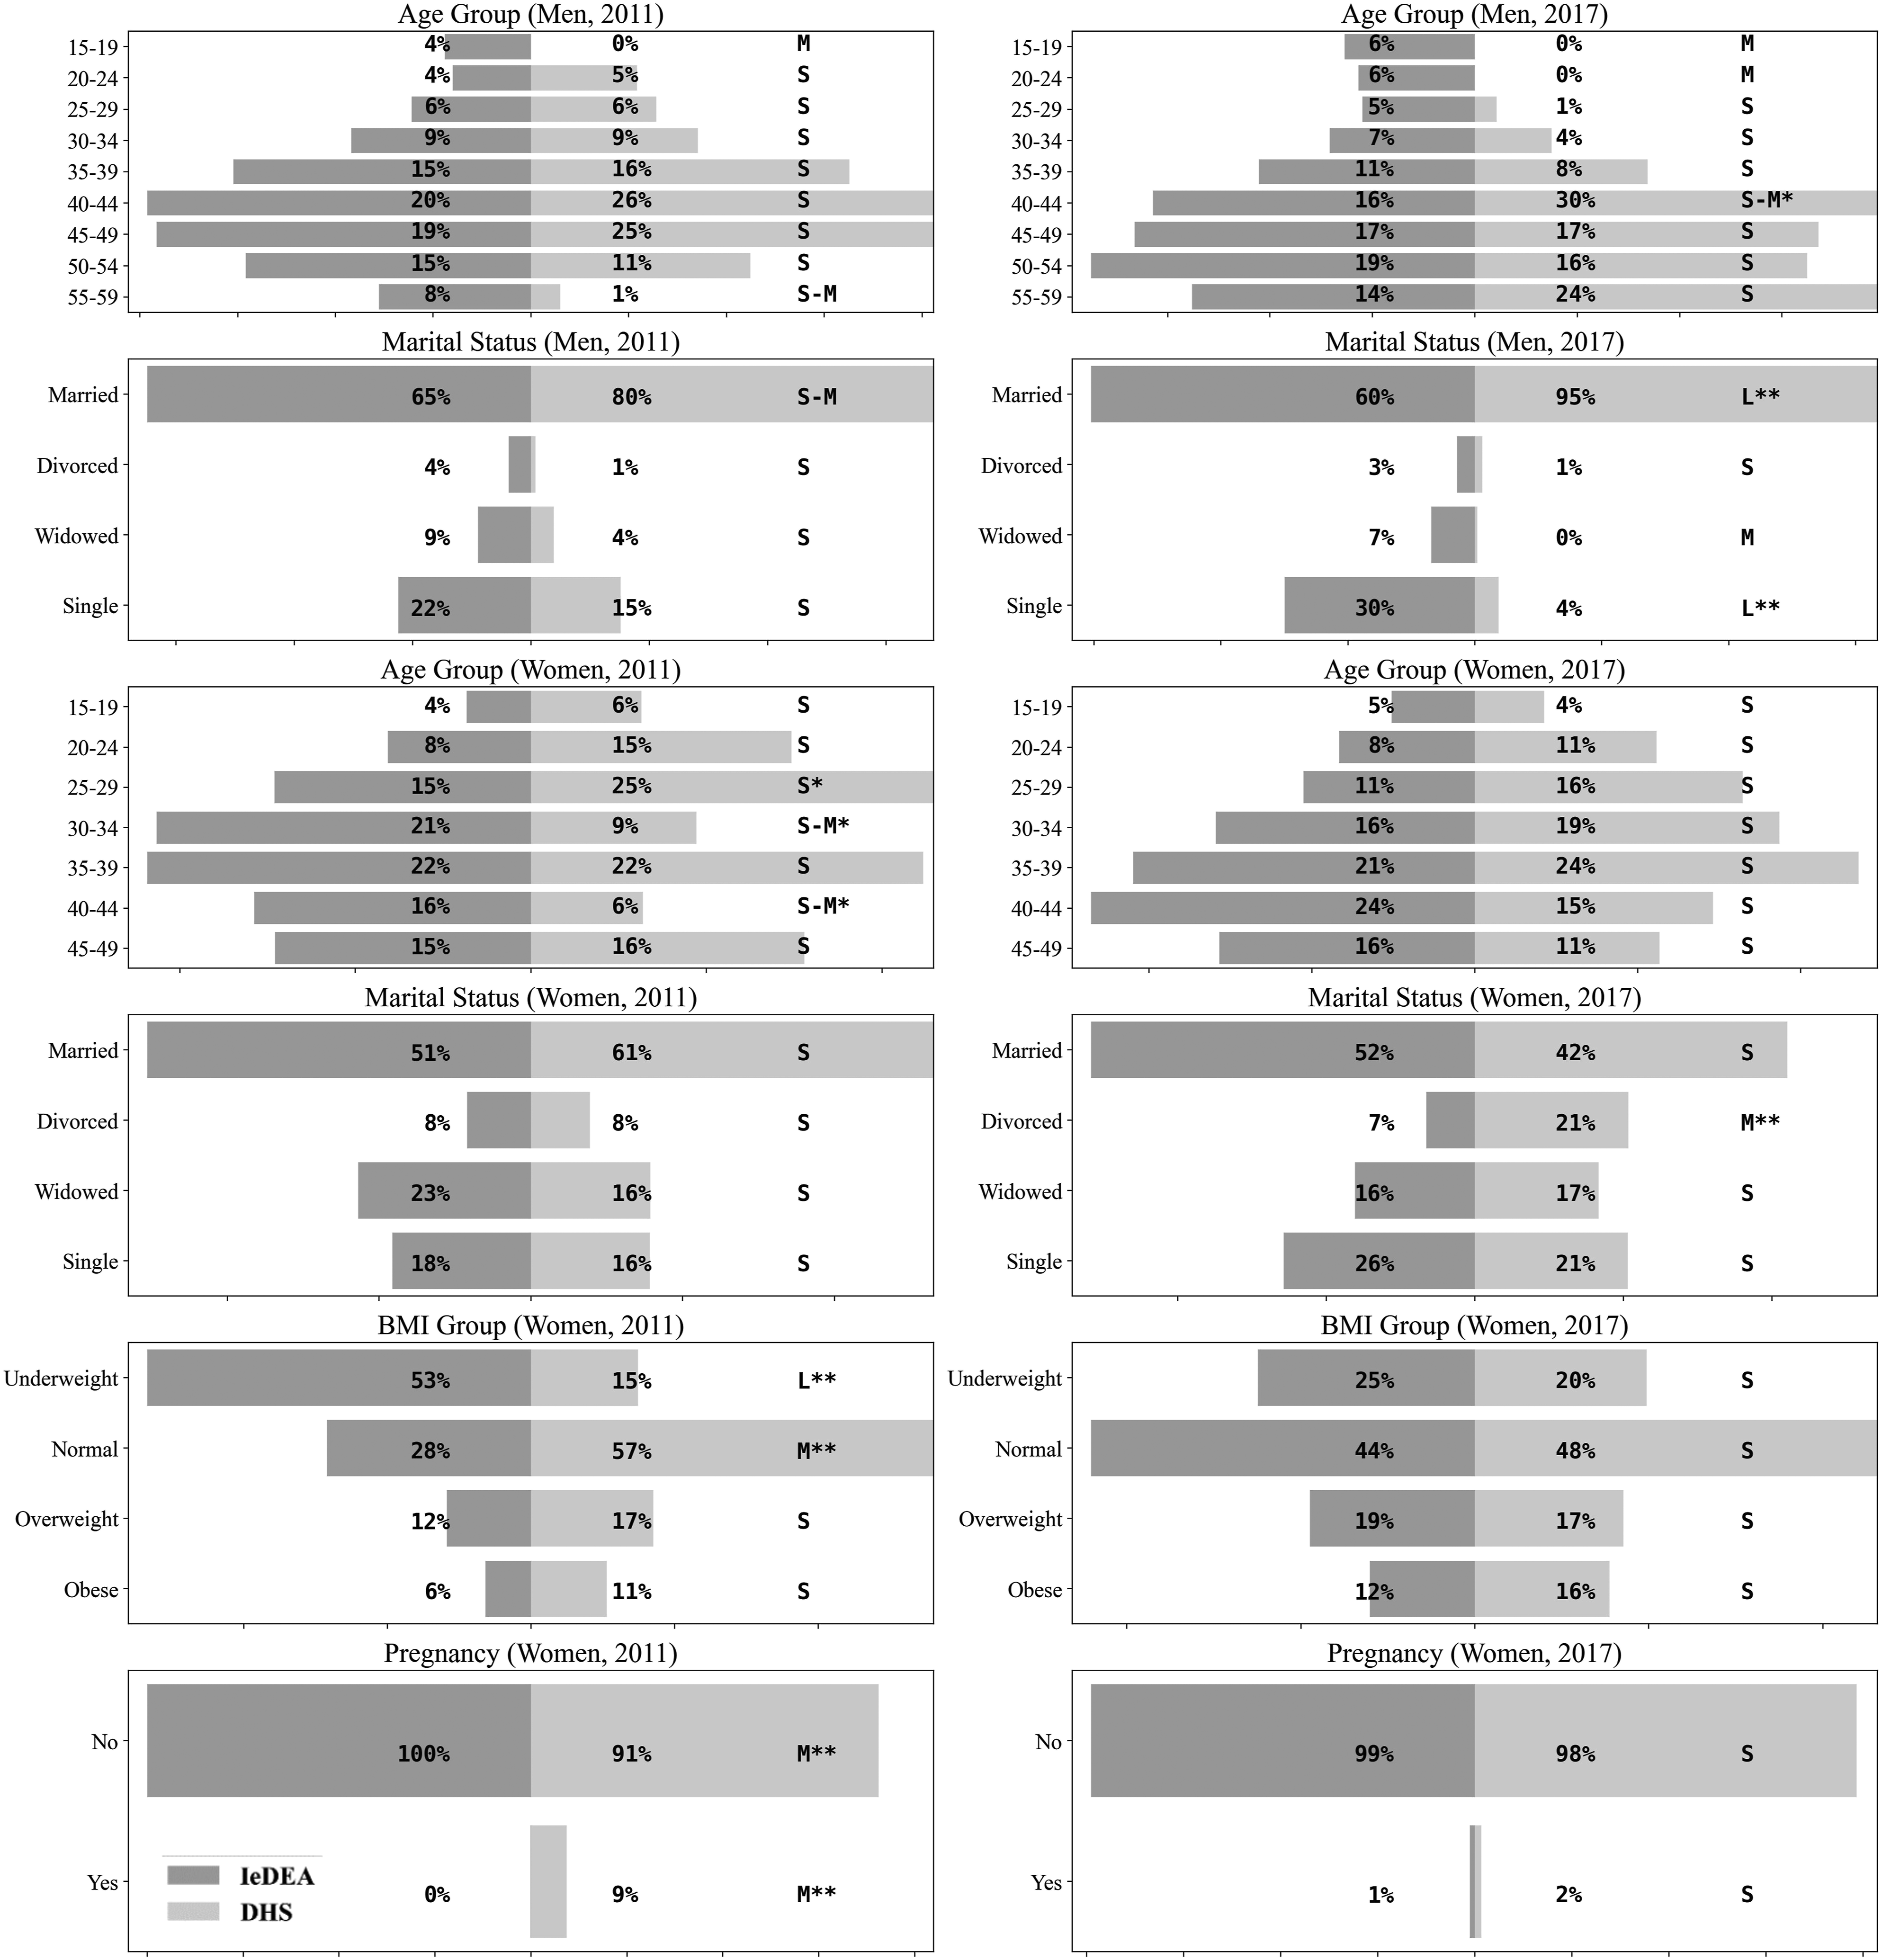
The distribution of sex was similar between CA-IeDEA and DHS data across years and countries, with 28.0–30.0% male in Burundi DHS compared to 35.1–37.8% in IeDEA and 33.9–39.0% male in Rwanda DHS compared to 35.0–42.0% in IeDEA (Cohen’s h 0.02–0.21). In the comparison of those currently in HIV care from the CA-IeDEA cohort with the DHS sample who reported having received a previous HIV test result in Burundi, the age distribution of urban men had some differences, most notably a higher proportion of men in the 15–19 and 20–24 age-groups in CA-IeDEA than in the DHS data for both 2011 and 2017 (Figure 2). Similarly, there was a greater proportion of single men in the CA-IeDEA cohort than in the DHS sample, which had a higher proportion of married men. For urban women, the distributions of age and marital status were similar for the CA-IeDEA cohort and the DHS data, although there was a higher proportion of divorced/separated women in DHS data in 2017 (Figure 2). The BMI distributions were different, with a higher proportion of underweight women in the CA-IeDEA cohort in 2011 than in the DHS data. There was a slightly smaller proportion of pregnancies in the CA-IeDEA cohort than in the DHS data. The same patterns were seen in the comparisons with all PLWH in the DHS data (Figure 3). Comparison of characteristics between Central Africa International epidemiology Databases to Evaluate AIDS patients and urban, HIV-positive Demographic and Health Survey participants who reported having received the result of a previous HIV test in Burundi across the two Demographic and Health Survey timepoints. *p < 0.05, **p < 0.01; Cohen’s h: < .30 = S (small), .30–.40 = S–M (small to medium), .40–.60 = M (medium), .60–.70 = M–L (medium to large), >.70 = L (large). “Married” includes married persons and those living with their partners. “Divorced” includes divorced persons and those separated from their spouse or domestic partner. Comparison of characteristics between Central Africa International epidemiology Databases to Evaluate AIDS patients and all urban, HIV-positive Demographic and Health Survey participants in Burundi across the two Demographic and Health Survey timepoints. * p < 0.05, ** p < 0.01; Cohen's h: < .30 = S (small), .30–.40 = S–M (small to medium), .40–.60 = M (medium), .60–.70 = M–L (medium to large), >.70 = L (large). “Married” includes married persons and those living with their partners. “Divorced” includes divorced persons and those separated from their spouse or domestic partner.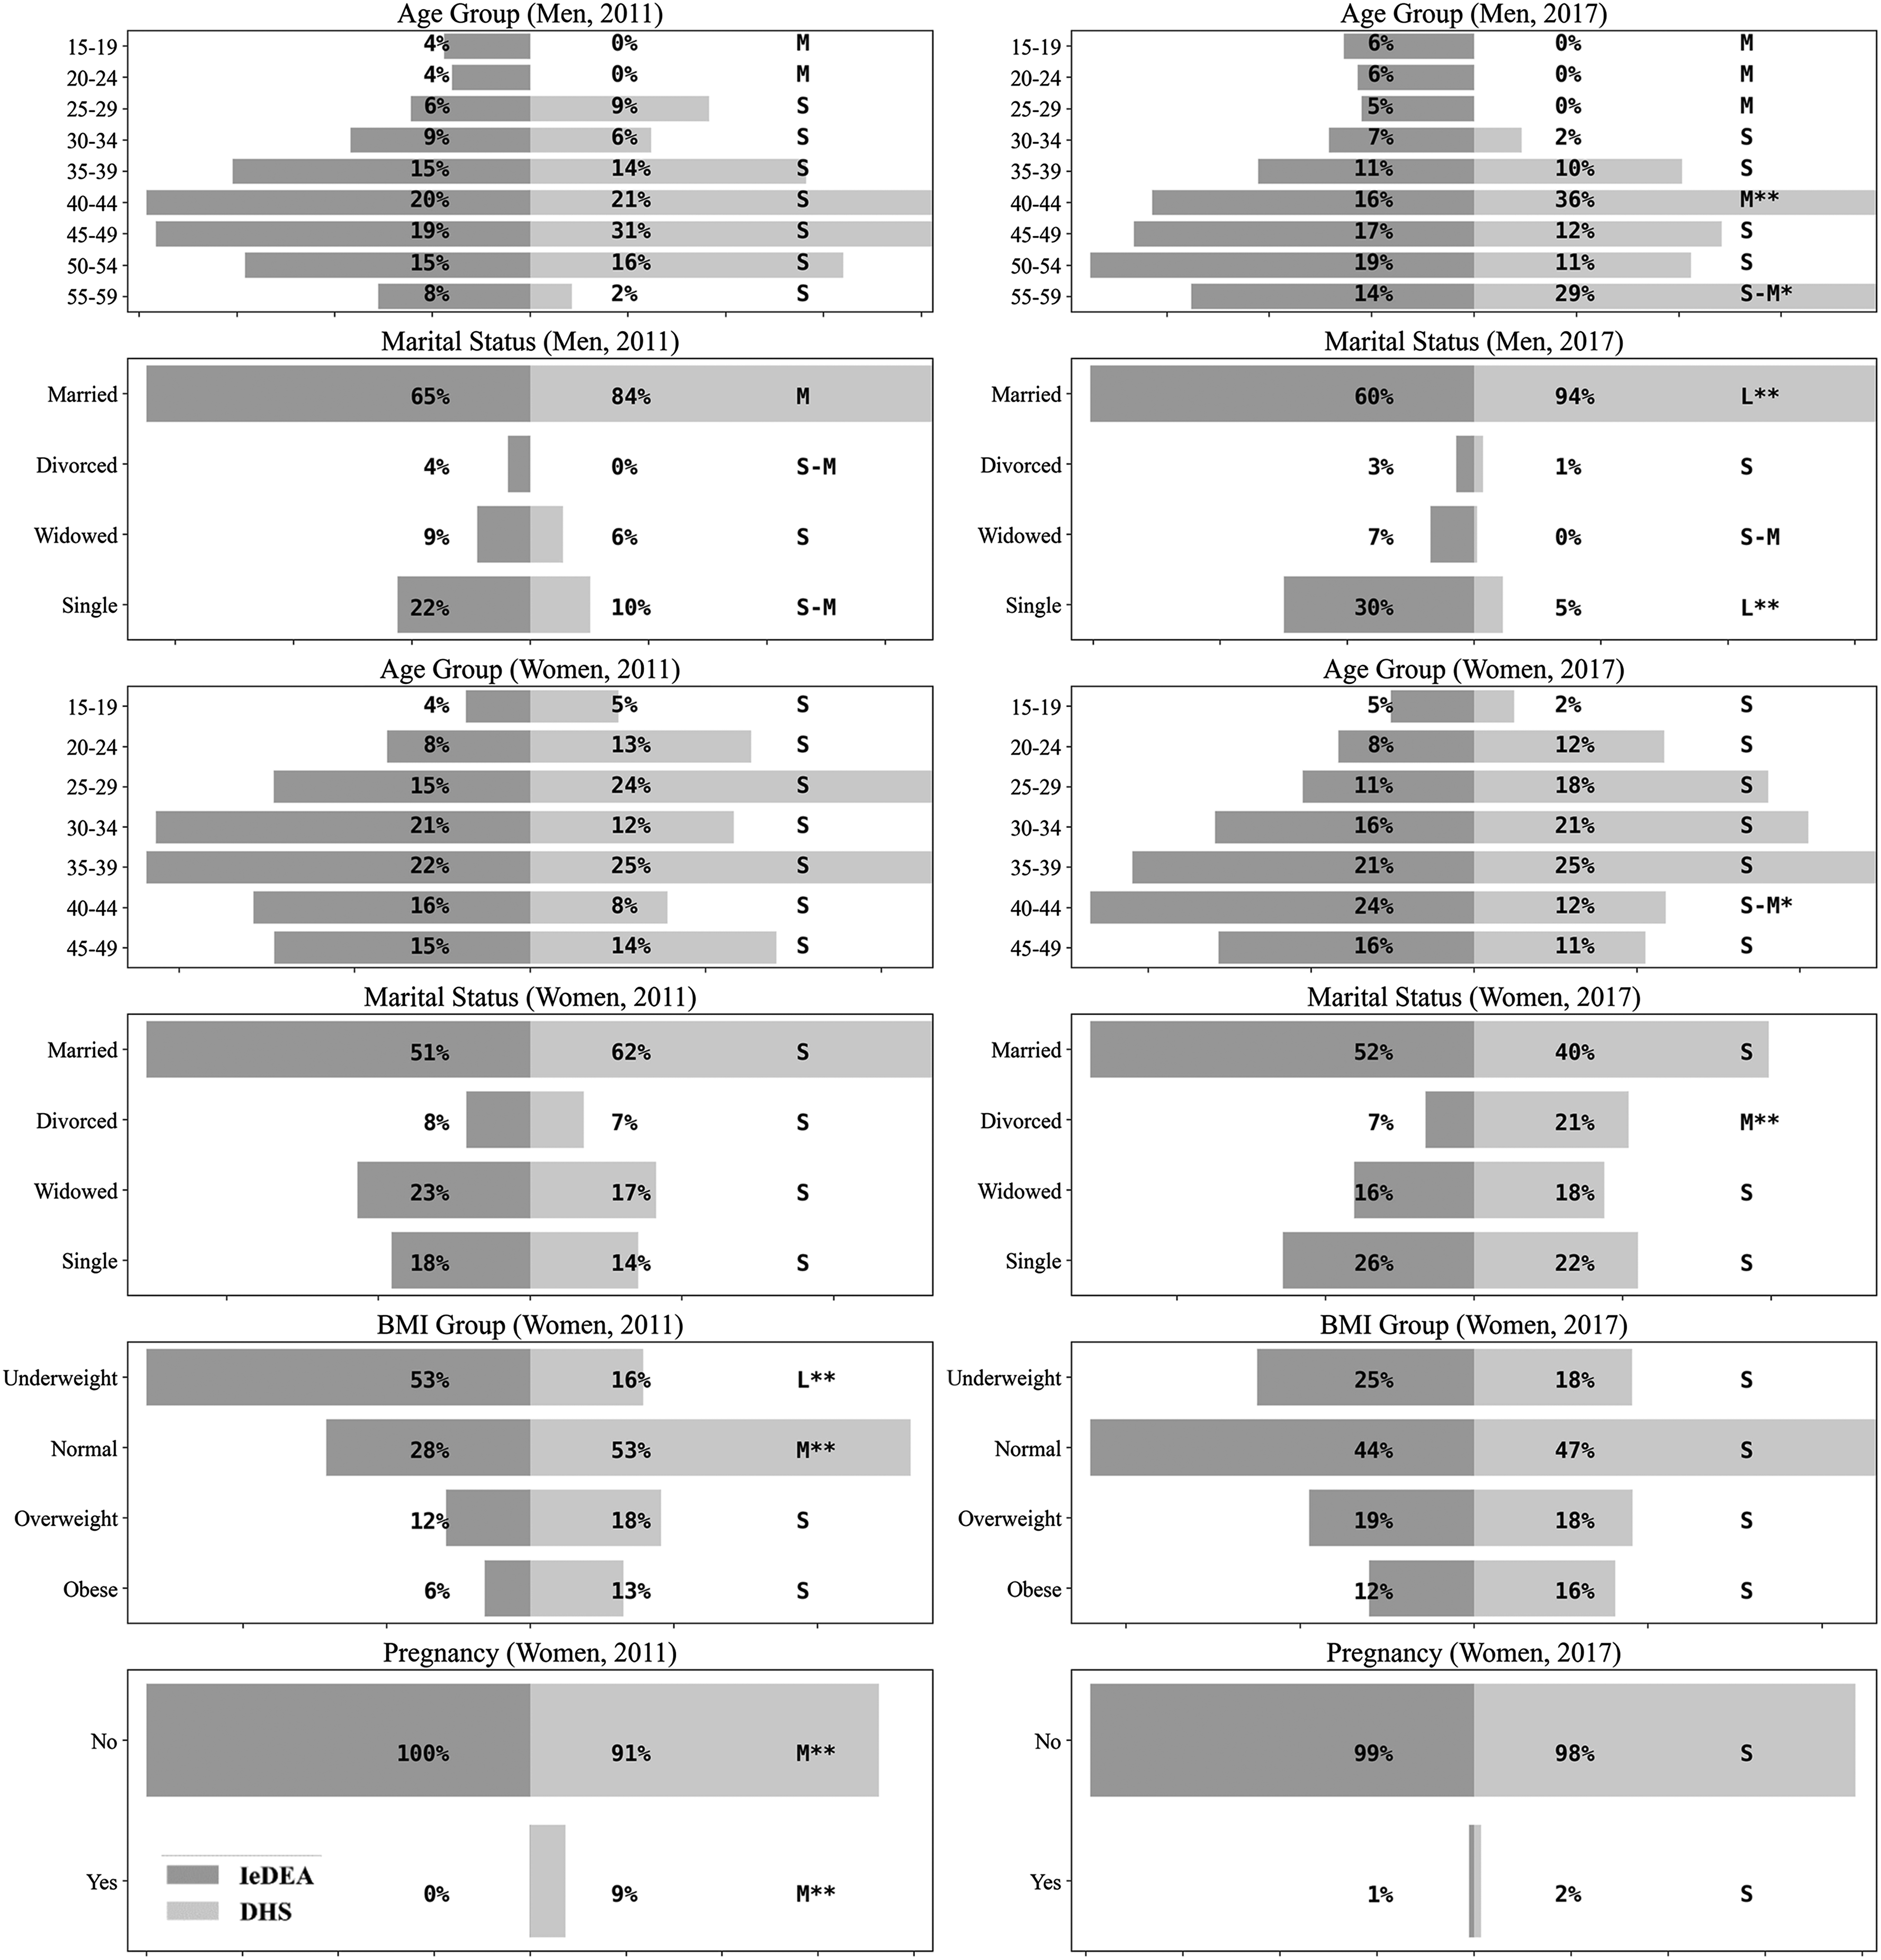
In Rwanda, for the comparison of the CA-IeDEA cohort with the DHS sample who reported having received a previous HIV test result, the age distribution and marital status for men in urban areas were similar across all years, although the DHS data tended to have a slightly higher percentage of married men (Figure 4). For urban women, the age and marital status distributions were similar, although there was a higher proportion of widowed women in the CA-IeDEA cohort in 2005 than in DHS sample, which had a greater proportion of divorced women (Figure 4). For both sexes, there were more underweight individuals in the CA-IeDEA cohort than in the DHS data. The same patterns were seen in the comparison with all PLWH in the DHS data (Figure 5). Comparison of characteristics between Central Africa International epidemiology Databases to Evaluate AIDS patients and urban, HIV-positive Demographic and Health Survey participants who reported having received the result of a previous HIV test in Rwanda across the three Demographic and Health Survey timepoints. * p < 0.05, ** p < 0.01; Cohen's h: < .30 = S (small), .30–.40 = S–M (small to medium), .40–.60 = M (medium), .60–.70 = M–L (medium to large), >.70 = L (large). “Married” includes married persons and those living with their partners. “Divorced” includes divorced persons and those separated from their spouse or domestic partner. No data available where graphs are missing. Comparison of characteristics between Central Africa International epidemiology Databases to Evaluate AIDS patients and all urban, HIV-positive Demographic and Health Survey participants in Rwanda across the three Demographic and Health Survey timepoints. * p < 0.05, ** p < 0.01; Cohen's h: < .30 = S (small), .30–.40 = S–M (small to medium), .40–.60 = M (medium), .60–.70 = M–L (medium to large), >.70 = L (large). “Married” includes married persons and those living with their partners. “Divorced” includes divorced persons and those separated from their spouse or domestic partner. No data available where graphs are missing.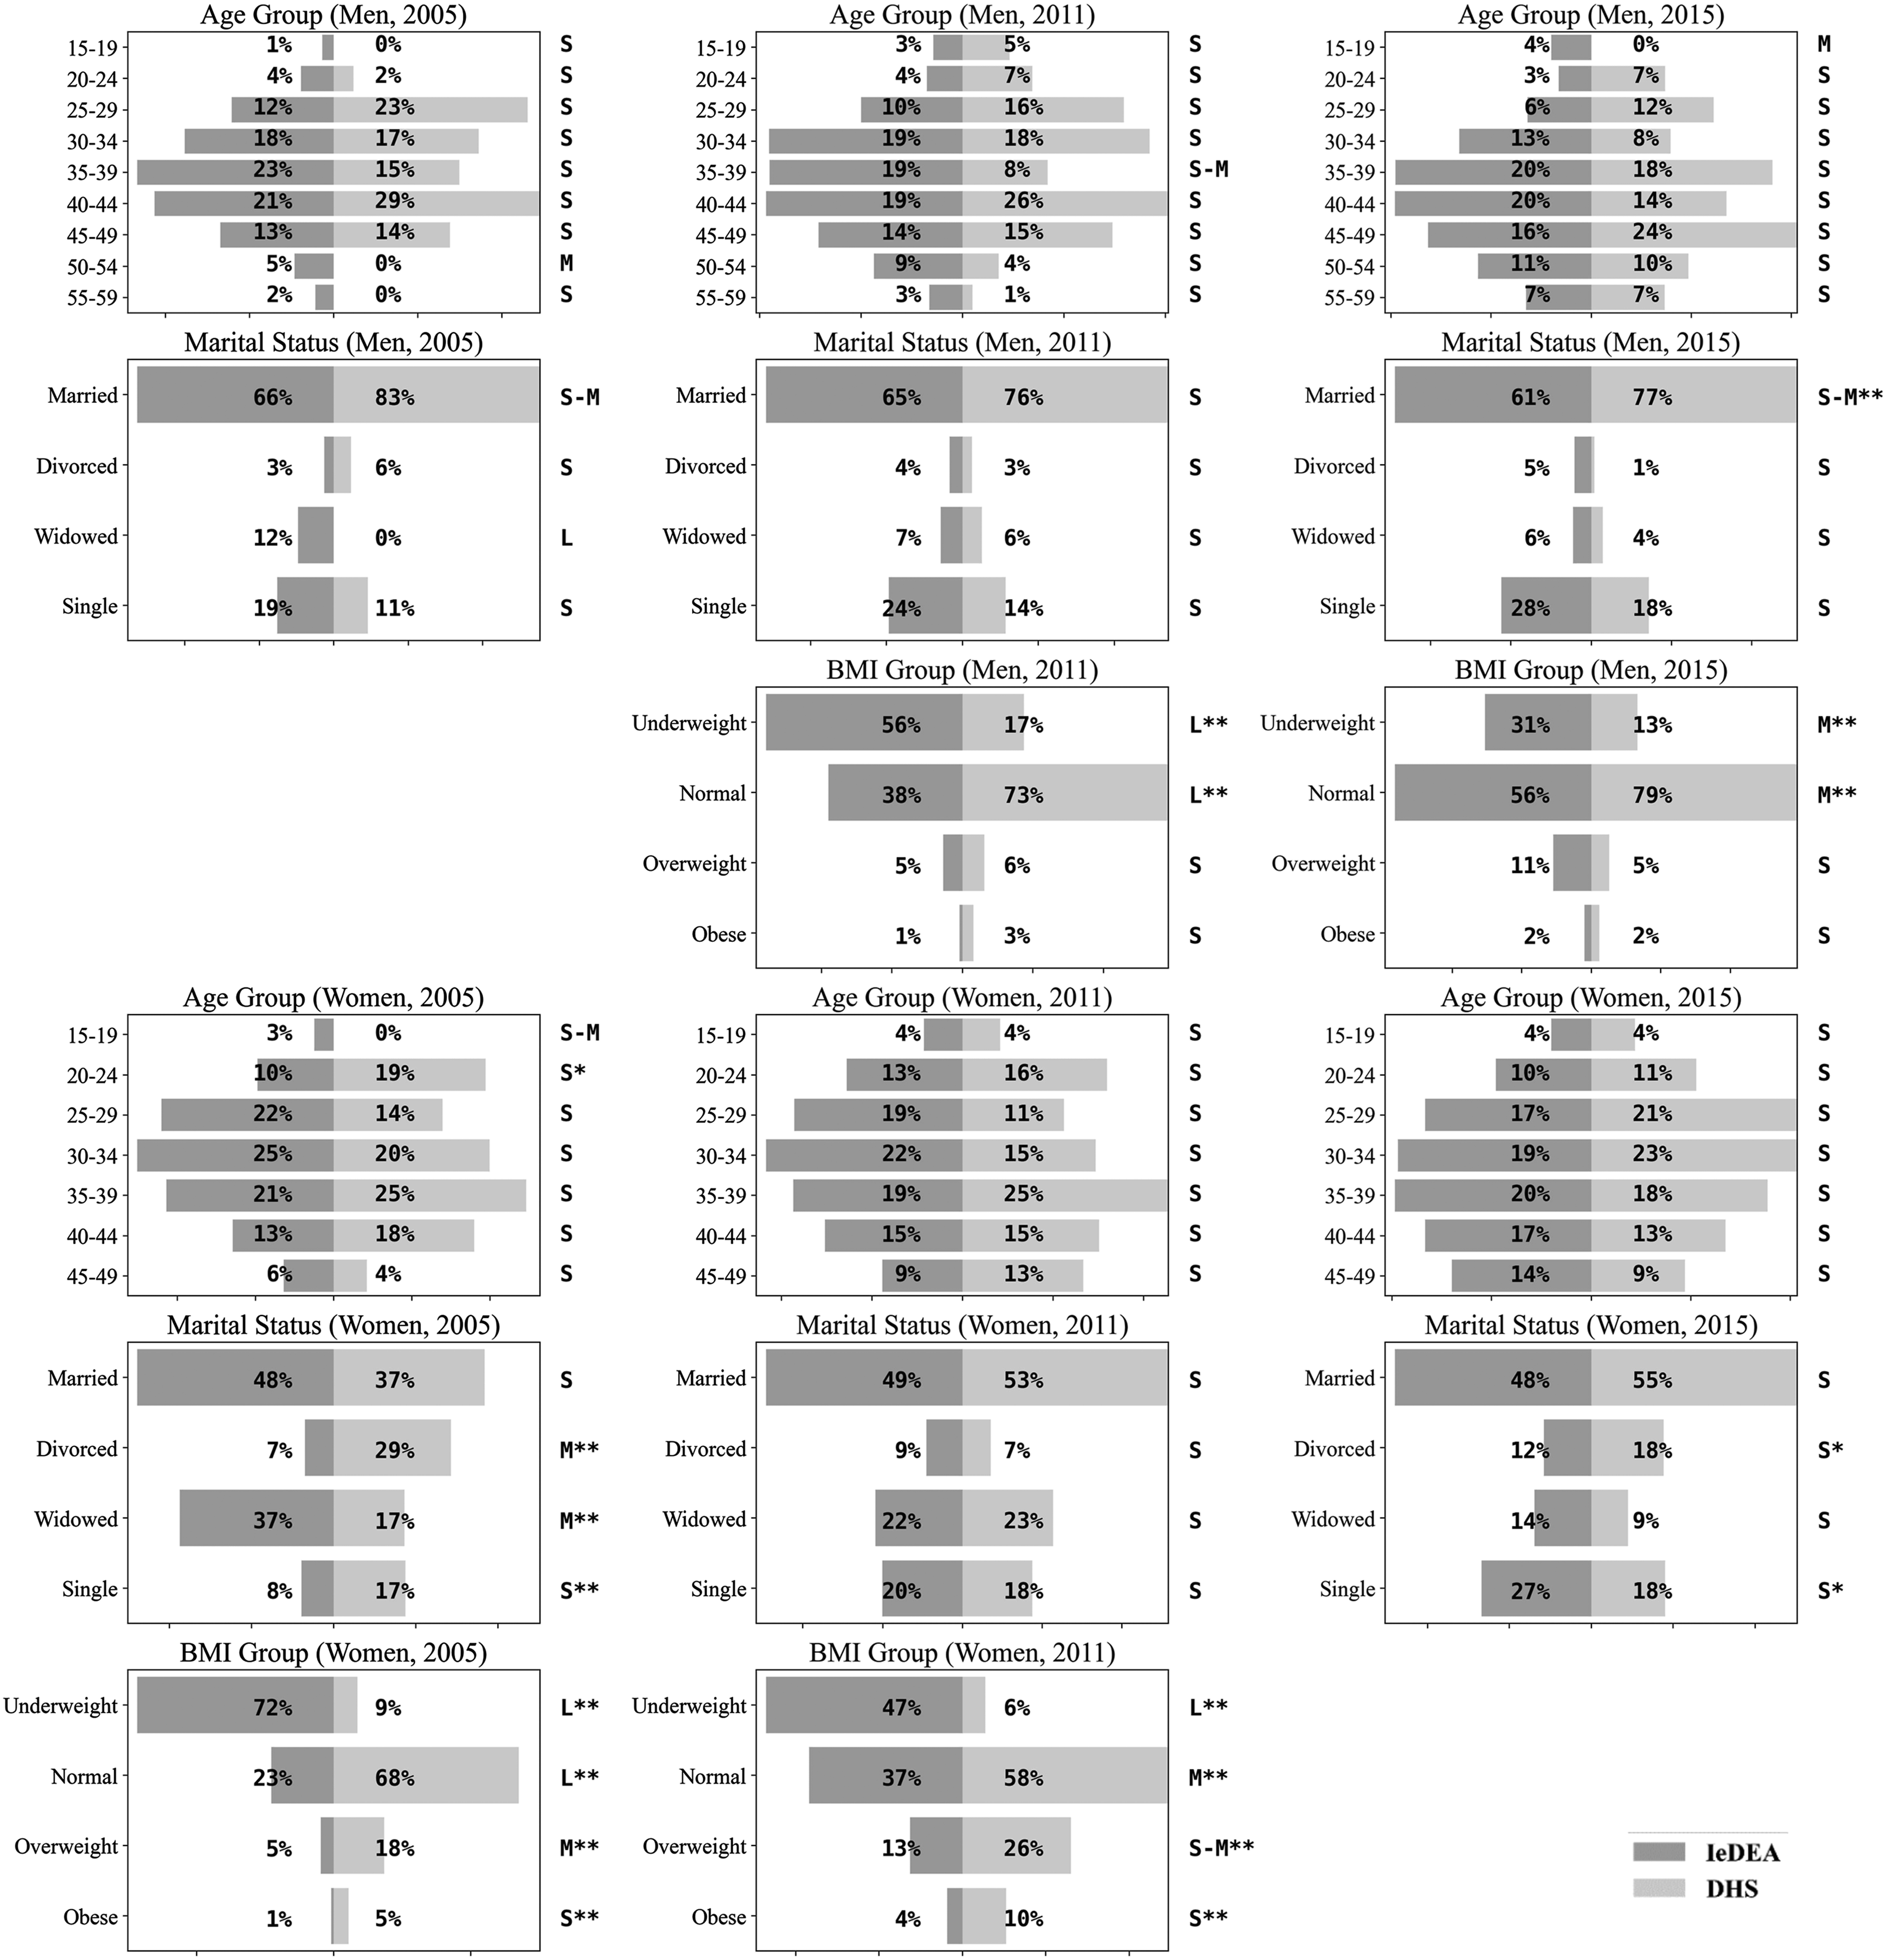
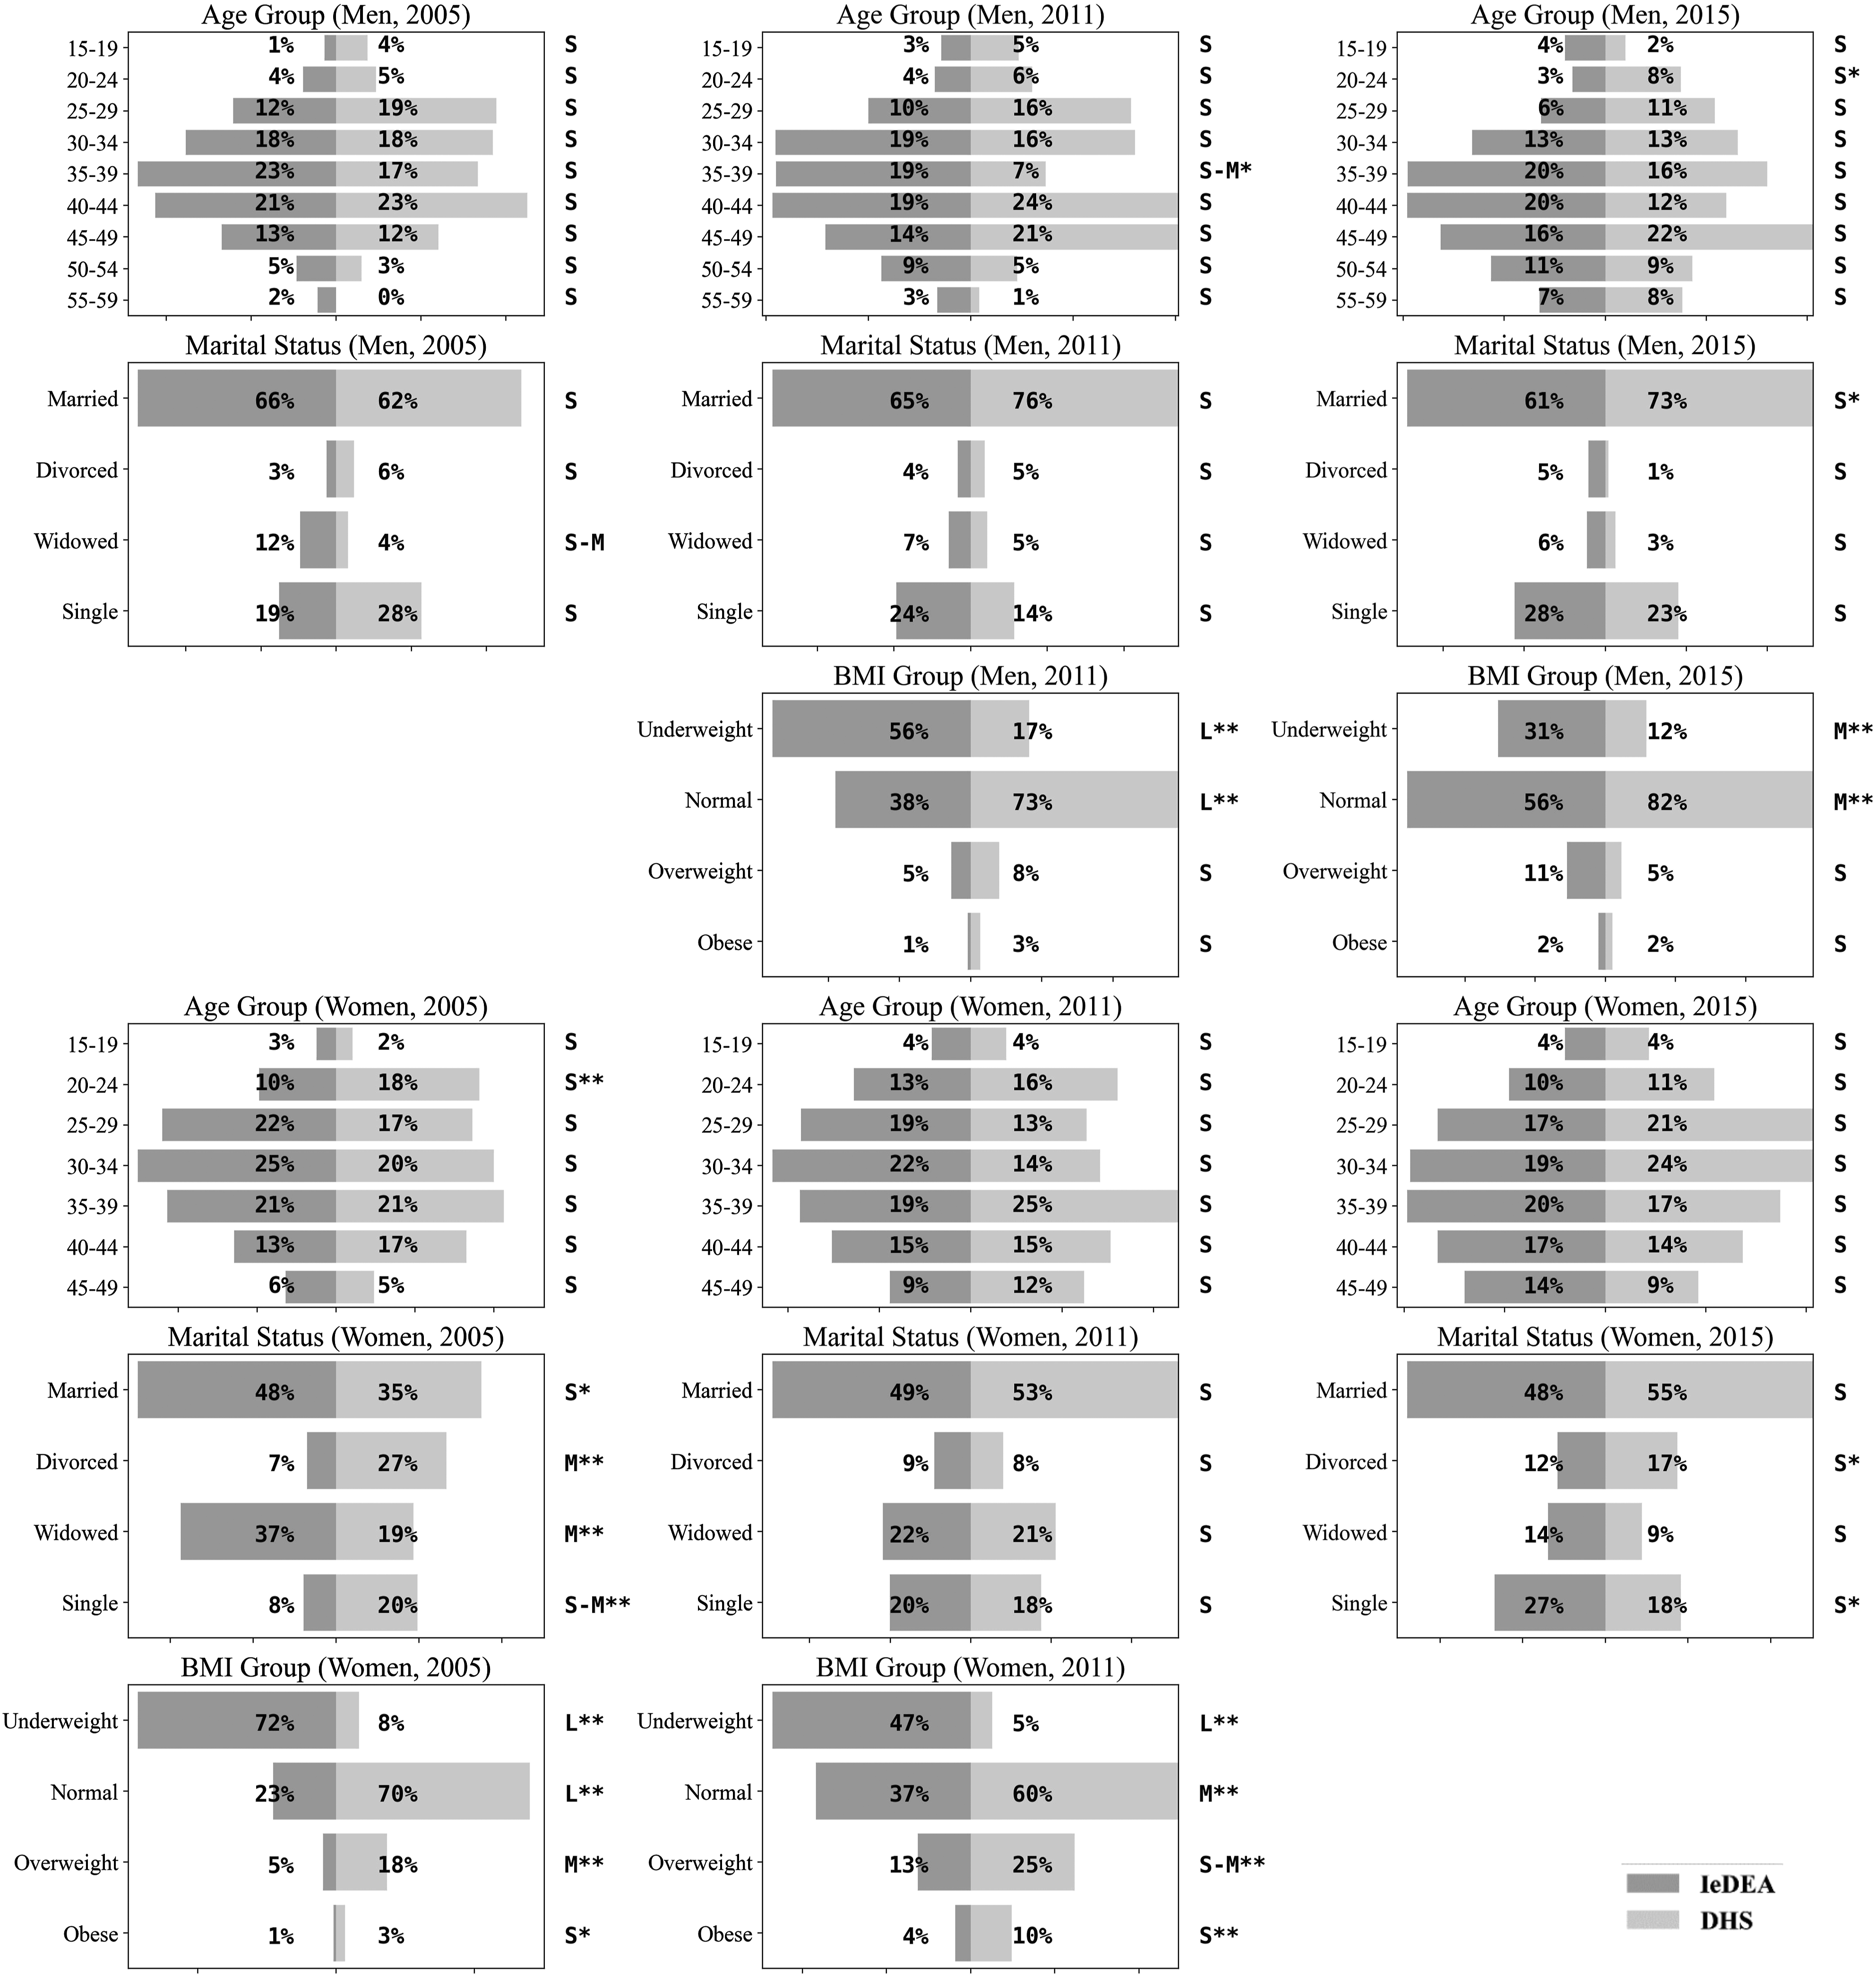
In both Rwanda and Burundi, the proportion of underweight individuals in the CA-IeDEA cohort decreased over time. In Burundi, the proportion of underweight women in the CA-IeDEA cohort decreased from 53% in 2011 to 20–25% in 2017; BMI data were not available for male DHS respondents (Figures 2 and 3). In Rwanda, this proportion decreased from 56% of men in 2011 to 20–31% of men in 2015 and from 72% in 2005 to 20–47% in 2011 among women (Figures 4 and 5).
Discussion
Comparing demographic characteristics of PLWH over time in the DHS data to patient record data, such as that from the CA-IeDEA cohorts, can help to identify selection processes in the different data sources. For example, in Burundi, women living with HIV in the CA-IeDEA cohort generally had similar sociodemographic characteristics as those in the DHS samples, while more differences were seen among men. In general, Burundian men have been a more difficult population to reach for HIV testing than Burundian women, 47 with lower rates of ART initiation. 48 The DHS data had very small proportions of young men 15–19 and 20–24 years of age or single men who tested positive for HIV in urban areas. One possible explanation for this difference is that one of the larger CA-IeDEA sites in Burundi implemented extensive outreach to the lesbian, gay, bisexual, and trans (LGBT) community, who may be underrepresented in the DHS data. Another possible explanation is that the CA-IeDEA sites were located in the capital province, where young men may be more likely to migrate for economic opportunities than some other urban settings covered by DHS data. In Rwanda, the populations were similar in the CA-IeDEA cohort and in the DHS data for age and marital status, with the largest difference in 2005. Rwanda 49 has had a successful HIV testing program, achieving high rates of testing coverage. As such, selection factors may be less likely to influence testing and/or seeking care in this setting, making the two sources of data more comparable. Further, the Rwandan sites did not have established outreach to the LGBT community at the time.
The proportion of women over the age of 49 years and men over the age of 59 years included in the CA-IeDEA cohort increased over time in both Rwanda and Burundi; these age-groups are not included in the DHS. Given that PLWH are living longer with expanded access to effective HIV treatment, the DHS HIV prevalence estimates are missing the growing population of aging PLWH in their estimates.
In both countries, the biggest differences between CA-IeDEA and DHS were in the distribution of BMI, with a greater percentage of underweight individuals in the clinical CA-IeDEA cohorts, in the 2005 (Rwanda) and 2011 (Burundi and Rwanda) time periods. As weight loss is a symptom of advanced HIV disease, this finding suggests that symptomatic individuals are more likely to access care and thus be represented in the clinical data. Notably, the proportion underweight in the CA-IeDEA cohorts in both settings decreased over time; this proportion should continue to decrease as these settings are able to implement the WHO’s treat-all recommendations. In the DHS data, self-report of receiving HIV test results is an imperfect measure of continuation in the HIV care cascade, especially as some providers may not require a second visit for this purpose. 50 The variables “ever having been tested for HIV” and “received the results of most recent HIV test” are only proxies, not direct indicators, for HIV diagnosis and linkage to care and may be susceptible to social desirability bias. Future DHS surveys could consider collecting information on the extent to which individuals identified as positive are aware of their status and receiving HIV treatment and care to allow for more valid comparisons with existing clinical cohorts.
These comparisons had additional limitations. Where people live (urban vs. rural) does not necessarily represent the location at which they seek care. The urban–rural variable in the DHS dataset describes respondents’ places of residence, whereas in the CA-IeDEA dataset, it describes clinic location. PLWH have been shown to travel longer distances than HIV-negative patients for care, so some patients at urban CA-IeDEA clinics may live in rural areas. 51 Further, the CA-IeDEA clinics were located in the capital provinces, while DHS data included other urban localities; some differences in sociodemographic characteristics seen may be due to economic migration patterns to the capital regions. Moreover, CA-IeDEA sites may not be representative of all HIV clinics within these capital regions as they were selected because of their relatively large caseloads and capacity to provide HIV care. Additionally, marginalized groups such as sex workers and LGBT are often hard to reach 52 and may not be captured by DHS sampling methodologies and may be overrepresented in the CA-IeDEA cohorts, particularly in Burundi where one of the clinics had undertaken concerted outreach to the LGBT community. Finally, we were only able to compare a small set of characteristics due to data availability. Given the small sample sizes in DHS data, we compared characteristics stratified by sex only and were not able to make finer comparisons such as comparing the age distributions by marital status for men and women.
In resource-poor settings such as Central Africa, sentinel data from antenatal clinics have been the cornerstone of HIV surveillance, sometimes supplemented with periodic population-representative surveys like the DHS.53,54 The CA-IeDEA cohorts can fill critical gaps in such situations: The data are collected continuously and longitudinally rather than periodically and cross sectionally, allowing for observations of trends over time. Instead of focusing on incidence and prevalence rates, 54 such cohorts encompass PLWH seeking HIV/AIDS care in primarily urban clinics and those on ART, allowing study of treatments, comorbidities, and outcomes. Comparing characteristics of individuals in the IeDEA cohorts to DHS data provides important contextual information when using these data for HIV surveillance and program evaluation. Further, these analyses could be used to weight clinical data in an effort to make the results population-representative or data could be combined to estimate HIV prevalence and incidence. 55 In Burundi and Rwanda, the CA-IeDEA cohorts seem to represent the experience of urban populations and notably those in the capital regions, in care, but may not be transportable to rural settings. While countries such as Rwanda are moving toward case-based sampling to identify all cases in a country receiving clinical care, the rollout of implementation is taking time, especially the process by which duplicative entries are identified and removed. 13 As such, clinical cohort data, such as the CA-IeDEA data provide important supplemental data. Comparing sample characteristics of different sources of HIV surveillance data helps to elucidate selection processes and identify potential biases to consider when interpreting trends in these data.
Supplemental Material
sj-pdf-1-std-10.1177_0956462420983783 – Supplemental Material for Comparison of cohort characteristics in Central Africa International Epidemiology Databases to Evaluate AIDS and Demographic Health Surveys: Rwanda and Burundi
Supplemental Material, sj-pdf-1-std-10.1177_0956462420983783 for Comparison of cohort characteristics in Central Africa International Epidemiology Databases to Evaluate AIDS and Demographic Health Surveys: Rwanda and Burundi by Anna Mageras, Ellen Brazier, Théodore Niyongabo, Gad Murenzi, Jean D’Amour Sinayobye, Adebola A Adedimeji, Christella Twizere, Elizabeth A Kelvin, Kathryn Anastos, Denis Nash and Heidi E Jones in International Journal of STD & AIDS
Footnotes
Declaration of conflicting interests
The author(s) declared no potential conflicts of interest with respect to the research, authorship, and/or publication of this article.
Funding
The author(s) disclosed receipt of the following financial support for the research, authorship, and/or publication of this article. This work was funded by the National Institute of Allergy and Infectious Diseases under the grant number “U01AI096299”.
Supplemental material
Supplemental material for this article is available online
References
Supplementary Material
Please find the following supplemental material available below.
For Open Access articles published under a Creative Commons License, all supplemental material carries the same license as the article it is associated with.
For non-Open Access articles published, all supplemental material carries a non-exclusive license, and permission requests for re-use of supplemental material or any part of supplemental material shall be sent directly to the copyright owner as specified in the copyright notice associated with the article.