
Abstract
There is limited research on how taxes and subsidies would influence the energy and nutritional quality of food purchases. Using an experimental analogue purchasing task, we examined the effects of increasing the price of high-calorie-for-nutrient foods or reducing the price of low-calorie-for-nutrient foods by 12.5% and 25% on mothers’ purchases of 68 common foods and drinks. Taxing less healthy foods with low nutrient density reduced energy (caloric) intake, while reducing the proportion of fat and increasing the proportion of protein purchased. Subsidizing more healthful foods with high nutrient density increased energy intake, without changing the macronutrient profile of foods purchased. These results favor taxes as a way to reduce caloric intake.
Recent rapid increases in obesity are due in part to increases in energy intake of 7 to 22% in males and females (Hill, Wyatt, Reed, & Peters, 2003). A basic mechanism underlying increased energy intake is purchase of increased food energy. The role of modifying purchasing in preventing or treating obesity has been relatively neglected, despite the fact that purchasing behavior may be important given difficulties in long-term self-regulation of eating and activity (Lowe & Levine, 2005). One of the most powerful ways to modify purchasing is by changing food pricing (Faith, Fontaine, Baskin, & Allison, 2007).
Between 1978 and 2004, food prices dropped by 38% relative to the prices of other goods and services. Moreover, the price increases of less healthy foods, which typically include highly processed foods with high quantities of federally subsidized added sugars and added fats, have been much smaller than those of healthier alternatives. For example, since 1983, prices of fresh fruits and vegetables, all fruits and vegetables, fish, and dairy products increased by 190%, 144%, 100%, and 82%, respectively, whereas prices of fats and oils, sugars and sweets, and carbonated beverages increased at much lower rates—70%, 66%, and 32%, respectively (Finkelstein, Ruhm, & Kosas, 2005).
Classical economic theory suggests that if the price of a particular food increases, consumption of that food will decrease, and vice versa. Research in the natural environment and laboratory has revealed increases in purchases of healthier foods when the prices of such foods are reduced and reductions in purchases of less healthy foods as their prices are increased (Cinciripini, 1984; Epstein, Dearing, Paluch, Roemmich, & Cho, 2007; Epstein et al., 2006; French, 2003; French et al., 2001; French, Jeffery, Story, Hannan, & Snyder, 1997; French, Story, et al., 1997; Horgen & Brownell, 2002). In addition, we have shown in laboratory studies that purchases of healthy foods may increase when prices of less healthy foods are increased (Epstein et al., 2007).
Because of the influence of food prices on food consumption and ultimately on weight, there remains considerable interest among policymakers in the extent to which removal of subsidies, introduction of fat or calorie taxes, or other pricing strategies can influence current food consumption practices (Brownell & Frieden, 2009; Finkelstein, French, Variyam, & Haines, 2004; Jacobson & Brownell, 2000; Kuchler, Tegene, & Harris, 2005). Yet it remains unknown what pricing strategies would be optimal for addressing excess food consumption and rising rates of obesity. For example, if the goal is to decrease caloric intake, is it better to subsidize healthy foods, tax unhealthy foods, or implement both a tax and a subsidy policy? It may be that a subsidy on healthy foods increases their consumption but does nothing to decrease consumption of less healthy foods. Even worse, people may take the money they save on healthier foods and use it to purchase greater quantities of less healthy foods. Both of these scenarios would lead to a net increase in calories consumed and, ironically, higher rates of obesity.
Fat taxes or similar policies are receiving considerable attention, and locales are increasingly proposing modest sin taxes on carbonated beverages, candy, or other foods of minimal nutritional value as a way to fight obesity (Brownell & Frieden, 2009; Jacobson & Brownell, 2000). Taxing energy-dense foods with low nutrient density may have the benefit of reducing purchasing of these foods, while shifting purchases to healthier foods (positive cross-price elasticity). This could result in a reduced number of calories purchased each week and an improvement in macronutrient consumption.
In an effort to better understand the effects of proposed pricing policies, we conducted a laboratory experiment in which we systematically tested for differences in mothers’ food purchasing behavior as a result of price changes. Prices were increased for high-calorie-for-nutrient (HCFN) food products or reduced for low-calorie-for-nutrient (LCFN) food products. Calories for nutrients (CFN) provides an index of how many calories are required to obtain an additional 1% of the recommended daily values of 13 key nutrients. Low scores correspond to relatively healthy food items, as fewer calories are needed to obtain key nutrients; high scores indicate less healthy items, as more calories are needed to obtain these nutrients. We calculated the change in the number of calories purchased and the macronutrient composition of foods purchased per family member as a result of the tested tax and subsidy policies. These results can be used to predict how taxes and subsidies would influence food purchasing and energy intake in real-world applications.
We studied two individual differences variables that may moderate purchases: family income and maternal obesity. Some people have raised concerns that taxes on less healthy food choices are regressive because lower-income consumers may consume a greater percentage of the foods most likely to be taxed (Finkelstein et al., 2004). As a result, their food bill may increase disproportionately. Moreover, depending on the size of the tax, their lower incomes may make them less likely to switch from cheaper HCFN foods to more expensive LCFN foods (lower cross-price elasticity), and therefore they may both pay a higher cost and receive a smaller health benefit than higher-income consumers. In addition, in previous research, we have seen that obese mothers are less likely than others to substitute purchasing of healthier alternatives when the prices of less healthy alternatives are increased (Epstein et al., 2007). If a tax or subsidy policy has a greater effect on normal-weight mothers than on obese mothers, then the effect of the policy on reducing caloric intake and rates of obesity may be diminished, particularly given that obese mothers are more likely than normal-weight mothers to have other obese family members in the household (Agras, Hammer, McNicholas, & Kraemer, 2004).
Method
Participants
Participants were recruited from an existing family database, by way of flyers posted around the University at Buffalo campuses, and through Internet ads on craigslist and on the Division of Behavioral Medicine’s Web site. Interested participants were screened by telephone to ensure that they (a) had at least one child between 6 and 18 years of age residing in the household and (b) were responsible for the primary grocery shopping for the family.
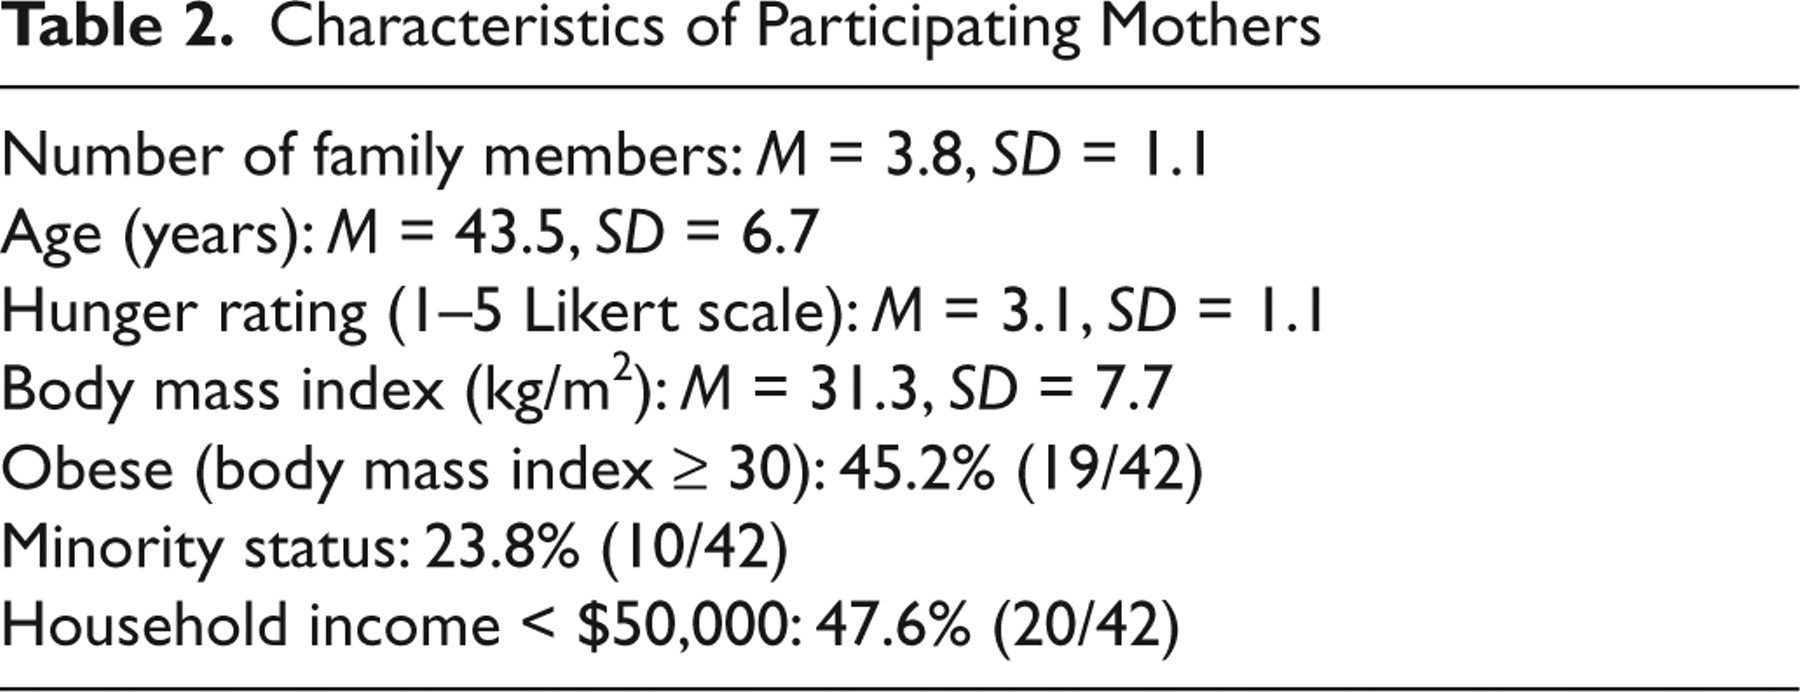
Forty-two mothers were recruited to participate in the study; 20 were of lower income (annual household income less than $50,000/year) and 22 were of higher income (equal to or greater than $50,000/year). Forty-five percent of the mothers were obese, with a body mass index (BMI) of 30 or more. Each participant was scheduled for a single visit to the laboratory lasting approximately 2 hr and was asked to refrain from consuming food or beverages, other than water, for at least 2 hr prior to the appointment. This requirement was necessary because research suggests that recent eating may influence food purchasing (Beneke & Davis, 1985). Participants received a $15 gift certificate to Wegmans Food Markets for completing the study. The study was approved by the University at Buffalo Social and Behavioral Sciences Institutional Review Board.
Procedure
Upon arrival at the laboratory, participants read and signed consent forms and completed demographic and hunger questionnaires. They also completed a multipass same-day food recall task (Nutrition Coordinating Center, 2003) to verify that they had not consumed food or drink (except water) for 2 hr prior to the appointment. Participants then engaged in the food purchasing tasks. Height and weight measurements were taken at the end of the experimental session (to calculate BMI), and participants were debriefed on the nature of the experiment.
For the food purchasing tasks, the experimental room was set up to simulate the experience of being in an actual grocery store; cards with pictures of 30 more healthy and 30 less healthy food items and 4 more healthy and 4 less healthy beverage items were arranged in sections according to food category (e.g., bread, produce, meat). As already noted, we used the CFN index to define the more and less healthy food and beverage items. This index indicates how many calories are required to obtain an additional 1% of the recommended daily values of 13 key nutrients (Drewnowski, 2005). Low scores indicate healthier food items (i.e., fewer calories are consumed in order to obtain key nutrients); high scores indicate less healthy items (i.e., more calories are consumed in order to obtain these nutrients). CFN values assess the nutritional adequacy of foods while incorporating information on energy density, so that they provide a guide to maximizing nutrients relative to the energy density of foods. The foods and beverages in the purchasing tasks were divided into LCFN and HCFN categories. The LCFN foods and beverages had CFN values less than 30 (range from 1 to 29), and the HCFN foods and beverages had CFN values greater than 30 (range from 30 to more than 300). On the reverse side of each picture card was the nutritional information for that food. Beside each picture card was a price card showing the price of that item in that purchasing task.
Each participant completed five purchasing tasks during the experimental session. Prior to each task, the participant was given a study income of $22.50 per family member to purchase the foods. This dollar amount was based on our previous research on mothers’ food purchasing, which showed that this was the minimum amount of money that would be needed per week to provide a balanced diet (Epstein et al., 2007). The participant was told to imagine that she had no food in her house and that the money she was given was to be used to purchase groceries for her family for the week. Because only one brand was available for each food item, the participant was instructed to substitute the available brand for her favorite brand. During each task, the participant made purchases by giving the experimenter a picture card for each desired package of a food (there were multiple picture cards for each food, so that a participant could purchase more than one of an item). The experimenter recorded the amount of each item purchased and let the participant know how much money she had left to spend. If the participant had spent too much money, she was asked to put some of the food items back until the total did not exceed the amount allotted for that task. Subjects were instructed to spend all of the money that was allocated.
Prior to each purchasing task, the experimenter set the price for each individual item. In one of the five tasks, the prices were based on the current prices at local grocery stores. With these prices, the average price of the HCFN foods was $2.26, and the average price of the LCFN foods was $2.03. These prices are equivalent to an average cost of $0.19 per 100 calories for the HCFN foods and $0.73 per 100 calories for the LCFN foods. In two tasks, prices of the LCFN foods were randomly lowered, by 25% in one task and 12.5% in the other; the HCFN food prices remained fixed at their reference values. In the remaining two tasks, the HCFN food prices were raised in a similar manner, and the LCFN food prices were unchanged. The order of the conditions (tax, subsidy, reference) was counterbalanced, and the price manipulations (12.5% vs. 25%) within the tax conditions and within the subsidy conditions were randomized to ensure that ordering effects did not bias the results. In each purchasing task, price cards were color coded to indicate the percentage reduction or increase, if any, from the reference price. For purposes of this study, in the tax conditions, the prices of HCFN foods were increased and the prices of LCFN foods remained constant, whereas in the subsidy conditions, the prices of LCFN foods were reduced and the prices of HCFN foods remained constant.
The reference price, energy density, CFN value, package size, and cost per 100 calories for each of the 60 foods and 8 beverages is shown in Table 1. Correlations between CFN and energy density for foods (r = .22, p > .05) and beverages (r = −.44, p > .05) were low. Thus, CFN provides additional information beyond the energy density of foods.
Foods Used in the Study: Package Size, Reference Price, Calorie-for-Nutrient Value, Energy Density, and Cost per 100 Calories
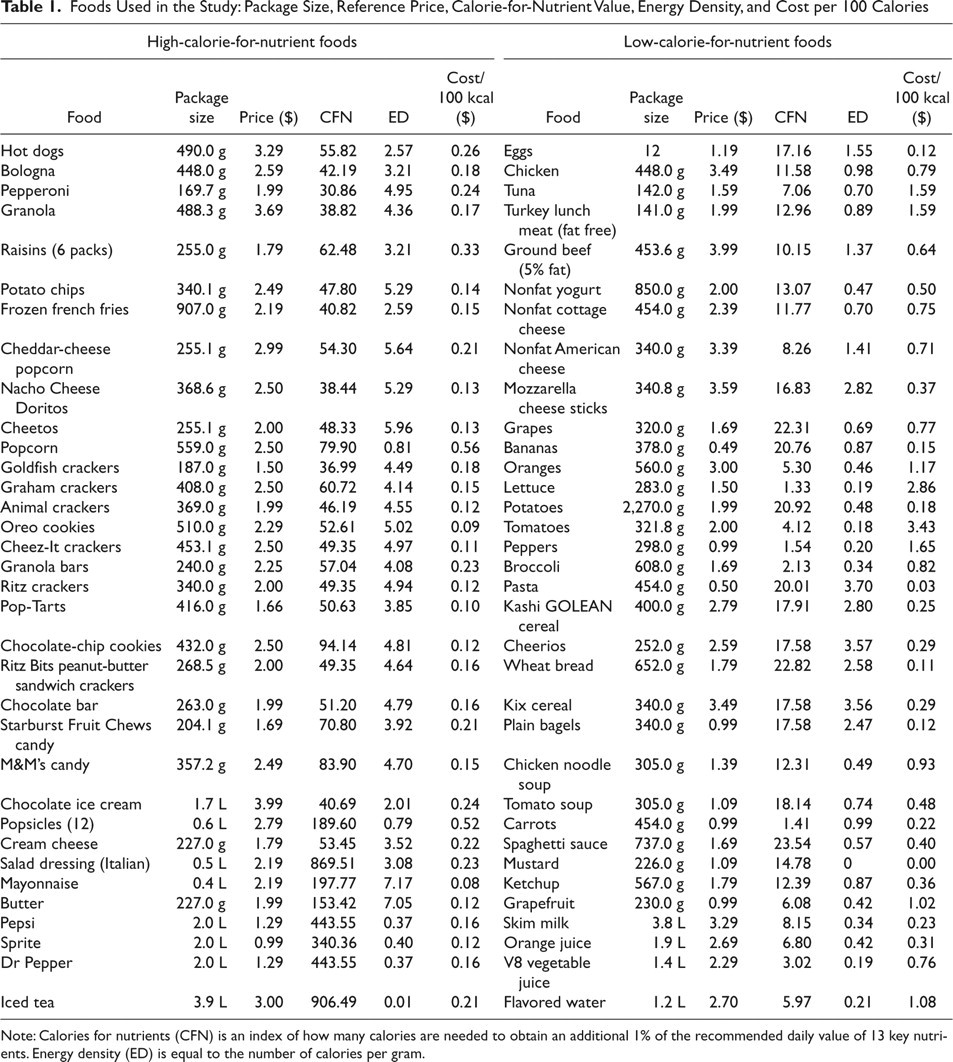
Note: Calories for nutrients (CFN) is an index of how many calories are needed to obtain an additional 1% of the recommended daily value of 13 key nutrients. Energy density (ED) is equal to the number of calories per gram.
Analytic plan
Purchases of LCFN and HCFN foods were analyzed using separate mixed-effects regression models (MRM; Hedeker & Gibbons, 2006). MRM models allow for the evaluation of repeated measures (Hedeker & Gibbons, 2006), which was necessary because each participant provided data for five purchasing tasks. For example, the regression specification for total calories purchased when prices of LCFN foods were reduced was as follows:
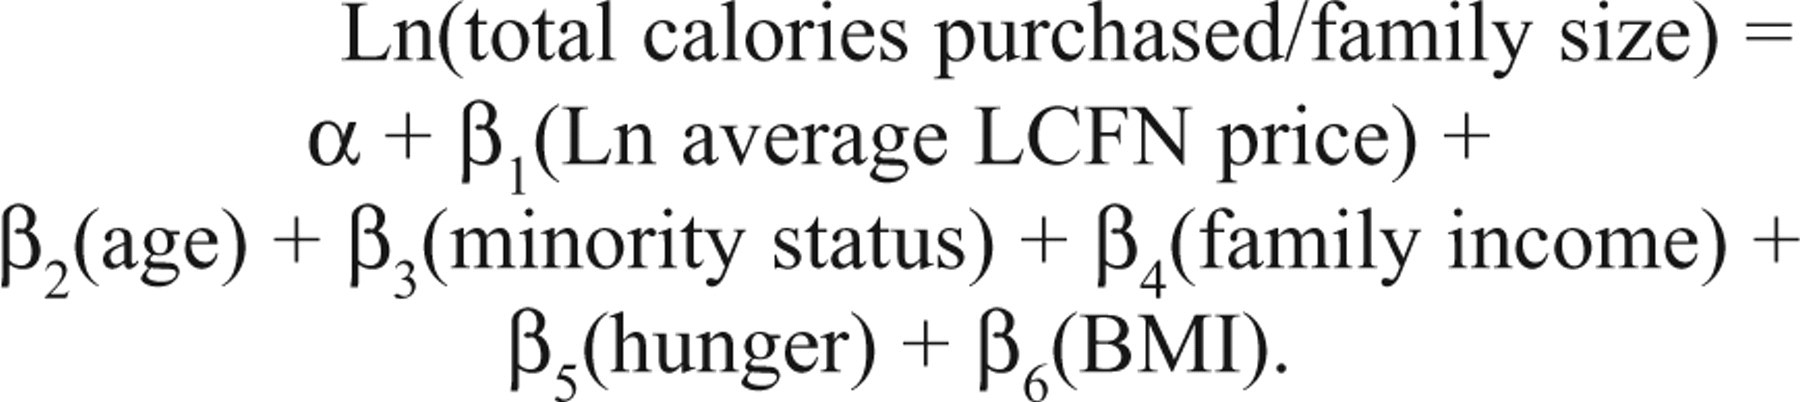
The dependent variable is the logarithm of the total number of calories purchased after adjusting for family size (because mothers of larger families had more money to spend), and β1 is the coefficient for the log price of LCFN foods purchased. In this specification, β1 represents a price elasticity of the demand for calories: the relationship between the percentage change in the average price of LCFN foods (i.e., the size of the price increase) and the percentage change in calories purchased. If β1 is negative, then a subsidy on LCFN foods increases total calories purchased. Including additional covariates allowed us to quantify the price effects while controlling for other variables expected to influence food purchases and for repeated observations within individuals across the purchasing tasks. Covariates included age, a dummy variable for minority status, BMI, family income, and hunger. The covariates were also tested to examine whether they moderated the influence of price on purchases; we used log likelihood tests to assess whether including the interaction of each covariate with the price changes as a block improved the fit of the model. Main effects of covariates indicate that they influenced purchases, whereas moderator effects indicate that covariates interacted with price changes to influence purchases.
Analogous regressions were run for the following dependent variables, separately for the tax and subsidy conditions: logs of the total quantity (i.e., number) of LCFN and HCFN foods purchased (adjusted for family size); logs of the total amount of calories, fat, carbohydrate, and protein calories purchased; and logs of the fat, carbohydrate, and protein calories purchased as a proportion of the total calories purchased. Data were analyzed using SYSTAT Version 11.0 (2004).
Results
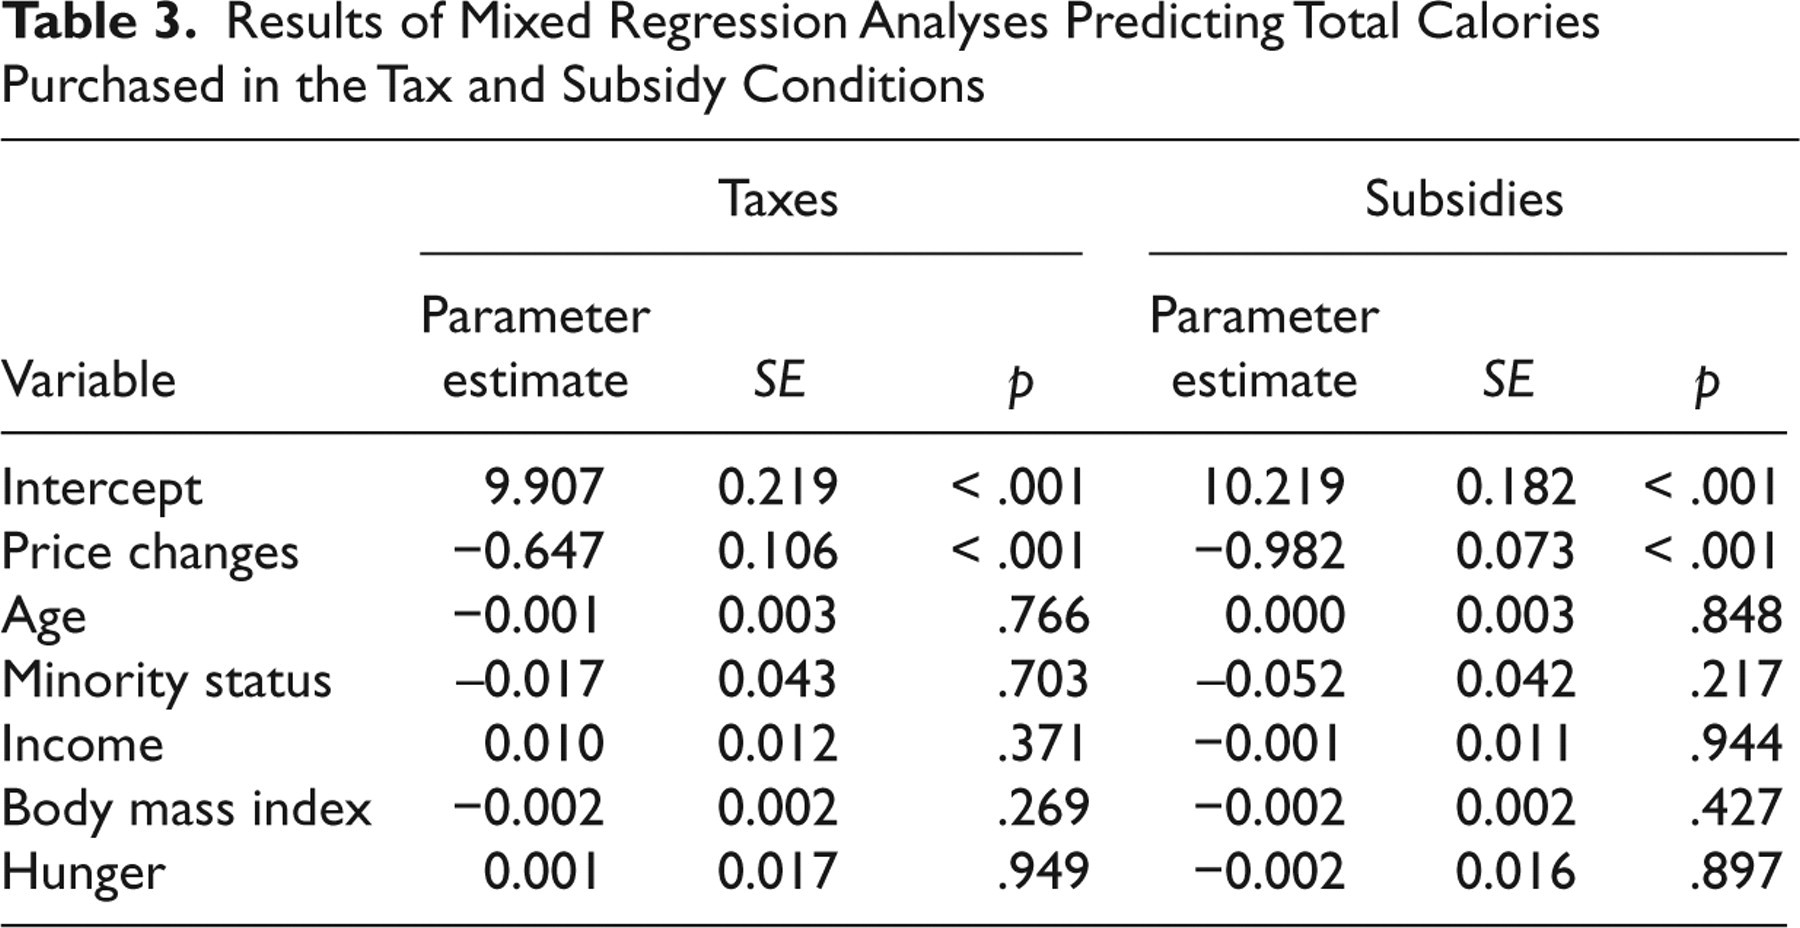
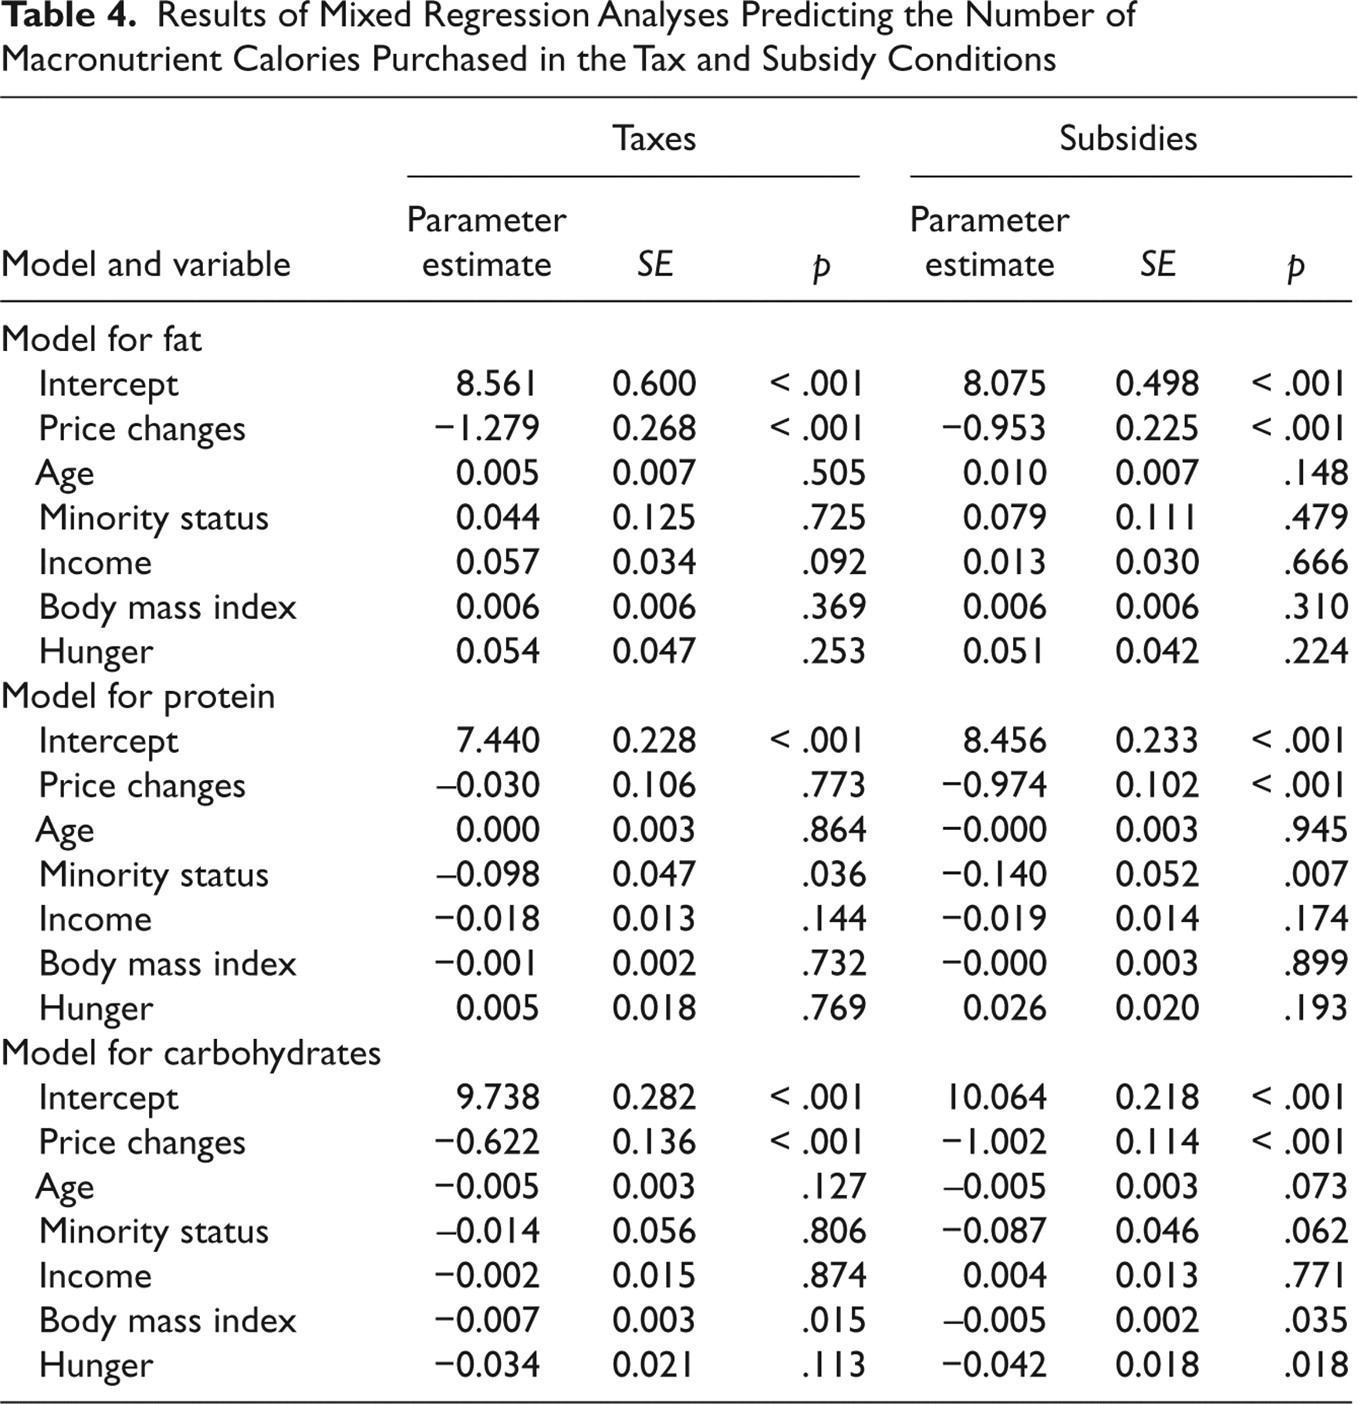
Table 2 summarizes the participants’ characteristics. The analysis of total calories purchased (see Fig. 1a and Table 3) revealed that as prices for healthier foods were reduced, there was a significant increase in energy purchased (elasticity estimate = −0.98, p < .0001), and when prices of less healthy foods were increased, there was a significant decrease in energy purchased (elasticity estimate = −0.65, p < .0001). The analyses of total calories purchased as fat, carbohydrates, and protein (Fig. 1b and Table 4) revealed that the LCFN-subsidy conditions were associated with significant increases in fat, carbohydrates, and protein (estimates of −0.95, −1.00, and −0.97, respectively; ps < .0001); the increases were larger for carbohydrates than for fat (Fig. 1b and Table 4). Contrarily, taxing of less healthy foods was associated with a reduction in fat (elasticity estimate = −1.28, p < .0001) and carbohydrates (elasticity estimate = −0.62, p < .0001); the reductions were larger for fat than for carbohydrates.
Characteristics of Participating Mothers
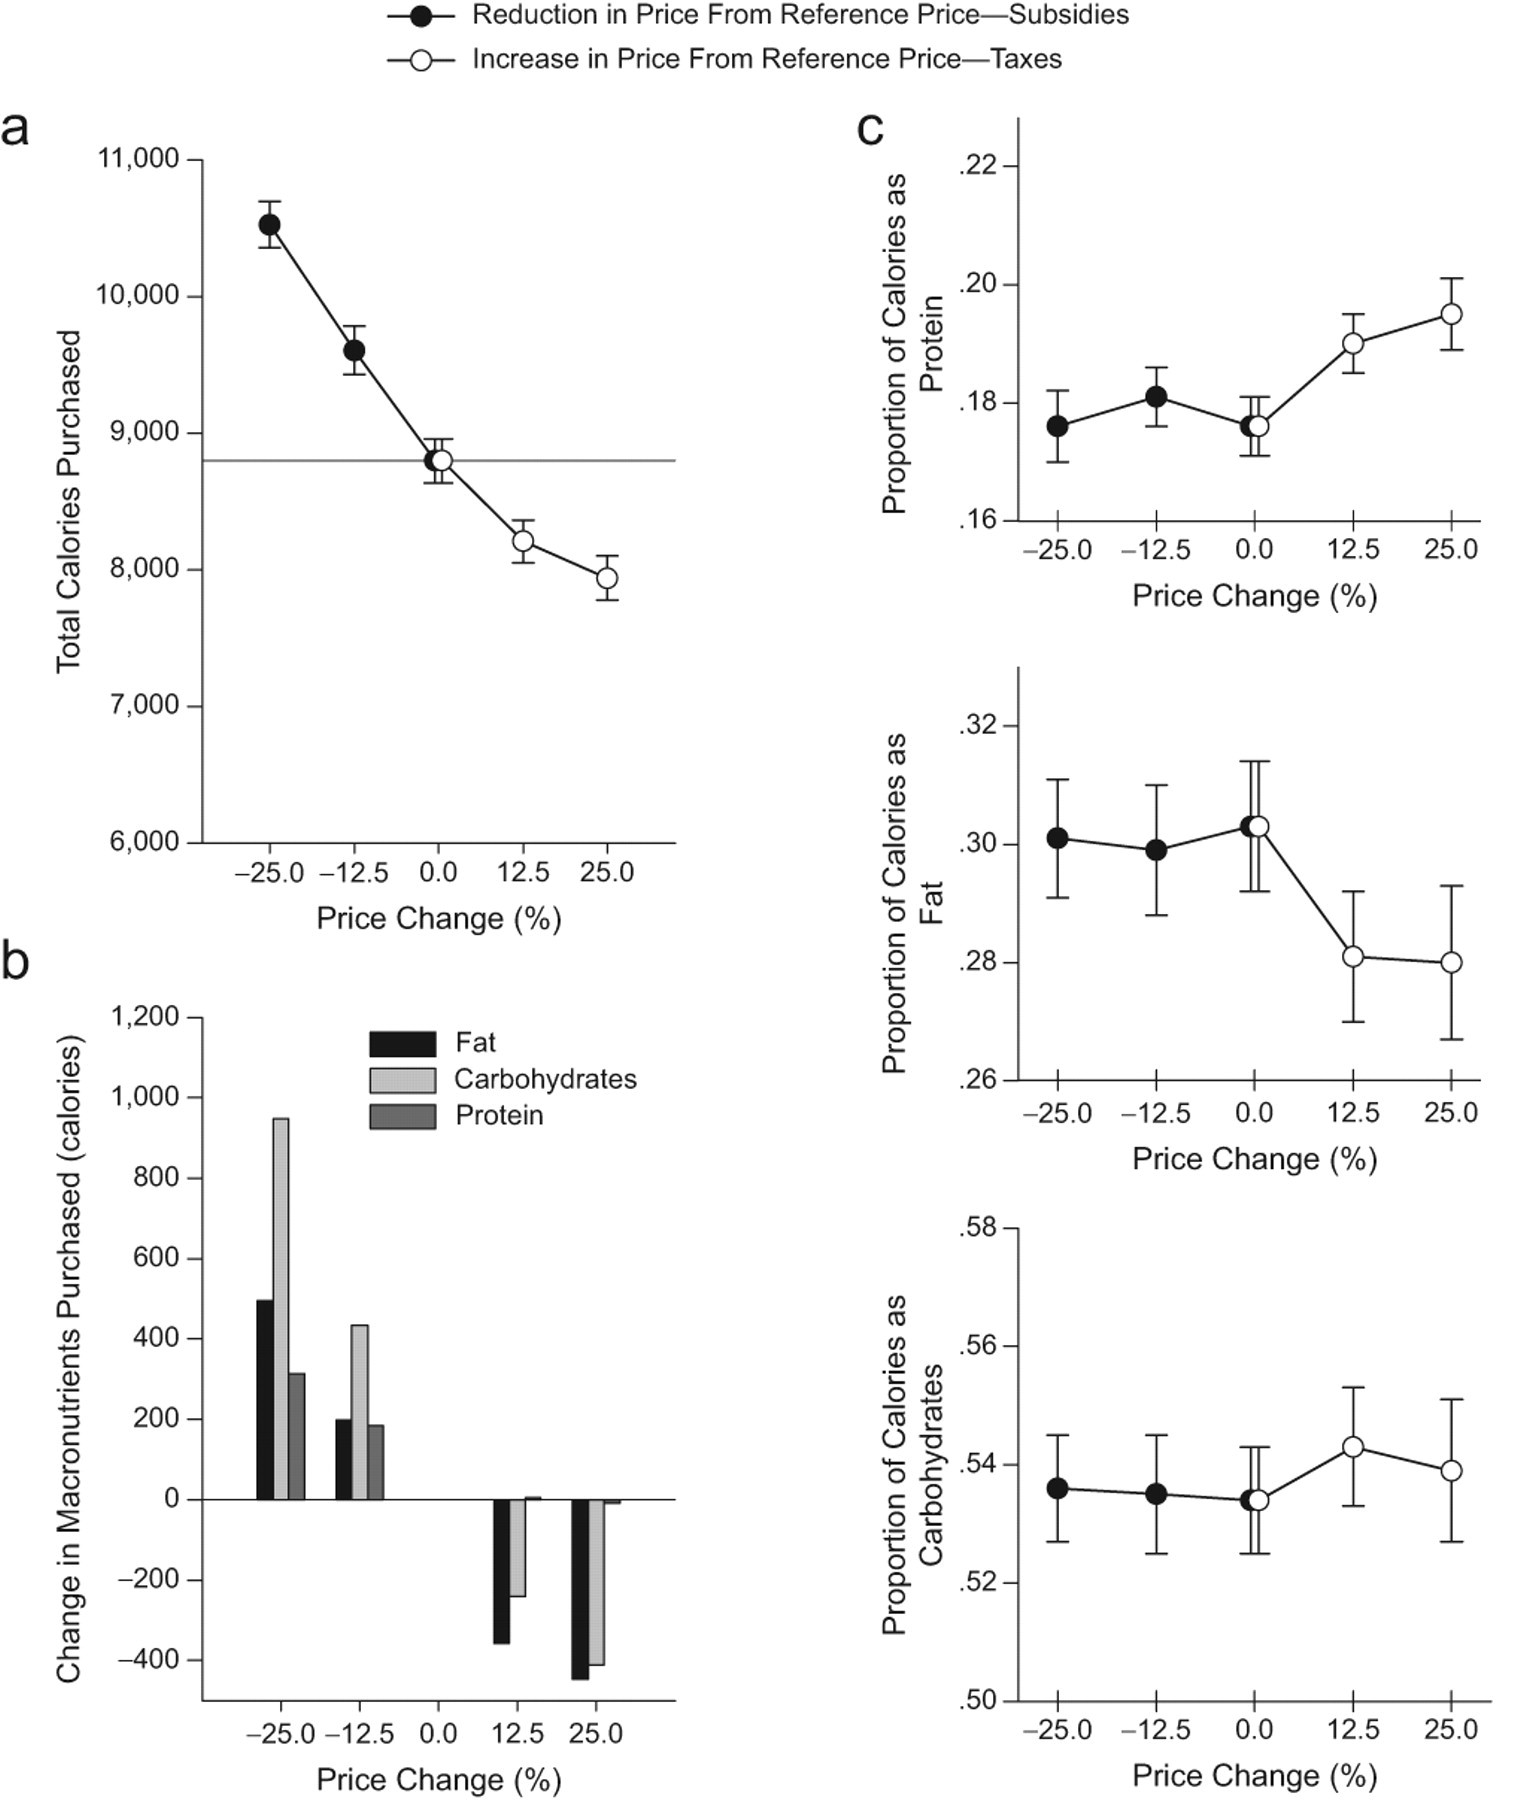
Total calories purchased (a), changes in macronutrient (fat, carbohydrate, and protein) calories purchased (b), and proportion of calories purchased as specific macronutrients (c) as a function of price changes. Subsidies for healthy foods are indicated by negative price changes, and taxes on less healthy foods are indicated by positive price changes. Changes in purchases (b) were calculated relative to the reference condition (i.e., 0% price change). Error bars indicate standard errors of the mean.
Results of Mixed Regression Analyses Predicting Total Calories Purchased in the Tax and Subsidy Conditions
Results of Mixed Regression Analyses Predicting the Number of Macronutrient Calories Purchased in the Tax and Subsidy Conditions
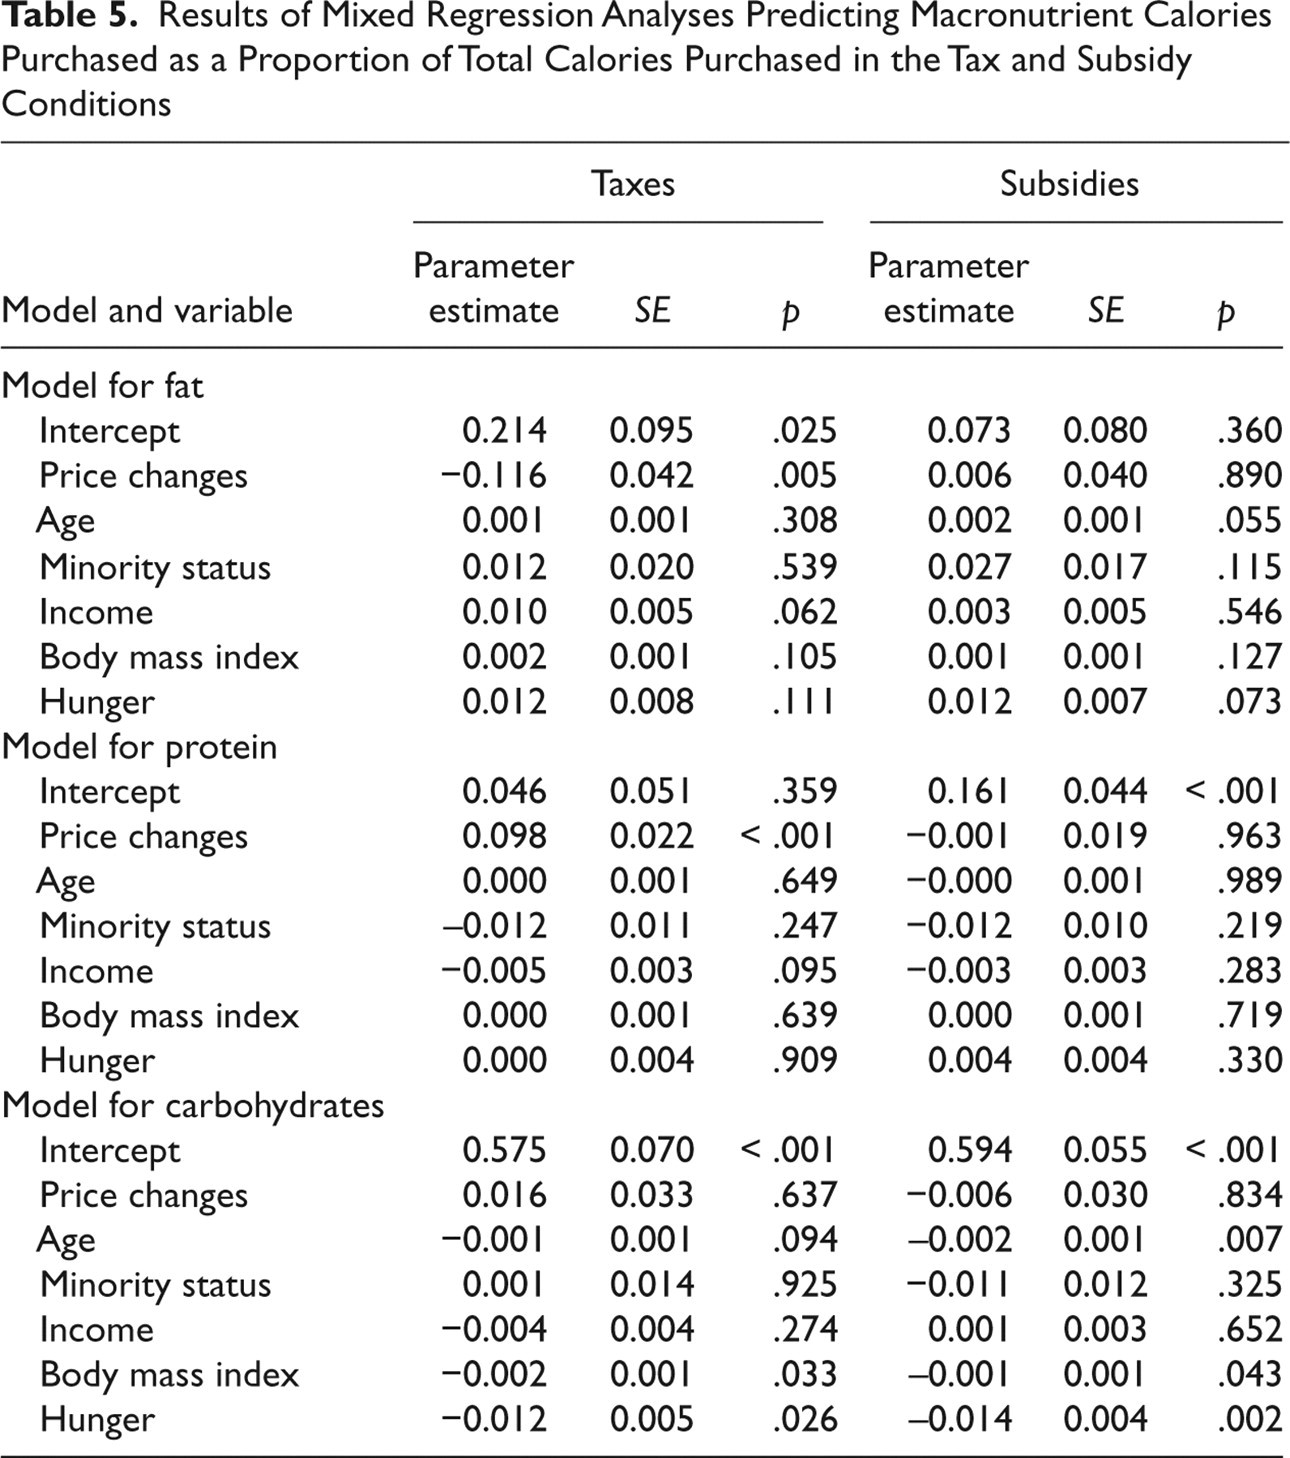
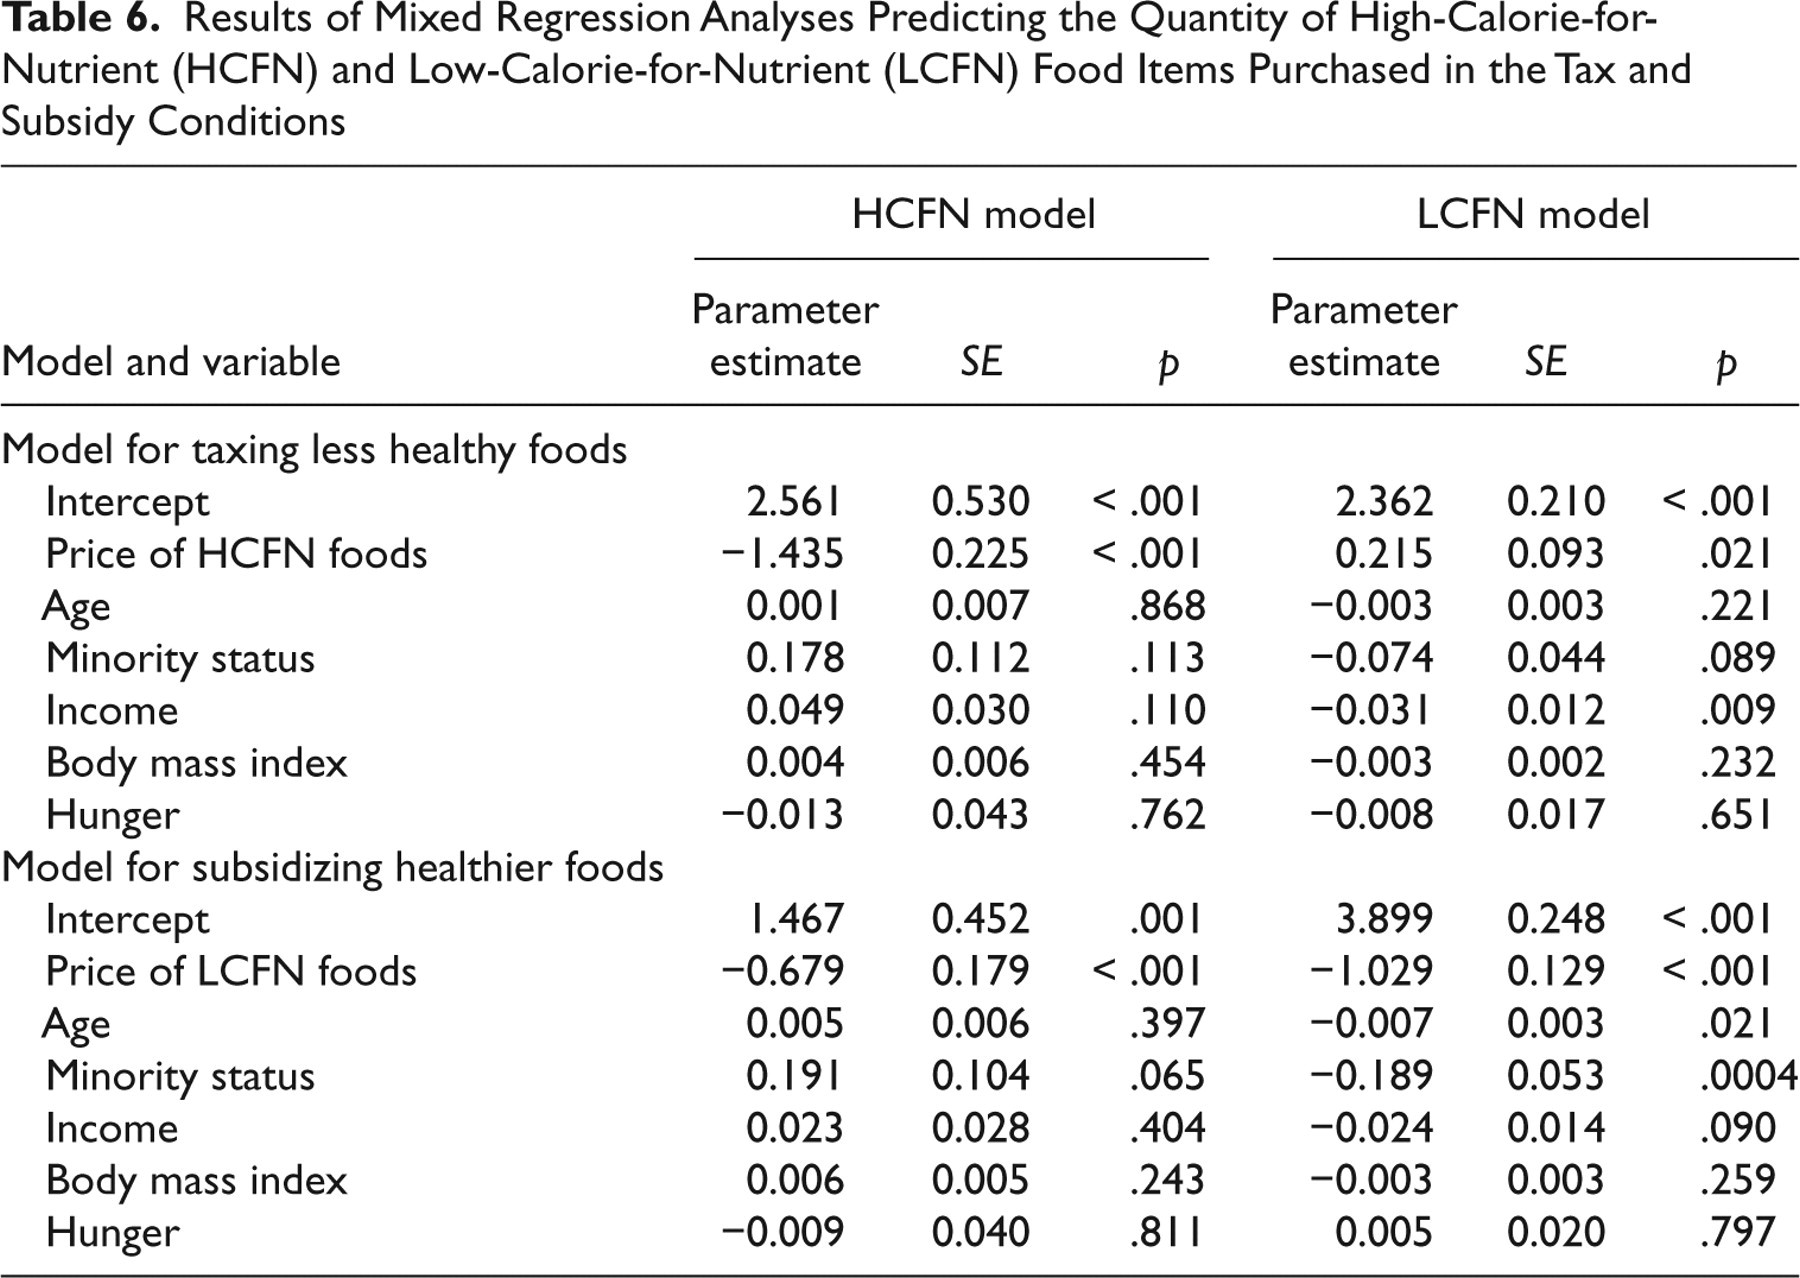
The analysis of macronutrients as a proportion of total calories purchased (Table 5 and Fig. 1c) showed no significant change in the proportion of calories from carbohydrates, fat, or protein (elasticity estimates = −0.006, 0.006, and −0.001, n.s.) when healthier foods were subsidized. Regression analyses of the quantity of food items purchased (see Table 6) showed that when prices of healthier foods were reduced, participants significantly increased purchases of both HCFN (elasticity estimate = −0.68, p = .0002) and LCFN (elasticity estimate = −1.03, p < .0001) foods, so there was no shift in the quality of the diet. However, taxing foods resulted in a significant reduction in the proportion of calories from fat (elasticity estimate = −0.116, p = .005) and an increase in the proportion of calories as protein (elasticity estimate = 0.098, p < .0001). These improvements in the quality of the diet when HCFN foods were taxed were associated with significant reductions in purchases of HCFN foods (elasticity estimate = −1.44, p < .0001) and significant increases in purchases of LCFN foods (elasticity estimate = 0.22, p = .021; Table 6).
Results of Mixed Regression Analyses Predicting Macronutrient Calories Purchased as a Proportion of Total Calories Purchased in the Tax and Subsidy Conditions
Results of Mixed Regression Analyses Predicting the Quantity of High-Calorie-for-Nutrient (HCFN) and Low-Calorie-for-Nutrient (LCFN) Food Items Purchased in the Tax and Subsidy Conditions
Several covariates were significant predictors of purchasing. For example, minority status predicted purchasing of protein in both the tax and subsidy conditions, BMI predicted purchases of carbohydrates in both the tax and subsidy conditions, and hunger predicted purchases of carbohydrates in the subsidy conditions (see Table 4). Moderators did not improve the fit in any of the models.
Discussion
The results provide stronger support for taxes than for subsidies as a means of reducing consumption of less healthy foods and increasing consumption of healthier alternatives. The food purchased provided the greatest energy in the condition with the larger subsidy, as mothers not only increased their purchases of healthy LCFN foods, but also increased their purchases of HCFN foods, spending the money they saved on healthier foods on additional purchases of less healthy alternatives. A subsidy that reduced the price of LCFN foods by 10% increased purchases of LCFN foods by 10.3% and purchases of HCFN foods by 6.8%; increases in purchases of fat, protein, and carbohydrates were 9.5%, 9.7%, and 10%, respectively. These results suggest that a subsidy on healthy foods is unlikely to positively influence rates of obesity.
Although some of the covariates had main effects on purchases (e.g., BMI influenced purchases of carbohydrates when prices were increased or decreased), none of the variables studied interacted with price to influence purchases. These data suggest that taxes or subsidies exert effects on purchases across the individual difference variables studied, which may make it easier to generalize the effects to different populations of subjects. In previous research, we found that individual difference variables such as maternal BMI interacted with price to influence purchases (Epstein et al., 2007), but in those studies the focus was on the number of items purchased, and we did not examine energy or macronutrients purchased. Using energy and macronutrients purchased as dependent variables is new in the experimental analysis of taxes and subsidies, and because energy and macronutrients can be related to public-health outcomes, it may be more useful to study them as dependent variables than to study the number of items purchased.
Taxing foods had the dual benefit of reducing purchases of HCFN foods while increasing purchases of LCFN foods with lower energy density. From a public-policy standpoint, this strategy had the additional benefit of generating significant tax revenue. If policymakers aim to reduce consumption of HCFN foods to control rising rates of obesity, then taxing these foods may be more effective than subsidizing LCFN foods. In our experiment, a tax that increased the price of HCFN foods by 10% reduced total calories purchased by 6.5%, as a result of a reduction in fat and carbohydrate calories of 12.8% and 6.2%, respectively.
The elasticity coefficients depended on the foods studied in the analogue purchasing task and may not generalize beyond the laboratory setting, but the sign and relative magnitude of the results are consistent with economic theory. For example, when the price of HCFN foods was increased 10%, we observed a reduction in purchases of HCFN foods of 14.4%, which is close to the reduction (14.6%) in purchases of Coca-Cola when its price increased 12% (Brownell & Frieden, 2009). For this experiment, the prices of LCFN foods and HCFN foods were manipulated as groups. This had the advantage of preventing substitution of one HCFN food for another, which would happen if the prices of some brands of HCFN foods were increased and others were not. The experiment was set up so that the HCFN and LCFN foods were clearly distinct; we did not make more and less healthy versions of the same product (e.g., baked vs. fried potato chips) available to participants. We have used the strategy of providing different types of healthy and less healthy foods in previous experiments and obtained results similar to those reported here (Goldfield & Epstein, 2002). We expect that a study using a broader range of food products, if they could be clearly defined and taxed based on their CFN status, would yield similar conclusions.
There are many advantages to experimental economics research, which provides the opportunity to manipulate prices (or other variables) in ways that would be difficult and costly outside the laboratory (Carson & Gangadharan, 2003; Kagel & Roth, 1995; Schram, 2005). We believe these results, although not meant to be authoritative, will help inform discussions on the likely effect of changes in food prices on food consumption patterns and subsequent obesity rates. We are aware that the experimental approach has limitations. The laboratory purchasing task is a hypothetical situation, and constraints of the laboratory (e.g., controlling the amount of money available to spend on each family member, studying a limited number of foods, and using color-coded pricing cards to highlight increased or reduced prices) may have influenced our results. As is the case with all laboratory studies, these results need to be replicated outside the laboratory, and we therefore caution against using the elasticity coefficients we obtained to gauge the impact of actual changes in food prices on food consumption patterns beyond the laboratory. Nevertheless, we believe that laboratory-based experimental economic paradigms are a valuable tool in developing evidence-based public-health policy.
Footnotes
The authors declared that they had no conflicts of interest with respect to their authorship or the publication of this article.