
Abstract
Youth identified before age 13 (N = 320) as having profound mathematical or verbal reasoning abilities (top 1 in 10,000) were tracked for nearly three decades. Their awards and creative accomplishments by age 38, in combination with specific details about their occupational responsibilities, illuminate the magnitude of their contribution and professional stature. Many have been entrusted with obligations and resources for making critical decisions about individual and organizational well-being. Their leadership positions in business, health care, law, the professoriate, and STEM (science, technology, engineering, and mathematics) suggest that many are outstanding creators of modern culture, constituting a precious human-capital resource. Identifying truly profound human potential, and forecasting differential development within such populations, requires assessing multiple cognitive abilities and using atypical measurement procedures. This study illustrates how ultimate criteria may be aggregated and longitudinally sequenced to validate such measures.
Exceptional human capital drives the global economy (Friedman, 2007; Hunt, 2011; Hunt & Wittmann, 2008). Consequently, being able to identify, attract, and develop human capital is increasingly critical for business, scientific, and technical organizations as they strive for a competitive edge. The National Science Board (2010) recently wrote a report on identifying and developing human capital, noting: “The long-term prosperity of our Nation will increasingly rely on talented and motivated individuals who will comprise the vanguard of scientific and technological innovation” (p. v). Not surprisingly, a nation’s gross domestic product is directly influenced by the aggregate accomplishments of its residents with high ability in science, technology, engineering, and math (STEM; Rindermann & Thompson, 2011).
In the context of emerging economies and international markets, some societies are operating under the assumption that those best equipped to leverage exceedingly rare human-capital resources will be the ones most likely to maintain and advance the economic, physical, and social well-being of their citizens. For example, Zakaria (2011) described the admissions exams of the Indian Institutes of Technology (IIT) as follows: Their [IITs’] greatest strength is that they administer one of the world’s most ruthlessly competitive entrance exams. Three hundred thousand people take it, five thousand are admitted—an acceptance rate of 1.7 percent. . . . The people who make the mark are the best and brightest out of one billion. Place them in any educational system, and they will do well. (pp. 205–206)
Bill Gates applied the same logic to select Ph.D.-level scientists for Microsoft Research Asia in Beijing (Friedman, 2007); by administering successively more difficult IQ, mathematics, and computer-science tests, he eventually selected 20 people out of an initial pool of 2,000!
The underlying assumption is that these procedures isolate populations having exceptional promise not just for making concrete creative advances, but also for becoming important government and organizational leaders—that is, individuals entrusted with occupational roles in which sophisticated judgments are needed for ensuring individual and organizational well-being. But is this assumption correct? The psychological characteristics of many of these special populations remain unclear, and there is little systematic documentation of the accomplishments of individuals selected by, and trained in accordance with, these identification procedures.
Longitudinal study of the development of intellectually gifted individuals is germane to this topic (e.g., Holahan, Sears, & Cronbach, 1995; Terman, 1925–1959), but the literature in this area is limited and does not adequately assess exceptionality of the type we are referring to. Typically, intellectually gifted populations are selected for study using cutoff scores that do not even approach the top 1% of ability. Here, we are focusing on individuals whose intellectual prowess is much rarer: To use Forbes publisher Richard Karlgaard’s (2010, p. 26) characterization, we are referring not just to the “super smart,” but to the “Scary Smart.”
Because of many challenges, longitudinal inquiry on such profoundly gifted populations is as rare as the populations themselves. For scientific findings on the profoundly gifted to be meaningful and generalizable, participants must be identified early with psychologically specific measures having exceptionally high ceilings, tracked longitudinally over multiple decades, and evaluated on rare or low-base-rate achievements to ascertain the extent to which their accomplishments are truly extraordinary. Moreover, relatively large samples are needed for statistically stable findings, given that intellectually talented populations develop creative products in many socially valued domains; they also take on critical leadership roles and positions of responsibility in a wide range of settings.
Here, we report an investigation in which we attempted to meet these methodological challenges. Over the course of nearly three decades, we tracked a sample whose likelihood of accomplishing many different kinds of highly valued outcomes far exceeds the norm. These profoundly gifted participants were identified using above-level testing procedures (e.g., administering college entrance exams to young adolescents). Specifically, 320 participants were secured through SAT assessments conducted before age 13; at least one of their scores, SAT-Math (SAT-M) or SAT-Verbal (SAT-V), placed them in the top 1 in 10,000 in reasoning ability. The last detailed report on this sample appeared more than a decade ago (Lubinski, Webb, Morelock, & Benbow, 2001). Based on data collected when participants were in their early 20s, it focused on their educational accomplishments and intentions, subjective feelings, and occupational ambitions; the universities many were attending or planned to attend for graduate study, combined with other achievements at the time, suggested extraordinary future promise. But to what extent has participants’ promise been fulfilled?
Here, we examine the import these early assessments hold for truly outstanding real-world accomplishments and for understanding individual differences in the nature of these endeavors. Specifically, we attempt to answer the following two complementary and interrelated questions: First, to what extent do such early indicators of extraordinary intellectual promise identify individuals who ultimately go on to make truly outstanding contributions by advancing knowledge or by occupying important positions of leadership, responsibility, and trust? Second, if these indicators are capable of uncovering such promise, can they also distinguish different types of promise? And if so, how might such differences be documented and illustrated over the course of life-span development?
Method 1
Participants, measures, and procedure
Participants were drawn from the third cohort of the Study of Mathematically Precocious Youth (Lubinski & Benbow, 2006) and earned an SAT-M score of at least 700 or an SAT-V score of at least 630 (or both) before age 13 (1980–1983); these selection criteria mark the top 1 in 10,000 in mathematical and verbal reasoning ability, respectively, for that age group. The sample included 253 males and 67 females; 78% were Caucasian, 20% were Asian, and 2% were of other ethnicities.
The sample was identical to the sample studied by Lubinski et al. (2001); all 320 individuals who completed the 10-year follow-up survey reported in that article also provided data for a 20-year follow-up survey during 2003–2004, when participants had a mean age of 33.6 years (Lubinski, Benbow, Webb, & Bleske-Rechek, 2006). Five years later, when participants were approximately 38, Google was used to obtain additional information on these participants’ employing organizations, job titles, major awards, leadership roles, and occupational responsibilities. Details about patents and peer-reviewed publications were gathered using Publish or Perish (Harzing, 2007) software. To be clear, we provide a portrait of participants’ advanced educational outcomes based on their 20-year follow-up (Lubinski et al., 2006) and detail participants’ occupational and creative accomplishments by age 38.
Analytic strategy
Nature of development
Our strategy for analyzing qualitative differences in development utilizes information on ability level and pattern, as well as idiographic and nomothetic perspectives—a mixed-methods approach. Bivariate age-13 SAT-M and SAT-V scores were plotted on Cartesian coordinates for specific outcomes in a series of three developmentally contiguous domains: terminal graduate degrees, occupations, and creative accomplishments. When multiple individuals earned the same accomplishment, their bivariate points were averaged. We reasoned that these three plots (Figs. 1, 2, and 3, respectively), which organize ultimate criteria (Thorndike, 1949) for learning, work, and creative expression, would each uncover distinct outcome constellations within the space defined by mathematical and verbal reasoning abilities assessed at age 13. We also anticipated that common substantive themes would cut across these domains and occupy the same locations on the three figures. Moreover, because the scientific study of profoundly gifted populations is rare, and longitudinal tracking of such populations is even rarer, we plotted a single individual’s bivariate point when only that individual achieved a certain accomplishment and the average bivariate point when multiple participants achieved a given accomplishment. Because reasonable minds can differ on how groups are formed for analytic purposes, one attractive feature of this approach is that it makes clear how rational groupings were formed for qualitative and statistical comparisons and enables subsequent replications.
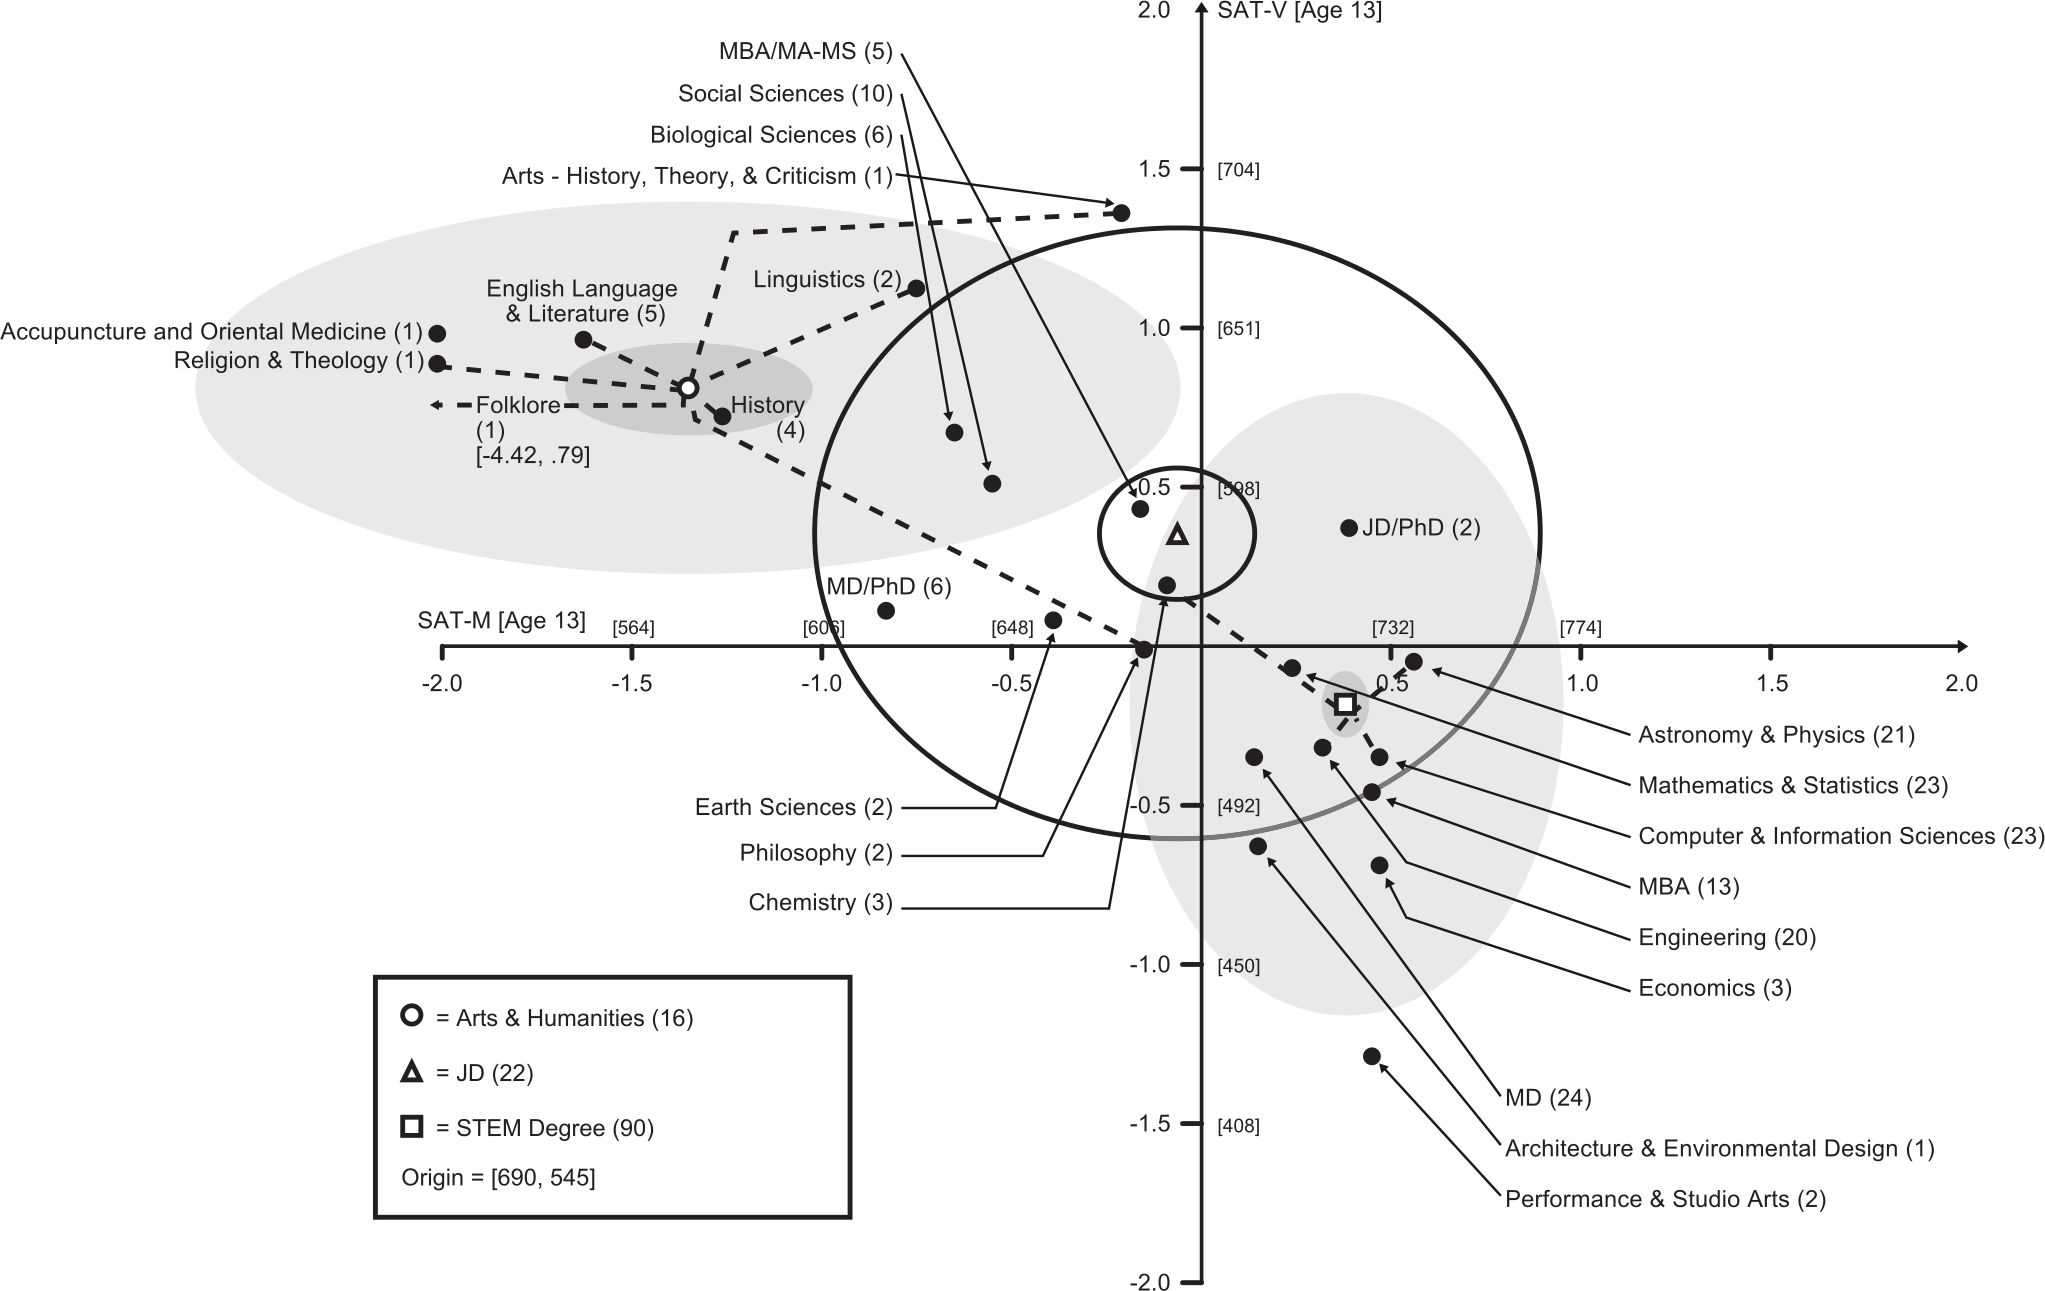
Bivariate means for age-13 SAT-Math (SAT-M; x) and SAT-Verbal (SAT-V; y) scores within categories of terminal graduate degrees. Means for individual degree categories are represented by black circles; the sample sizes for these categories are in parentheses. White shapes (i.e., circle, triangle, square) represent rationally derived centroids (ns for these centroids are indicated in the key). The dashed lines emanating from a centroid indicate its constituents. Each centroid is surrounded by two elliptical tiers that highlight the concentration of points (gray shading or black outlines): an inner ellipse formed by the standard errors of the SAT-M and SAT-V means within that centroid (i.e., width and length = ±1 SEM for SAT-M and SAT-V, respectively) and an outer ellipse formed by the standard deviations of the SAT scores in that centroid (i.e., width and length = ±1 SD for SAT-M and SAT-V, respectively). Slashes indicate dual degrees. Along the axes, unbracketed values are SAT-M and SAT-V scores in z-score units, and bracketed values are raw SAT scores. The bivariate mean for folklore, which is outside the plotted area, is indicated in brackets. The data for this figure are from the 20-year follow-up (Lubinski, Benbow, Webb, & Bleske-Rechek, 2006). STEM = science, technology, engineering, and mathematics.
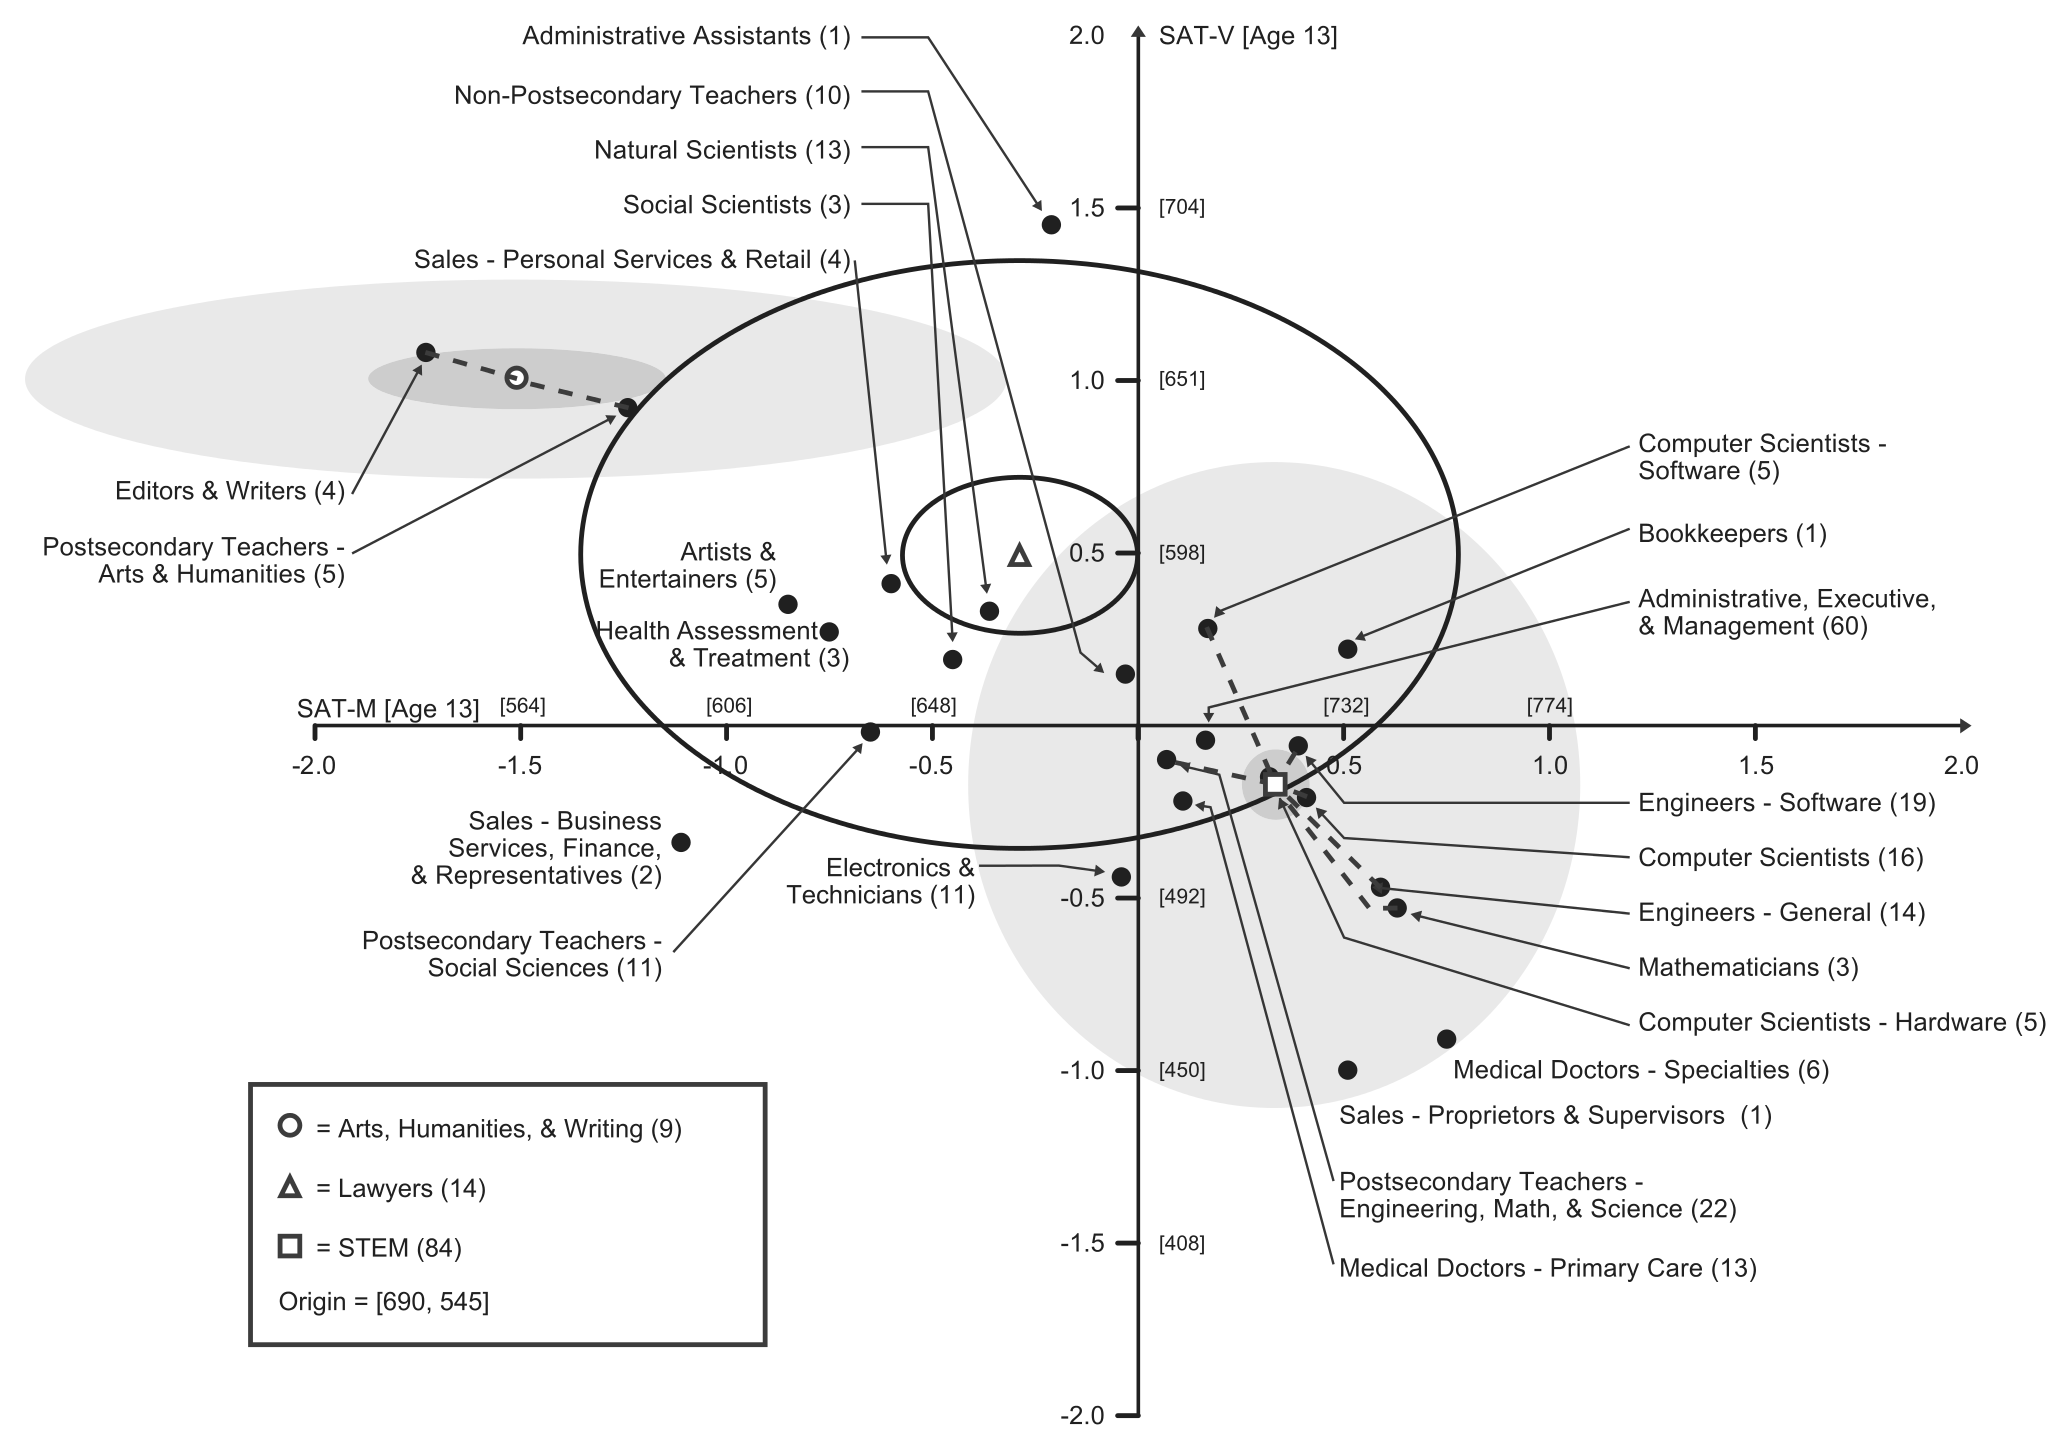
Bivariate means for age-13 SAT-Math (SAT-M; x) and SAT-Verbal (SAT-V; y) scores within occupational category (when participants were 38 years old). See Figure 1 for an explanation of the notational scheme. STEM = science, technology, engineering, and mathematics.
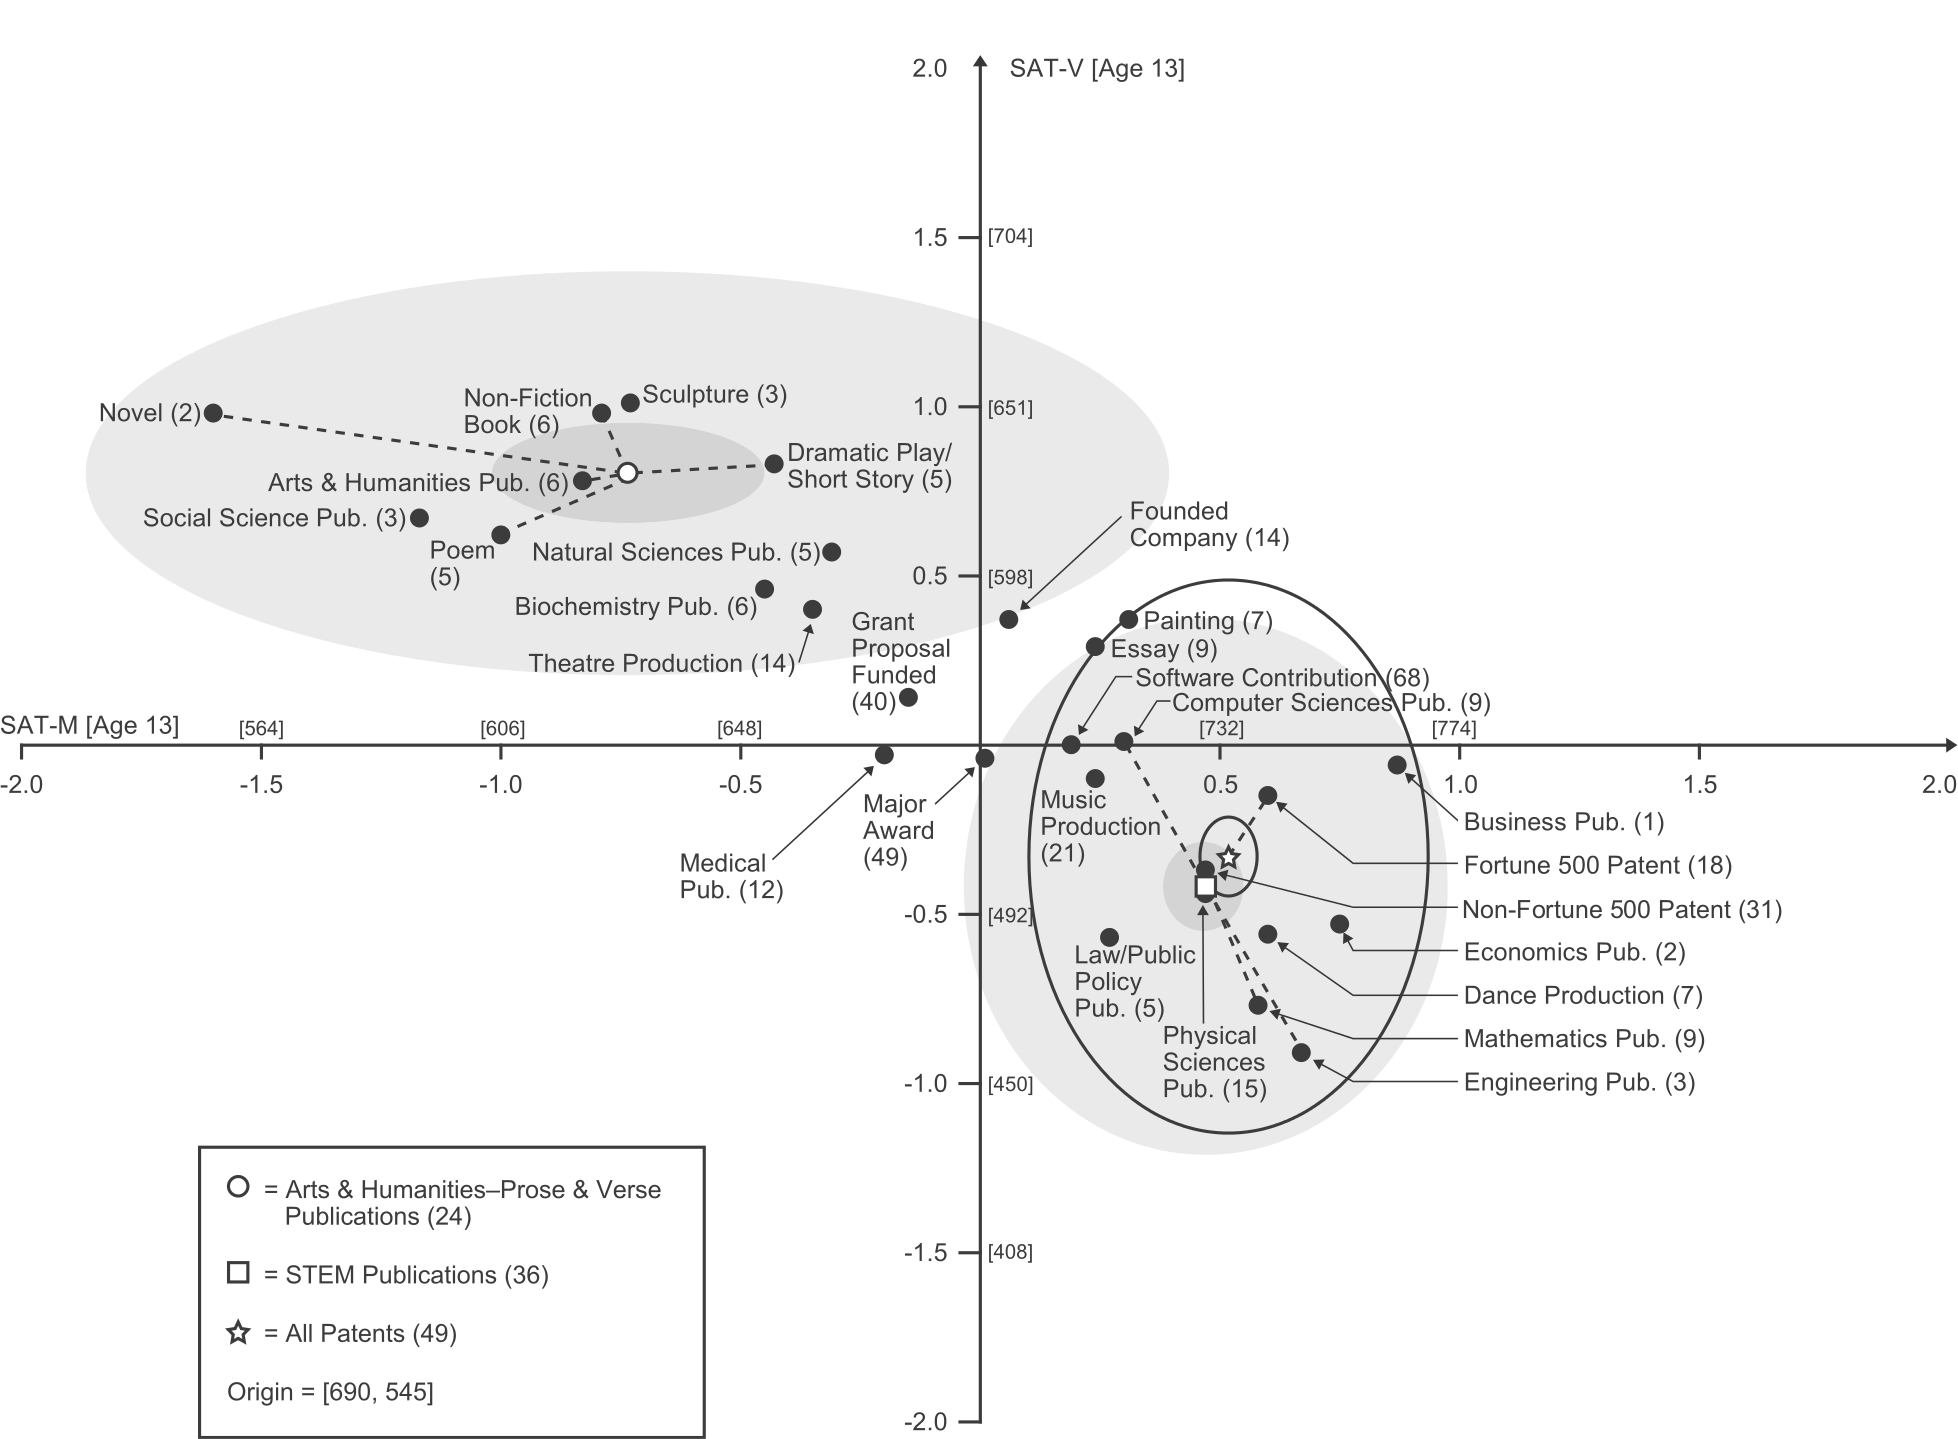
Bivariate means for age-13 SAT-Math (SAT-M; x) and SAT-Verbal (SAT-V; y) scores within creative-accomplishment category (when participants were 38 years old). See Figure 1 for an explanation of the notational scheme. STEM = science, technology, engineering, and mathematics.
To ascertain whether there are meaningful outcome constellations within these figures, and to assess how distinct these constellations are from each other, we plotted centroids on each figure by rationally grouping together related achievements with reasonable sample sizes according to their content. These centroids were defined by averaging bivariate points for outcomes that had an appreciable degree of content similarity, as well as thematic unity across the life span, such that achievement within a given thematic amalgam would be anticipated across the developmental spectrum. For example, for graduate degrees (Fig. 1), we grouped together individuals who had advanced terminal degrees in astronomy, chemistry, computer and information sciences, engineering, mathematics, physics, and statistics and computed the bivariate SAT-M/SAT-V mean for this amalgam (viz., STEM; n = 90)].
To evaluate the distinctiveness of the centroids, we surrounded each with two tiers of ellipses: an inner ellipse formed by the standard errors of the SAT-M and SAT-V means for that centroid and an outer ellipse formed by the standard deviations of SAT-M and SAT-V scores in that centroid. To the extent that the elliptical tiers of one centroid do not overlap with the tiers of another, the data indicate that one must assess specific cognitive abilities with measures having extraordinarily high ceilings in order to understand the differential development of profoundly gifted young adolescents, underscoring the importance of the measures used for identifying this special population.
Magnitude of development
To assess the magnitude of participants’ accomplishments, we constructed Tables 1 through 3. These data speak to the extent to which participants occupy leadership and occupational roles wherein highly valued resources are invested and sophisticated judgments are needed to ensure individual and organizational well-being. The substantive significance of participants’ attainments and obligations are revealed in these tables.
Details on Participants’ Creative Accomplishments and Caliber of Organizations Granting Major Awards to Participants by Age 38
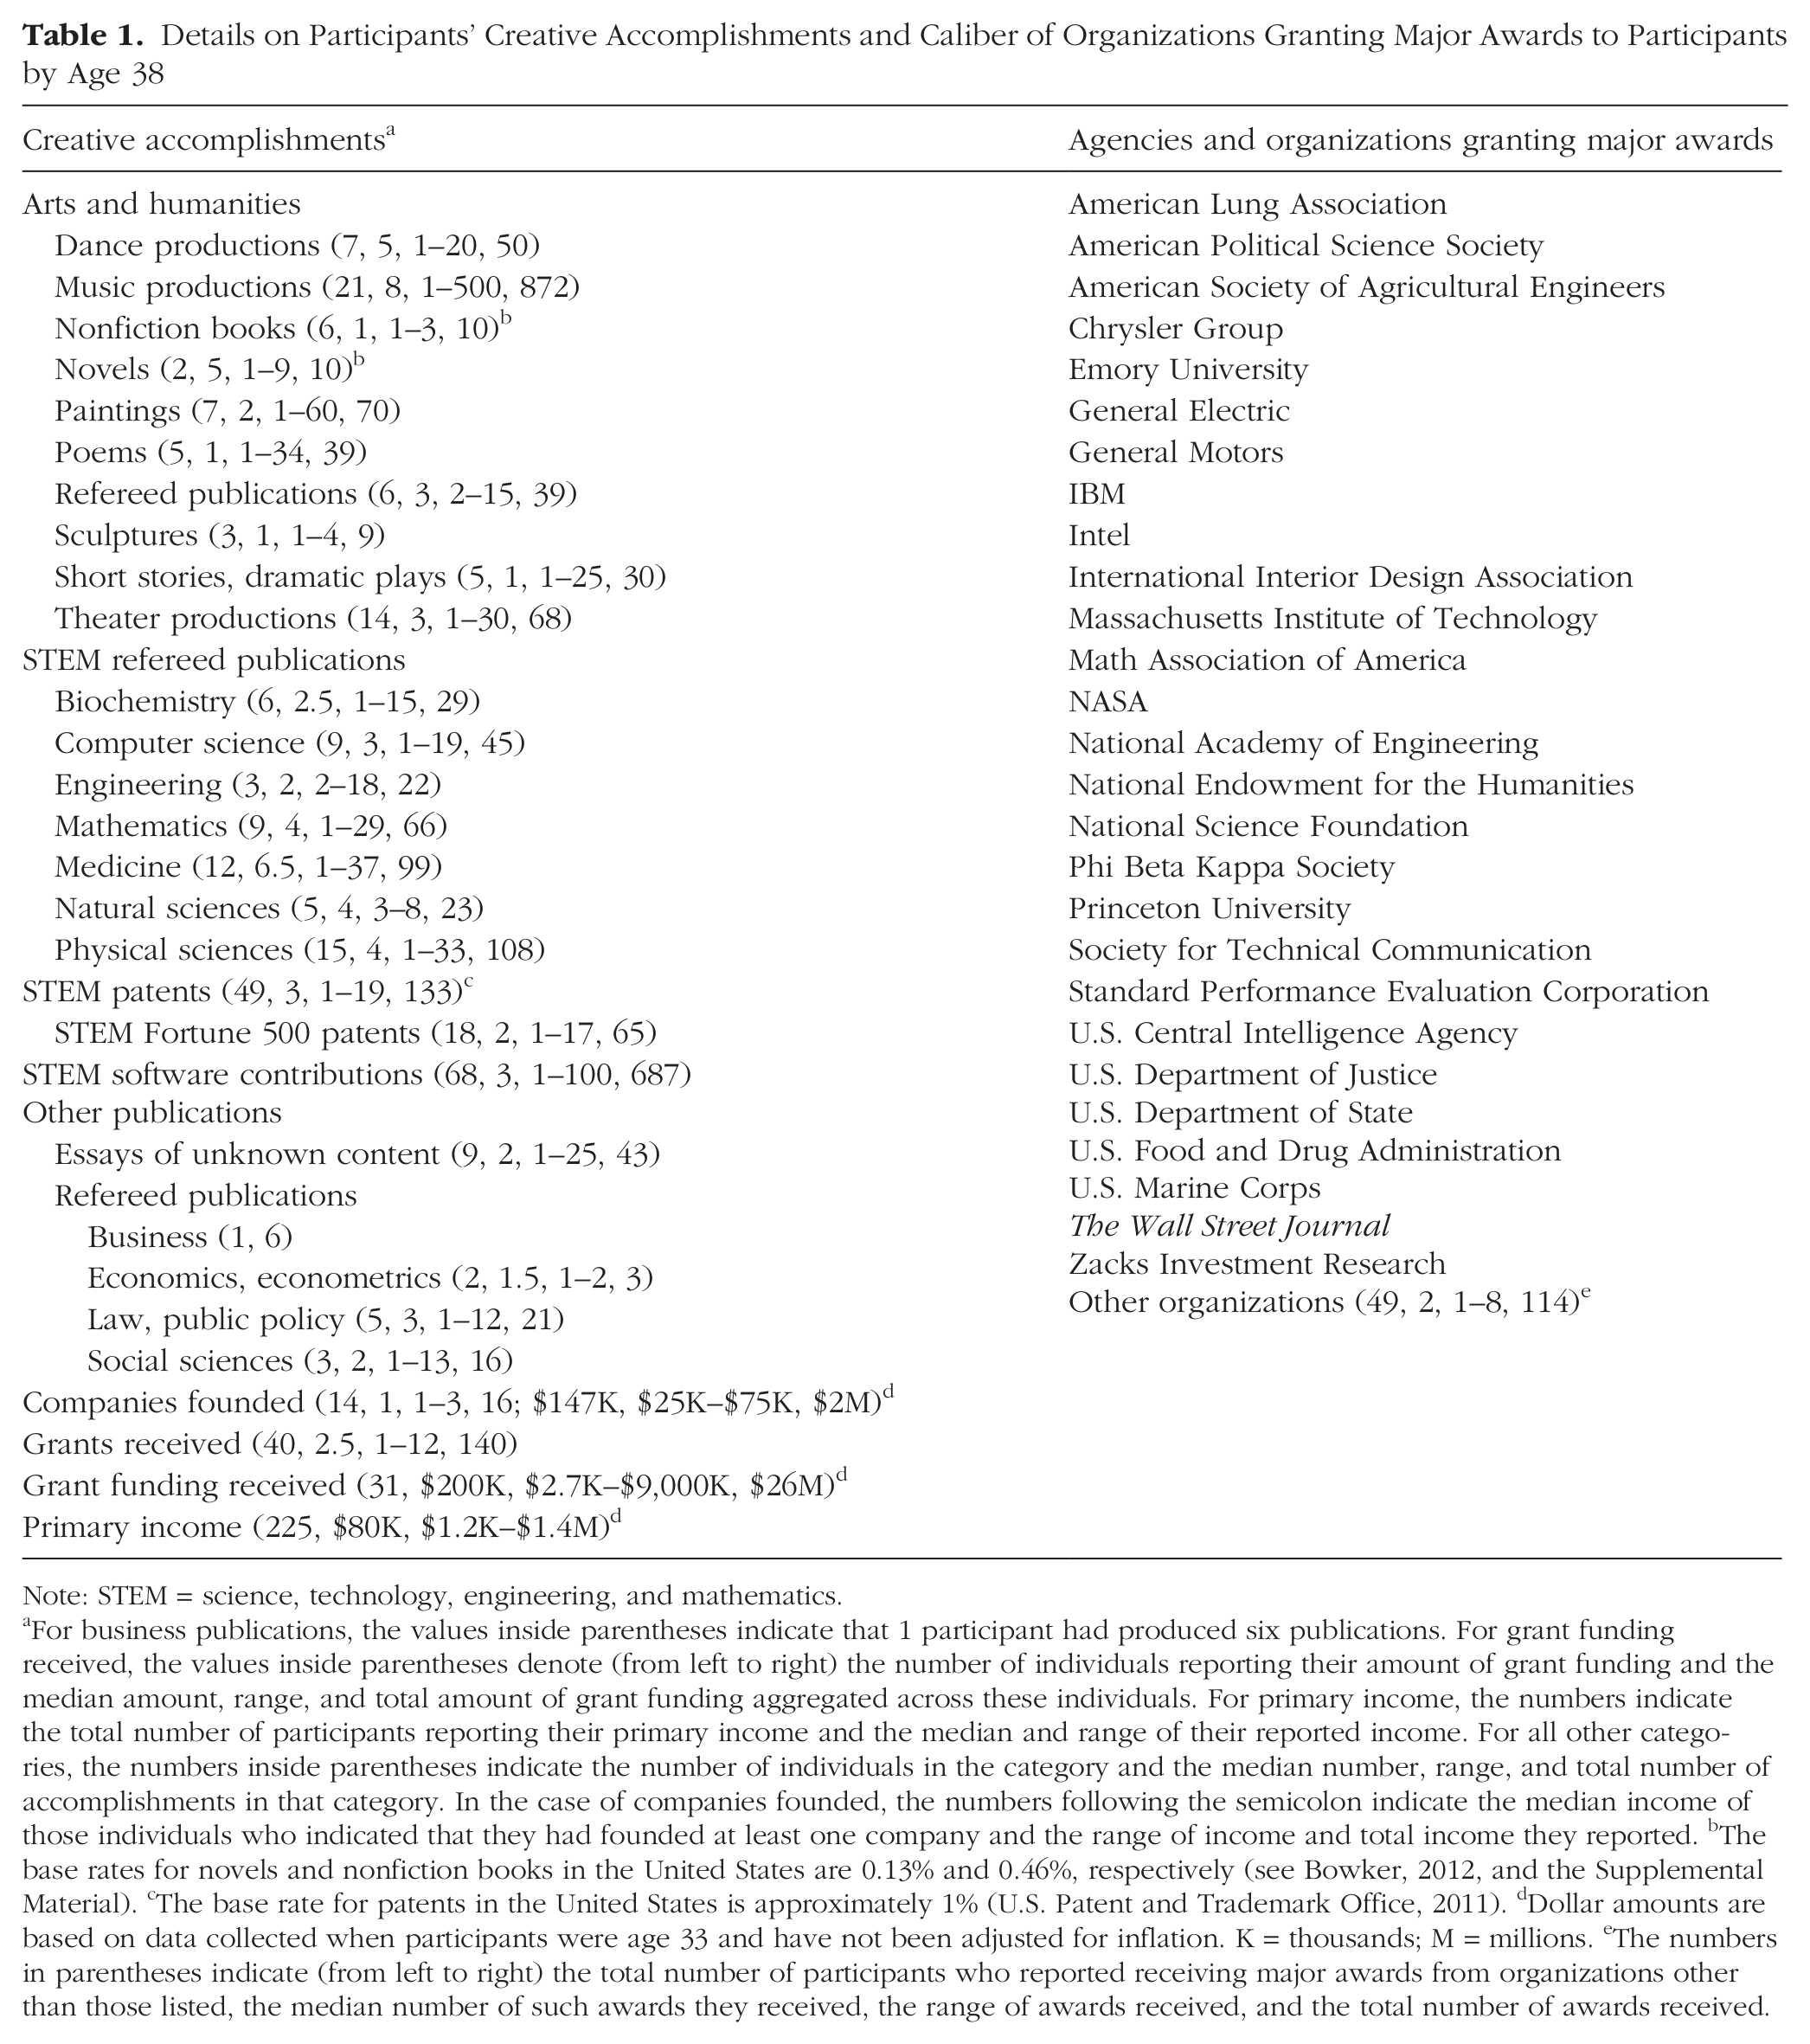
Note: STEM = science, technology, engineering, and mathematics.
For business publications, the values inside parentheses indicate that 1 participant had produced six publications. For grant funding received, the values inside parentheses denote (from left to right) the number of individuals reporting their amount of grant funding and the median amount, range, and total amount of grant funding aggregated across these individuals. For primary income, the numbers indicate the total number of participants reporting their primary income and the median and range of their reported income. For all other categories, the numbers inside parentheses indicate the number of individuals in the category and the median number, range, and total number of accomplishments in that category. In the case of companies founded, the numbers following the semicolon indicate the median income of those individuals who indicated that they had founded at least one company and the range of income and total income they reported. bThe base rates for novels and nonfiction books in the United States are 0.13% and 0.46%, respectively (see Bowker, 2012, and the Supplemental Material). cThe base rate for patents in the United States is approximately 1% (U.S. Patent and Trademark Office, 2011). dDollar amounts are based on data collected when participants were age 33 and have not been adjusted for inflation. K = thousands; M = millions. eThe numbers in parentheses indicate (from left to right) the total number of participants who reported receiving major awards from organizations other than those listed, the median number of such awards they received, the range of awards received, and the total number of awards received.
Participants’ Job Titles at Age 38 and Descriptions of Their Employing Organizations
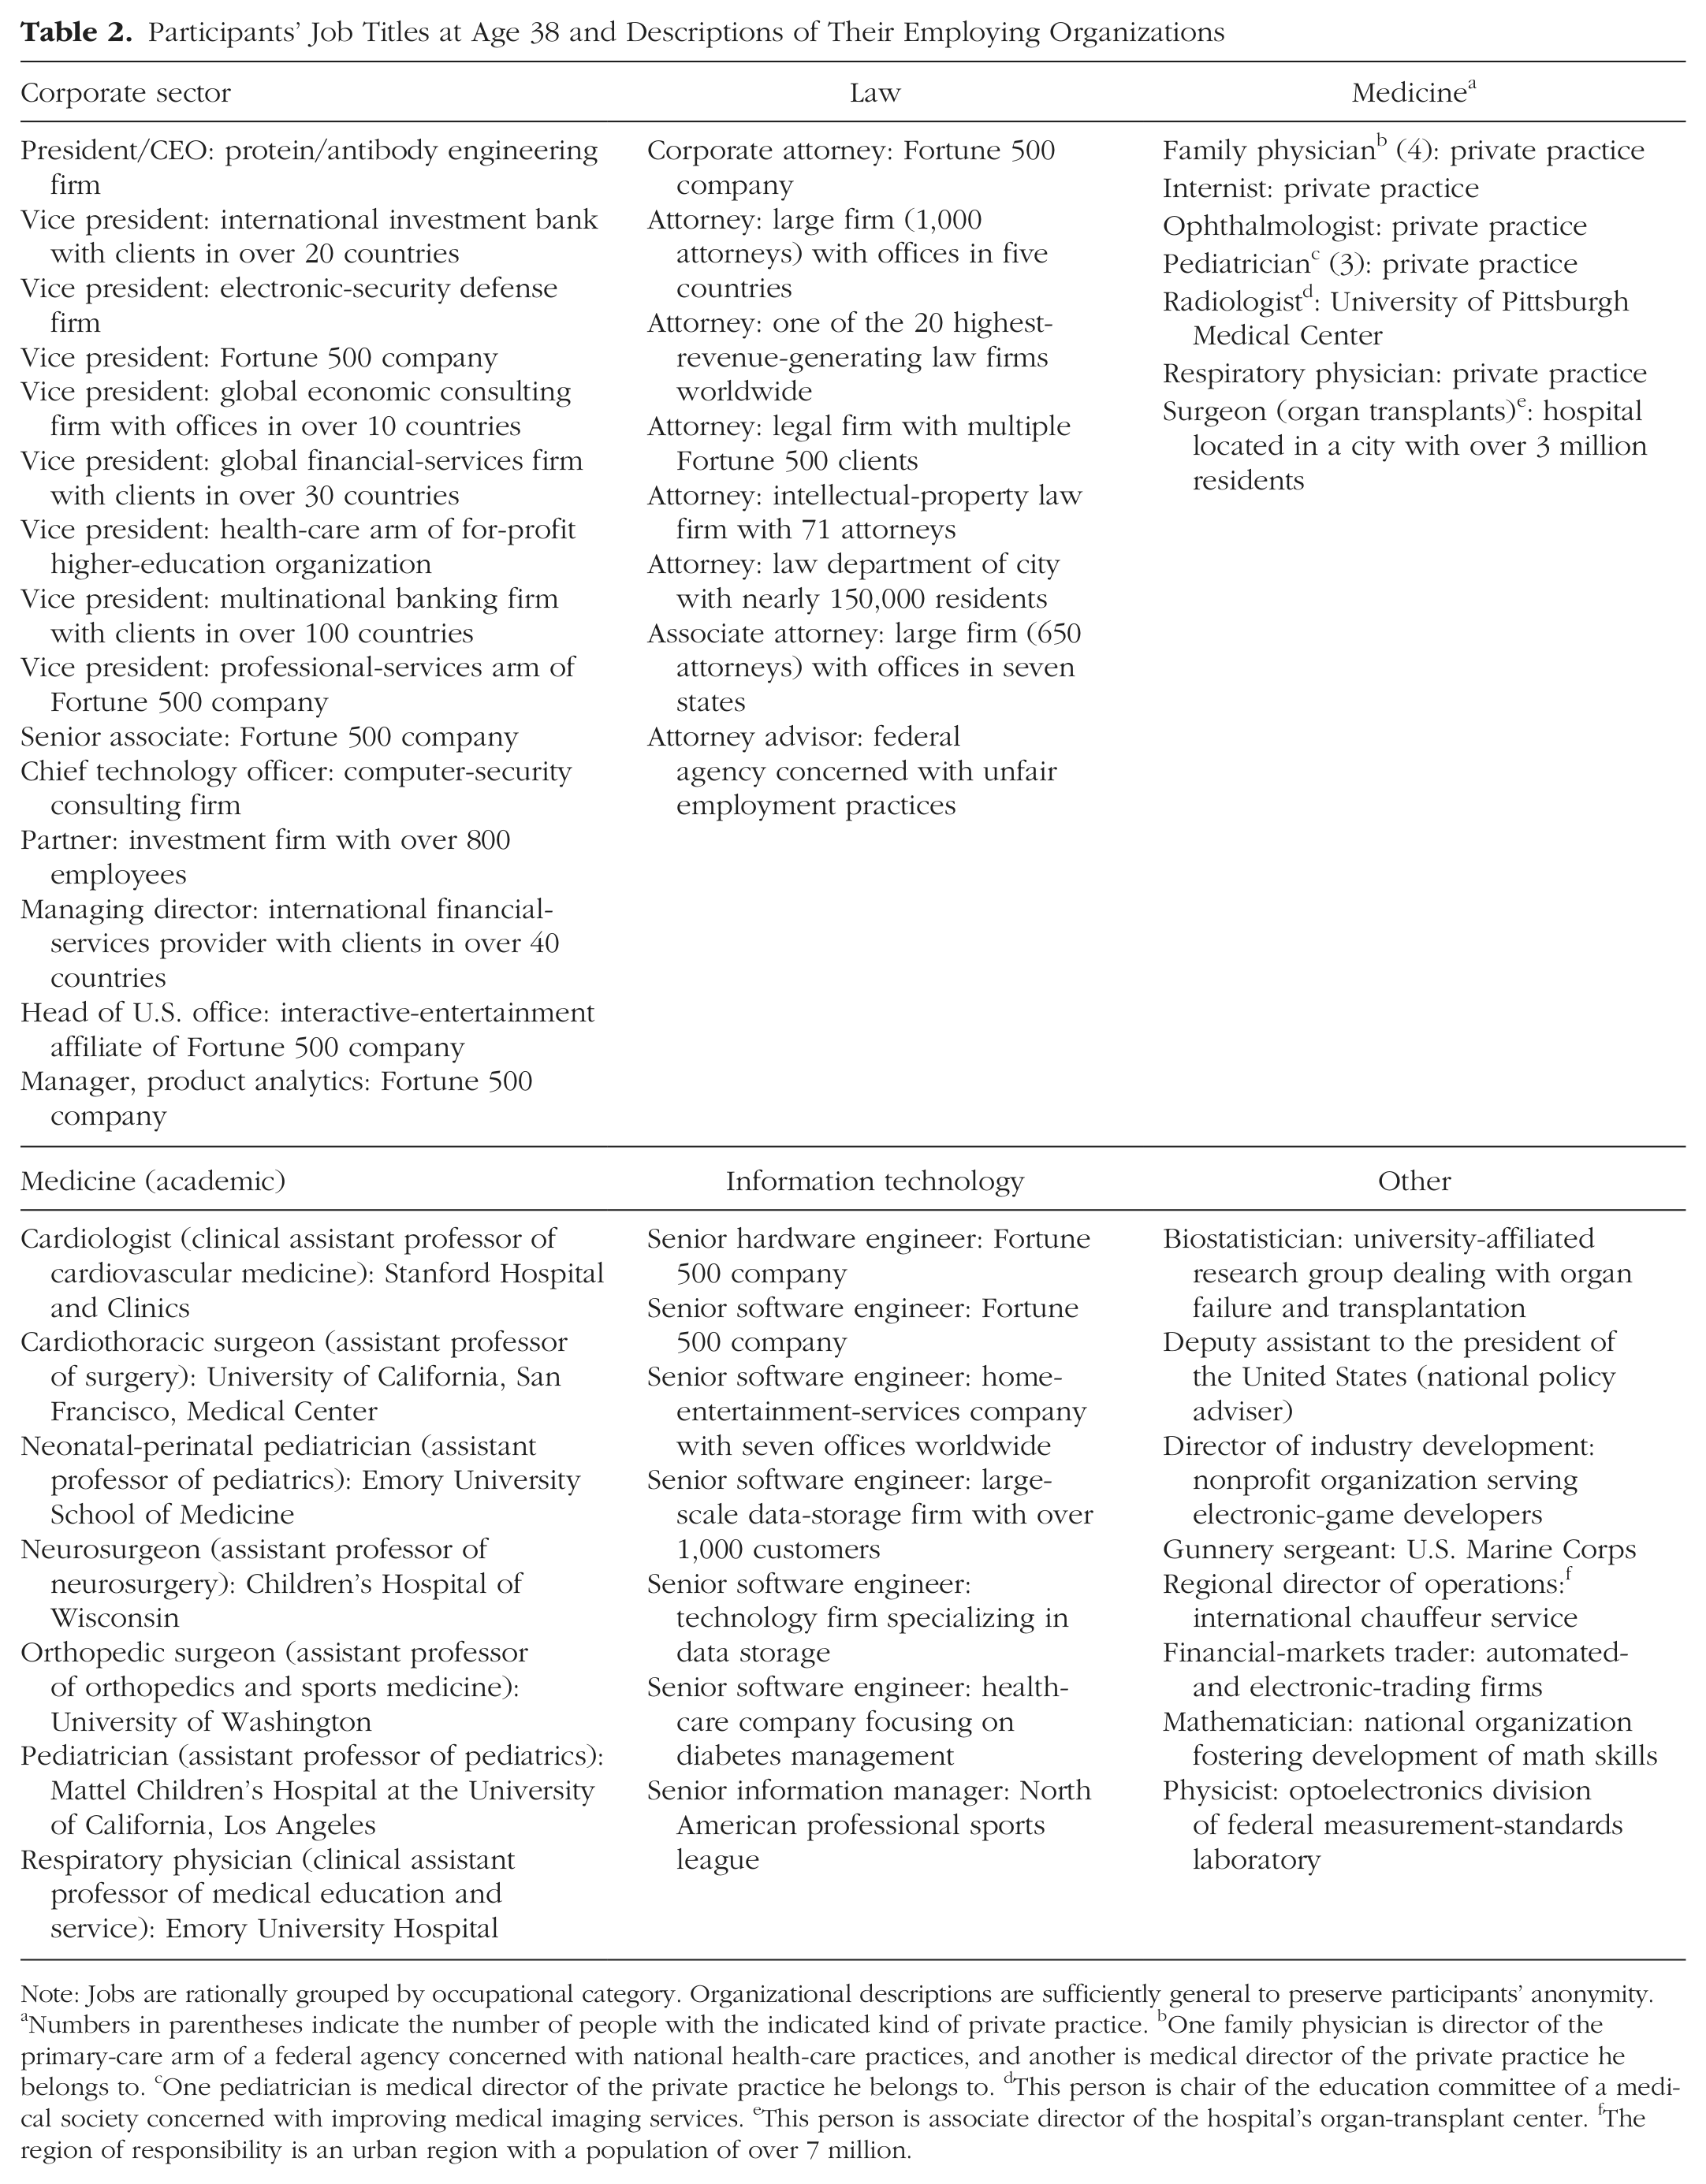
Note: Jobs are rationally grouped by occupational category. Organizational descriptions are sufficiently general to preserve participants’ anonymity.
Numbers in parentheses indicate the number of people with the indicated kind of private practice. bOne family physician is director of the primary-care arm of a federal agency concerned with national health-care practices, and another is medical director of the private practice he belongs to. cOne pediatrician is medical director of the private practice he belongs to. dThis person is chair of the education committee of a medical society concerned with improving medical imaging services. eThis person is associate director of the hospital’s organ-transplant center. fThe region of responsibility is an urban region with a population of over 7 million.
Institutions at Which Participants Had Been Granted Academic Tenure by Age 38 and Refereed Publications in Which Their Work Had Appeared
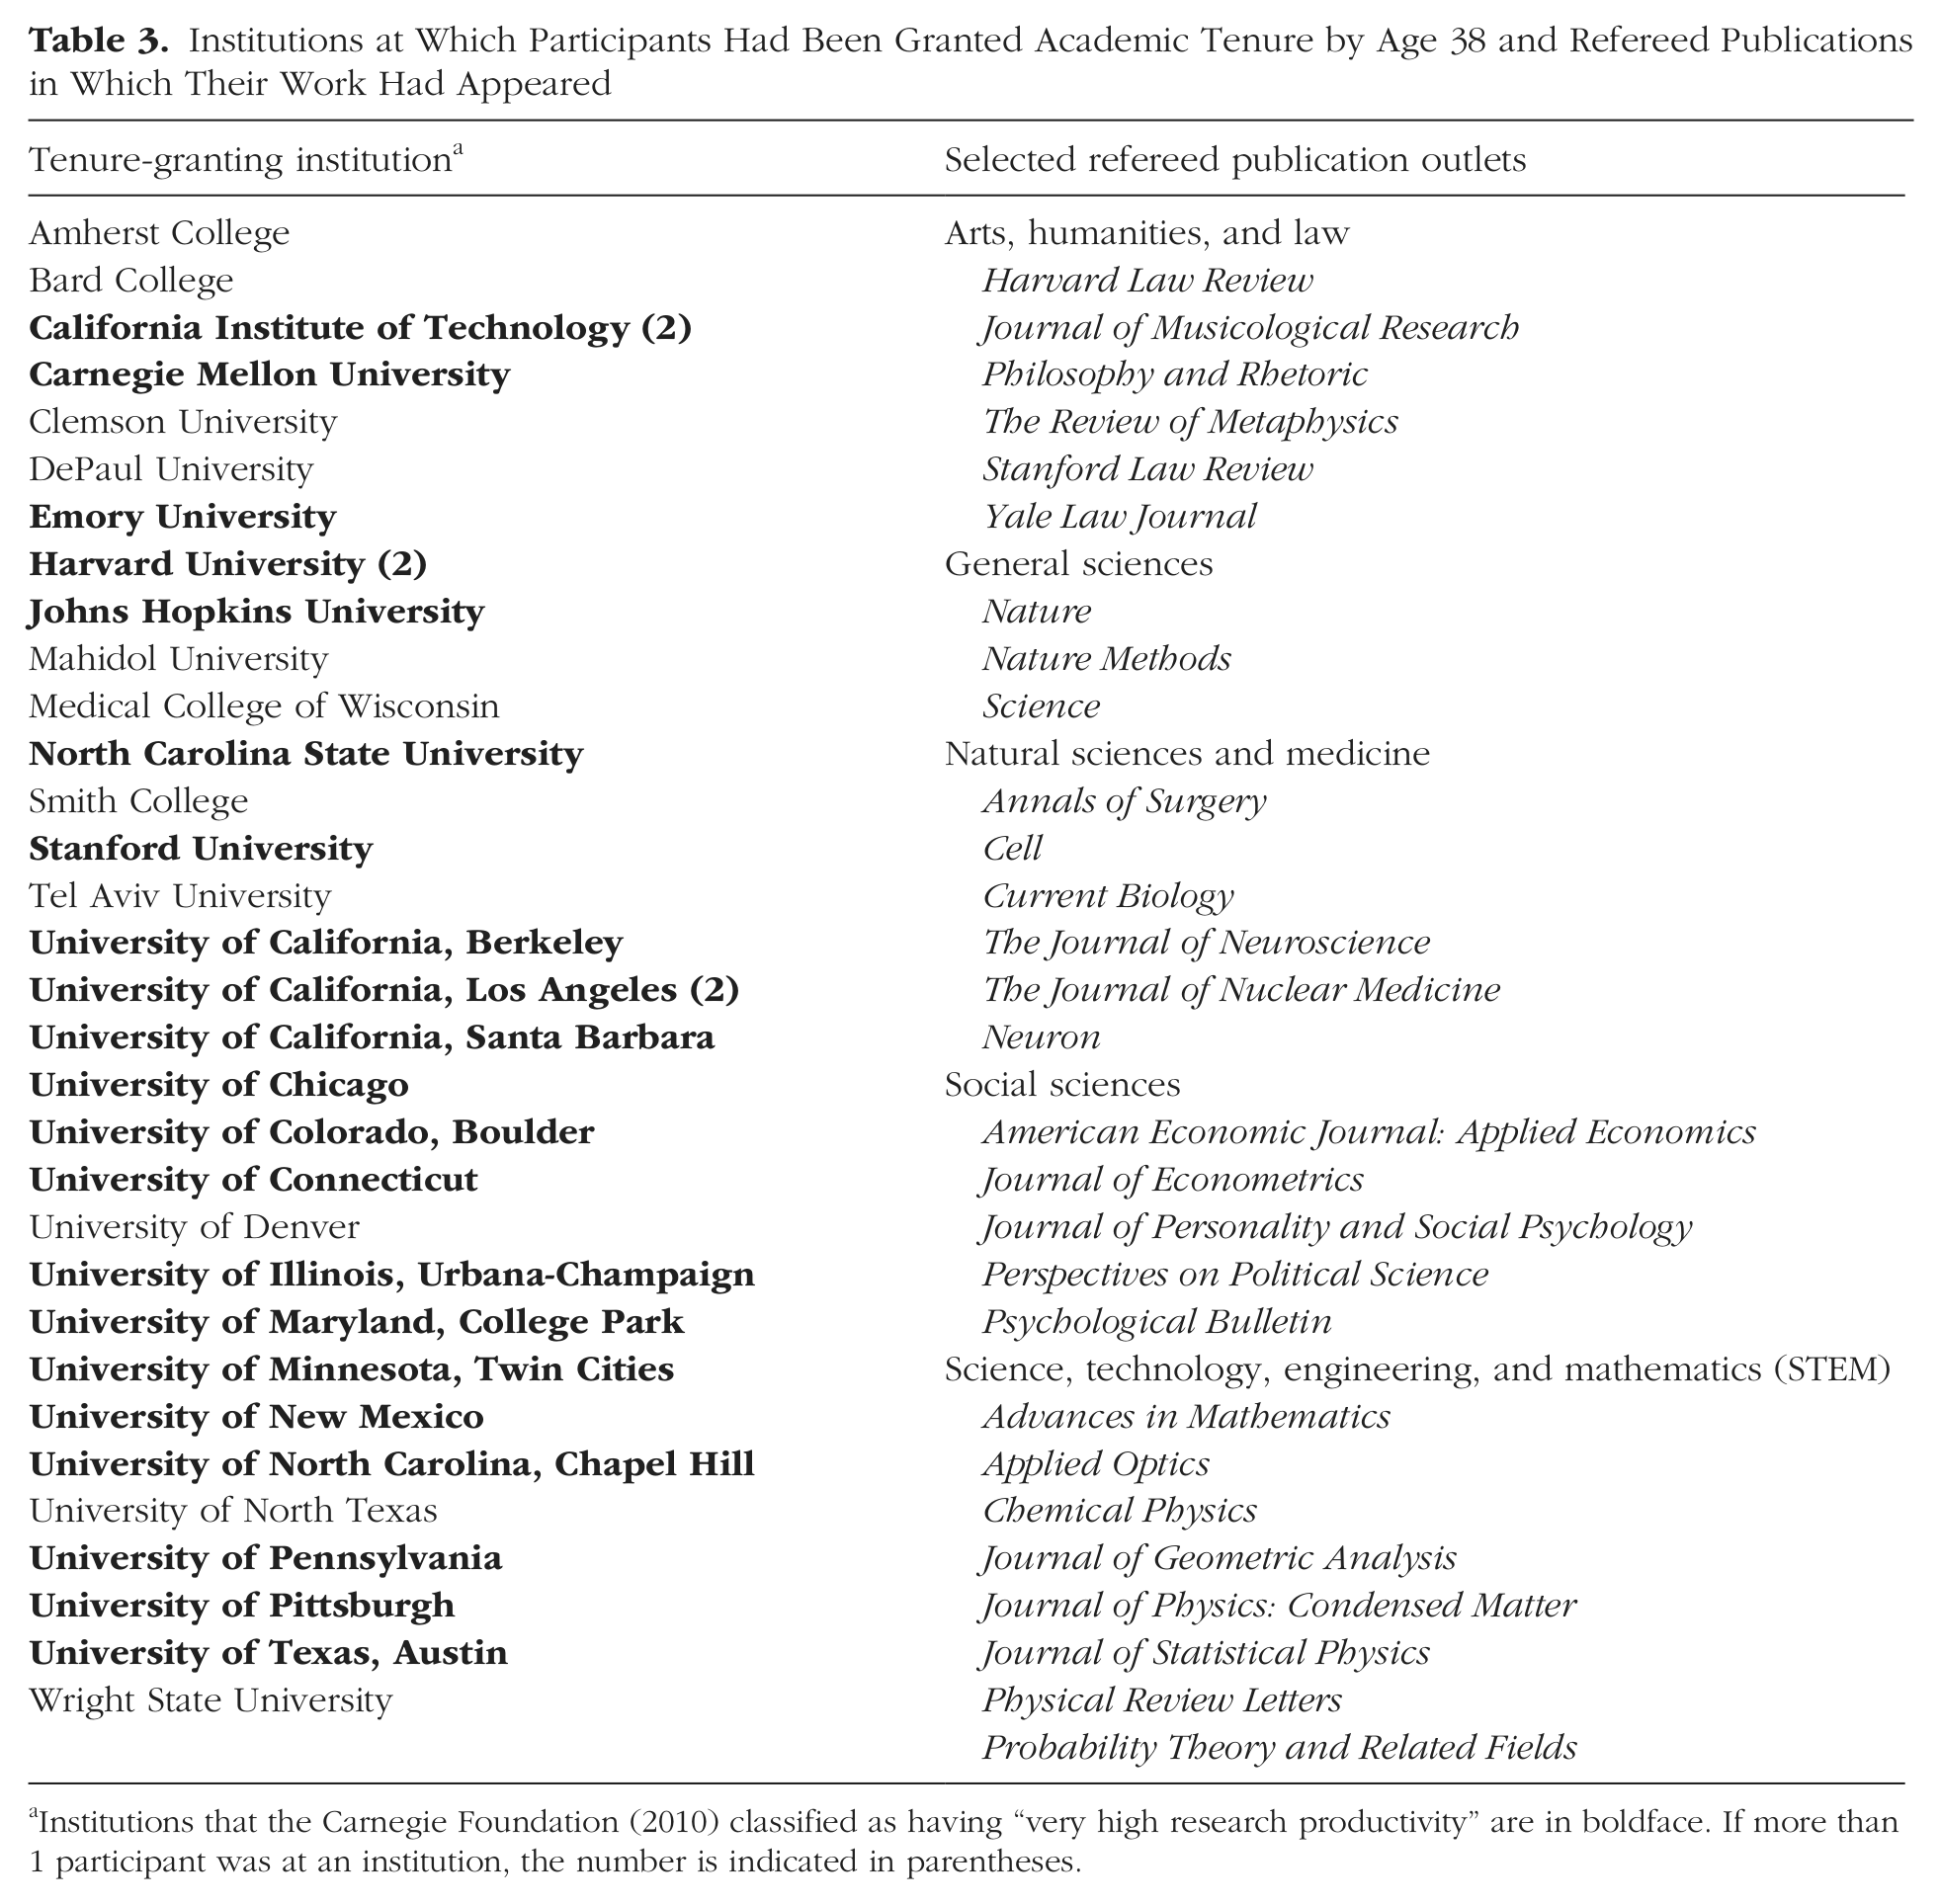
Institutions that the Carnegie Foundation (2010) classified as having “very high research productivity” are in boldface. If more than 1 participant was at an institution, the number is indicated in parentheses.
Results
Nature of accomplishment
Two distinct groupings emerged in the same locations in all three figures: Humanistic-linguistic-literary outcomes are concentrated in the northwest segment of each figure, whereas STEM outcomes are concentrated in the southeast segment. Figures 1 and 2 reveal that degrees and occupations in law occupy an intermediate location in the space defined by mathematical and verbal reasoning abilities. Evidence that the groupings are even more psychologically distinctive than portrayed here is provided by findings documenting appreciable ceiling effects for SAT-M in a number of cases. For example, the 21 members of the group with astronomy and physics degrees (Fig. 1) had a mean age-13 SAT-M of 740, only 60 points from the top possible score of 800. Ceiling effects are also evident in Figures 2 and 3; overall, the centroids for STEM accomplishments in particular would be more to the right in all three figures if measures with higher ceilings had been utilized. 2
Two hundred three participants (63%) reported holding advanced terminal degrees (master’s and above). Of the 320 individuals surveyed, 142 (44%) held doctoral degrees (Ph.D., M.D., or J.D.); 8 of these 142 had joint doctoral degrees (M.D. and Ph.D. or J.D. and Ph.D.). For benchmarks, consider that approximately 2% of the general population hold a doctoral degree (U.S. Census Bureau, 2012) and approximately 23% of the top 1% in ability hold doctorates (Lubinski & Benbow, 2006).
In general, bivariate means for advanced degrees with an organic focus (e.g., biological sciences, social sciences) are located closer to the arts-humanities centroid in Figure 1, whereas means for degrees emphasizing an inorganic orientation (e.g., computer and information sciences, engineering) are located closer to the STEM centroid. For many of these degree categories, however, definitive conclusions are not possible because of small sample sizes. Yet meaningful and suggestive patterns are discernible.
In Figure 2, the northwest quadrant is dominated by literary and more organically oriented occupations (e.g., sales, social scientists); the centroid for arts, humanities, and writing occupations corresponds closely to the arts-humanities degree centroid in Figure 1. Bivariate points in the southeast quadrant of Figure 2 generally represent technical, more inorganic occupations (e.g., engineers, mathematicians).
Figure 3 differs from the other two figures in that the sample size for accomplishments in law (i.e., legal publications) was not sufficient to warrant computing ellipses for comparisons with the centroids representing STEM and arts-humanities accomplishments. Consequently, instead we computed a centroid for patents (n = 49 participants; an amalgam of Fortune 500 patents and an amalgam of non–Fortune 500 patents), which occupies a space nearly identical to that of creative accomplishments in STEM.
Magnitude of accomplishment
Although the figures illustrate how distinct accomplishments among profoundly gifted individuals are anticipated by assessments of their early pattern of cognitive ability, these graphs do not capture the magnitude of participants’ accomplishments or the substantive significance of the occupational roles they occupy. We compiled the quantitative and qualitative data in Tables 1 through 3 to provide such a picture.
Table 1 reveals the richness and scope of participants’ activities. One indication of the caliber of their contributions is the prestige of the organizations that have awarded them grants. The data on creative accomplishments speak for themselves, but a few summary remarks are in order. In the arts and humanities, 24 individuals had produced 128 creative written works (e.g., poems, novels, refereed publications), an average of 5.3 accomplishments per individual. In the same domain, 52 people had produced 1,069 achievements in the fine arts (e.g., music, sculpture), an average of 20.6 accomplishments per person. STEM achievements are also noteworthy. Fifty-nine individuals had produced refereed STEM publications, in areas ranging from biochemistry to engineering; the total number of STEM publications produced was 392 (6.6 per person). In the case of software development and patents, 117 people had made 820 contributions, an average of 7 per individual. Thirty-one individuals had received more than $25 million in grants, an average of $825,635 per person. The tally of awards and significant accomplishments for these 320 individuals was 2,749, or an average of 8.6 per person.
Table 2 lists participants’ job titles and describes their employers, so that the substantive significance of participants’ occupational responsibilities, roles, and professional stature can be evaluated. To avoid revealing individual identities, we present the information in somewhat general terms, which impedes obtaining a full understanding. Yet enough information is provided to make clear that a number of participants are working for world-class organizations and hold important positions of impact and responsibility in Fortune 500 companies, technology, law, and medicine.
For the professoriate in our sample, Table 3 lists universities that either awarded them tenure or attracted them with tenure, plus some of their refereed publication outlets. In total, 11.3% of participants had earned tenure at accredited institutions; 7.5% had tenure at research-intensive institutions (Carnegie Foundation, 2010). This latter percentage is many, many times the base-rate expectation, given the 2% base rate for doctorates in the United States and the fact that only a tiny fraction of the individuals with doctorates have tenure at research- intensive institutions.
Discussion
Although it would be difficult to quantify participants’ collective accomplishments in a single number, by any standard, it appears that many individuals identifiable by age 13 as having profound mathematical and verbal reasoning ability develop into truly outstanding contributors in their respective fields. Not only did participants choose prestigious occupations by age 38 (Fig. 2 and Table 2), but the organizations employing them were impressive as well (Tables 2 and 3). Although a number of our data counts do not reflect the quality of participants’ contributions, the organizations employing participants (e.g., Fortune 500 companies, major law firms, large medical facilities, and research universities) and bestowing awards on them (e.g., the U.S. Departments of State and Justice, the National Science Foundation, Intel Corporation, NASA, and The Wall Street Journal) afford reasonable quality appraisals of their creative products as well as the responsibilities, resources, and trust that they have earned.
More than 7% of participants held tenure at research-intensive universities (including many considered the best in the world) by the time they were age 38. The 14 attorneys were predominantly working in positions of significant responsibility for major firms or organizations. The 19 physicians were also highly accomplished: Seven were assistant professors, 2 were directors of major private practices, and 1 codirected a hospital organ-transplant center serving more than 3 million people. Rather than working for established organizations, 14 individuals founded companies of their own. Two individuals were vice presidents at Fortune 500 companies; 2 others were Fortune 500 senior hardware or software engineers. Several participants were active in government agencies at local and federal levels—one advised the president of the United States on national policy issues.
Although participants’ accomplishments are impressive in variety and scope, it is important to note the magnitude of individual differences in output, even in this exceptionally talented sample. Within several accomplishment groupings, some individuals far outstripped their intellectual peers. For example, in the arts and humanities, one individual produced 500 musical productions, accounting for more than 57% of the musical productions reported here; three individuals produced 100 software contributions each, or nearly 44% of the total reported. Seven participants received more than $1 million in grant funding each; collectively, their funding amounted to nearly $20 million, more than 77% of the total sample’s grant funding; one individual alone received $9 million in grant funding. Finally, one person founded three companies, and another was responsible for raising more than $65 million in private equity investment to fund his company.
These findings mirror those in Galton’s (1869/2006) investigation of the Cambridge University “wranglers,” the 40 top-scoring students out of the approximately 100 honors mathematics graduates each year (400–450 students graduated from Cambridge annually). Wranglers were rank-ordered according to their scores on their final mathematics exam (a 44-hr test spread over 8 days). Although being even a low-ranked wrangler was enough for a graduate to obtain a fellowship at a small college, Galton found that the highest-ranked wrangler tended to do more than twice as well on the final exam as the second-ranked wrangler and approximately 4 times better than the lowest-ranked wranglers. Examiners emphasized that the units of measurement they employed were designed to index equal intervals, such that twice the score range translated into approximately twice the knowledge. Such outlying individual differences in accomplishments, even among the most talented, are readily observed throughout history (Murray, 2003). This is one reason why O’Boyle and Aguinis (2012) argued that, given the output of truly outstanding performers, performance in general is better modeled through Paretian (power law) distributions as opposed to Gaussian (normal-curve) distributions (Simonton, 1999a, 1999b).
However, for understanding qualitative differences in the nature of development among individuals with profound intellectual talent, ability pattern is critical. Atypical measures are needed to reveal that their artistic and humanistic accomplishments, from terminal degrees attained to creative products, are consistently associated with intellectual profiles favoring verbal over mathematical ability, and that their accomplishments in STEM fields are associated with the opposite intellectual configuration. 3 Overall, mathematically more able individuals tended to focus on achievement in inorganic fields, whereas verbally more able individuals tended to invest their talent in organic fields; incorporating motivational dimensions, such as interests in people versus things, or in organic versus inorganic learning and work domains (which covary with specific abilities in contrasting ways), adds psychological nuance to these trends (Lubinski & Benbow, 2000; Su, Rounds, & Armstrong, 2009).
Other investigators have observed the importance of ability patterning for differential accomplishments in education and the world of work among talented students (Gottfredson, 2003; Wai, Lubinski, & Benbow, 2009), and even students in the top 1% of ability (Gohm, Humphreys, & Yao, 1998; Park, Lubinski, & Benbow, 2007). However, the current investigation studied participants who were profoundly gifted (top 1 in 10,000), as indicated by at least one SAT score. Moreover, for 94% of these participants their less impressive SAT score placed them in the top 1% of ability—and the lower score for 78% was in the top 0.5% (see Fig. S1 in the Supplemental Material); almost all members of this sample had both mathematical and verbal reasoning abilities higher than those of the vast majority of Ph.D.s in any discipline (Wai et al., 2009, Figs. 6 and B1). So it is not the case that once a critical level of a specific ability for a particular discipline is reached, all educational and career paths are considered open for commensurate consideration; rather, the profoundly gifted, like talented but more typical students (Gottfredson, 2003), tend to choose learning and work environments as a function of the respective strengths of their abilities.
International procedures for talent identification and development
The procedures utilized for identifying exceptional talent in this study mirror contemporary procedures used internationally (Friedman, 2007; Zakaria, 2011). However, specific measures, methods, and criteria are needed to psychologically characterize and interpret the development of such populations. Moreover, it is important to point out solid findings that adolescents with extraordinary talent in mathematical and verbal reasoning profit from learning environments that present abstract-symbolic material at a level and pace commensurate with the atypical rates at which these students learn (Stanley, 2000). Such environments enhance their academic motivation and psychological well-being, and increase the likelihood of their making future noteworthy accomplishments (Benbow & Stanley, 1996; Colangelo, Assouline, & Gross, 2004; Park, Lubinski, & Benbow, 2013; Wai, Lubinski, Benbow, & Steiger, 2010). We therefore take issue with Zakaria’s (2011) statement, “Place them in any educational system, and they will do well.” Just as extraordinary abilities require atypical measures if their full scope is to be indexed, individuals with such abilities require atypical learning opportunities for optimal growth (Benbow & Stanley, 1996; Colangelo et al., 2004).
Limitations
To the extent that our criterion searches missed some of participants’ accomplishments at age 38 (as discussed in the Supplemental Material), our outcome profiles are incomplete. Also, the full scope of participants’ mathematical reasoning abilities was not measured; at age 13, many participants’ scores approached the ceiling of the SAT-M. The fact that spatial ability was not assessed at age 13 is an important limitation. Much evidence suggests that spatial ability adds value to mathematical and verbal reasoning abilities in predicting both educational and occupational outcomes (Wai et al., 2009); it is likely that including spatial ability would also contribute to predicting the outcomes we examined (Kell, Lubinski, Benbow, & Steiger, in press).
Other attributes would complement measures of cognitive abilities for modeling exceptional human talent, or building a “cognitive epidemiology” of exceptional promise (Lubinski, 2009). Beyond assessing intellectual talent multidimensionally and in its full scope, models of exceptional performance need to assess nonintellectual determinants, such as commitment, interests, values, and personality, to ascertain more precisely where intellectual talent is likely to be channeled and the degree to which it will be applied with persistence (Ceci & Williams, 2011; Judge, Klinger, & Simon, 2010; Lubinski & Benbow, 2000, 2006; Su et al., 2009). Ability, motivation, and opportunity are all needed to paint a comprehensive portrait of exceptional human potential and the varied supports required for its optimal development at different stages over the life span. Because some current conceptual frameworks minimize one or more of these essential components, we take the opportunity here to emphasize the importance of all three.
Conclusion
Young adolescents with profound talent in mathematical and verbal reasoning hold extraordinary potential for enriching society by contributing creative products and competing in global economies. Many hold important leadership roles and are entrusted with obligations and responsibilities essential for individual and organizational well-being. Above-level assessment techniques are an efficient means of identifying large numbers of profoundly talented young adolescents. The evidence examined here suggests that they constitute the far edge of a population whose continued success will be further emphasized—globally—for the foreseeable future.
Footnotes
Acknowledgements
Earlier versions of this manuscript benefited by comments from Kimberley Ferriman-Robertson, Rachel Morgan, Gregory Park, William Revelle, Stijn Smeets, Jonathan Wai, and Rose Mary Webb.
Declaration of Conflicting Interests
The authors declared that they had no conflicts of interest with respect to their authorship or the publication of this article.
Funding
Support for this study was provided by a research and training grant from the Templeton Foundation and by National Institute of Child Health and Development Grant P30 HD 15051 to the Vanderbilt Kennedy Center for Research on Human Development.
Notes
References
Supplementary Material
Please find the following supplemental material available below.
For Open Access articles published under a Creative Commons License, all supplemental material carries the same license as the article it is associated with.
For non-Open Access articles published, all supplemental material carries a non-exclusive license, and permission requests for re-use of supplemental material or any part of supplemental material shall be sent directly to the copyright owner as specified in the copyright notice associated with the article.