






Abstract
In the research reported here, we found evidence of the cheerleader effect—people seem more attractive in a group than in isolation. We propose that this effect arises via an interplay of three cognitive phenomena: (a) The visual system automatically computes ensemble representations of faces presented in a group, (b) individual members of the group are biased toward this ensemble average, and (c) average faces are attractive. Taken together, these phenomena suggest that individual faces will seem more attractive when presented in a group because they will appear more similar to the average group face, which is more attractive than group members’ individual faces. We tested this hypothesis in five experiments in which subjects rated the attractiveness of faces presented either alone or in a group with the same gender. Our results were consistent with the cheerleader effect.
Keywords
In the seventh episode of the fourth season of How I Met Your Mother, the character Barney Stinson postulates the cheerleader effect: that people seem more attractive in a group than when considered individually (Rashid & Fryman, 2008). As proposed, this effect is not simply that a member of the cheerleading squad, for instance, is more attractive than a person sitting alone in the bleachers (which could be due to factors such as objective attractiveness, altered demeanor, or social signaling), but rather that any given cheerleader will seem more attractive when seen as part of the squad than in isolation.
We propose that the cheerleader effect occurs at a perceptual level, arising from the interplay between ensemble coding in the visual system and properties of average faces. The visual system automatically computes summary representations of ensembles of objects, such as the average size of an array of dots (Ariely, 2001; Chong & Treisman, 2003), the average orientation of an array of gratings (Parks, Lund, Angelucci, Solomon, & Morgan, 2001), and even the average emotional expression of a group of faces (Haberman & Whitney, 2009). Not only does the summary that is formed influence observers’ perception of the group as a whole, but it also biases their percepts of individual items to be more like the group average (Brady & Alvarez, 2011). Thus, we expected individual faces seen in a group to appear to be more similar to the average of the group than when seen alone. Moreover, the average of a number of faces tends to be perceived as more attractive than the individual faces it comprises (Langlois & Roggman, 1990). Thus, the bias of individual elements toward the ensemble average, when applied to faces, will yield a perception of individual faces as being more attractive than they would otherwise be perceived to be. In other words, the biasing effect of ensemble coding should produce a cheerleader effect. We tested this prediction in five experiments.
Subjects
Subjects were undergraduate students from the University of California, San Diego, and received partial course credit. There were 25 subjects in Experiment 1 (4 men, 21 women), 18 in Experiment 2 (6 men, 12 women), 20 in Experiment 3 (3 men, 17 women), 37 in Experiment 4 (13 men, 24 women), and 39 in Experiment 5 (10 men, 29 women).
Experiments 1 and 2
Subjects rated the attractiveness of female faces in Experiment 1 and male faces in Experiment 2. Faces were presented in a group photograph and in isolated portraits cropped from the group photos.
Method
For each experiment, we found 100 group photographs and cropped them to frame the faces of three people of the same gender. We then cropped each individual face to create three portrait images from each group photo. In both experiments, subjects rated the 300 unique faces twice, once in the group photo and once in an isolated portrait. Ratings were made by moving a mouse to set a marker on a continuous scale from unattractive to attractive (the rating scale and example stimuli are shown in Fig. 1). The order of images and whether a face appeared first in a group or as a portrait was random.
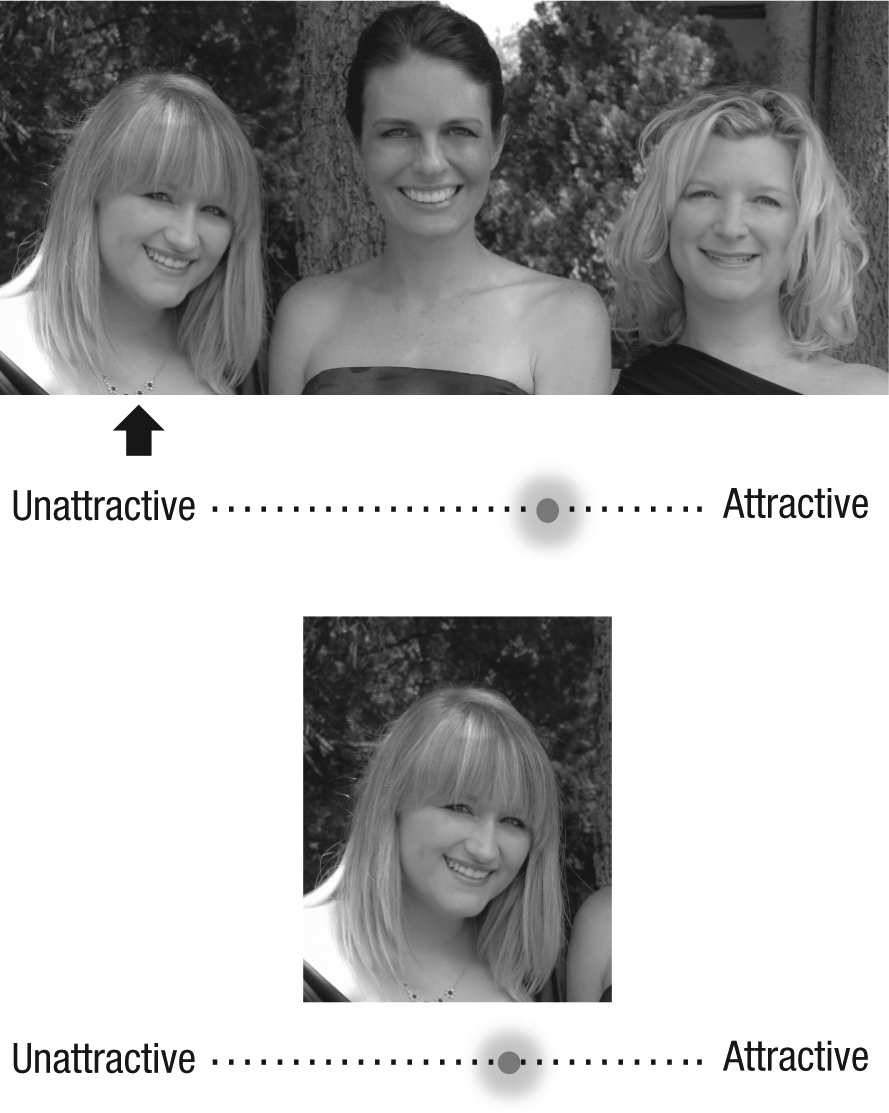
Rating scale and example stimuli used in Experiments 1 and 3. Subjects rated the attractiveness of 300 faces twice, once in a group photo (top; the arrow indicated which face was to be rated) and once in an isolated portrait (bottom). Attractiveness was rated using a mouse to set a marker along a continuous scale. Stimuli were presented in color in the actual experiments.
On group trials, the three faces in the image were rated individually in a random order. Subjects saw the group photo for 1 s, after which an arrow appeared for 1 s below one of the faces (randomly chosen). Then the group image disappeared, and subjects made a rating. The group photo then reappeared for 1s, and the next face was cued for 1 s. This process repeated once more so that all three faces in the image were rated. On portrait trials, the cropped single-person image appeared for 2 s, disappeared, and then subjects made their rating.
Results
In our analysis, we aimed to measure the cheerleader effect, the advantage in perceived attractiveness granted a face when it is seen in a group rather than alone, while factoring out the variation in how individual subjects used our rating scale and variations in how attractive they found the different faces to be. To factor out individual differences in rating-scale use, we converted the raw rating given by a subject for each image in each condition (group and portrait) into a within-subjects z score by subtracting the mean rating and dividing the result by the standard deviation of the 600 ratings made by the subject. To factor out the effect of the attractiveness of specific faces, we then subtracted each subject’s standardized rating of a face presented as a portrait from his or her standardized rating of that same face presented in a group. The resulting difference in z scores corresponded to the number of standard deviations higher that a given image was rated in a group than when isolated in a portrait. Using these difference scores, we assessed the average cheerleader-effect size (z-score difference) for each subject, as well as the average effect size across subjects (Fig. 2).
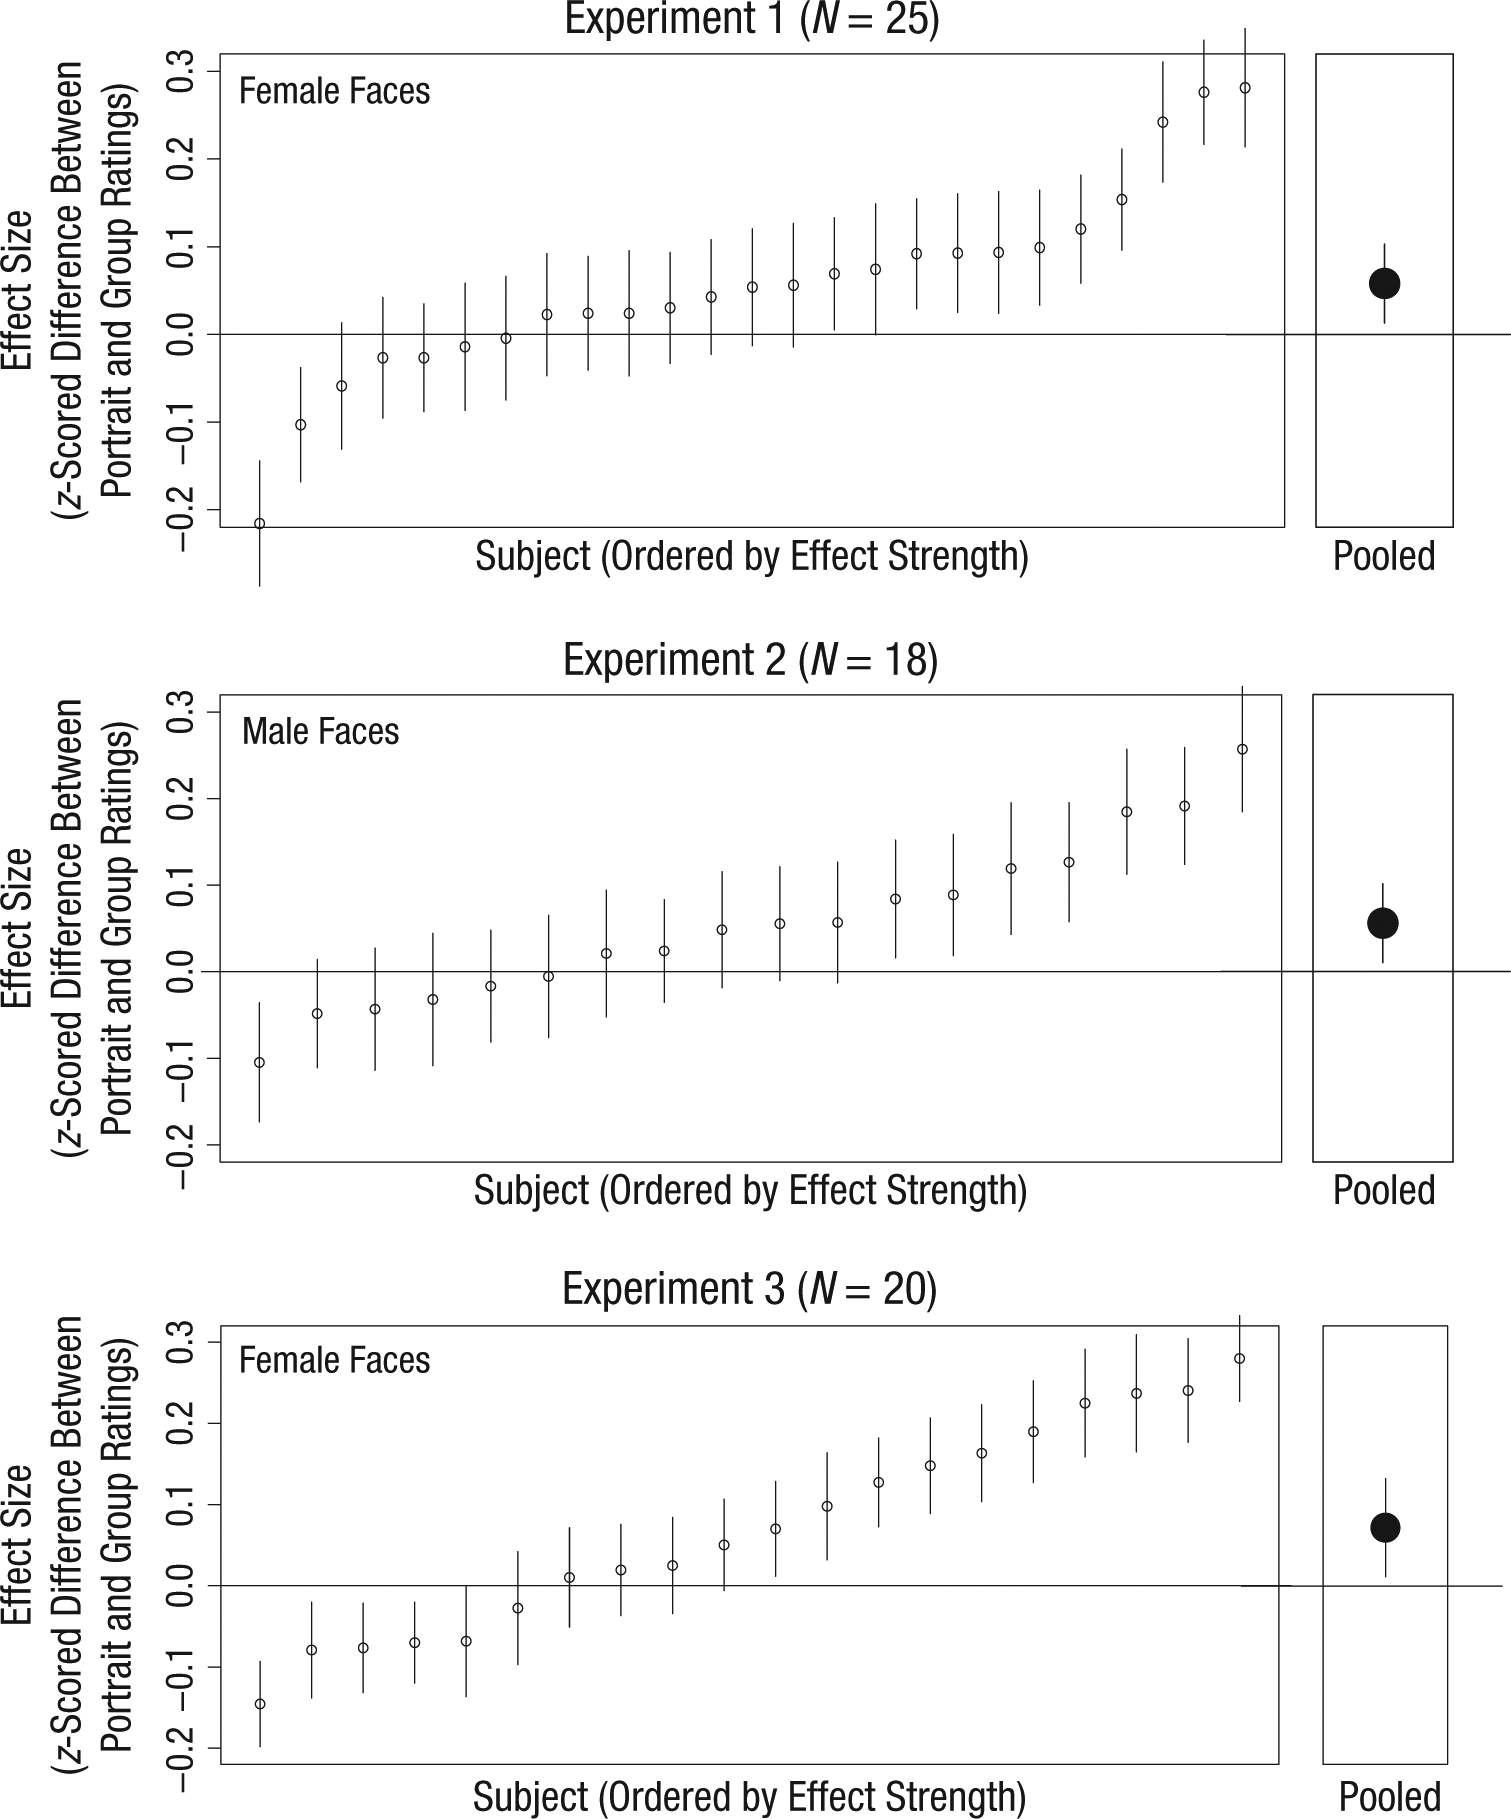
Results for Experiments 1, 2, and 3: standardized size of the cheerleader effect for ratings of faces, separately for individual subjects (left panels) and pooled across subjects (right panels). To calculate effect sizes, we converted the raw rating given by a subject for each image in each condition (group and portrait) into a within-subjects z score by subtracting the mean rating and dividing the result by the standard deviation of the 600 ratings made by the subject. For each subject, we then subtracted this z score for the faces in the portrait condition from the z score for the faces in the group condition. This difference yielded each subject’s effect size: the number of standard deviations higher that a given face was rated when seen in a group than when seen isolated in a portrait. Error bars for individual data show ±1 SEM, and error bars for pooled data show 95% confidence intervals.
Although there was considerable between-subjects variation in effect sizes, subjects on average rated female faces in a group as being 5.5% of a standard deviation more attractive than those same faces in isolation (Experiment 1), t(24) = 2.53, p = .018. This cheerleader effect also held (with surprising consistency in effect size) for male faces: There was an average advantage of 5.6% of a standard deviation for faces in a group (Experiment 2), t(17) = 2.52, p = .022.
Experiment 3
In Experiments 1 and 2, each face in the group condition was presented uncued three times for 1 s each (a total of 3 s) and presented cued for 1 s, which suggests that any one face was on average attended for 2 s total. Thus, average time spent attending to any one face in the group condition was equivalent to the 2-s presentation in the portrait condition. However, any one trial of the group condition consisted of an uncued group of three faces for 1 s, and a cued face for 1 s, which meant that 1.33 s was spent attending to that face. In this sense, the expected time spent attending to a face in one group trial was shorter than in a portrait trial. It is plausible that this difference drove the effect in Experiments 1 and 2 because faces shown for shorter durations are rated as more attractive than faces shown for longer durations (Willis & Todorov, 2006). Although Willis and Todorov found an advantage of shorter duration only for presentations briefer than 500 ms (and ours were all longer than 1 s), we wanted to replicate our results from Experiments 1 and 2 by equating the presentation time of one portrait trial to one presentation in the group trial. We did so in Experiment 3 by presenting the portrait images for just 1.33 s (otherwise, the design, stimuli, and method of data analysis were the same as in Experiment 1). With this modified timing, we replicated the cheerleader effect from Experiments 1 and 2: When the presentation duration of portrait images was shortened, faces were rated 6.8% of a standard deviation more attractive when presented in a group than when presented alone, t(19) = 2.50, p = .022 (Fig. 2).
Experiment 4
In Experiments 1 through 3, all of the faces had originally been photographed together in a real-life social context. Perhaps group images were rated as more attractive than single images not because of ensemble coding of the group but because the coherent context disambiguated facial expressions or other image idiosyncrasies (just as videos of an individual are rated as more flattering than the static photos that comprise them; Post, Haberman, Iwaki, & Whitney, 2012). In Experiment 4, we sought to rule out this class of explanations by presenting an array composed of multiple portrait faces that had been photographed separately. In addition to this control, we also tested for effects of group size: Increasing group size should yield a more precise average face that should not only be rated as more attractive (Langlois & Roggman, 1990) but should also exert a greater bias on the perceived attractiveness of individual faces (given a probabilistic combination of individuals and the ensemble; Brady & Alvarez, 2011).
Method
We randomly chose 77 unique faces from the stimuli used in Experiment 1. Each was presented once in each of four conditions: alone and as part of a group of 4, 9, and 16 other faces. The flanker faces in the group conditions were randomly chosen from the 223 remaining faces used in Experiment 1 (target faces were never used as flankers). Faces were presented in a square grid (1 × 1 for 1 face, 2 × 2 for 4 faces, 3 × 3 for 9, and 4 × 4 for 16; Fig. 3a). Each grid appeared for 2 s, and then a box appeared around the target face for 1 s. The faces then disappeared, and subjects made a rating as in the previous experiments. In the portrait condition, the face was presented alone in the center of the computer screen for 2 s before subjects made a rating.
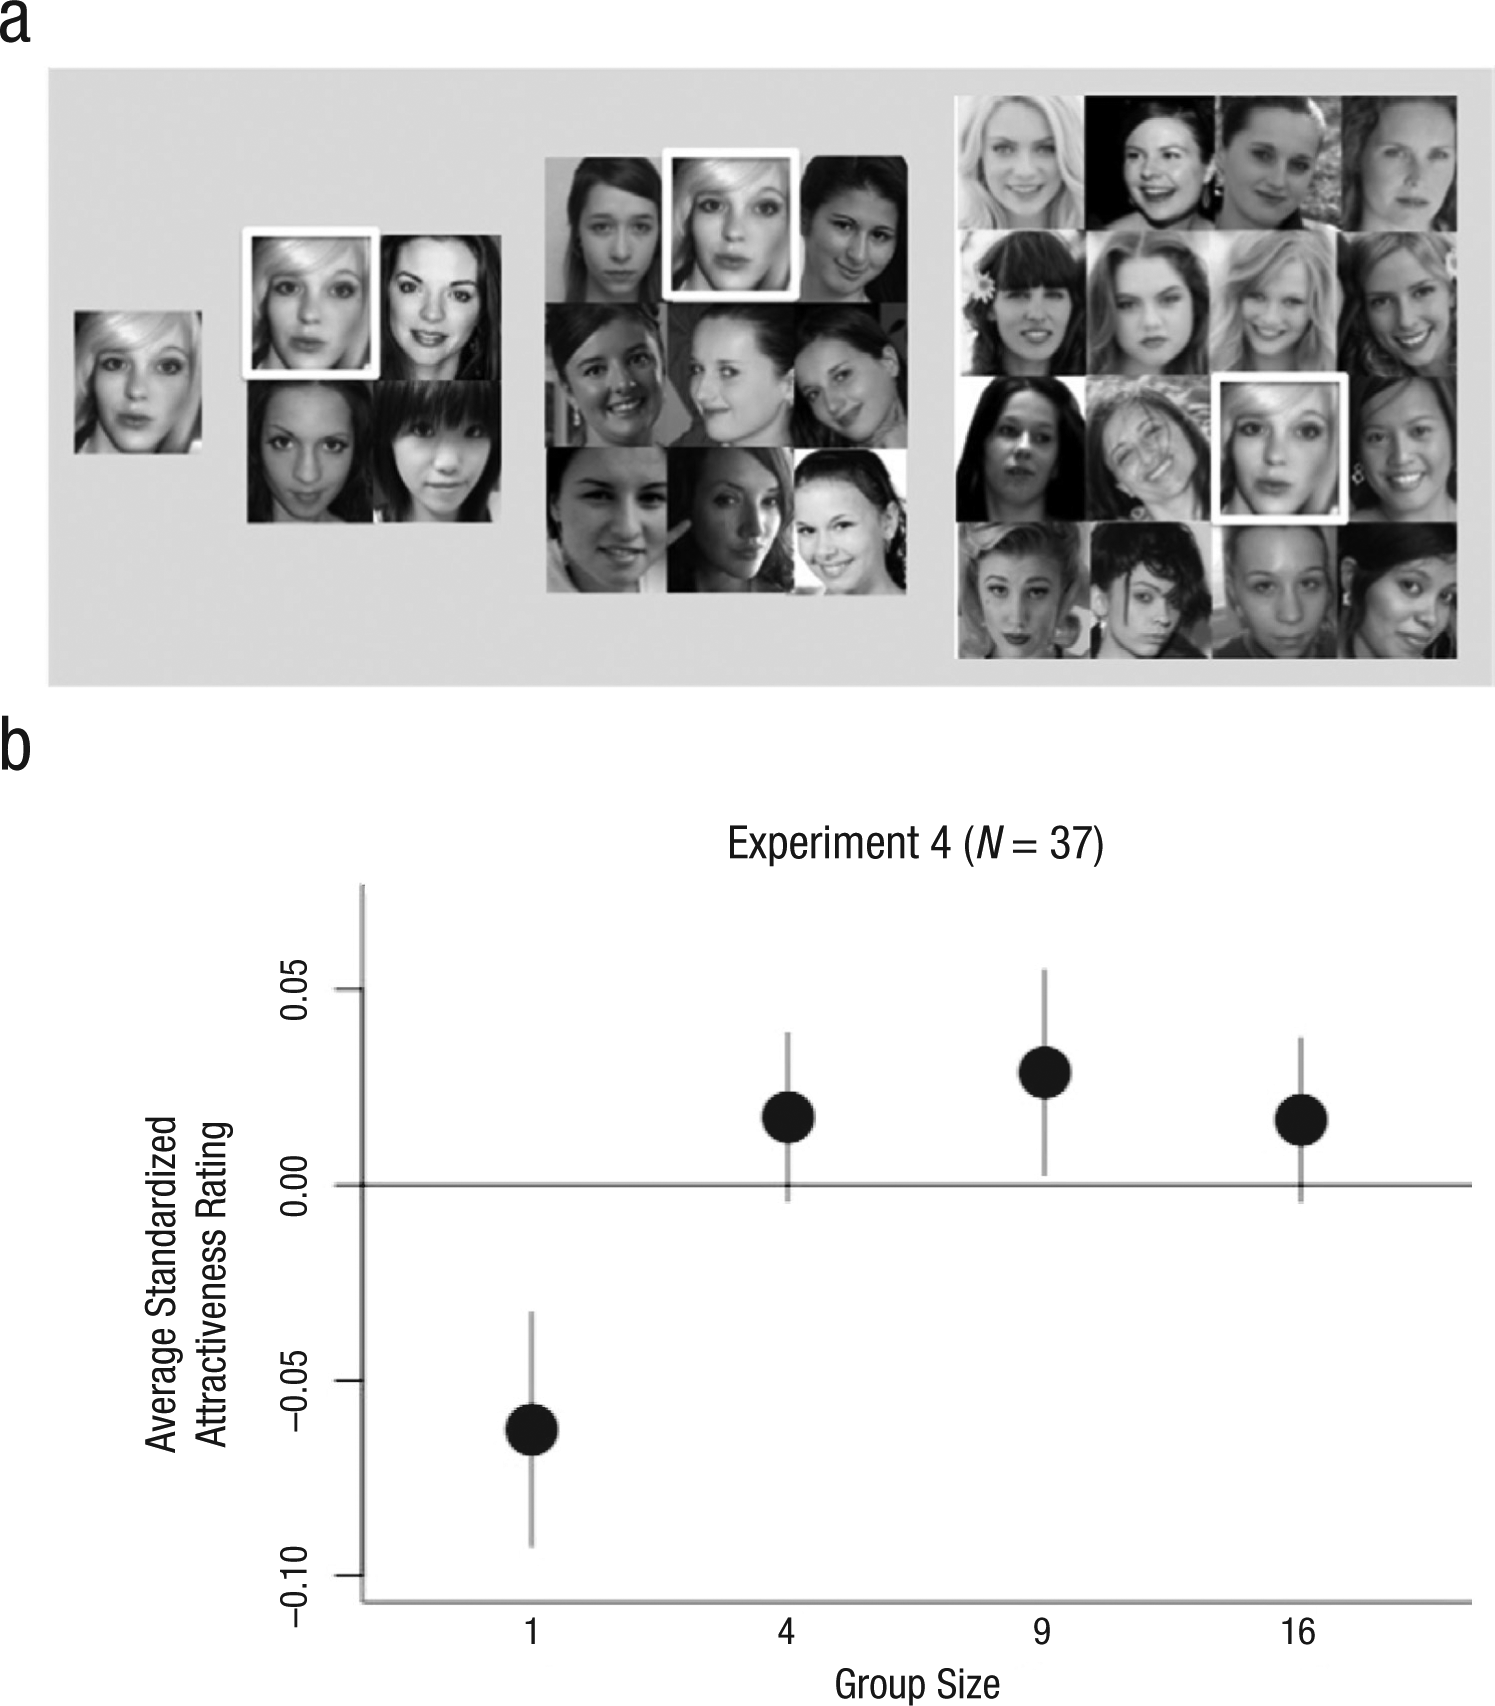
Example stimuli (a) and results (b) from Experiment 4. Subjects rated the attractiveness of 77 faces four times: alone and in a group of 4, 9, and 16 other faces. Each group appeared for 2 s, and then a box appeared around the target face for 1 s. In the portrait condition, the face was presented alone in the center of the computer screen for 2 s. The faces then disappeared, and subjects made a rating as in the previous experiments. Stimuli were presented in color in the actual experiment. The graph shows the average standardized attractiveness ratings for each group size. To calculate attractiveness ratings, we first obtained within-subjects z scores as in the previous experiments. For each subject, we then subtracted the average (across subjects and conditions) z score given to each face from each rating of that face. Error bars show 95% confidence intervals.
Results
As in the previous experiments, we z-scored ratings within a given subject to factor out between-subjects variation in scale usage. To factor out variability in the actual attractiveness of a given face, we subtracted the average (across subjects and conditions) standardized rating given to each face from each rating of that face. This gave us a measure of the effect of each presentation condition. Figure 3b shows the average standardized ratings in each condition across all subjects. There was a significant effect of group size on attractiveness ratings, F(3, 144) = 11.74, p < .001: Consistent with a cheerleader effect, results showed that faces were rated as less attractive when presented alone than when presented in a group of 4, t(36) = 3.23, a group of 9, t(36) = 4.25, or a group of 16, t(36) = 4.0. However, attractiveness ratings were not different for faces rated in groups of 4, 9, or 16. These results suggest that it is not the coherent context of group photos but rather the presence of additional faces that drives the cheerleader effect.
Experiment 5
The influence of group membership on individual members may be greater when there is more uncertainty about the individual elements in a scene; this is because the average is less sensitive to the increased uncertainty than the individual elements are. Following this logic, we blurred the faces in Experiment 5 to see whether the cheerleader effect would be increased when uncertainty was increased.
Method
We randomly selected 50 group images from those used in Experiment 1 and blurred them by convolving them with a Gaussian filter with a standard deviation of 4 pixels. Subjects rated the three faces in each of those 50 images (150 unique faces) four times each: in unblurred group and portrait conditions and in blurred group and portrait conditions (example stimuli are shown in Fig. 4a). Other than the addition of the blurring factor, methods were identical to those used in Experiment 1.
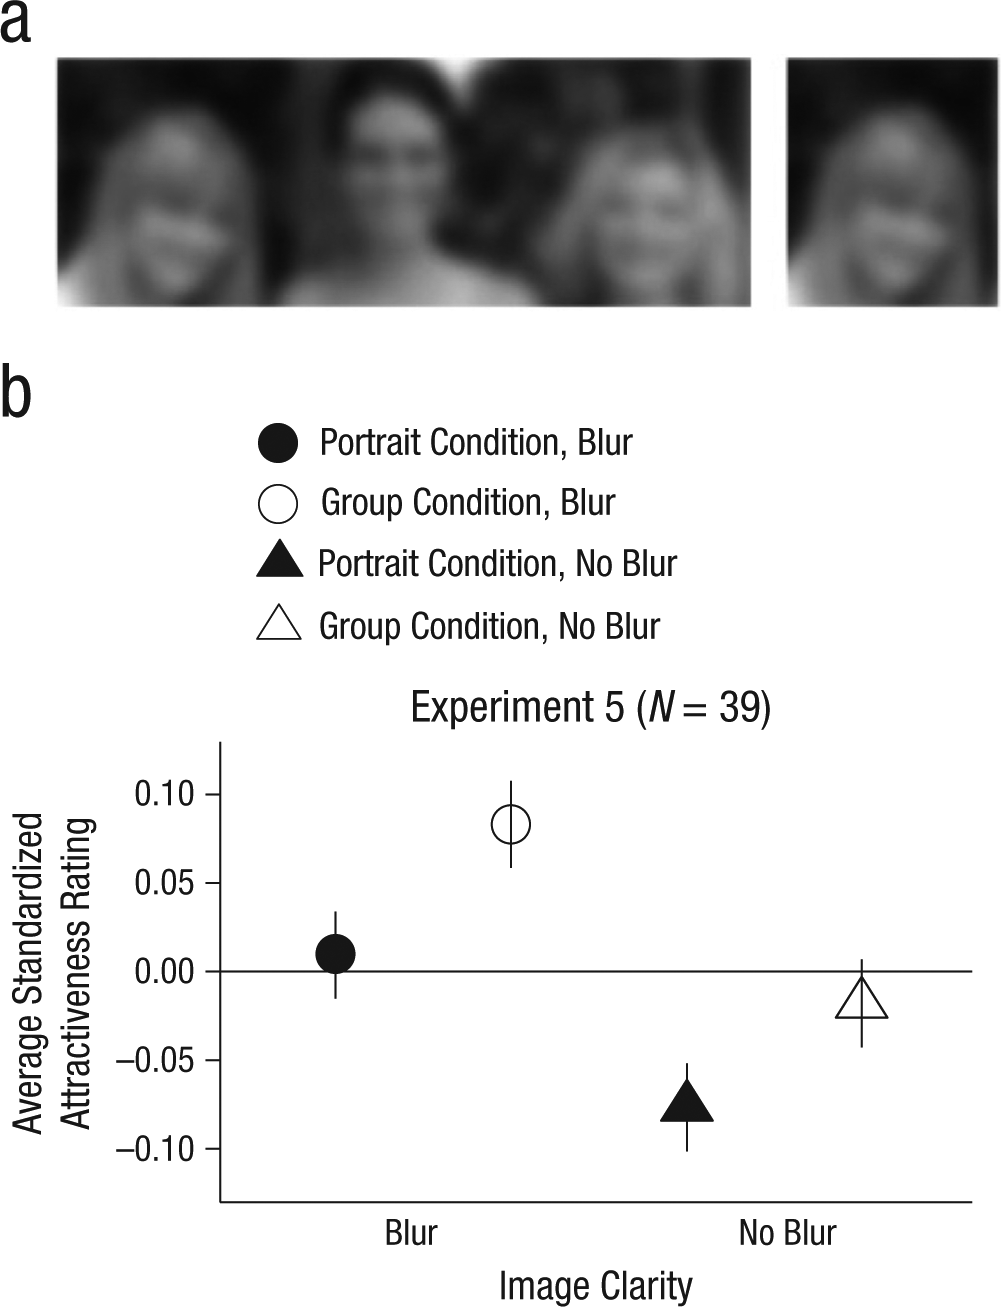
Example stimuli (a) and results (b) from Experiment 5. Subjects rated the attractiveness of 50 faces four times each: in blurred group and portrait conditions (shown here) and in unblurred group and portrait conditions. Stimuli were presented and ratings were made as in Experiment 1. Stimuli were presented in color in the actual experiment. The graph shows the average standardized attractiveness ratings as a function of image clarity and presentation condition (group or portrait). Attractiveness ratings were calculated as in Experiment 4. Error bars show 95% confidence intervals.
Results
As in Experiment 4, we isolated the effect of condition by z-scoring ratings within subjects and subtracting the across-subjects average ratings for each face. Figure 4b shows the average standardized ratings in each condition. As in our other experiments, faces were rated as more attractive when seen in groups than when seen alone, F(1, 152) = 9.0, p < .01, and subjects rated blurred images as more attractive than unblurred images, F(1, 152) = 17.91, p < .001. However, although the cheerleader effect was bigger in the blurred condition than in the unblurred condition (7.3% vs. 5.9% of a standard deviation), the interaction between image clarity and presentation condition was not significant F(1, 152) = 0.106, p = .75.
General Discussion
In the five experiments reported here, we found evidence consistent with the cheerleader effect: Both female faces (Experiment 1) and male faces (Experiment 2) in a group appeared more attractive than those same faces seen alone. 1 This effect seems robust to presentation timing (Experiment 3), to whether groups are created from natural photos or are synthetically created (Experiment 4), and to image manipulations such as blurring (Experiment 5). We propose that this effect arises from the fact that the visual system represents objects as an ensemble (Ariely, 2001), individual objects are biased toward the ensemble average (Brady & Alvarez, 2011), and average faces are perceived to be more attractive than faces in isolation (Langlois & Roggman, 1990). Together, these phenomena should cause faces in a group to appear more like the group average than when presented alone, and that group average should tend to be more attractive than the individual faces, on average. However, some of our results should give readers pause in accepting our interpretation: We predicted that increasing group size (Experiment 4) or decreasing image quality (Experiment 5) should increase the bias of individuals to the group average and would thus increase the cheerleader effect, but we found no evidence of these effects. Despite this caveat about our interpretation, the cheerleader effect was robust: Across a wide range of settings, people in groups were rated as more attractive than the same people alone. Thus, having a few wingmen—or wingwomen—may indeed be a good dating strategy, particularly if their facial features complement, and average out, one’s unattractive idiosyncrasies.
Footnotes
Declaration of Conflicting Interests
The authors declared that they had no conflicts of interest with respect to their authorship or the publication of this article.